1
Methods for Clinical Evaluation of Noise Reduction Techniques at Computed Tomography Eric C. Ehman MD, Lifeng Yu PhD, Armando Manduca PhD, Amy K. Hara MD, Maria Shiung PhD, Dayna Jondal, David Lake, Gene Padan, Dan Blezek PhD, Michael R. Bruesewitz RT, Cynthia H. McCollough PhD, David M. Hough MD and Joel G. Fletcher MD PURPOSE OVERVIEW TECHNIQUES IMAGE-SPACE DENOISING Projection Data Modified Data Image Final Image Projection- space denoising Analytical Reconstruction Image- space Denoising ITERATIVE RECONSTRUCTION SUMMARY OF TECHNIQUES 1.) To provide an overview of existing noise reduction strategies for low dose computed tomography (CT), including filtered back projection, image- space denoising, projection-space denoising, and iterative reconstruction. 2.) To review quantitative and qualitative tools and metrics for evaluating noise reduction methods. 3.) To highlight the strengths and limitations of individual noise reduction techniques using radiologist feedback and clinical examples. For a given diagnostic task and patient size, dose reduction is primarily limited by the image noise level and object detectability Data processing and image reconstruction methods may decrease image noise, improving image quality or allowing decrease in radiation dose. In addition to conventional reconstruction filters (kernels) applied during CT data reconstruction[1], three primary techniques have been developed for controlling noise in the final images. These include: Image-space denoising[2,3] Projection-space denoising[4-6] Iterative reconstruction[7-10] Figure 1. Projection- and image-space denoising applied during an analytical reconstruction. Image-space denoising (ISD) is widely available on commercial scanners as well as from 3rd party vendors. Linear or non-linear filters are directly applied to previously reconstructed images to remove noise. Non-linear filters are currently used to improve image quality, which facilitates radiation dose reduction[2,3]. A fundamental trade-off exists between image noise and low- contrast lesion detectability, which is the primary limit to clinical utility. New techniques that remove noise from projection domain data prior to image reconstruction are termed projection space denoising (PSD)[4-6,11]. These methods account for photon statistics in CT data and smooth the data by optimizing a likelihood function and using a statistical noise model[4,5]. One recent approach for PSD is based on bilateral filtering, which smooths projection space data using a weighted average, with weights based on spatial proximity and intensity of neighboring pixels, preserving important edge information[6]. Recent studies have shown the ability to reduce dose for abdominal and hepatic applications by imaging with lower kV CT and denoising the resulting data with projection-based denoising techniques to preserve diagnostic image quality and lesion conspicuity[12,13]. Traditionally used in positron emission tomography (PET) and single photon emission computed tomography (SPECT)[14-16], iterative reconstruction (IR) has recently been applied to X-ray CT[7,8,10]. Compared with filtered back projection (FBP) techniques, IR has advantages in more accurately modeling the system geometry and noise, incorporating physical effects such as beam spectrum, beam hardening effect, scatter and incomplete data sampling[10,17]. Therefore, IR algorithms are better able to reduce output image noise while improving spatial resolution[8,10] and reducing artifacts[9,10,18]. Iterative reconstruction has significant potential to decrease radiation dose because of these advantages, but potential for dose reduction while preserving diagnostic accuracy has yet to be defined for different diagnostic tasks[19,20,23,24]. IMAGE QUALITY METRICS CT Number & Noise level – Accuracy and uniformity, assessed by ACR phantom High Contrast Spatial Resolution (Figure 7) In-plane: Bar patterns – ACR phantom, MTF – Wire phantom Cross-plane: Slice thickness patterns – ACR phantom Slice sensitivity profile (SSP) – thin foil phantom Low Contrast Spatial Resolution (Figure 8) – low contrast ACR phantom Noise Power Spectrum (NPS) (Figure 9) – uniform phantom (30 cm water phantom); measures spatial frequency component of the noise. CLINICAL EXAMPLES As shown by phantoms, IR and non-linear denoising may maintain high- contrast resolution while simultaneously reducing image noise substantially. There is the potential for significant dose reduction for diagnostic tasks involving detection of high-contrast objects such as CT colonography, CT for renal calculus, and CT enterography for Crohn's disease. IR and non-linear noise reduction methods may sacrifice low-contrast resolution while reducing image noise. This may correspond with more modest dose reduction for diagnostic tasks involving detection and characterization of low-contrast lesions such as those encountered in liver/pancreas or neuro- CT. CONLUSION Summary Various noise reduction methods have a great potential for reducing CT dose and improving image quality in clinical practice. Each noise reduction strategy has inherent strengths that should be employed and potential weaknesses that should be understood. While dose reduction may be aggressive for high-contrast tasks, careful optimization is needed for low- contrast tasks to prevent loss of lesion detectability. REFERENCES 1. Kak AC, Slaney M. Principles of Computed Tomographic Imaging: SIAM, Philadelphia, PA, 1987 2. Bai M, Chen J, Raupach R, Suess C, Tao Y, Peng M. Effect of nonlinear three-dimensional optimized reconstruction algorithm filter on image quality and radiation dose: validation on phantoms. Med Phys 2009;36:95-97 3. Singh H, Kalra MK, Forsberg A, Shepard JO, Blake MA. Integration of 2D adaptive algorithms in routine clinical workflow for reducing CT radiation dose. In: 95th Scientific Assembly and Annual Meeting, Radiological Society of North America. Chicago, IL, 2009 4. Wang J, Li T, Lu H, Liang Z. Penalized weighted least-squares approach to sinogram noise reduction and image reconstruction for low-dose X-ray computed tomography. IEEE Trans Med Imaging 2006;25:1272-1283 5. La Rivière PJ, Bian J, Vargas PA. Penalized-likelihood sinogram restoration for computed tomography. IEEE Trans Med Imaging 2006;25:1022-1036 6. Manduca A, Yu L, Trzasko JD, et al. Projection space denoising with bilateral filtering and CT noise modeling for dose reduction in CT. Med Phys 2009;36:4911-4919 7. Lange K, Fessler JA. Globally convergent algorithms for maximum a posteriori transmission tomography. IEEE Trans Image Process 1995;4:1430- 1438 8. Nuyts J, De Man B, Dupont P, Defrise M, Suetens P, Mortelmans L. Iterative reconstruction for helical CT: a simulation study. Phys Med Biol 1998;43:729-737 9. Elbakri IA, Fessler JA. Statistical image reconstruction for polyenergetic X-ray computed tomography. IEEE T Med Imaging 2002;21:89-99 10. Thibault JB, Sauer KD, Bouman CA, Hsieh J. A three-dimensional statistical approach to improved image quality for multislice helical CT. Med Phys 2007;34:4526-4544 11. Hsieh J. Adaptive streak artifact reduction in computed tomography resulting from excessive x-ray photon noise. Med Phys 1998;25:2139-2147 12. Guimaraes LS, Fletcher JG, Yu L, et al. Feasibility of Dose Reduction Using Novel Denoising Techniques for Low kV (80 kV) CT Enterography: Optimization and Validation. Acad Radiol 2010 (Accepted) 13. Ehman EC, Guimaraes LS, Fidler JL, et al. Noise reduction to decrease radiation dose and improve conspicuity of hepatic lesions at contrast0enhanced 80-kV hepatic CT using projection space denoising. AJR Am J Roentgenol 2012;198:405-411 14. Shepp LA, Vardi Y. Maximum likelihood reconstruction for emission tomography. IEEE Trans Med Imaging 1982;1:113-122 15. Lange K, Carson R. EM reconstruction algorithms for emission and transmission tomography. J Comput Assist Tomogr 1984;8:306-316 16. Fessler JA. Penalized Weighted Least-Squares Image-Reconstruction for Positron Emission Tomography. IEEE T Med Imaging 1994;13:290-300 17. Whiting BR, Massoumzadeh P, Earl OA, O'Sullivan JA, Snyder DL, Williamson JF. Properties of preprocessed sinogram data in x-ray computed tomography. Med Phys 2006;33:3290-3303 18. Wang G, Snyder DL, O'Sullivan JA, Vannier MW. Iterative deblurring for CT metal artifact reduction. IEEE Trans Med Imaging 1996;15:657-664 19. Hara AK, Paden RG, Silva AC, Kujak JL, Lawder HJ, Pavlicek W. Iterative reconstruction technique for reducing body radiation dose at CT: feasibility study. AJR Am J Roentgenol 2009;193:764-771 20. Pickhardt PJ, Lubner MG, Kim DH, et al. Abdominal CT with model-based iterative reconstruction (MBIR): initial results of a prospective trial comparing ultralow-dose with standard-dose imaging. AJR Am J Roentgenol 2012;199:1-9 21. Yu, L., S. Leng, et al. (2012). Validation and Application of a Channelized Hotelling Observer to Evaluate Low-contrast Performance of an Iterative Reconstruction and a 3D Non-linear Denoising Method in CT. 98th Scientific Assembly and Annual Meeting of the Radiological Society of North America, Chicago, IL. 22. Prakash P, Kalra MK, Kambadakone AK, et al. Reducing abdominal CT radiation dose with adaptive statistical iterative reconstruction technique. Invest Radiol. 2010;45:202-10. 23. Baker M, Dong F, Primak A, et al. Contrast-to-Noise Ratio and Low-Contrast Object Resolution on Full- and Low-Dose MDCT: SAFIRE Versus Filtered Back Projection in a Low-Contrast Object Phantom and in the Liver. AJR Am J Roentgenol. 2012;199:8-18. 24. Kalra M, Woisetschlager M, Dahlstro N, et al. Radiation Dose Reduction With Sinogram Affirmed Iterative Reconstruction Technique for Abdominal Computed Tomography. J Comput Assist Tomogr 2012. 2012;36:339 - 346. 25. Singh S, Kalra MK, Hsieh J, et al. Abdominal CT: Comparison of Adaptive Statistical Iterative and Filtered Back Projection Reconstruction Techniques. Radiology. 2010;257:373-83. 26. Sagara Y, Hara AK, Pavlicek W, et al. Abdominal CT: comparison of low-dose CT with adaptive statistical iterative reconstruction and routine-dose CT with filtered back projection in 53 patients. AJR Am J Roentgenol. 2010;195:713-9. Figure 2. Two probable carcinoid liver metastases (arrows) at routine dose (A) and 50% dose (B). Three right images were reconstructed with different levels of denoising (C,D,E). Note that lesions become less conspicuous at high levels of denoising (D and E) and the images appear “cartoony.” Figure 3. CT obtained during portal phase demonstrating two hepatocellular carcinomas (arrows). The routine dose image is the sharpest. The denoised routine dose image has higher CNR of the lesions due to noise reduction, but there is loss of image sharpness along the liver-IVC border. Half-dose 80 kV image with denoising shows preserved HCC conspicuity with slight loss of image sharpness. (Reproduced with permission from Ehman et al. AJR Am J Roentgenol. 2012; 198:405[11].) Routine Dose Routine Dose Denoised Half Dose Denoised Figure 4. Images from low-dose CT enterography using a denoising method in projection space (left image) and Noise Map imaged-based denoising method (right image) at the same dose. Note blurring of the fat-wall interface of an ileal bowel loop (arrow) with the projection-based method. 1 mm 2 mm 5 Strengths of IR I40_1 I40_2 I40_3 I40_4 I40_5 Figure 5. Subtle carcinoid metastasis (arrows) on routine dose 2 mm image (top right). A 1-mm slice is used to emulate noisier low-dose data and demonstrate the effect of SAFIRE (sinogram-affirmed iterative reconstruction; Siemens Healthcare). Lesion conspicuity and image sharpness is preserved, but some “cartooniness” and loss of normal noise texture occurs at the highest setting. I40_3 reduces noise to the level in the original image. 2 mm Figure 6. Left renal caliceal tip stone seen using 2-mm standard dose (7.9 mGy, upper left), and with 2-mm lower dose (2.8 mGy, lower row). Note improved noise reduction and improved stone conspicuity with MBIR compared to FBP and ASIR. Top row shows 0.7 mm coronal image with more dramatic improvement. Image quality improvement with IR and other denoising techniques is generally best using thinner images. 7.9 mGy FBP 2.8 mGy FBP 2.8 mGy ASIR 2.8 mGy MBIR FBP MBIR Figure 7. Qualitative in-plane high contrast spatial resolution using the bar pattern in the ACR phantom (upper left). A quantitative descriptor of in-plane spatial resolution is the MTF (upper right). Slice sensitivity profile (bottom) is used to measure spatial resolution in the z-direction. Note preserved high contrast spatial resolution with SAFIRE despite reduction in image noise. 240 mAs 180 mAs 120 mAs I40-3 60 mAs 0 1 2 3 4 5 6 7 8 0 0.2 0.4 0.6 0.8 1 1.2 1.4 1.6 Spatial frequency (1/cm) NPS (HU 2 cm 3 ) B40 B30 B20 B10 I40-1 I40-3 I40-5 Noisemap Figure 9. Noise power spectrum (NPS) is a more complete descriptor of noise properties than noise level. With IR noise reduction, the peak frequency of image noise shifts to the left as the strength is increased and noise decreased, which may correspond to a small sacrifice in low-contrast spatial resolution change noise texture. ? Full Dose FBP 25% Dose FBP 10% Dose FBP 25% Dose Noise Map ? 10% Dose Noise Map ? 10% Dose SAFIRE 25% Dose SAFIRE Figure 10. Images of a colon cancer metastasis (arrows) in the medial segment of the liver at routine dose (CTDIvol = 10.4 mGy), and 25% and 10% dose using routine reconstruction kernel (top row). Compare with Noise Map and SAFIRE reconstructed images at 25% and 10% dose. Note that the lesion is visible using all methods down to the 25% dose level, but is not visible using any reconstruction method at the 10% dose level. Figure 11. Images from a contrast-enhanced CT colonography study. Higher dose image (left) demonstrates a 0.7 cm polyp (a tubular adenoma) in the descending colon. The polyp is also seen on lower dose prone and decubitus images with SAFIRE despite > 80% and > 93% dose reduction. This is possible because colonography is a high contrast diagnostic task (i.e., differentiating polyp from air or contrast). 20 mGy 3.52 mGy 1.39 mGy Although less pronounced than with image-space denoising, a drawback to projection-space denoising is potential loss of spatial resolution. Using these quality metrics, the trade-off between image noise and spatial resolution may be quantified for each reconstruction technique. NON-LINEARITY OF PSD AND IR If dose reduction is not carefully controlled, imaging findings may be lost from the reconstructed images[19]. Due to non-linearity of iterative reconstruction and most denoising methods, spatial resolution is contrast- and noise- dependent Iterative reconstruction and non-linear denoising methods can substantially reduce the noise without sacrificing high-contrast spatial resolution (in terms of MTF and SSP), however, there may be loss of low-contrast spatial resolution Because of the non-linear impact of denoising techniques on signal characteristics and spatial resolution, the effect of denoising on image texture and lesion conspicuity can differ between denoising methods and strengths. While these idiosyncratic effects can be troublesome to radiologists at first (like viewing images from another CT vendor or reconstructon kernel), they may or may not affect observer performance; familiarity with the techniques may lead to greater degrees of comfort. Figure 14. Figures from low-dose CT enterography in a large patient (CTDIvol ~ 4 mGy) show “pixelated” appearance to noise texture using a commercial iterative reconstruction system compared to an image-based denoising method. Effects of denoising methods on noise texture can be unpredictable and depend on dose level, strength of denoising, denoising method, and signal characteristics of the underlying organ. Full Dose 50% Dose Low Moderate High No Denoising A B C D E 5.0 mm SSP Profile 0 0.1 0.2 0.3 0.4 0.5 0.6 0.7 0.8 0.9 1 -6 -5 -4 -3 -2 -1 0 1 2 3 4 5 6 Slice Location (mm) Pixel Value (norm, bkgd subtracted) FWHM LHS FWHM RHS FWTM LHS FWTM RHS FWHM1Bar FWTM1Bar 5.0 B40 5.0 I40-1 5.0 I40-3 5.0 I40-5 CTDIvol = 22 mGy CTDIvol = 11 mGy CTDIvol = 5.5 mGy CTDIvol = 2.2 mGy Figure 12. Same patient as Figure 3 with carcinoid liver metastases. Top row shows images reconstructed with FBP and routine dose, 50% dose, 25% dose and 10%. Bottom row represents image-based Noise Map denoising at corresponding dose levels. Note that neither FBP or denoised images display both metastases below the 50% dose level. Figure 13. Comparison of Mayo Noise Map (left) and a commercial system (right). Note improved conspicuity to small metastasis (arrows) and hemangioma (circles) using Noise Map despite similar reductions in noise, but slightly decreased image sharpness and more coarse noise texture with the Noise Map method. Commercial Iterative Reconstruction System Noise Map Image-based Denoising Multiple institutions have shown that careful integration of noise reduction strategies in to clinical practice can have a substantial effect on lowering radiation dose[13,19,22,24-26]. In order to preserve the diagnostic benefit of CT (and ensure accuracy for detection and diagnosis), careful optimization is needed when adopting these methods. Specific attention must be paid to the diagnostic task required for each patient. Potential dose reduction using noise reduction methods is dependent on the lesion-to-background contrast and the anatomy of interest. High contrast tasks such as CT colonography, renal stone detection, and CT enterography will permit large reductions in radiation dose. Low contrast tasks such as liver metastasis detection will permit smaller reductions in radiation dose. Methods to quantitate contrast- dependent spatial resolution, observer performance studies for a variety of diagnostic tasks (and tools to facilitate their rapid completion), and methods to predict the lowest dose to achieve adequate performance for specific CT systems are needed. The full impact of noise reduction techniques on radiation dose and radiologist performance is in the early phases of realization, with great potential to benefit patients by decreasing the radiation dose received while undergoing CT studies. CT Raw Data Descriptions Example methods Advantages Disadvantages TraditionalFBP-based methods Weighted3D FBP, AMBP Fast; Directly available on scanners Treats every ray the same, sub-optimal dose efficiency Image-space denoising SafeCT, SharpView, Noisemap NLM Fast; Only needs reconstructed images, cross scanner platform Does not take into account system physics; No capability to reduce artifacts Projection-space denoising Adaptive filtering or iterative denoising in projection data. *ASIR, ADIR, iDose might belong to this category, but no technique detail has been published. Fast; Mayincorporate complex system physics models Potential to lose spatial resolution if not designed well Full iterativereconstruction MBIR Incorporates systemmodel (both photon statistics and detailed geometry); has the potential to reduce both noise and artifacts Slow; May change the noise texture of CT images Hybrid iterative reconstruction SAFIRE Noise reduction in image- space (for speed), artifact reduction in projection- space (for image quality) May change the noise texture of CT images PROJECTION-SPACE DENOISING Routine Kernels Iterative Reconstruction Figure 8. ACR low contrast phantom scanned at multiple dose levels shows that iterative reconstruction lowers noise level at all tube currents, but that small low contrast rods (circled on 240 mAs images) are difficult to detect at 120 and 60 mAs.

Methods for Clinical Evaluation of Noise Reduction

  • Upload
    others

  • View
    3

  • Download
    0

Embed Size (px)

Citation preview

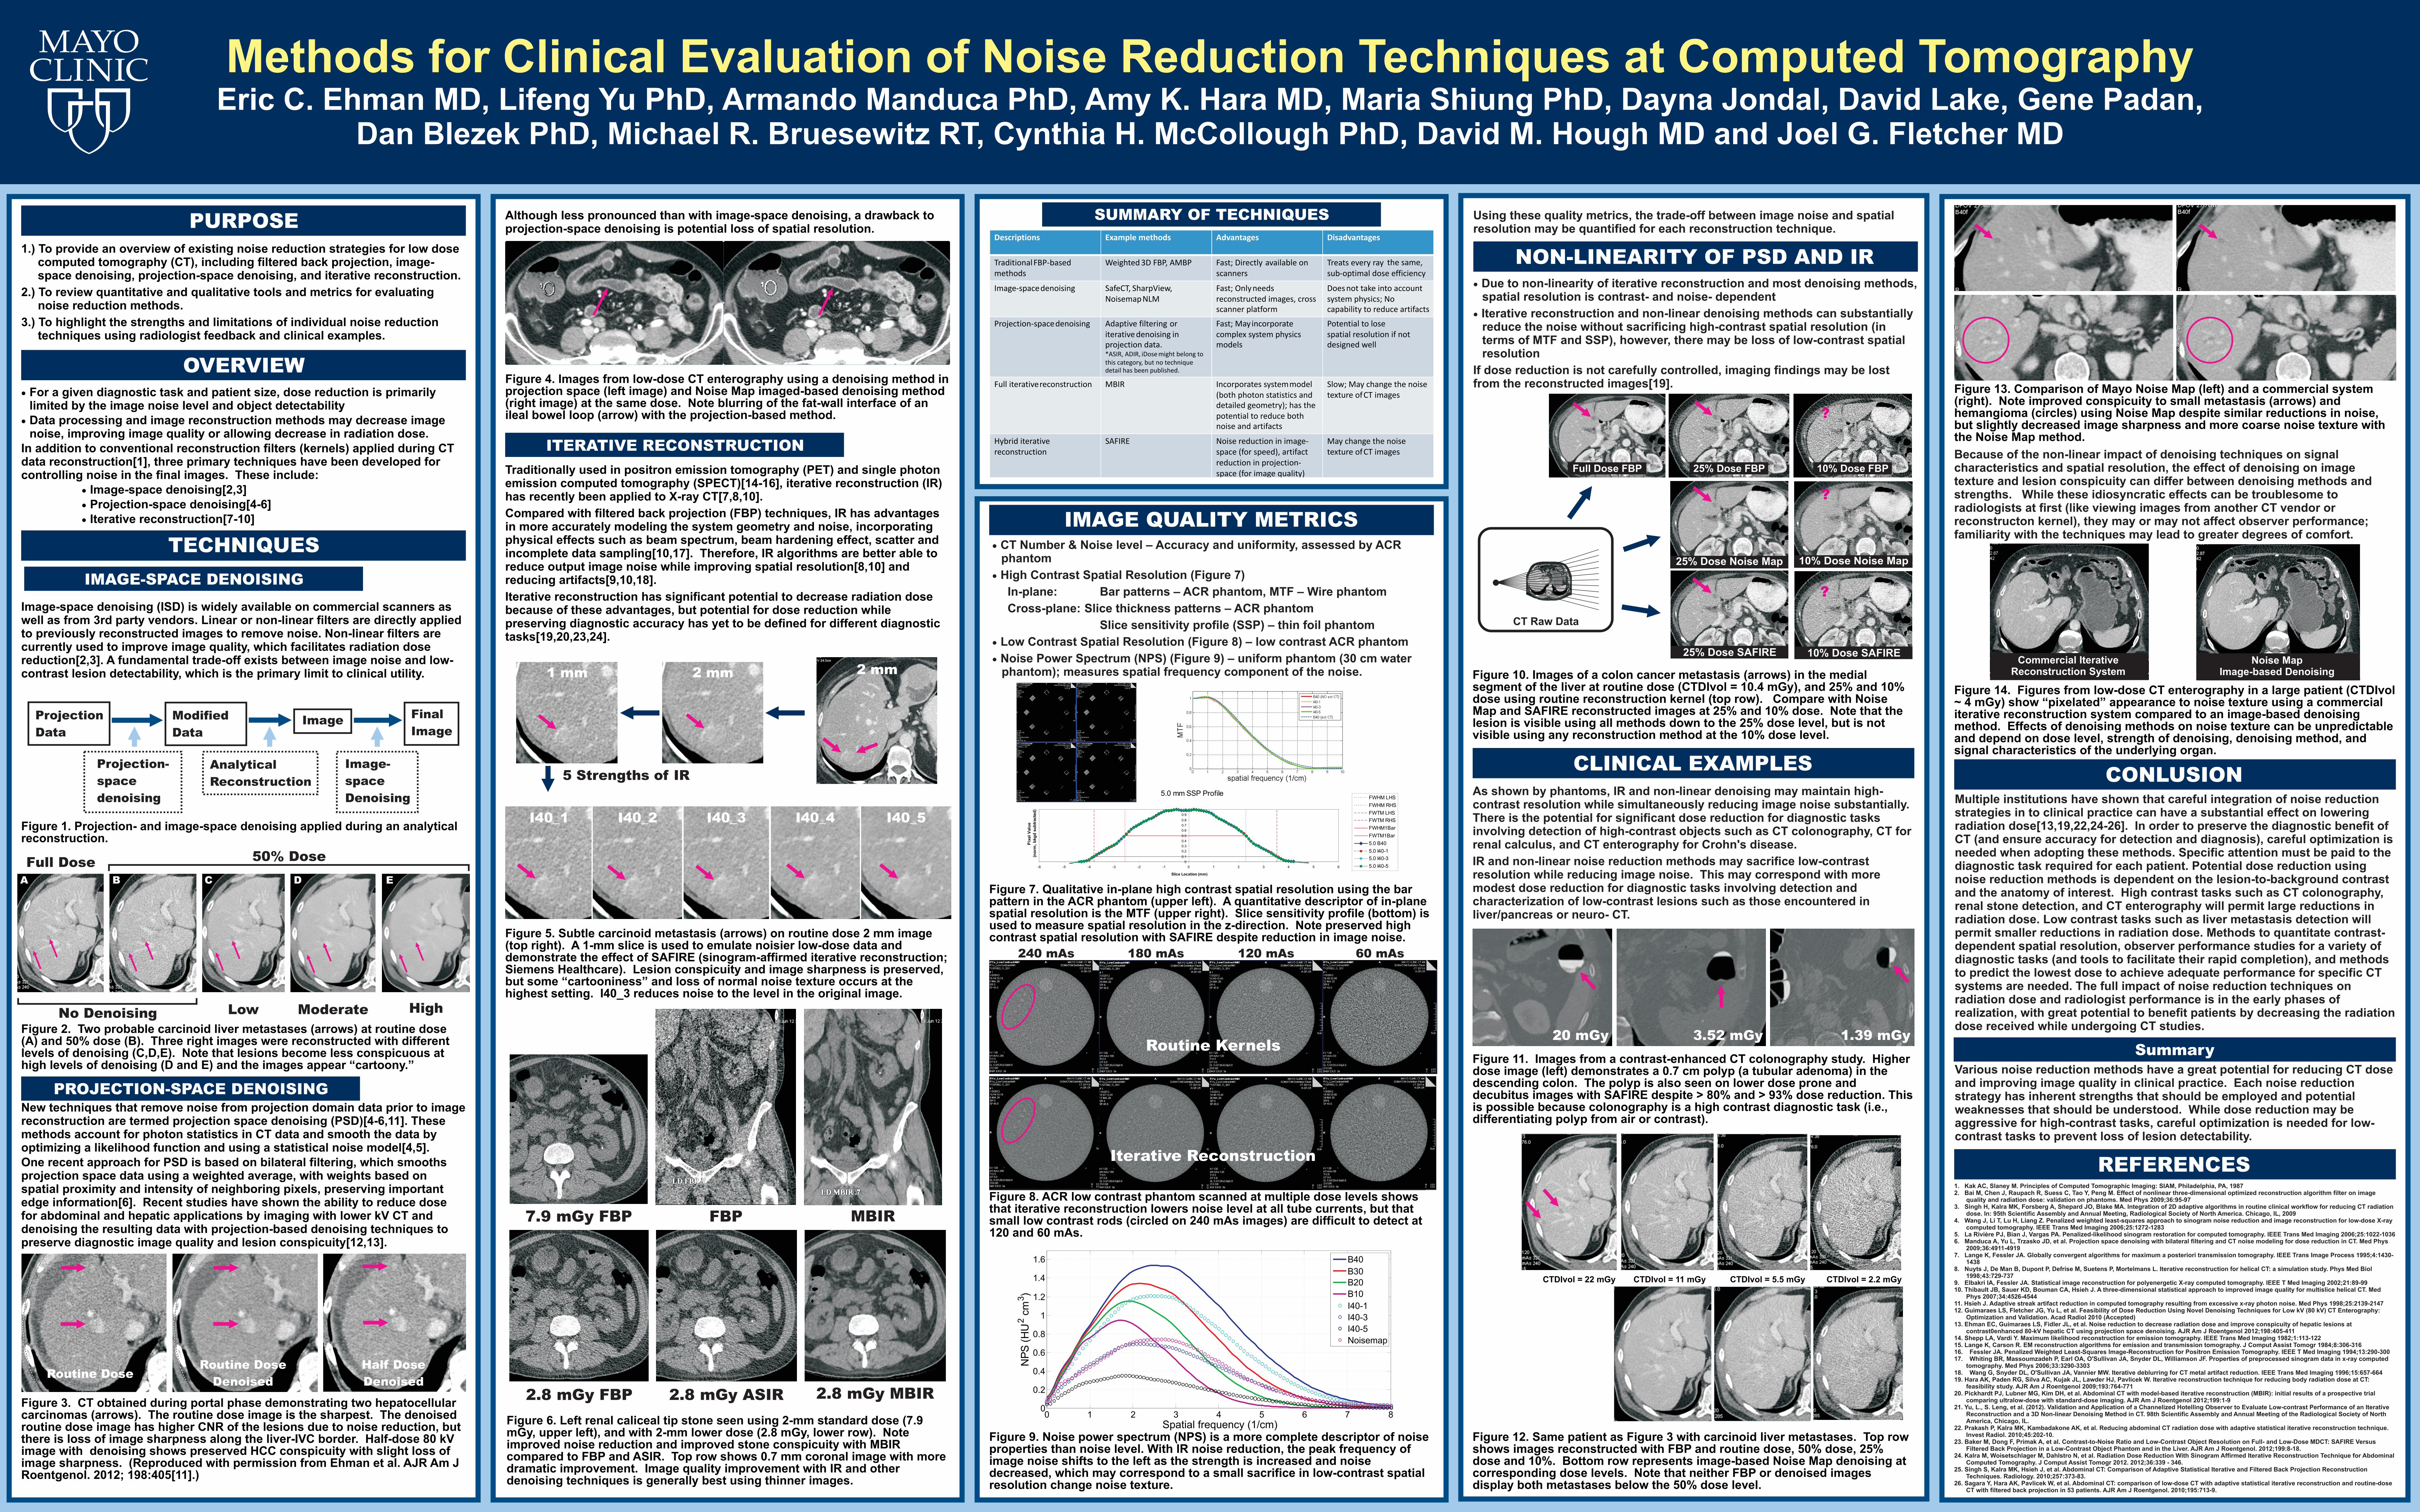
Methods for Clinical Evaluation of Noise Reduction Techniques at Computed TomographyEric C. Ehman MD, Lifeng Yu PhD, Armando Manduca PhD, Amy K. Hara MD, Maria Shiung PhD, Dayna Jondal, David Lake, Gene Padan,

Dan Blezek PhD, Michael R. Bruesewitz RT, Cynthia H. McCollough PhD, David M. Hough MD and Joel G. Fletcher MD

PURPOSE

OVERVIEW

TECHNIQUES

IMAGE-SPACE DENOISING

Projection

Data

Modified

DataImage

Final

Image

Projection-

space

denoising

Analytical

Reconstruction

Image-

space

Denoising

ITERATIVE RECONSTRUCTION

SUMMARY OF TECHNIQUES

1.) To provide an overview of existing noise reduction strategies for low dose computed tomography (CT), including filtered back projection, image-space denoising, projection-space denoising, and iterative reconstruction.

2.) To review quantitative and qualitative tools and metrics for evaluating noise reduction methods.

3.) To highlight the strengths and limitations of individual noise reduction techniques using radiologist feedback and clinical examples.

·For a given diagnostic task and patient size, dose reduction is primarily limited by the image noise level and object detectability

·Data processing and image reconstruction methods may decrease image noise, improving image quality or allowing decrease in radiation dose.

In addition to conventional reconstruction filters (kernels) applied during CT data reconstruction[1], three primary techniques have been developed for controlling noise in the final images. These include:

·Image-space denoising[2,3]·Projection-space denoising[4-6]·Iterative reconstruction[7-10]

Figure 1. Projection- and image-space denoising applied during an analytical reconstruction.

Image-space denoising (ISD) is widely available on commercial scanners as well as from 3rd party vendors. Linear or non-linear filters are directly applied to previously reconstructed images to remove noise. Non-linear filters are currently used to improve image quality, which facilitates radiation dose reduction[2,3]. A fundamental trade-off exists between image noise and low-contrast lesion detectability, which is the primary limit to clinical utility.

New techniques that remove noise from projection domain data prior to image reconstruction are termed projection space denoising (PSD)[4-6,11]. These methods account for photon statistics in CT data and smooth the data by optimizing a likelihood function and using a statistical noise model[4,5].One recent approach for PSD is based on bilateral filtering, which smooths projection space data using a weighted average, with weights based on spatial proximity and intensity of neighboring pixels, preserving important edge information[6]. Recent studies have shown the ability to reduce dose for abdominal and hepatic applications by imaging with lower kV CT and denoising the resulting data with projection-based denoising techniques to preserve diagnostic image quality and lesion conspicuity[12,13].

Traditionally used in positron emission tomography (PET) and single photon emission computed tomography (SPECT)[14-16], iterative reconstruction (IR) has recently been applied to X-ray CT[7,8,10].

Compared with filtered back projection (FBP) techniques, IR has advantages in more accurately modeling the system geometry and noise, incorporating physical effects such as beam spectrum, beam hardening effect, scatter and incomplete data sampling[10,17]. Therefore, IR algorithms are better able to reduce output image noise while improving spatial resolution[8,10] and reducing artifacts[9,10,18].

Iterative reconstruction has significant potential to decrease radiation dose because of these advantages, but potential for dose reduction while preserving diagnostic accuracy has yet to be defined for different diagnostic tasks[19,20,23,24].

IMAGE QUALITY METRICS·CT Number & Noise level – Accuracy and uniformity, assessed by ACR

phantom

·High Contrast Spatial Resolution (Figure 7)

In-plane: Bar patterns – ACR phantom, MTF – Wire phantom

Cross-plane: Slice thickness patterns – ACR phantom

Slice sensitivity profile (SSP) – thin foil phantom

·Low Contrast Spatial Resolution (Figure 8) – low contrast ACR phantom

·Noise Power Spectrum (NPS) (Figure 9) – uniform phantom (30 cm water phantom); measures spatial frequency component of the noise.

CLINICAL EXAMPLESAs shown by phantoms, IR and non-linear denoising may maintain high-contrast resolution while simultaneously reducing image noise substantially. There is the potential for significant dose reduction for diagnostic tasks involving detection of high-contrast objects such as CT colonography, CT for renal calculus, and CT enterography for Crohn's disease.

IR and non-linear noise reduction methods may sacrifice low-contrast resolution while reducing image noise. This may correspond with more modest dose reduction for diagnostic tasks involving detection and characterization of low-contrast lesions such as those encountered in liver/pancreas or neuro- CT.

CONLUSION

SummaryVarious noise reduction methods have a great potential for reducing CT dose and improving image quality in clinical practice. Each noise reduction strategy has inherent strengths that should be employed and potential weaknesses that should be understood. While dose reduction may be aggressive for high-contrast tasks, careful optimization is needed for low-contrast tasks to prevent loss of lesion detectability.

REFERENCES1. Kak AC, Slaney M. Principles of Computed Tomographic Imaging: SIAM, Philadelphia, PA, 19872. Bai M, Chen J, Raupach R, Suess C, Tao Y, Peng M. Effect of nonlinear three-dimensional optimized reconstruction algorithm filter on image

quality and radiation dose: validation on phantoms. Med Phys 2009;36:95-973. Singh H, Kalra MK, Forsberg A, Shepard JO, Blake MA. Integration of 2D adaptive algorithms in routine clinical workflow for reducing CT radiation

dose. In: 95th Scientific Assembly and Annual Meeting, Radiological Society of North America. Chicago, IL, 20094. Wang J, Li T, Lu H, Liang Z. Penalized weighted least-squares approach to sinogram noise reduction and image reconstruction for low-dose X-ray

computed tomography. IEEE Trans Med Imaging 2006;25:1272-12835. La Rivière PJ, Bian J, Vargas PA. Penalized-likelihood sinogram restoration for computed tomography. IEEE Trans Med Imaging 2006;25:1022-10366. Manduca A, Yu L, Trzasko JD, et al. Projection space denoising with bilateral filtering and CT noise modeling for dose reduction in CT. Med Phys

2009;36:4911-49197. Lange K, Fessler JA. Globally convergent algorithms for maximum a posteriori transmission tomography. IEEE Trans Image Process 1995;4:1430-

14388. Nuyts J, De Man B, Dupont P, Defrise M, Suetens P, Mortelmans L. Iterative reconstruction for helical CT: a simulation study. Phys Med Biol

1998;43:729-7379. Elbakri IA, Fessler JA. Statistical image reconstruction for polyenergetic X-ray computed tomography. IEEE T Med Imaging 2002;21:89-9910. Thibault JB, Sauer KD, Bouman CA, Hsieh J. A three-dimensional statistical approach to improved image quality for multislice helical CT. Med

Phys 2007;34:4526-454411. Hsieh J. Adaptive streak artifact reduction in computed tomography resulting from excessive x-ray photon noise. Med Phys 1998;25:2139-214712. Guimaraes LS, Fletcher JG, Yu L, et al. Feasibility of Dose Reduction Using Novel Denoising Techniques for Low kV (80 kV) CT Enterography:

Optimization and Validation. Acad Radiol 2010 (Accepted)13. Ehman EC, Guimaraes LS, Fidler JL, et al. Noise reduction to decrease radiation dose and improve conspicuity of hepatic lesions at

contrast0enhanced 80-kV hepatic CT using projection space denoising. AJR Am J Roentgenol 2012;198:405-41114. Shepp LA, Vardi Y. Maximum likelihood reconstruction for emission tomography. IEEE Trans Med Imaging 1982;1:113-12215. Lange K, Carson R. EM reconstruction algorithms for emission and transmission tomography. J Comput Assist Tomogr 1984;8:306-31616. Fessler JA. Penalized Weighted Least-Squares Image-Reconstruction for Positron Emission Tomography. IEEE T Med Imaging 1994;13:290-30017. Whiting BR, Massoumzadeh P, Earl OA, O'Sullivan JA, Snyder DL, Williamson JF. Properties of preprocessed sinogram data in x-ray computed

tomography. Med Phys 2006;33:3290-330318. Wang G, Snyder DL, O'Sullivan JA, Vannier MW. Iterative deblurring for CT metal artifact reduction. IEEE Trans Med Imaging 1996;15:657-66419. Hara AK, Paden RG, Silva AC, Kujak JL, Lawder HJ, Pavlicek W. Iterative reconstruction technique for reducing body radiation dose at CT:

feasibility study. AJR Am J Roentgenol 2009;193:764-77120. Pickhardt PJ, Lubner MG, Kim DH, et al. Abdominal CT with model-based iterative reconstruction (MBIR): initial results of a prospective trial

comparing ultralow-dose with standard-dose imaging. AJR Am J Roentgenol 2012;199:1-921. Yu, L., S. Leng, et al. (2012). Validation and Application of a Channelized Hotelling Observer to Evaluate Low-contrast Performance of an Iterative

Reconstruction and a 3D Non-linear Denoising Method in CT. 98th Scientific Assembly and Annual Meeting of the Radiological Society of North America, Chicago, IL.

22. Prakash P, Kalra MK, Kambadakone AK, et al. Reducing abdominal CT radiation dose with adaptive statistical iterative reconstruction technique. Invest Radiol. 2010;45:202-10.

23. Baker M, Dong F, Primak A, et al. Contrast-to-Noise Ratio and Low-Contrast Object Resolution on Full- and Low-Dose MDCT: SAFIRE Versus Filtered Back Projection in a Low-Contrast Object Phantom and in the Liver. AJR Am J Roentgenol. 2012;199:8-18.

24. Kalra M, Woisetschlager M, Dahlstro N, et al. Radiation Dose Reduction With Sinogram Affirmed Iterative Reconstruction Technique for Abdominal Computed Tomography. J Comput Assist Tomogr 2012. 2012;36:339 - 346.

25. Singh S, Kalra MK, Hsieh J, et al. Abdominal CT: Comparison of Adaptive Statistical Iterative and Filtered Back Projection Reconstruction Techniques. Radiology. 2010;257:373-83.

26. Sagara Y, Hara AK, Pavlicek W, et al. Abdominal CT: comparison of low-dose CT with adaptive statistical iterative reconstruction and routine-dose CT with filtered back projection in 53 patients. AJR Am J Roentgenol. 2010;195:713-9.

Figure 2. Two probable carcinoid liver metastases (arrows) at routine dose (A) and 50% dose (B). Three right images were reconstructed with different levels of denoising (C,D,E). Note that lesions become less conspicuous at high levels of denoising (D and E) and the images appear “cartoony.”

Figure 3. CT obtained during portal phase demonstrating two hepatocellular carcinomas (arrows). The routine dose image is the sharpest. The denoised routine dose image has higher CNR of the lesions due to noise reduction, but there is loss of image sharpness along the liver-IVC border. Half-dose 80 kV image with denoising shows preserved HCC conspicuity with slight loss of image sharpness. (Reproduced with permission from Ehman et al. AJR Am J Roentgenol. 2012; 198:405[11].)

Routine DoseRoutine Dose

Denoised

Half Dose

Denoised

Figure 4. Images from low-dose CT enterography using a denoising method in projection space (left image) and Noise Map imaged-based denoising method (right image) at the same dose. Note blurring of the fat-wall interface of an ileal bowel loop (arrow) with the projection-based method.

1 mm 2 mm

5 Strengths of IR

I40_1 I40_2 I40_3 I40_4 I40_5

Figure 5. Subtle carcinoid metastasis (arrows) on routine dose 2 mm image (top right). A 1-mm slice is used to emulate noisier low-dose data and demonstrate the effect of SAFIRE (sinogram-affirmed iterative reconstruction; Siemens Healthcare). Lesion conspicuity and image sharpness is preserved, but some “cartooniness” and loss of normal noise texture occurs at the highest setting. I40_3 reduces noise to the level in the original image.

2 mm

Figure 6. Left renal caliceal tip stone seen using 2-mm standard dose (7.9 mGy, upper left), and with 2-mm lower dose (2.8 mGy, lower row). Note improved noise reduction and improved stone conspicuity with MBIR compared to FBP and ASIR. Top row shows 0.7 mm coronal image with more dramatic improvement. Image quality improvement with IR and other denoising techniques is generally best using thinner images.

7.9 mGy FBP

2.8 mGy FBP 2.8 mGy ASIR 2.8 mGy MBIR

FBP MBIR

Figure 7. Qualitative in-plane high contrast spatial resolution using the bar pattern in the ACR phantom (upper left). A quantitative descriptor of in-plane spatial resolution is the MTF (upper right). Slice sensitivity profile (bottom) is used to measure spatial resolution in the z-direction. Note preserved high contrast spatial resolution with SAFIRE despite reduction in image noise.

240 mAs 180 mAs 120 mAs

I40-3

60 mAs

0 1 2 3 4 5 6 7 80

0.2

0.4

0.6

0.8

1

1.2

1.4

1.6

Spatial frequency (1/cm)

NP

S(H

U2

cm3)

B40

B30

B20

B10

I40-1

I40-3

I40-5

Noisemap

Figure 9. Noise power spectrum (NPS) is a more complete descriptor of noise properties than noise level. With IR noise reduction, the peak frequency of image noise shifts to the left as the strength is increased and noise decreased, which may correspond to a small sacrifice in low-contrast spatial resolution change noise texture.

?

Full Dose FBP 25% Dose FBP 10% Dose FBP

25% Dose Noise Map

?

10% Dose Noise Map

?

10% Dose SAFIRE25% Dose SAFIRE

Figure 10. Images of a colon cancer metastasis (arrows) in the medial segment of the liver at routine dose (CTDIvol = 10.4 mGy), and 25% and 10% dose using routine reconstruction kernel (top row). Compare with Noise Map and SAFIRE reconstructed images at 25% and 10% dose. Note that the lesion is visible using all methods down to the 25% dose level, but is not visible using any reconstruction method at the 10% dose level.

Figure 11. Images from a contrast-enhanced CT colonography study. Higher dose image (left) demonstrates a 0.7 cm polyp (a tubular adenoma) in the descending colon. The polyp is also seen on lower dose prone and decubitus images with SAFIRE despite > 80% and > 93% dose reduction. This is possible because colonography is a high contrast diagnostic task (i.e., differentiating polyp from air or contrast).

20 mGy 3.52 mGy 1.39 mGy

Although less pronounced than with image-space denoising, a drawback to projection-space denoising is potential loss of spatial resolution.

Using these quality metrics, the trade-off between image noise and spatial resolution may be quantified for each reconstruction technique.

NON-LINEARITY OF PSD AND IR·

·

If dose reduction is not carefully controlled, imaging findings may be lost from the reconstructed images[19].

Due to non-linearity of iterative reconstruction and most denoising methods, spatial resolution is contrast- and noise- dependent

Iterative reconstruction and non-linear denoising methods can substantially reduce the noise without sacrificing high-contrast spatial resolution (in terms of MTF and SSP), however, there may be loss of low-contrast spatial resolution

Because of the non-linear impact of denoising techniques on signal characteristics and spatial resolution, the effect of denoising on image texture and lesion conspicuity can differ between denoising methods and strengths. While these idiosyncratic effects can be troublesome to radiologists at first (like viewing images from another CT vendor or reconstructon kernel), they may or may not affect observer performance; familiarity with the techniques may lead to greater degrees of comfort.

Figure 14. Figures from low-dose CT enterography in a large patient (CTDIvol ~ 4 mGy) show “pixelated” appearance to noise texture using a commercial iterative reconstruction system compared to an image-based denoising method. Effects of denoising methods on noise texture can be unpredictable and depend on dose level, strength of denoising, denoising method, and signal characteristics of the underlying organ.

Full Dose 50% Dose

Low Moderate HighNo Denoising

A B C D E

5.0 mm SSP Profile

0

0.1

0.2

0.3

0.4

0.5

0.6

0.7

0.8

0.9

1

-6 -5 -4 -3 -2 -1 0 1 2 3 4 5 6

Slice Location (mm)

Pix

el

Valu

e

(no

rm,

bkg

dsu

btr

acte

d)

FWHM LHS

FWHM RHS

FWTM LHS

FWTM RHS

FWHM1Bar

FWTM1Bar

5.0 B40

5.0 I40-1

5.0 I40-3

5.0 I40-5

CTDIvol = 22 mGy CTDIvol = 11 mGy CTDIvol = 5.5 mGy CTDIvol = 2.2 mGy

Figure 12. Same patient as Figure 3 with carcinoid liver metastases. Top row shows images reconstructed with FBP and routine dose, 50% dose, 25% dose and 10%. Bottom row represents image-based Noise Map denoising at corresponding dose levels. Note that neither FBP or denoised images display both metastases below the 50% dose level.

Figure 13. Comparison of Mayo Noise Map (left) and a commercial system (right). Note improved conspicuity to small metastasis (arrows) and hemangioma (circles) using Noise Map despite similar reductions in noise, but slightly decreased image sharpness and more coarse noise texture with the Noise Map method.

Commercial IterativeReconstruction System

Noise Map Image-based Denoising

Multiple institutions have shown that careful integration of noise reduction strategies in to clinical practice can have a substantial effect on lowering radiation dose[13,19,22,24-26]. In order to preserve the diagnostic benefit of CT (and ensure accuracy for detection and diagnosis), careful optimization is needed when adopting these methods. Specific attention must be paid to the diagnostic task required for each patient. Potential dose reduction using noise reduction methods is dependent on the lesion-to-background contrast and the anatomy of interest. High contrast tasks such as CT colonography, renal stone detection, and CT enterography will permit large reductions in radiation dose. Low contrast tasks such as liver metastasis detection will permit smaller reductions in radiation dose. Methods to quantitate contrast-dependent spatial resolution, observer performance studies for a variety of diagnostic tasks (and tools to facilitate their rapid completion), and methods to predict the lowest dose to achieve adequate performance for specific CT systems are needed. The full impact of noise reduction techniques on radiation dose and radiologist performance is in the early phases of realization, with great potential to benefit patients by decreasing the radiation dose received while undergoing CT studies.

CT Raw Data

Descriptions Example methods Advantages Disadvantages

TraditionalFBP-based methods

Weighted 3D FBP, AMBP Fast; Directly available on scanners

Treats every ray the same, sub-optimal dose efficiency

Image-spacedenoising SafeCT, SharpView, Noisemap NLM

Fast; Only needs reconstructed images, cross scanner platform

Does not take into account system physics; No capability to reduce artifacts

Projection-spacedenoising Adaptive filtering or iterative denoising in projection data. *ASIR, ADIR, iDose might belong to this category, but no technique detail has been published.

Fast; May incorporate complex system physics models

Potential to lose spatial resolution if not designed well

Full iterativereconstruction MBIR Incorporates systemmodel (both photon statistics and detailed geometry); has the potential to reduce both noise and artifacts

Slow; May change the noise texture ofCT images

Hybrid iterativereconstruction

SAFIRE Noise reduction in image-space (for speed), artifactreduction in projection-space (for image quality)

May change the noise texture ofCT images

PROJECTION-SPACE DENOISING

Routine Kernels

Iterative Reconstruction

Figure 8. ACR low contrast phantom scanned at multiple dose levels shows that iterative reconstruction lowers noise level at all tube currents, but that small low contrast rods (circled on 240 mAs images) are difficult to detect at 120 and 60 mAs.