Embed Size (px)
Citation preview
Methods for calculating the emissions of transport in the Netherlands
May 2014
Text and editing: Task Force on Transportation of the Dutch Pollutant Release and Transfer Register (see www.emissieregistratie.nl) comprising the following members:
- John Klein (CBS-Environmental Statistics) [email protected]
Road traffic and other mobile sources
- Gerben Geilenkirchen (PBL- Netherlands Environmental Assessment
Agency) [email protected]
Chairman
- Jan Hulskotte (TNO) [email protected]
Navigation, aviation and mobile machinery
- Norbert Ligterink (TNO), emission factors for road traffic [email protected]
- Paul Fortuin (DG for Public Works and Water Management-DVS) [email protected]
- Hermine Molnár-in 't Veld (CBS-Transport Statistics) [email protected]

2
3
TABLE OF CONTENTS
INTRODUCTION
1. Road traffic
1.1 Introduction 1.2 Contribution to the national emissions
1.3 Description of the process
1.4 Calculation methods
1.4.1 Actual emissions and NEC emissions
Combustion of motor fuels; CO, VOC, NOx, PM10, N2O en NH3 Combustion of motor fuels; SO2, CO2, and heavy metals Combustion of motor fuels; VOC components and PAH components Evaporation of motor fuels Wear of tyres, brakes and road surfaces; PM10 Wear of tyres, brakes and road surfaces; heavy metals and PAHs Leakage of engine oil; heavy metals and PAHs Consumption of engine oil; heavy metals
1.4.2 IPCC emissions
1.5 Activity data
1.5.1 Actual and NEC emissions Vehicle fleet Average annual number of kilometres on Dutch territory Vehicle kilometres of non-Dutch drivers Allocation of vehicle kilometres to road category Share of vehicle classes in the vehicle kilometres per vehicle category Fuel consumption of road traffic
1.5.2 IPCC emissions Sales of motor fuels 1.6 Emission factors
1.6.1 Actual and NEC emissions Emission factors for the combustion of motor fuels; CO, VOC, NOx and PM10 Emission factors for the combustion of motor fuels; N2O and NH3 Emission factors for the combustion of motor fuels; SO2, CO2 and heavy metals Emission factors for the evaporation of motor fuels Other emission factors 1.6.2 IPCC emission factorss
1.7 Substance profiles
1.7.1 VOC caused by combustion of motor fuels
1.7.2 VOC caused by evaporation of motor fuels
1.7.3 Particulate matter emission (non-combustion) 1.8 Regionalization
1.9 Uncertainties
1.9.1 Uncertainties in Activity data 1.9.2 Uncertainties in emission factors 1.9.3 Uncertainties in the emissions
4
1.10 Points for improvement
1.10.1 Calculation methods
1.10.2 Activity data
1.10.3 Emission factors
1.11 Verification
2. Inland navigation
2.1 Introduction 2.2 Contribution to the national emissions 2.3 Description of the process 2.4 Calculation methods
2.4.1 Actual and NEC emissions Combustion of motor fuels: CO, NOx, VOC, PM10, SO2 and CO2 Professional inland shipping
Passenger ships and ferries Recreational boat traffic
Combustion of motor fuels: N2O and NH3 Combustion of motor fuels: VOC and PAH components and heavy metals
2.4.2 IPCC emissions 2.5 Activity data
2.5.1 Actual and NEC emissions Professional inland shipping Passenger ships and ferries Recreational boat traffic
2.5.2 IPCC emissions 2.6 Emission factors
2.6.1 Actual and NEC emissions Professional inland shipping Passenger boats and ferries Recreational boat traffic
2.6.2 IPCC emissions 2.7 Substance profiles
2.8 Regionalization
2.9 Uncertainties 2.10 Points for improvement 2.11 Verification
5
3. Fisheries
3.1 Introduction 3.2 Contribution to the national emissions 3.3 Description of the process 3.4 Calculation methods
3.4.1 Actual and NEC emissions
3.4.2 IPCC emissions 3.5 Activity data 3.6 Emission factors
3.7 Substance profiles
3.8 Regionalization
3.9 Uncertainties 3.10 Points for improvement 3.11 Verification
4. Maritime shipping
4.1 Introduction 4.2 Contribution to the national emissions 4.3 Description of the process 4.4 Calculation methods
4.4.1 Combustion of motor fuels; CO, NOx, VOC, PM10, SO2 and CO2 Seagoing vessels at anchor
Sailing and manoeuvring seagoing vessels on Dutch territory
4.4.2 Combustion of motor fuels; N2O and NH3 4.4.3 Combustion of motor fuels; VOC and PAH components and heavy metals
4.5 Activity data
4.5.1 Seagoing vessels at anchor 4.5.2 Sailing and manoeuvring seagoing vessels on Dutch territory 4.5.3 Seagoing vessels on the national portion of the continental shelf 4.6 Emission factors
6
4.7 Substance profiles
4.8 Regionalization
4.9 Uncertainties 4.10 Points for improvement
4.10.1 Seagoing vessels at anchor 4.10.2 Sailing and manoeuvring seagoing vessels on Dutch territory 4.10.3 Seagoing vessels on the national continental shelf 4.11 Verification
5. Rail traffic
5.1 Introduction 5.2 Contribution to the national emissions 5.3 Description of the process 5.4 Calculation methods
5.4.1 Combustion emissions of CO, VOC, NOx, PM10, SO2, CO2 and heavy metals
5.4.2 Combustion emissions of N2O and NH3
5.4.3 PM10 and heavy metals due to wear of overhead contact lines and carbon brushes 5.5 Activity data 5.6 Emission factors
5.6.1 Combustion emissions of CO, VOC, NOx, PM10, SO2, CO2 and heavy metals
5.6.2 Combustion emissions of N2O and NH3
5.6.3 PM10 and heavy metals due to wear of overhead contact lines and carbon brushes 5.7 Substance profiles
5.8 Regionalization
5.9 Uncertainties 5.10 Points for improvement 5.11 Verification
7
6. Air traffic
6.1 Introduction 6.2 Contribution to the national emissions 6.3 Description of the process 6.4 Calculation methods
6.4.1 Actual and NEC emissions Combustion of motor fuels; CO, NOx, VOC, PM10, SO2 and CO2 Combustion of motor fuels; N2O and NH3
Auxiliary Power Units and General Power Units (APU/GPU) Storage and transfer of kerosene Combustion of motor fuels; VOC and PAH components and heavy metals
6.4.2 IPCC emissions 6.5 Activity data
6.5.1 Actual and NEC emissions
6.5.2 IPCC emissions 6.6 Emission factors 6.7 Substance profiles
6.8 Regionalization
6.9 Uncertainties 6.10 Points for improvement 6.11 Verification
7. Mobile machinery
7.1 Introduction 7.2 Contribution to the national emissions 7.3 Description of the process 7.4 Calculation methods
7.4.1 Combustion of motor fuels; CO, NOx, VOC, PM10, SO2 and CO2 7.4.2 Combustion of motor fuels; N2O and NH3 7.4.3 Combustion of motor fuels; VOC and PAH components and heavy metals 7.5 Activity data 7.6 Emission factors 7.7 Substance profiles
7.8 Regionalization
7.9 Uncertainties 7.10 Points for improvement 7.11 Verification
8
8. Military activities
8.1 Introduction 8.2 Contribution to the national IPCC emissions 8.3 Description of the process 8.4 Calculation methods 8.5 Activity data 8.6 Emission factors 8.7 Substance profiles
8.8 Regionalization
8.9 Uncertainties 8.10 Points for improvement 8.11 Verification
9. IPCC method
9.1 Introduction 9.2 Why are there two estimation methods?
9.3 The most important differences between the two methods 9.4 Emission factors for the IPCC-method
10. Changes with respect to previous versions of the report
References and annexes
REFERENCES Annexes: QUALITY CODES
A. Activity data B. Emission factors C. Emissions
9
INTRODUCTION
The sources that cause emissions of environmental pollutants can roughly be divided into stationary and mobile sources. Examples of stationary sources are installations for generating heat and energy, such as central heating systems and electrical power plants, and installations where all kinds of industrial processes take place. Mobile sources include various means of transport such as passenger cars, light and heavy duty trucks, inland waterway vessels and aircraft, as well as mobile machinery with combustion engines, such as agricultural tractors and forklifts. This report describes the methodologies, emission factors and relevant activity data that are used to calculate the emissions of environmental pollutants from mobile sources in the Netherlands. The emissions are calculated annually by the Task Force on Transportation of the Dutch Pollutant and Transfer Register (PRTR). The resulting emission figures for greenhouse gases are reported annually in the National Inventory Report, whereas the air polluting emissions are reported in the Informative Inventory Report. Both reports also give a brief description of the trends in emissions and the methodologies used to calculate emissions. These methodologies and underlying data are described in more detail in the present report. The present report describes the methodologies used for calculating the emissions for the 1990-2012 time series that are published in 2014 and reported in the 2014 National Inventory Report (Van der Maas et al., 2014) and the 2014 Informative Inventory Report (Jimmink et al., 2014). This report has been compiled by the members of the Task Force on Transportation of the PRTR, which includes members of Statistics Netherlands, the PBL Netherlands Environmental Assessment Agency, the Netherlands Organisation of Applied Scientific Research TNO and the RWS Centre for Transport and Navigation (DVS) of the Dutch Ministry of Infrastructure and the Environment. For a more general description of the Dutch PRTR and the different task forces, please refer to the website of the PRTR (www.emissieregistratie.nl). The majority of the tables accompanying this report have been included in a separate Excel file. References to these tables are printed in italics. In addition to the data for the emission calculation, the tables also contain references and hyperlinks to the underlying data sources and data used for the calculation of the 2011 emission figures.
Source categories and emission processes One of the first steps in developing a methodology for estimating the emissions from mobile sources is making an inventory of the various mobile sources. In broad terms, the following mobile source categories are distinguished:
Road transport
Railways
National and international inland shipping (including recreational crafts)
Maritime shipping
Fisheries
Civil aviation
Non road mobile machinery (tractors, bulldozers, forklifts etc.)
Military shipping and aviation For each source category, various emission processes are distinguished:
Combustion of motor fuels for propulsion;
Evaporation of motor fuels from the fuel system of vehicles;
Wear of tyres, brake linings and road surfaces due to road traffic;
Leakage and consumption of motor oil;
Wear of overhead contact lines and carbon brushes on trains, trams and metros;
Support processes on board ships (heating, electricity generation, refrigeration and pumping).
10
Within the transport sector, several other emission sources are present that are being estimated in the Dutch PRTR by the MEWAT task force
1 due to their specific effect on water quality. This concerns the
following sources:
Anti-fouling on recreational boats;
Coatings and bilge water from inland waterway vessels;
Leakage of propeller shaft grease and spillage from inland waterway vessels;
Corrosion of zinc anodes on inland waterway vessels and locks;
Leaching from seagoing vessels and fishery vessels in harbours and national continental shelf;
Anodes of seagoing vessels and fishery vessels in harbours and on the national continental shelf. For more information about the methodologies, activity data and emission factors used to calculate the emissions from the above mentioned sources, please refer to: helpdeskwater.nl (task force: diffuse sources, task field: emission estimates), and to the Emissieregistratie en –Monitoring Scheepvaart
2
(EMS) project (protocols, coatings and anodes).
Reporting requirements and formats The emission figures from the national emission inventory (PRTR) are inter alia used for air quality modelling and for emission reporting under the UNECE Convention on Long-range Transboundary Air Pollution, the EU National Emission Ceilings Directive and the UN Framework Climate Change Convention. Because the reporting requirements differ, we distinguish three different emission categorizations in this report:
1. Actual emissions on Dutch Territory and the Dutch part of the Continental Shelf. This includes all emissions from mobile sources on Dutch territory, with the exception of non-LTO (landing and take-off cycle) emissions from aviation. The resulting emissions are inter alia used for the modelling of air quality.
2. IPCC emissions: Dutch emissions of greenhouse gases as reported to the United Nations and
the European Union. Various aspects of this process take place due to the reporting obligations of the UN Framework Convention on Climate Change (UNFCCC) and the EU Greenhouse Gas Monitoring Mechanism. The emissions are calculated according to the IPCC regulations. The IPCC (Intergovernmental Panel on Climate Change) provides the scientific supervision of the implementation of the Kyoto Protocol [ref 68: IPCC,1997 and ref 69: MNP,2005]. The mobile source emission figures show a number of differences when comparing IPCC emissions with the actual emissions (1) on Dutch territory:
The greenhouse gas emissions by road transport are calculated on the basis of sales of motor fuels in the Netherlands, whereas the actual emissions are calculated on the basis of vehicle kilometres travelled on Dutch territory.
CO2 emissions from biofuels are reported separately in the IPCC figures and are excluded from the national emission totals.
The greenhouse gas emissions by recreational craft are included in the emissions by road transport. It is not possible to differentiate motor fuel sales into road traffic and non-road traffic.
Emissions from maritime shipping and international inland shipping with origin or destination abroad are not included in the IPCC emission figures.
The IPCC emissions from civil aviation only contain emissions from inland flights. The actual emissions are based on all landings and take-offs (LTO cycles) in the Netherlands.
The IPCC emissions include emissions from military operations abroad. The actual military emissions are based on inland activities only.
3. NEC emissions: in 2001, the European Parliament and the Council of Europe approved a
Directive concerning national emission ceilings for transboundary air pollution which contributes to acidification, soil eutrophication and tropospheric ozone formation. This Directive is referred to as the NEC Directive (National Emission Ceilings). Emissions from international maritime shipping are excluded from the NEC emission totals. Otherwise, the calculations of mobile source emissions are in accordance with the calculations of the actual emissions [ref 70: EG, 2003].
1 Methods task group for water quality
2 Emission Registration and Monitoring of Shipping
11
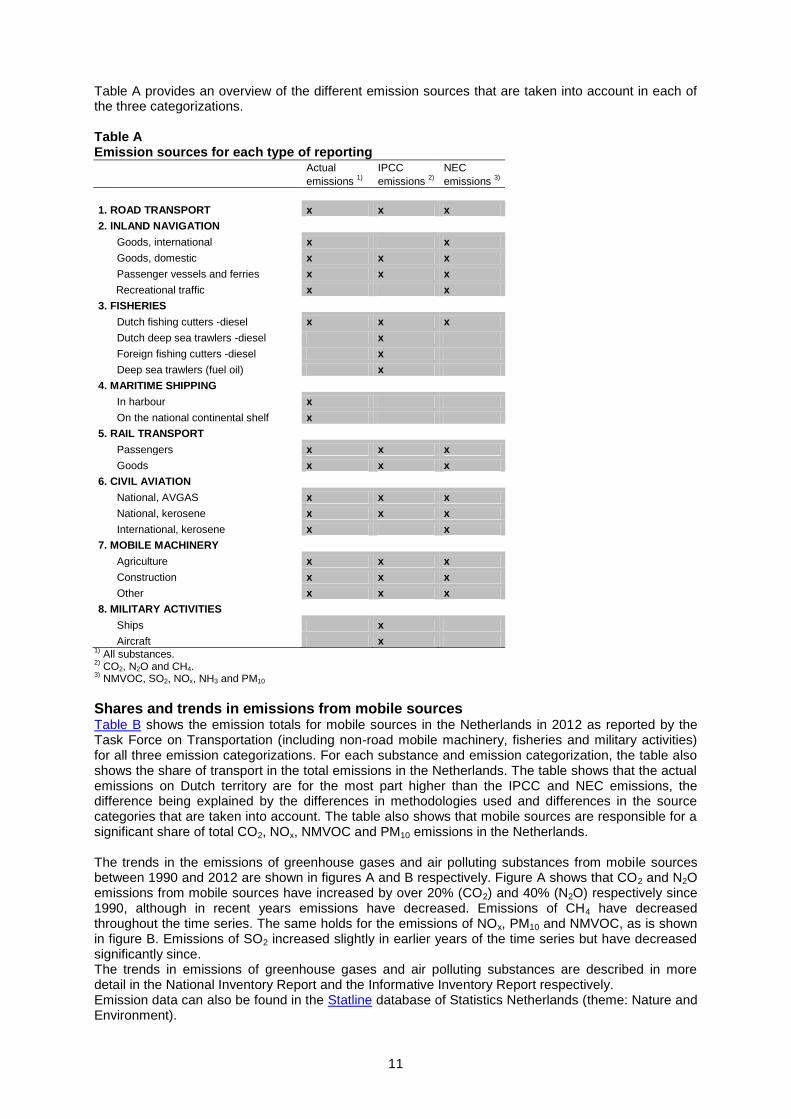
Table A provides an overview of the different emission sources that are taken into account in each of the three categorizations. Table A Emission sources for each type of reporting Actual IPCC NEC
emissions 1) emissions
2) emissions
3)
1. ROAD TRANSPORT x x x
2. INLAND NAVIGATION
Goods, international x x
Goods, domestic x x x
Passenger vessels and ferries x x x
Recreational traffic x x
3. FISHERIES
Dutch fishing cutters -diesel x x x
Dutch deep sea trawlers -diesel x
Foreign fishing cutters -diesel x
Deep sea trawlers (fuel oil) x
4. MARITIME SHIPPING
In harbour x
On the national continental shelf x
5. RAIL TRANSPORT
Passengers x x x
Goods x x x
6. CIVIL AVIATION
National, AVGAS x x x
National, kerosene x x x
International, kerosene x x
7. MOBILE MACHINERY
Agriculture x x x
Construction x x x
Other x x x
8. MILITARY ACTIVITIES
Ships x
Aircraft x 1) All substances.
2) CO2, N2O and CH4.
3) NMVOC, SO2, NOx, NH3 and PM10
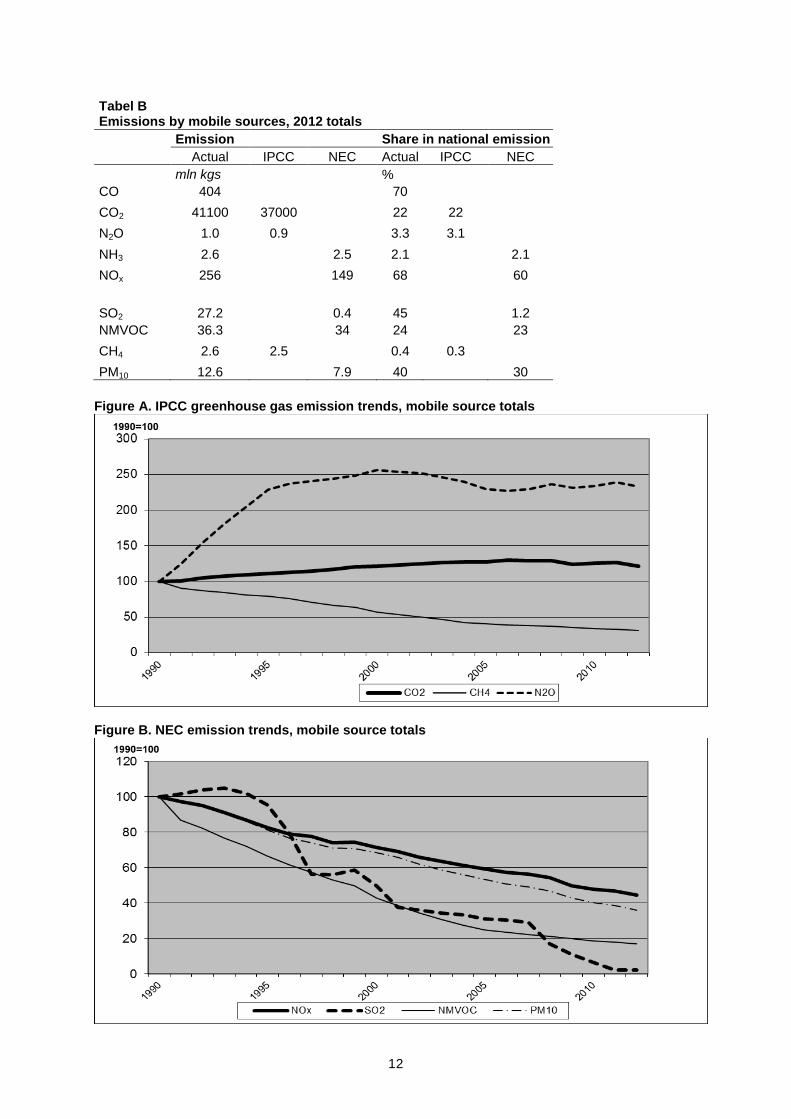
Shares and trends in emissions from mobile sources Table B shows the emission totals for mobile sources in the Netherlands in 2012 as reported by the Task Force on Transportation (including non-road mobile machinery, fisheries and military activities) for all three emission categorizations. For each substance and emission categorization, the table also shows the share of transport in the total emissions in the Netherlands. The table shows that the actual emissions on Dutch territory are for the most part higher than the IPCC and NEC emissions, the difference being explained by the differences in methodologies used and differences in the source categories that are taken into account. The table also shows that mobile sources are responsible for a significant share of total CO2, NOx, NMVOC and PM10 emissions in the Netherlands. The trends in the emissions of greenhouse gases and air polluting substances from mobile sources between 1990 and 2012 are shown in figures A and B respectively. Figure A shows that CO2 and N2O emissions from mobile sources have increased by over 20% (CO2) and 40% (N2O) respectively since 1990, although in recent years emissions have decreased. Emissions of CH4 have decreased throughout the time series. The same holds for the emissions of NOx, PM10 and NMVOC, as is shown in figure B. Emissions of SO2 increased slightly in earlier years of the time series but have decreased significantly since. The trends in emissions of greenhouse gases and air polluting substances are described in more detail in the National Inventory Report and the Informative Inventory Report respectively. Emission data can also be found in the Statline database of Statistics Netherlands (theme: Nature and Environment).
12
Tabel B Emissions by mobile sources, 2012 totals
Emission Share in national emission
Actual IPCC NEC Actual IPCC NEC
mln kgs %
CO 404 70
CO2 41100 37000 22 22
N2O 1.0 0.9 3.3 3.1
NH3 2.6 2.5 2.1 2.1
NOx 256 149 68 60
SO2 27.2 0.4 45 1.2
NMVOC 36.3 34 24 23
CH4 2.6 2.5 0.4 0.3
PM10 12.6 7.9 40 30
Figure A. IPCC greenhouse gas emission trends, mobile source totals
Figure B. NEC emission trends, mobile source totals
13
Outline of report In Chapters 1 through 8 the methodologies used for calculating the emissions are described for each source category and for each process according to a fixed structure. This structure is generally used in the Dutch Emission Inventory for describing the calculation methods:
X.1 Introduction with a brief description of the process for which the calculation method is described and a reference to the documents where more information can be obtained.
X.2 An overview of the contribution of the emissions to the national total and to the target group. This indicates the relative importance of the source category for each substance.
X.3 An extensive description of the process for which the calculation method is described. X.4 An explanation of the calculation method or methods used. In addition, this chapter indicates
which policy measures are expressed in the calculation and what effect this has. X.5 Additional information about the origin and backgrounds of the activity data used, such as
vehicle kilometres and fuel consumption. X.6 An explanation of the emission factors used and the corresponding data quality codes. X.7 An explanation and description of the substance profiles used. X.8 A description of the parameters on the basis of which the data are presented regionally . X.9 An explanation of the uncertainties in the information and a description of the way in which
the uncertainty estimate has been established. X.10 A description of the aspects of the calculation that could be improved. X.11 A description of the way in which the calculation is verified. X.12 Additional information (if applicable).
Chapter 9 pays attention to the determination of greenhouse gas emissions according to the IPCC regulations. In particular, it addresses the differences between the actual emissions and the IPCC emissions. Chapter 10 provides a brief summary of the methodological changes with respect to the previous reports on methods. Table 10.1 in the EXCEL-file gives an overview of the changes. Appendix 1 provides a summary of the quality codes for the activity data, the emission factors and the emissions themselves (= combination of emission factor and volume).
14
1. ROAD TRAFFIC
1.1 Introduction This chapter describes the methods that have been used for determining emissions from road traffic. Road traffic is defined as follows: all motorized vehicles that are licensed and which travel on the public road. Road traffic comprises, among other things, passenger cars, light duty vehicles, lorries, road tractors, buses, special vehicles (such as fire trucks and refuse trucks), motorcycles and mopeds. The emissions from road traffic are part of both the actual emissions and the IPCC and NEC emissions. The calculation of the actual and NEC emissions takes place using the same methodology, i.e. based on vehicle kilometres. The calculation of the IPCC emissions deviates from this; it is based on the sales of motor fuels. For more information on this topic, see the Introduction and Chapter 9 (IPCC method).
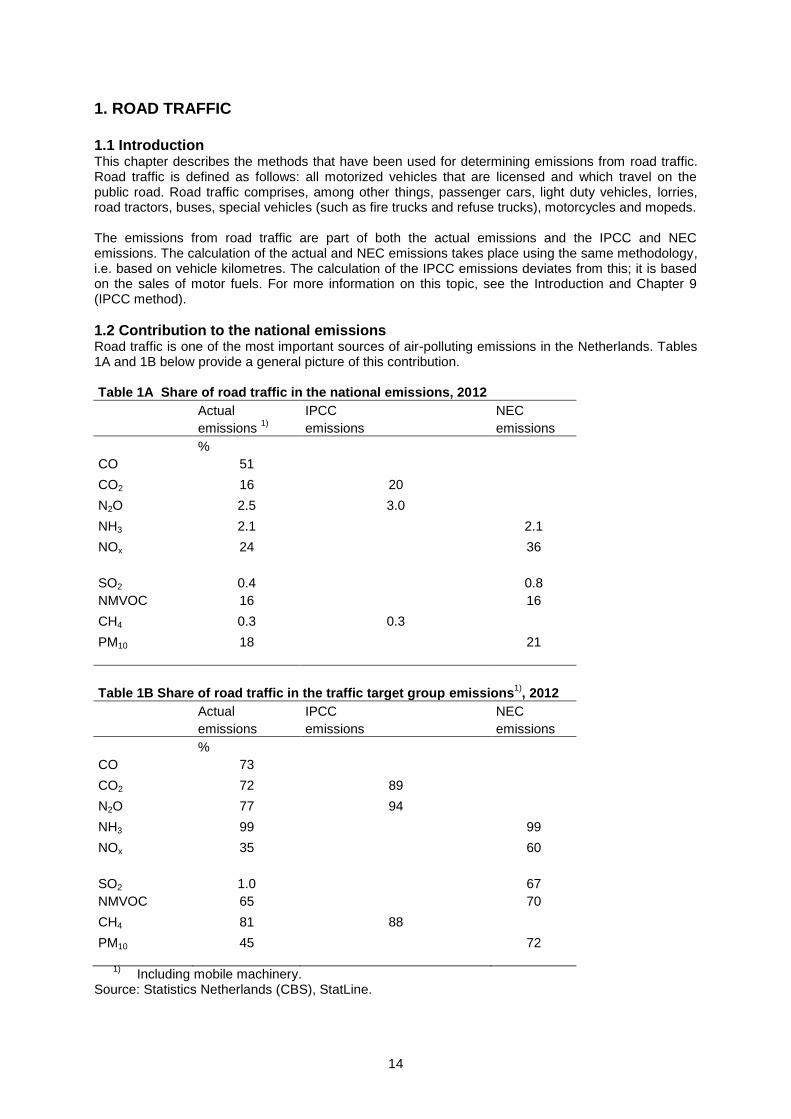
1.2 Contribution to the national emissions Road traffic is one of the most important sources of air-polluting emissions in the Netherlands. Tables 1A and 1B below provide a general picture of this contribution. Table 1A Share of road traffic in the national emissions, 2012
Actual IPCC NEC
emissions 1)
emissions emissions
%
CO 51
CO2 16 20
N2O 2.5 3.0
NH3 2.1 2.1
NOx 24 36
SO2 0.4 0.8
NMVOC 16 16
CH4 0.3 0.3
PM10 18 21
Table 1B Share of road traffic in the traffic target group emissions1)
, 2012
Actual IPCC NEC
emissions emissions emissions
%
CO 73
CO2 72 89
N2O 77 94
NH3 99 99
NOx 35 60
SO2 1.0 67
NMVOC 65 70
CH4 81 88
PM10 45 72
1) Including mobile machinery.
Source: Statistics Netherlands (CBS), StatLine.
15
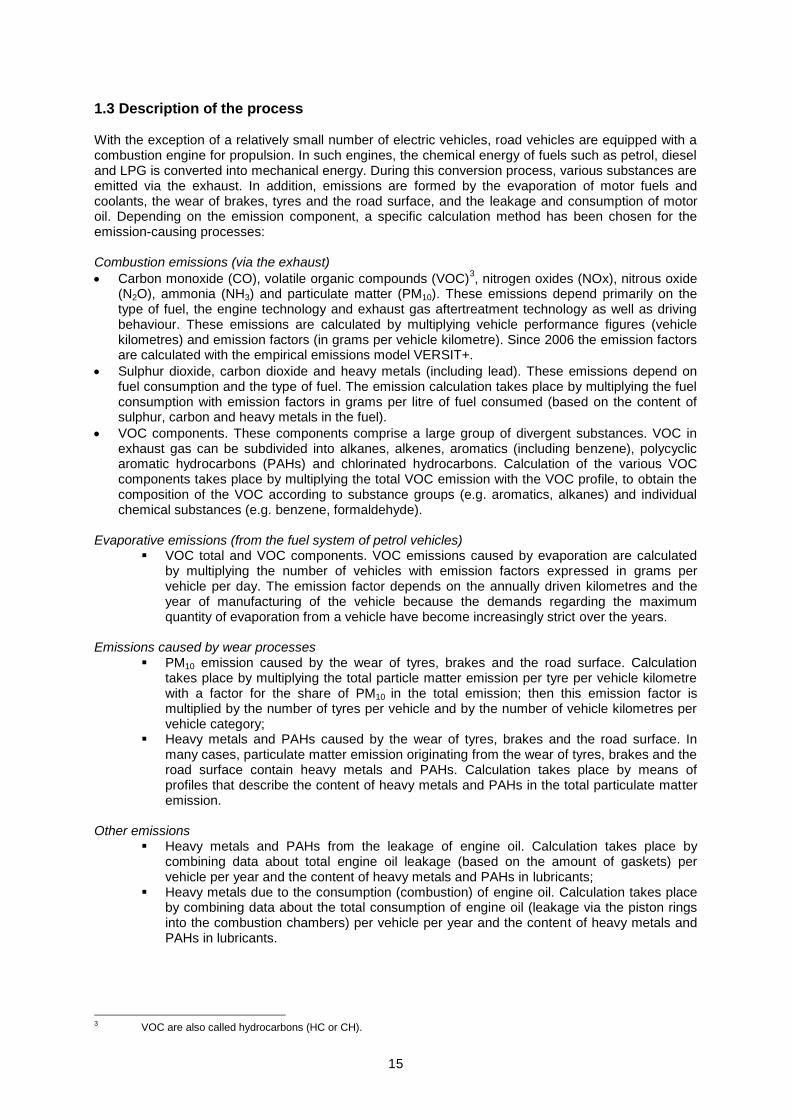
1.3 Description of the process With the exception of a relatively small number of electric vehicles, road vehicles are equipped with a combustion engine for propulsion. In such engines, the chemical energy of fuels such as petrol, diesel and LPG is converted into mechanical energy. During this conversion process, various substances are emitted via the exhaust. In addition, emissions are formed by the evaporation of motor fuels and coolants, the wear of brakes, tyres and the road surface, and the leakage and consumption of motor oil. Depending on the emission component, a specific calculation method has been chosen for the emission-causing processes: Combustion emissions (via the exhaust)
Carbon monoxide (CO), volatile organic compounds (VOC)3, nitrogen oxides (NOx), nitrous oxide
(N2O), ammonia (NH3) and particulate matter (PM10). These emissions depend primarily on the type of fuel, the engine technology and exhaust gas aftertreatment technology as well as driving behaviour. These emissions are calculated by multiplying vehicle performance figures (vehicle kilometres) and emission factors (in grams per vehicle kilometre). Since 2006 the emission factors are calculated with the empirical emissions model VERSIT+.
Sulphur dioxide, carbon dioxide and heavy metals (including lead). These emissions depend on fuel consumption and the type of fuel. The emission calculation takes place by multiplying the fuel consumption with emission factors in grams per litre of fuel consumed (based on the content of sulphur, carbon and heavy metals in the fuel).
VOC components. These components comprise a large group of divergent substances. VOC in exhaust gas can be subdivided into alkanes, alkenes, aromatics (including benzene), polycyclic aromatic hydrocarbons (PAHs) and chlorinated hydrocarbons. Calculation of the various VOC components takes place by multiplying the total VOC emission with the VOC profile, to obtain the composition of the VOC according to substance groups (e.g. aromatics, alkanes) and individual chemical substances (e.g. benzene, formaldehyde).
Evaporative emissions (from the fuel system of petrol vehicles)
VOC total and VOC components. VOC emissions caused by evaporation are calculated by multiplying the number of vehicles with emission factors expressed in grams per vehicle per day. The emission factor depends on the annually driven kilometres and the year of manufacturing of the vehicle because the demands regarding the maximum quantity of evaporation from a vehicle have become increasingly strict over the years.
Emissions caused by wear processes
PM10 emission caused by the wear of tyres, brakes and the road surface. Calculation takes place by multiplying the total particle matter emission per tyre per vehicle kilometre with a factor for the share of PM10 in the total emission; then this emission factor is multiplied by the number of tyres per vehicle and by the number of vehicle kilometres per vehicle category;
Heavy metals and PAHs caused by the wear of tyres, brakes and the road surface. In many cases, particulate matter emission originating from the wear of tyres, brakes and the road surface contain heavy metals and PAHs. Calculation takes place by means of profiles that describe the content of heavy metals and PAHs in the total particulate matter emission.
Other emissions
Heavy metals and PAHs from the leakage of engine oil. Calculation takes place by combining data about total engine oil leakage (based on the amount of gaskets) per vehicle per year and the content of heavy metals and PAHs in lubricants;
Heavy metals due to the consumption (combustion) of engine oil. Calculation takes place by combining data about the total consumption of engine oil (leakage via the piston rings into the combustion chambers) per vehicle per year and the content of heavy metals and PAHs in lubricants.
3 VOC are also called hydrocarbons (HC or CH).
16
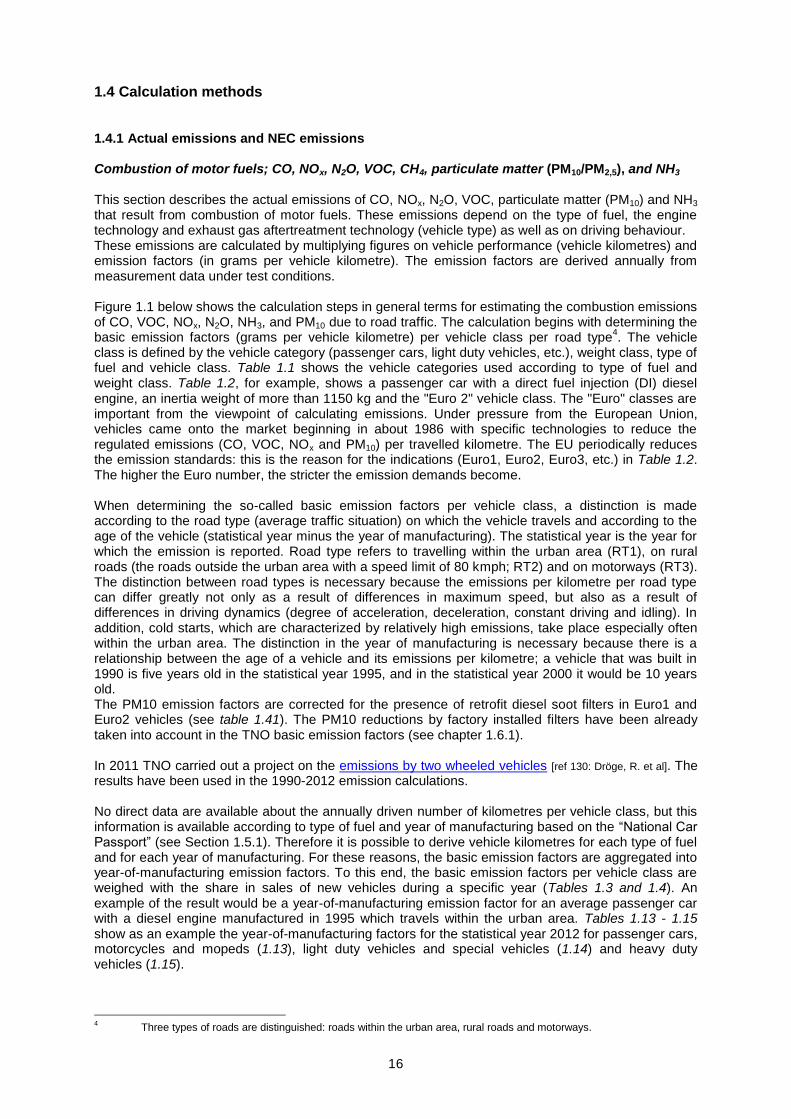
1.4 Calculation methods 1.4.1 Actual emissions and NEC emissions Combustion of motor fuels; CO, NOx, N2O, VOC, CH4, particulate matter (PM10/PM2,5), and NH3 This section describes the actual emissions of CO, NOx, N2O, VOC, particulate matter (PM10) and NH3 that result from combustion of motor fuels. These emissions depend on the type of fuel, the engine technology and exhaust gas aftertreatment technology (vehicle type) as well as on driving behaviour. These emissions are calculated by multiplying figures on vehicle performance (vehicle kilometres) and emission factors (in grams per vehicle kilometre). The emission factors are derived annually from measurement data under test conditions. Figure 1.1 below shows the calculation steps in general terms for estimating the combustion emissions of CO, VOC, NOx, N2O, NH3, and PM10 due to road traffic. The calculation begins with determining the basic emission factors (grams per vehicle kilometre) per vehicle class per road type
4. The vehicle
class is defined by the vehicle category (passenger cars, light duty vehicles, etc.), weight class, type of fuel and vehicle class. Table 1.1 shows the vehicle categories used according to type of fuel and weight class. Table 1.2, for example, shows a passenger car with a direct fuel injection (DI) diesel engine, an inertia weight of more than 1150 kg and the "Euro 2" vehicle class. The "Euro" classes are important from the viewpoint of calculating emissions. Under pressure from the European Union, vehicles came onto the market beginning in about 1986 with specific technologies to reduce the regulated emissions (CO, VOC, NOx and PM10) per travelled kilometre. The EU periodically reduces the emission standards: this is the reason for the indications (Euro1, Euro2, Euro3, etc.) in Table 1.2. The higher the Euro number, the stricter the emission demands become. When determining the so-called basic emission factors per vehicle class, a distinction is made according to the road type (average traffic situation) on which the vehicle travels and according to the age of the vehicle (statistical year minus the year of manufacturing). The statistical year is the year for which the emission is reported. Road type refers to travelling within the urban area (RT1), on rural roads (the roads outside the urban area with a speed limit of 80 kmph; RT2) and on motorways (RT3). The distinction between road types is necessary because the emissions per kilometre per road type can differ greatly not only as a result of differences in maximum speed, but also as a result of differences in driving dynamics (degree of acceleration, deceleration, constant driving and idling). In addition, cold starts, which are characterized by relatively high emissions, take place especially often within the urban area. The distinction in the year of manufacturing is necessary because there is a relationship between the age of a vehicle and its emissions per kilometre; a vehicle that was built in 1990 is five years old in the statistical year 1995, and in the statistical year 2000 it would be 10 years old. The PM10 emission factors are corrected for the presence of retrofit diesel soot filters in Euro1 and Euro2 vehicles (see table 1.41). The PM10 reductions by factory installed filters have been already taken into account in the TNO basic emission factors (see chapter 1.6.1). In 2011 TNO carried out a project on the emissions by two wheeled vehicles [ref 130: Dröge, R. et al]. The results have been used in the 1990-2012 emission calculations. No direct data are available about the annually driven number of kilometres per vehicle class, but this information is available according to type of fuel and year of manufacturing based on the “National Car Passport” (see Section 1.5.1). Therefore it is possible to derive vehicle kilometres for each type of fuel and for each year of manufacturing. For these reasons, the basic emission factors are aggregated into year-of-manufacturing emission factors. To this end, the basic emission factors per vehicle class are weighed with the share in sales of new vehicles during a specific year (Tables 1.3 and 1.4). An example of the result would be a year-of-manufacturing emission factor for an average passenger car with a diesel engine manufactured in 1995 which travels within the urban area. Tables 1.13 - 1.15 show as an example the year-of-manufacturing factors for the statistical year 2012 for passenger cars, motorcycles and mopeds (1.13), light duty vehicles and special vehicles (1.14) and heavy duty vehicles (1.15).
4 Three types of roads are distinguished: roads within the urban area, rural roads and motorways.
17
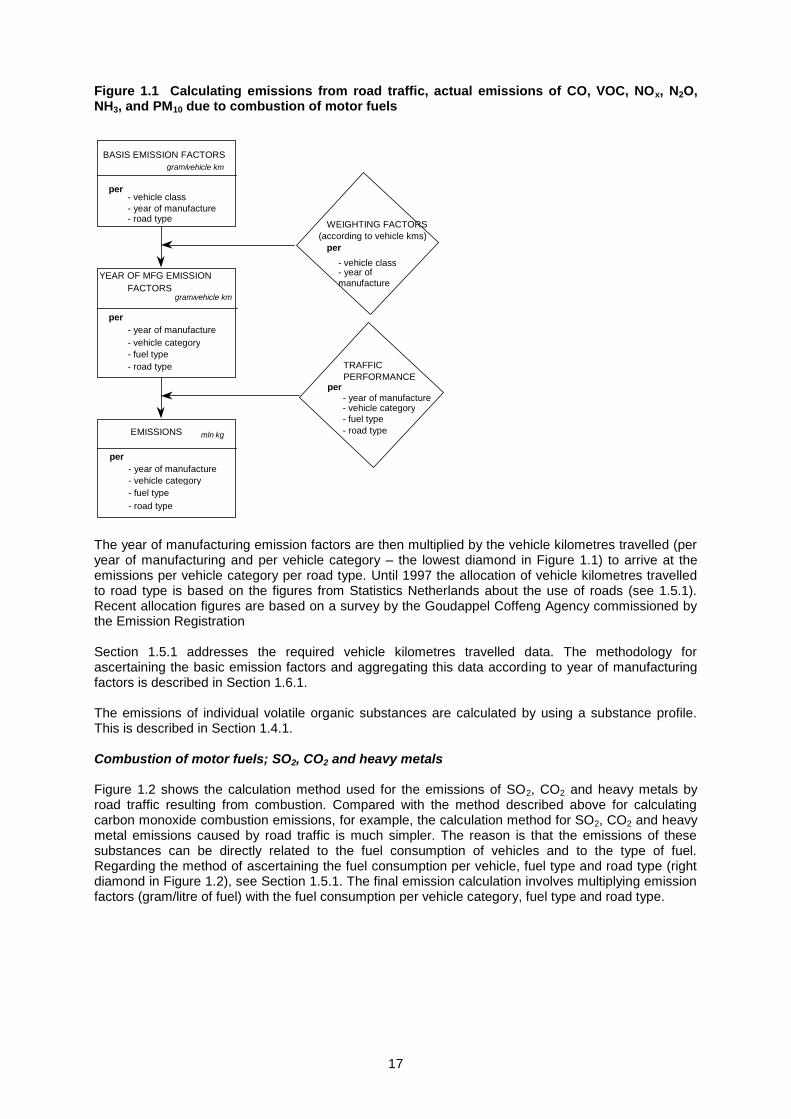
Figure 1.1 Calculating emissions from road traffic, actual emissions of CO, VOC, NOx, N2O, NH3, and PM10 due to combustion of motor fuels
The year of manufacturing emission factors are then multiplied by the vehicle kilometres travelled (per year of manufacturing and per vehicle category – the lowest diamond in Figure 1.1) to arrive at the emissions per vehicle category per road type. Until 1997 the allocation of vehicle kilometres travelled to road type is based on the figures from Statistics Netherlands about the use of roads (see 1.5.1). Recent allocation figures are based on a survey by the Goudappel Coffeng Agency commissioned by the Emission Registration Section 1.5.1 addresses the required vehicle kilometres travelled data. The methodology for ascertaining the basic emission factors and aggregating this data according to year of manufacturing factors is described in Section 1.6.1. The emissions of individual volatile organic substances are calculated by using a substance profile. This is described in Section 1.4.1. Combustion of motor fuels; SO2, CO2 and heavy metals Figure 1.2 shows the calculation method used for the emissions of SO2, CO2 and heavy metals by road traffic resulting from combustion. Compared with the method described above for calculating carbon monoxide combustion emissions, for example, the calculation method for SO2, CO2 and heavy metal emissions caused by road traffic is much simpler. The reason is that the emissions of these substances can be directly related to the fuel consumption of vehicles and to the type of fuel. Regarding the method of ascertaining the fuel consumption per vehicle, fuel type and road type (right diamond in Figure 1.2), see Section 1.5.1. The final emission calculation involves multiplying emission factors (gram/litre of fuel) with the fuel consumption per vehicle category, fuel type and road type.
BASIS EMISSION FACTORS gram/ vehicle km
per - vehicle class - year of manufacture - road type
YEAR OF MFG EMISSION FACTORS
gram/ vehicle km
per - year of manufacture - vehicle category - fuel type - road type
EMISSIONS mln kg
per - year of manufacture - vehicle category - fuel type - road type
WEIGHTING FACTORS
per - vehicle class - year of manufacture
TRAFFIC PERFORMANCE
per - year of manufacture - vehicle category - fuel type - road type
(according to vehicle kms)
18
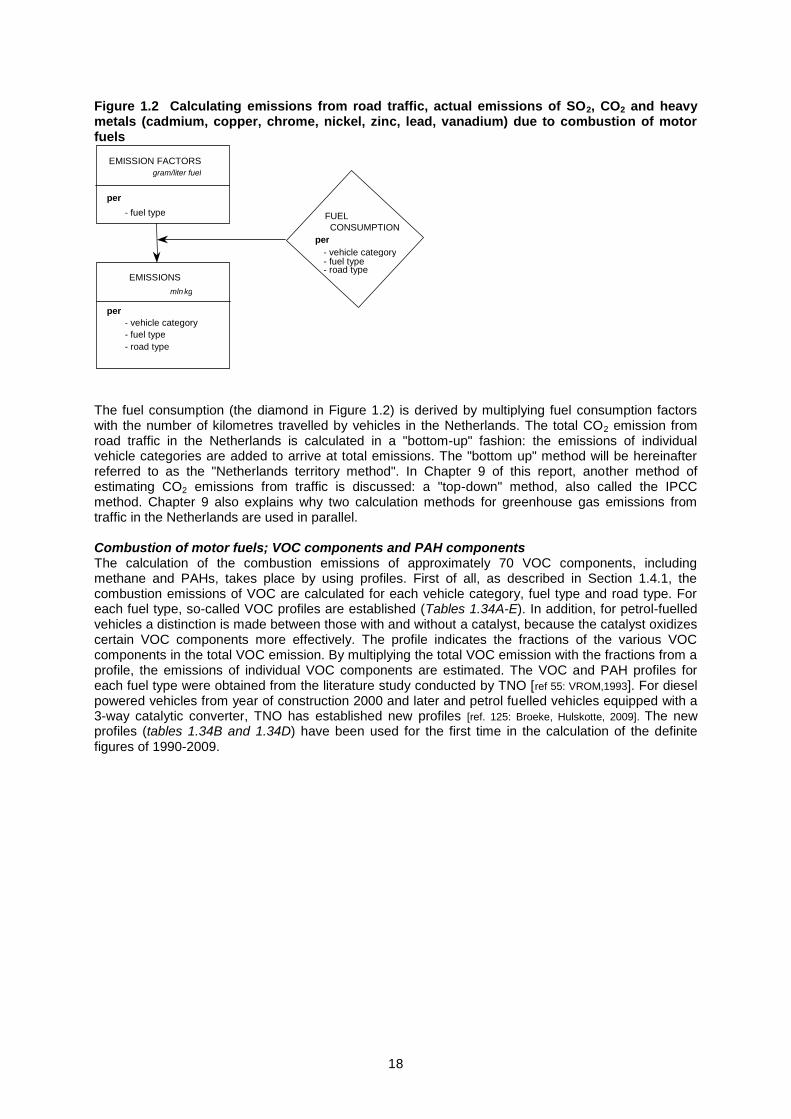
Figure 1.2 Calculating emissions from road traffic, actual emissions of SO2, CO2 and heavy metals (cadmium, copper, chrome, nickel, zinc, lead, vanadium) due to combustion of motor fuels
The fuel consumption (the diamond in Figure 1.2) is derived by multiplying fuel consumption factors with the number of kilometres travelled by vehicles in the Netherlands. The total CO2 emission from road traffic in the Netherlands is calculated in a "bottom-up" fashion: the emissions of individual vehicle categories are added to arrive at total emissions. The "bottom up" method will be hereinafter referred to as the "Netherlands territory method". In Chapter 9 of this report, another method of estimating CO2 emissions from traffic is discussed: a "top-down" method, also called the IPCC method. Chapter 9 also explains why two calculation methods for greenhouse gas emissions from traffic in the Netherlands are used in parallel. Combustion of motor fuels; VOC components and PAH components The calculation of the combustion emissions of approximately 70 VOC components, including methane and PAHs, takes place by using profiles. First of all, as described in Section 1.4.1, the combustion emissions of VOC are calculated for each vehicle category, fuel type and road type. For each fuel type, so-called VOC profiles are established (Tables 1.34A-E). In addition, for petrol-fuelled vehicles a distinction is made between those with and without a catalyst, because the catalyst oxidizes certain VOC components more effectively. The profile indicates the fractions of the various VOC components in the total VOC emission. By multiplying the total VOC emission with the fractions from a profile, the emissions of individual VOC components are estimated. The VOC and PAH profiles for each fuel type were obtained from the literature study conducted by TNO [ref 55: VROM,1993]. For diesel powered vehicles from year of construction 2000 and later and petrol fuelled vehicles equipped with a 3-way catalytic converter, TNO has established new profiles [ref. 125: Broeke, Hulskotte, 2009]. The new profiles (tables 1.34B and 1.34D) have been used for the first time in the calculation of the definite figures of 1990-2009.
EMISSION FACTORS gram/liter fuel
per - fuel type
EMISSIONS mln kg
per - vehicle category - fuel type - road type
FUEL CONSUMPTION
per - vehicle category - fuel type - road type
19
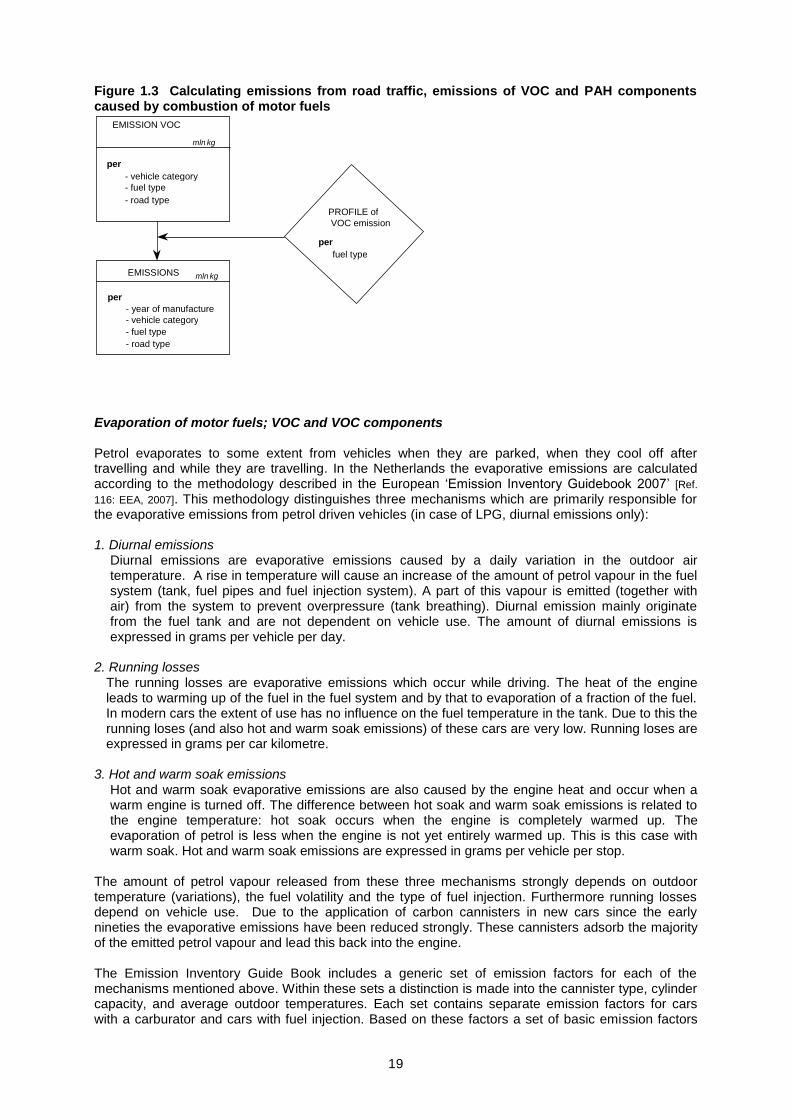
Figure 1.3 Calculating emissions from road traffic, emissions of VOC and PAH components caused by combustion of motor fuels
Evaporation of motor fuels; VOC and VOC components Petrol evaporates to some extent from vehicles when they are parked, when they cool off after travelling and while they are travelling. In the Netherlands the evaporative emissions are calculated according to the methodology described in the European ‘Emission Inventory Guidebook 2007’ [Ref.
116: EEA, 2007]. This methodology distinguishes three mechanisms which are primarily responsible for the evaporative emissions from petrol driven vehicles (in case of LPG, diurnal emissions only): 1. Diurnal emissions
Diurnal emissions are evaporative emissions caused by a daily variation in the outdoor air temperature. A rise in temperature will cause an increase of the amount of petrol vapour in the fuel system (tank, fuel pipes and fuel injection system). A part of this vapour is emitted (together with air) from the system to prevent overpressure (tank breathing). Diurnal emission mainly originate from the fuel tank and are not dependent on vehicle use. The amount of diurnal emissions is expressed in grams per vehicle per day.
2. Running losses The running losses are evaporative emissions which occur while driving. The heat of the engine leads to warming up of the fuel in the fuel system and by that to evaporation of a fraction of the fuel. In modern cars the extent of use has no influence on the fuel temperature in the tank. Due to this the running loses (and also hot and warm soak emissions) of these cars are very low. Running loses are expressed in grams per car kilometre.
3. Hot and warm soak emissions Hot and warm soak evaporative emissions are also caused by the engine heat and occur when a warm engine is turned off. The difference between hot soak and warm soak emissions is related to the engine temperature: hot soak occurs when the engine is completely warmed up. The evaporation of petrol is less when the engine is not yet entirely warmed up. This is this case with warm soak. Hot and warm soak emissions are expressed in grams per vehicle per stop.
The amount of petrol vapour released from these three mechanisms strongly depends on outdoor temperature (variations), the fuel volatility and the type of fuel injection. Furthermore running losses depend on vehicle use. Due to the application of carbon cannisters in new cars since the early nineties the evaporative emissions have been reduced strongly. These cannisters adsorb the majority of the emitted petrol vapour and lead this back into the engine.
The Emission Inventory Guide Book includes a generic set of emission factors for each of the mechanisms mentioned above. Within these sets a distinction is made into the cannister type, cylinder capacity, and average outdoor temperatures. Each set contains separate emission factors for cars with a carburator and cars with fuel injection. Based on these factors a set of basic emission factors
PROFILE of VOC emission
per fuel type
EMISSION VOC
mln kg
per - vehicle category - fuel type - road type
EMISSIONS mln kg
per - year of manufacture - vehicle category - fuel type - road type
20
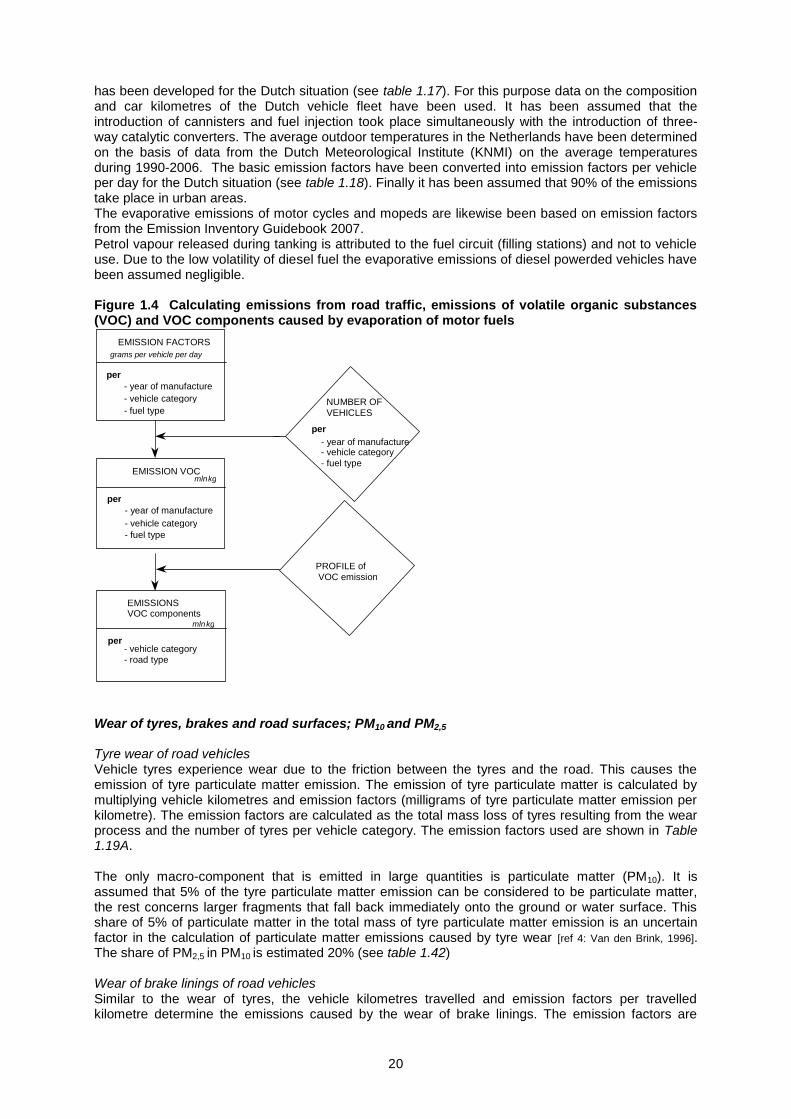
has been developed for the Dutch situation (see table 1.17). For this purpose data on the composition and car kilometres of the Dutch vehicle fleet have been used. It has been assumed that the introduction of cannisters and fuel injection took place simultaneously with the introduction of three-way catalytic converters. The average outdoor temperatures in the Netherlands have been determined on the basis of data from the Dutch Meteorological Institute (KNMI) on the average temperatures during 1990-2006. The basic emission factors have been converted into emission factors per vehicle per day for the Dutch situation (see table 1.18). Finally it has been assumed that 90% of the emissions take place in urban areas. The evaporative emissions of motor cycles and mopeds are likewise been based on emission factors from the Emission Inventory Guidebook 2007. Petrol vapour released during tanking is attributed to the fuel circuit (filling stations) and not to vehicle use. Due to the low volatility of diesel fuel the evaporative emissions of diesel powerded vehicles have been assumed negligible. Figure 1.4 Calculating emissions from road traffic, emissions of volatile organic substances (VOC) and VOC components caused by evaporation of motor fuels
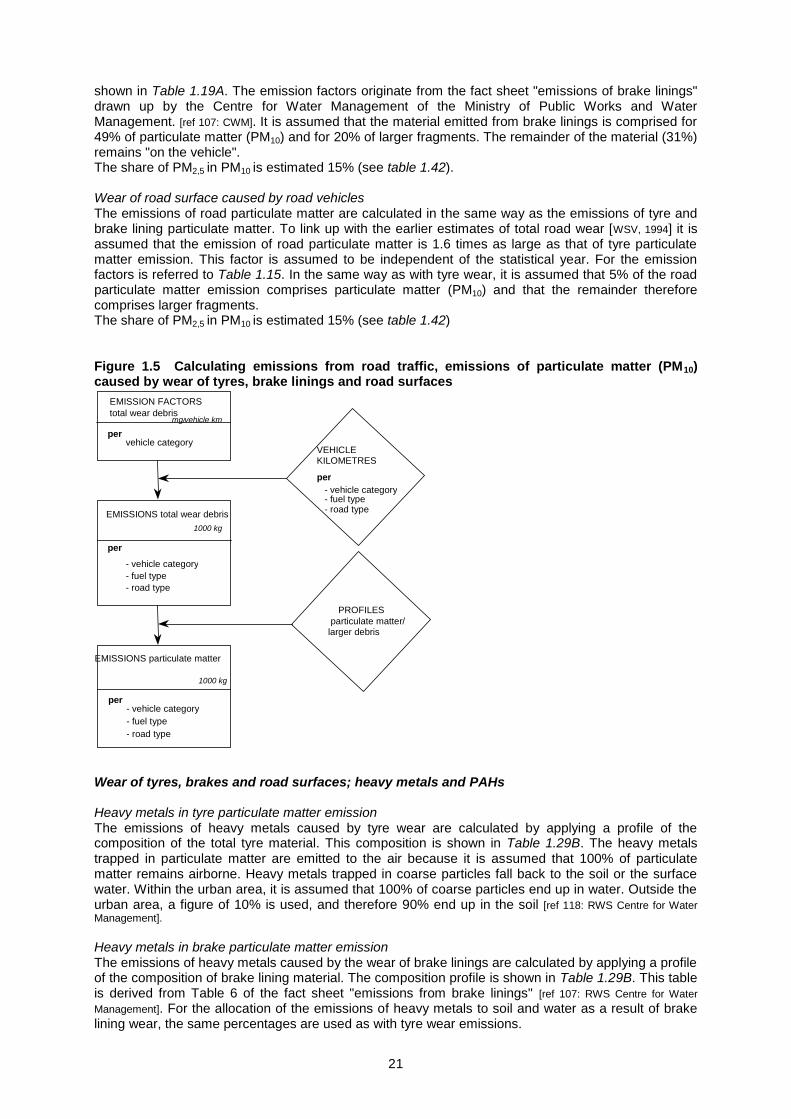
Wear of tyres, brakes and road surfaces; PM10 and PM2,5 Tyre wear of road vehicles Vehicle tyres experience wear due to the friction between the tyres and the road. This causes the emission of tyre particulate matter emission. The emission of tyre particulate matter is calculated by multiplying vehicle kilometres and emission factors (milligrams of tyre particulate matter emission per kilometre). The emission factors are calculated as the total mass loss of tyres resulting from the wear process and the number of tyres per vehicle category. The emission factors used are shown in Table 1.19A. The only macro-component that is emitted in large quantities is particulate matter (PM10). It is assumed that 5% of the tyre particulate matter emission can be considered to be particulate matter, the rest concerns larger fragments that fall back immediately onto the ground or water surface. This share of 5% of particulate matter in the total mass of tyre particulate matter emission is an uncertain factor in the calculation of particulate matter emissions caused by tyre wear [ref 4: Van den Brink, 1996]. The share of PM2,5 in PM10 is estimated 20% (see table 1.42) Wear of brake linings of road vehicles Similar to the wear of tyres, the vehicle kilometres travelled and emission factors per travelled kilometre determine the emissions caused by the wear of brake linings. The emission factors are
EMISSION FACTORS grams per vehicle per day
per - year of manufacture - vehicle category - fuel type
EMISSION VOC mln kg
per - year of manufacture - vehicle category - fuel type
NUMBER OF VEHICLES
per - year of manufacture - vehicle category - fuel type
PROFILE of VOC emission
EMISSIONS VOC components
mln kg
per - vehicle category - road type
21
shown in Table 1.19A. The emission factors originate from the fact sheet "emissions of brake linings" drawn up by the Centre for Water Management of the Ministry of Public Works and Water Management. [ref 107: CWM]. It is assumed that the material emitted from brake linings is comprised for 49% of particulate matter (PM10) and for 20% of larger fragments. The remainder of the material (31%) remains "on the vehicle". The share of PM2,5 in PM10 is estimated 15% (see table 1.42). Wear of road surface caused by road vehicles The emissions of road particulate matter are calculated in the same way as the emissions of tyre and brake lining particulate matter. To link up with the earlier estimates of total road wear [WSV, 1994] it is assumed that the emission of road particulate matter is 1.6 times as large as that of tyre particulate matter emission. This factor is assumed to be independent of the statistical year. For the emission factors is referred to Table 1.15. In the same way as with tyre wear, it is assumed that 5% of the road particulate matter emission comprises particulate matter (PM10) and that the remainder therefore comprises larger fragments. The share of PM2,5 in PM10 is estimated 15% (see table 1.42) Figure 1.5 Calculating emissions from road traffic, emissions of particulate matter (PM10) caused by wear of tyres, brake linings and road surfaces
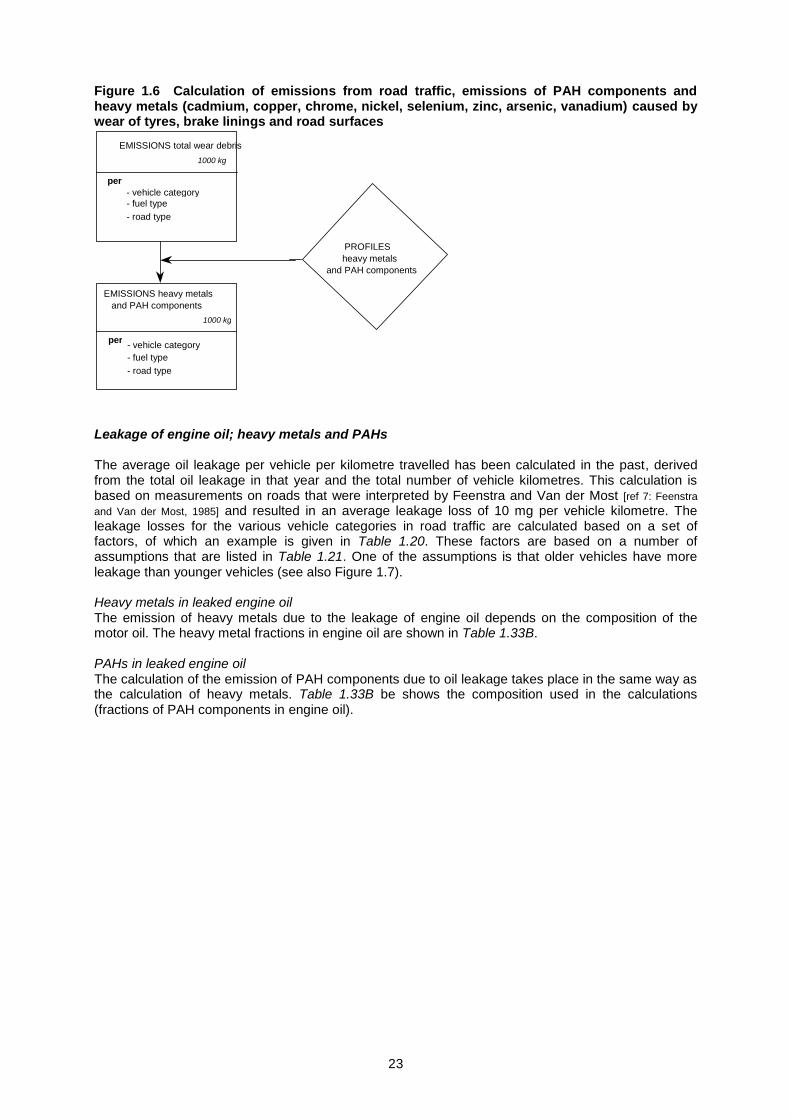
Wear of tyres, brakes and road surfaces; heavy metals and PAHs Heavy metals in tyre particulate matter emission The emissions of heavy metals caused by tyre wear are calculated by applying a profile of the composition of the total tyre material. This composition is shown in Table 1.29B. The heavy metals trapped in particulate matter are emitted to the air because it is assumed that 100% of particulate matter remains airborne. Heavy metals trapped in coarse particles fall back to the soil or the surface water. Within the urban area, it is assumed that 100% of coarse particles end up in water. Outside the urban area, a figure of 10% is used, and therefore 90% end up in the soil [ref 118: RWS Centre for Water
Management]. Heavy metals in brake particulate matter emission The emissions of heavy metals caused by the wear of brake linings are calculated by applying a profile of the composition of brake lining material. The composition profile is shown in Table 1.29B. This table is derived from Table 6 of the fact sheet "emissions from brake linings" [ref 107: RWS Centre for Water
Management]. For the allocation of the emissions of heavy metals to soil and water as a result of brake lining wear, the same percentages are used as with tyre wear emissions.
EMISSION FACTORS total wear debris
mg/ vehicle km per
vehicle category
EMISSIONS total wear debris 1000 kg
per
- vehicle category - fuel type - road type
per - vehicle category - fuel type - road type
VEHICLE KILOMETRES
1000 kg
per - vehicle category - fuel type - road type
PROFILES particulate matter/ larger debris
EMISSIONS particulate matter
22
Heavy metals in road surface particulate matter emission
The emissions of heavy metals from road surface wear were calculated in the past by using a profile of the composition of such fragments. A recent literature search showed that hardly any heavy metals are released from road surfaces, so calculations of this component are no longer carried out [ref 117:
RWS Centre for Water Management]. PAHs in road particulate matter emission In a recent literature search by TNO commissioned by the Centre for Water Management, new PAH emission factors have been introduced [ref 117: RWS Centre for Water Management]. This search shows that in 1990 85% of the binders used in rural road and motorway surfaces were tar-based (TAG). After 1991 TAG is no longer applied and replaced by asphalt with bituminous binding agents. Because of this the PAH-content of road surfaces is lowered by a factor of 1,000 to 10,000. The PAH-emissions from road surfaces constructed after 1990 are therefore negligible. PAH emissions only occur from driving on roads with a surface from before 1991. Due to the gradual replacement of asphalt the old TAG is disappearing more and more. It is estimated that in 2000 24% of the motorways and 51% of the rural roads contain TAG-asphalt. In 2004 this is reduced to 0% of the motorways and 27% of the rural roads. On roads in built-up areas a major part of the road network consists of non-asphalt roads. It is assumed that by now all asphalt applied before 1991 on roads in built-up areas, has been replaced. Effects of open graded asphalt mixes On motorways on which open graded asphalt mixes
5 are used, the coarse particles that fall onto the
road surface are partially trapped and are not washed to the soil or surface water. Because open graded asphalt mixes are periodically cleaned (approximately twice per year), these "trapped" coarse particles (containing heavy metals) are removed from the environment. Based on a memorandum from Centre for Water Management from 2000, [ref 6: Roovaart, J. van den] it can be determined that the emission of heavy metals to the soil and the water for open graded asphalt mixes is between 11 and 40 times lower than for closed graded asphalt mixes. For PAHs, this is a factor of 2.5. In the meantime, a large percentage of the motorways have been provided with a top layer of open graded asphalt mixes. Table 1.32(B) shows this percentage. The table also shows the factors for heavy metals and PAHs with which the total quantities of heavy metals and PAHs that are deposited on open graded asphalt mixes must be multiplied to calculate the heavy metals and PAHs that are washed off the road surface. The table shows that in 2012, due to the application of open graded asphalt mixes, the emission of heavy metals to the soil and surface water near motorways is approximately 56% lower than the case would be without this application. Allocation to soil and surface water The allocation of the coarse particle emissions to water and soil is different for the urban area, rural roads and motorways, because the washing down characteristics for these road types differ. When the coarse particles fall within the urban area, a percentage is washed away via the sewage system into the surface water, and this material is therefore indirectly considered to be emission to surface water. The emission factors of tyre wear, brake lining wear and road surface wear, expressed in mg per vehicle kilometre, are shown in Table 1.19A. The profiles with respect to the allocation to water and soil (and air) are shown in Table 1.19B. For the backgrounds used to ascertain these emission factors and profiles there is referred to the fact sheets of the Centre for Water Management: ‘Emissions from brake linings’, ‘Emissions from road traffic tyre wear’, and ‘Emissions from the wear of road surfaces due to road traffic’ [ref 107, 118, and 117 : RWS Centre for Water Management].
5 known as “ZOAB” in the Netherlands
23
Figure 1.6 Calculation of emissions from road traffic, emissions of PAH components and heavy metals (cadmium, copper, chrome, nickel, selenium, zinc, arsenic, vanadium) caused by wear of tyres, brake linings and road surfaces
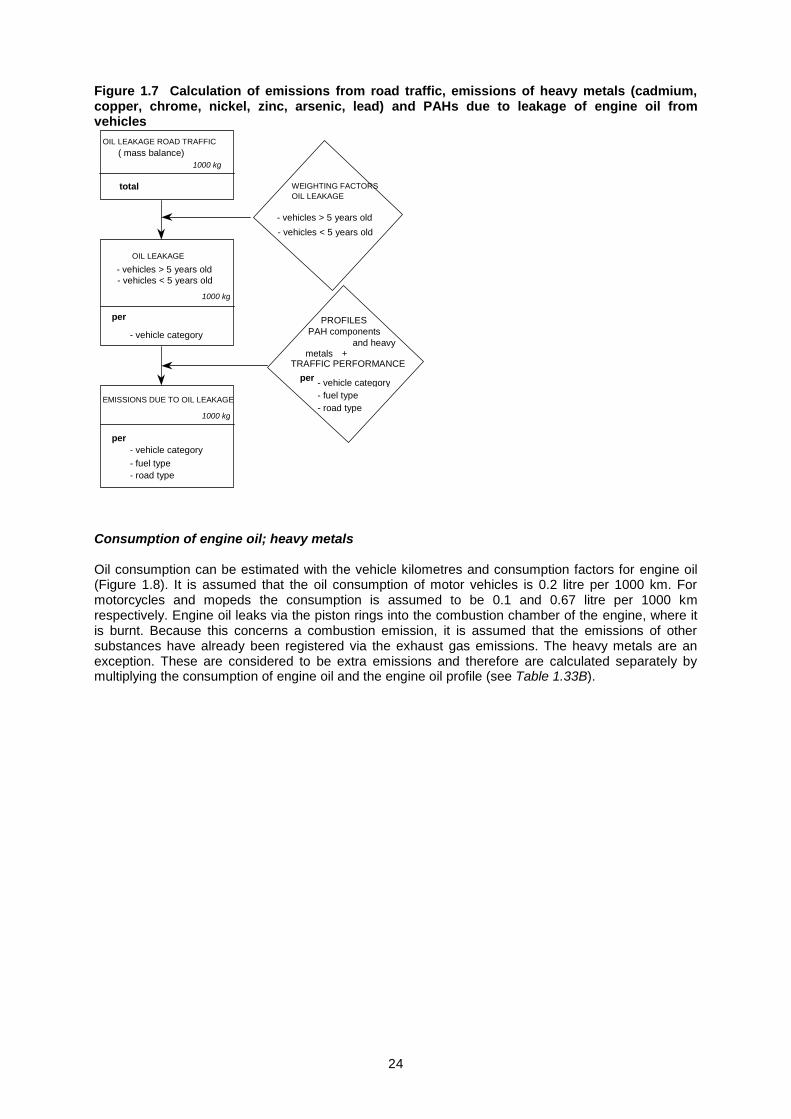
Leakage of engine oil; heavy metals and PAHs The average oil leakage per vehicle per kilometre travelled has been calculated in the past, derived from the total oil leakage in that year and the total number of vehicle kilometres. This calculation is based on measurements on roads that were interpreted by Feenstra and Van der Most [ref 7: Feenstra
and Van der Most, 1985] and resulted in an average leakage loss of 10 mg per vehicle kilometre. The leakage losses for the various vehicle categories in road traffic are calculated based on a set of factors, of which an example is given in Table 1.20. These factors are based on a number of assumptions that are listed in Table 1.21. One of the assumptions is that older vehicles have more leakage than younger vehicles (see also Figure 1.7). Heavy metals in leaked engine oil The emission of heavy metals due to the leakage of engine oil depends on the composition of the motor oil. The heavy metal fractions in engine oil are shown in Table 1.33B. PAHs in leaked engine oil The calculation of the emission of PAH components due to oil leakage takes place in the same way as the calculation of heavy metals. Table 1.33B be shows the composition used in the calculations (fractions of PAH components in engine oil).
EMISSIONS total wear debris 1000 kg
per - vehicle category - fuel type - road type
EMISSIONS heavy metals and PAH components
1000 kg
per - vehicle category - fuel type - road type
PROFILES heavy metals and PAH components
24
Figure 1.7 Calculation of emissions from road traffic, emissions of heavy metals (cadmium, copper, chrome, nickel, zinc, arsenic, lead) and PAHs due to leakage of engine oil from vehicles
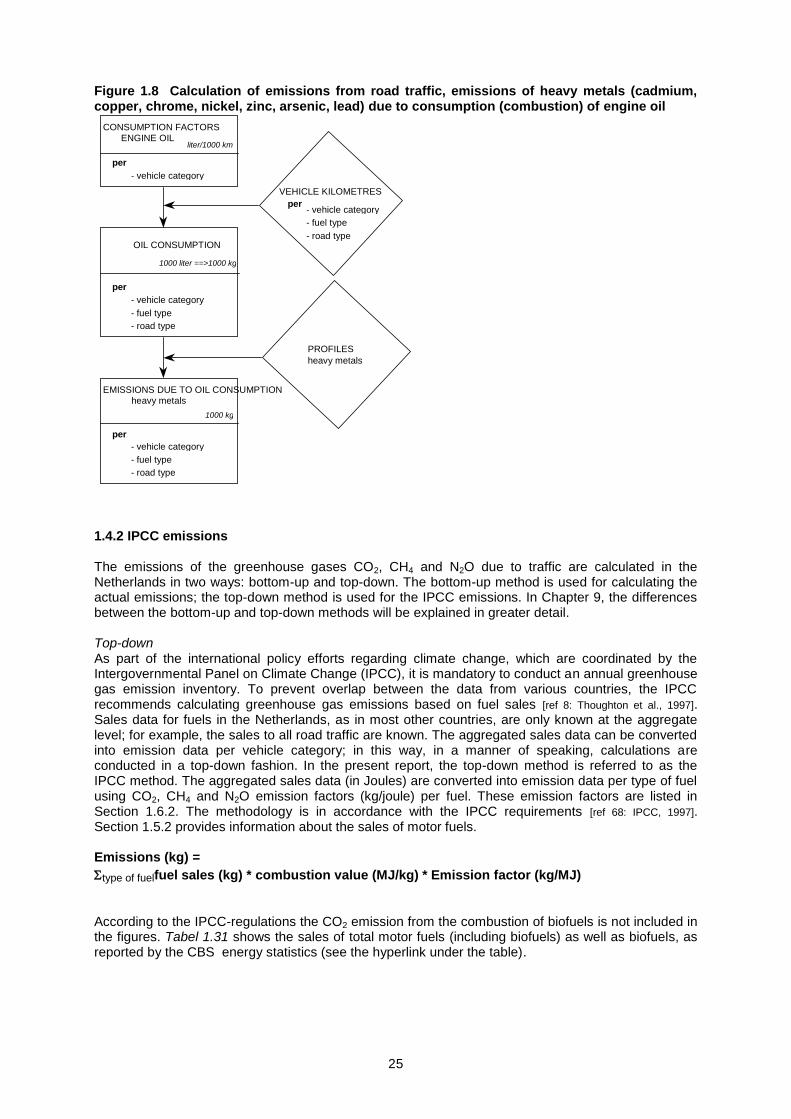
Consumption of engine oil; heavy metals Oil consumption can be estimated with the vehicle kilometres and consumption factors for engine oil (Figure 1.8). It is assumed that the oil consumption of motor vehicles is 0.2 litre per 1000 km. For motorcycles and mopeds the consumption is assumed to be 0.1 and 0.67 litre per 1000 km respectively. Engine oil leaks via the piston rings into the combustion chamber of the engine, where it is burnt. Because this concerns a combustion emission, it is assumed that the emissions of other substances have already been registered via the exhaust gas emissions. The heavy metals are an exception. These are considered to be extra emissions and therefore are calculated separately by multiplying the consumption of engine oil and the engine oil profile (see Table 1.33B).
OIL LEAKAGE ROAD TRAFFIC ( mass balance)
1000 kg
total
1000 kg
EMISSIONS DUE TO OIL LEAKAGE
1000 kg
per - vehicle category - fuel type - road type
PROFILES PAH components and heavy metals
WEIGHTING FACTORS OIL LEAKAGE
- vehicles > 5 years old - vehicles < 5 years old
OIL LEAKAGE - vehicles > 5 years old - vehicles < 5 years old
- vehicle category
per
TRAFFIC PERFORMANCE per
- vehicle category - fuel type - road type
+
25
Figure 1.8 Calculation of emissions from road traffic, emissions of heavy metals (cadmium, copper, chrome, nickel, zinc, arsenic, lead) due to consumption (combustion) of engine oil
1.4.2 IPCC emissions The emissions of the greenhouse gases CO2, CH4 and N2O due to traffic are calculated in the Netherlands in two ways: bottom-up and top-down. The bottom-up method is used for calculating the actual emissions; the top-down method is used for the IPCC emissions. In Chapter 9, the differences between the bottom-up and top-down methods will be explained in greater detail. Top-down As part of the international policy efforts regarding climate change, which are coordinated by the Intergovernmental Panel on Climate Change (IPCC), it is mandatory to conduct an annual greenhouse gas emission inventory. To prevent overlap between the data from various countries, the IPCC recommends calculating greenhouse gas emissions based on fuel sales [ref 8: Thoughton et al., 1997]. Sales data for fuels in the Netherlands, as in most other countries, are only known at the aggregate level; for example, the sales to all road traffic are known. The aggregated sales data can be converted into emission data per vehicle category; in this way, in a manner of speaking, calculations are conducted in a top-down fashion. In the present report, the top-down method is referred to as the IPCC method. The aggregated sales data (in Joules) are converted into emission data per type of fuel using CO2, CH4 and N2O emission factors (kg/joule) per fuel. These emission factors are listed in Section 1.6.2. The methodology is in accordance with the IPCC requirements [ref 68: IPCC, 1997]. Section 1.5.2 provides information about the sales of motor fuels. Emissions (kg) =
type of fuelfuel sales (kg) * combustion value (MJ/kg) * Emission factor (kg/MJ)
According to the IPCC-regulations the CO2 emission from the combustion of biofuels is not included in the figures. Tabel 1.31 shows the sales of total motor fuels (including biofuels) as well as biofuels, as reported by the CBS energy statistics (see the hyperlink under the table).
CONSUMPTION FACTORS ENGINE OIL liter/1000 km
1000 liter ==>1000 kg
EMISSIONS DUE TO OIL CONSUMPTION heavy metals
1000 kg
per - vehicle category - fuel type - road type
PROFILES heavy metals
OIL CONSUMPTION
per
VEHICLE KILOMETRES per
- vehicle category - fuel type - road type
- vehicle category per
- vehicle category - fuel type - road type
26
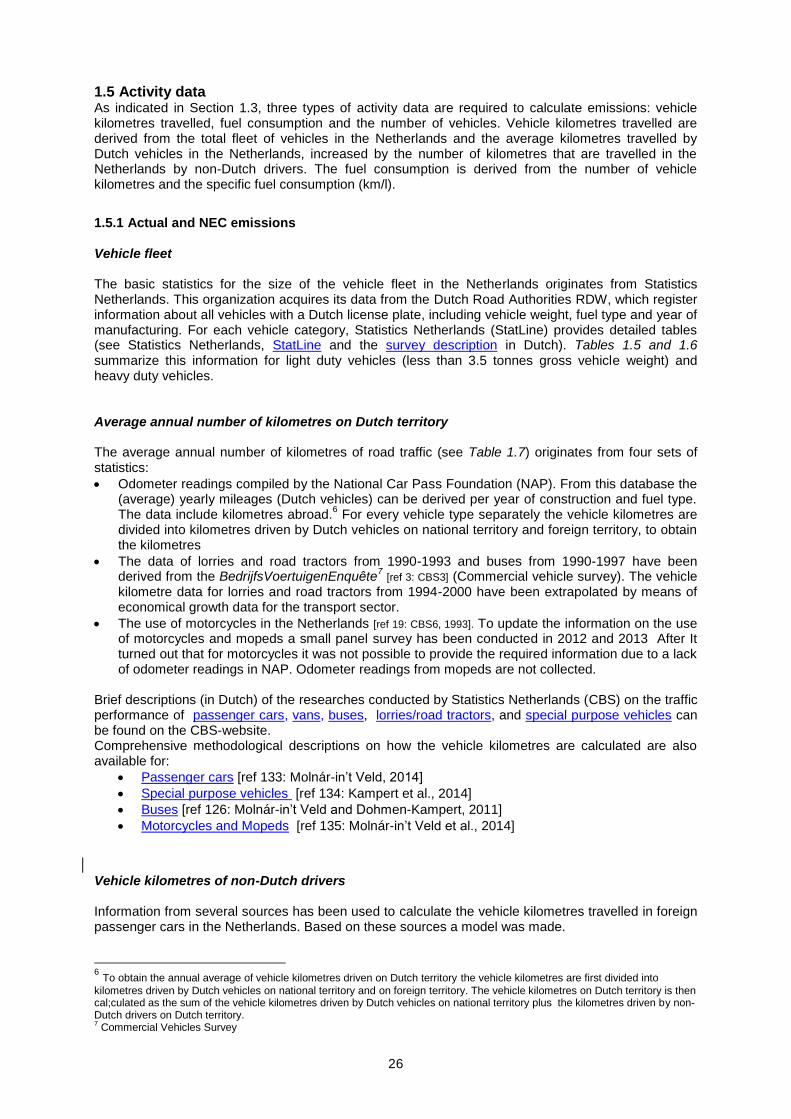
1.5 Activity data As indicated in Section 1.3, three types of activity data are required to calculate emissions: vehicle kilometres travelled, fuel consumption and the number of vehicles. Vehicle kilometres travelled are derived from the total fleet of vehicles in the Netherlands and the average kilometres travelled by Dutch vehicles in the Netherlands, increased by the number of kilometres that are travelled in the Netherlands by non-Dutch drivers. The fuel consumption is derived from the number of vehicle kilometres and the specific fuel consumption (km/l).
1.5.1 Actual and NEC emissions Vehicle fleet The basic statistics for the size of the vehicle fleet in the Netherlands originates from Statistics Netherlands. This organization acquires its data from the Dutch Road Authorities RDW, which register information about all vehicles with a Dutch license plate, including vehicle weight, fuel type and year of manufacturing. For each vehicle category, Statistics Netherlands (StatLine) provides detailed tables (see Statistics Netherlands, StatLine and the survey description in Dutch). Tables 1.5 and 1.6 summarize this information for light duty vehicles (less than 3.5 tonnes gross vehicle weight) and heavy duty vehicles. Average annual number of kilometres on Dutch territory The average annual number of kilometres of road traffic (see Table 1.7) originates from four sets of statistics:
Odometer readings compiled by the National Car Pass Foundation (NAP). From this database the (average) yearly mileages (Dutch vehicles) can be derived per year of construction and fuel type. The data include kilometres abroad.
6 For every vehicle type separately the vehicle kilometres are
divided into kilometres driven by Dutch vehicles on national territory and foreign territory, to obtain the kilometres
The data of lorries and road tractors from 1990-1993 and buses from 1990-1997 have been derived from the BedrijfsVoertuigenEnquête
7 [ref 3: CBS3] (Commercial vehicle survey). The vehicle
kilometre data for lorries and road tractors from 1994-2000 have been extrapolated by means of economical growth data for the transport sector.
The use of motorcycles in the Netherlands [ref 19: CBS6, 1993]. To update the information on the use of motorcycles and mopeds a small panel survey has been conducted in 2012 and 2013 After It turned out that for motorcycles it was not possible to provide the required information due to a lack of odometer readings in NAP. Odometer readings from mopeds are not collected.
Brief descriptions (in Dutch) of the researches conducted by Statistics Netherlands (CBS) on the traffic performance of passenger cars, vans, buses, lorries/road tractors, and special purpose vehicles can be found on the CBS-website. Comprehensive methodological descriptions on how the vehicle kilometres are calculated are also available for:
Passenger cars [ref 133: Molnár-in’t Veld, 2014]
Special purpose vehicles [ref 134: Kampert et al., 2014]
Buses [ref 126: Molnár-in’t Veld and Dohmen-Kampert, 2011]
Motorcycles and Mopeds [ref 135: Molnár-in’t Veld et al., 2014]
Vehicle kilometres of non-Dutch drivers Information from several sources has been used to calculate the vehicle kilometres travelled in foreign passenger cars in the Netherlands. Based on these sources a model was made.
6 To obtain the annual average of vehicle kilometres driven on Dutch territory the vehicle kilometres are first divided into
kilometres driven by Dutch vehicles on national territory and on foreign territory. The vehicle kilometres on Dutch territory is then cal;culated as the sum of the vehicle kilometres driven by Dutch vehicles on national territory plus the kilometres driven by non-Dutch drivers on Dutch territory. 7 Commercial Vehicles Survey
27
The vehicle kilometres travelled by foreign cars are devided into kilometres including overnight stay (holidays, business trip) and kilometres without overnight stay (commuting, shopping, family visits, day trips). A CBS-survey on acommodations during 1998-2012 has been used to estimate the number of kilometres with overnight stay.The estimation of kilometres without overnight stay is based on a German survey into traffic intensity at 9 German-Dutch border-crossings, carried out in 1998, 2003 and 2008. The years in between have been interpolated and 2008 has been extrapolated until 2011. Beside this data are used from UK travel trends from 1999-20012 and Reisonderzoek Belgiê 2004-2011. The traffic performance of foreigners during 1990-1997 has been extrapolated with the use of data from the Dutch Mobility Survey (OVG) and the ratio between the kilometres by Dutch citizens and foreigners during 1998-2004. The vehicle kilometres for vans are based on the odometer readings database (NAP) in combination with the vehicle characteristics data from the Road Authorities (RDW). To divide the total of vehicle kilometres for Dutch vans by territory, data are used from the Goods Transport Survey, Eurostat, and the 1993 survey of Commercial Vehicles (Bedrijfsvoertuigenenquête). The use of vans is largely regional. The average trip distance is 32 kilometres. Vans are used by professionals like construction workers, tradesmen, technicians, catering staff, care staff and for parcel delivery etc. Unlike transporters that use lorries and road trans, drivers of vans do not make many large trips. However, if they cross the border it will be often limited to border traffic. This applies not only to the use of Dutch vans but also to foreign vans. Unfortunately there are no data on kilometres driven with foreign vans on Dutch territory. We therefore made the assumption that the vehicle kilometres driven by Dutch vans outside the Netherlands, are more or less equal to those of foreign vans on Dutch territory. From the Goods Transport Surveys from 1997 to 2008 is derived that the kilometres of Dutch vans on foreign territory is on average 4 percent of the total kilometres driven. According to the assumption made, the total kilometres of foreign vehicles driven on Dutch territory has been equated with Dutch vehicle kilometres abroad. In 2012 the Goods Transport Survey (conducted by Statistics Netherlands) was expanded with additional questions about vans. From this study followed that of the total kilometres driven by Dutch vans in 2012 on average 4,1 percent is driven on foreign territory. The vehicle kilometres travelled with foreign trucks [ref 23: CBS10] are based on the statistics concerning "goods transport on the roads
8" as well as similar data based on Goods Transport Surveys
from other EU countries as collected by Eurostat. The vehicle kilometres travelled with foreign buses are determined by using a model which is divided into 4 sections. The main sources per section are:
1. Transport by foreign coaches in the Netherland for stays of more than one day. The main source is a CBS tourism survey on accomodation [CBS, 1998-2012] with data concerning the number of guests, overnight stays and destinations per country of origin. Travelled distances are calculated with a route planner.
2. Transport by foreign coaches in the Netherlands for day trips (so without overnight stays). The main sources are a CBS survey on daytrips and ‘UK Travel Trends’ (1998-2012).
3. Transport by foreign coaches through the Netherlands (drive through). For this purpose data have been used from ‘UK Travel Trends’ en the Belgian Travel Survey. In addition to this a route planner was used to calculate distances from border to border.
4. Transport by foreign buses in the Netherlands as part of regular bus services in the border regions. For this purpose information has been used from timetables (http://www.grensbus.nl/" and "http://wiki.ovinnederland.nl). Besides this Google Maps was used for a division of the bus lines into kilometres inland and abroad.
Also in case of the estimation of foreign coaches in the Netherlands several additional sources from different countries have been consulted, for instance:
Report “Reiseanalyse Aktuell RA” (Forschungsgemeinschaft Urlaub und Reisen (FUR), 2002-2012): the percentage of holiday trips by Germans by bus, to the Netherlands, and to Western Europe, and the total number of holiday trips of 5 days and longer.
Statistics on incoming Tourism (CBS, 2006): The percentage of foreign guests coming to the Netherlands by bus.
The publication ”Bustransport of passengers” (Eurostat/DG Tren, 1990-2000): for the number of passenger kilometres per bus or coach per EU country
8 Based on the Goods Transport Survey
28
The publicatie "EU energy and transport in figures; statistical pocketbook 2012" (Eurostat /EC,1990-2010): traveller kilometres per bus or coach per EU country.
The publication "Statistisches Jahrbuch 2004" (Statistisches Bundesamt, 2004): total number of trips per bus to the Netherlands.
"Reisonderzoek" (Algemene Directie Statistiek en Economische Informatie, 2000-2011) Belgium: total number of trips to the Netherlands by bus.
"UK Travel Trends" (Office for National Statistics, 2000-2012): total number of trips to the Netherlands, totals and by bus
"Movimientos turísticos de los españoles (FAMILITUR)" (Instituto de turismo de Espana, 1999-2012): percentage travels by bus.
More information about vehicle kilometres, method descriptions and results (in Dutch) can be found in: Verkeersprestaties autobussen, Methodebeschrijving en resultaten [ref 126: Molnár-in’t Veld en Dohmen-
Kampert, 2011]. The way the vehicle kilometres of foreign special purpose vehicles on Dutch territory are calculated is described in a methodological report on Vehicle kilometres by special purpose vehicles [ref 134: Kampert
et al., 2014] Vehicle kilometres by road traffic, totals The traffic data used in the emission calculations are shown in tables 1.7 to 1.11 of the set of tables. A major part of these data has been published in CBS Statline, namely the vehicle kilometres of passenger cars, vans, lorries, road tractors, buses and special purpose vehicles. Allocation of vehicle kilometres to road category The emission factors (see previous section) are generally differentiated according to three road types:
Roads within the urban area Motorways Other roads outside the urban area (rural roads).
In order to calculate emissions, the vehicle kilometres travelled must also be differentiated according to road type. To allocate vehicle kilometres travelled to the above road types, data from Statistiek van de wegen
9 have been used in the past [ref 18: CBS5]. The most recent data relate to 1997. Due to all
sorts of problems it was impossible to bring these figures up to date. For this reason the Goudappel & Coffeng Agency performed an inquiry, commissioned by the Emission Registration, into the allocation of vehicle kilometres. The results and backgrounds can be found on the site of the Emission Registration in the report ‘Onderzoek naar de wegtypeverdeling en samenstelling van het wegverkeer’. The results refer to 2007. Based on the surveys mentioned above, table 1.12 shows the allocation according to road type for 1990, 1995, 2000 and 2005-2012. Share of vehicle classes in the vehicle kilometres per vehicle category The emission factors (see previous section) are frequently differentiated per vehicle category according to various weight classes and vehicle classes (the basic emission factors). The basic emission factors are aggregated into year-of-manufacturing emission factors based on the share of the weight classes and vehicle classes in the sales of new vehicles during a specific year. It is assumed that the number of kilometres per year is independent of the vehicle class. The weighting according to weight class is based on the database of the National Car Passport Autopas (NAP) [ref110: NAP, 2006] and BVE [ref3: CBS]. Tables 1.3 and 1.4 contain weighting factors to aggregate the basic emission factors to year of manufacturing factors. For more information, see Section 1.6.1. Fuel consumption of road traffic Fuel consumption is derived from the vehicle kilometres travelled and specific fuel consumption (km/l), originating from surveys (now abolished) such as the PAP (Passengercar Panel), the BVE (Commercial vehicles), and the motorcycle owners survey. These specific fuel consumption figures urgently require revision. As figures about energy consumption are mainly of interest for the determination of CO2 emissions and for policy purposes (IPCC) CO2 emissions are based on fuel
9 Road statistics

29
sales, a revision of the calculation of fuel consumption does not have a high priority. A start has been made of a calculation method based on car energy labels, the central car register, and the NAP. At the moment several essential data are yet lacking, in particular with regard to energy labelling. This year the existing methodology is used. In order to directly allocate fuel-consumption-dependent emissions according to road type, ratio factors were determined using the former "TNO-VERSIT" model [ref 46: Lefranc, 1999] (see also Section 1.6.1.1). With these ratio factors, the fuel consumption for the three road types can be derived from the average fuel consumption. See Table 1.40B for these ratio factors.
30
1.5.2 IPCC emissions Sales of motor fuels Statistics Netherlands reports total sales of petrol, diesel and LPG to road traffic in CBS-StatLine in the table ‘Motor fuels for transport; deliveries ’ (in Dutch only). A description of the survey can be found in Crude oil and petroleum products. The sales of biofuels, which are included in the total sales, are published in Statline separately (also in English). N.B. In the road traffic IPCC figures, the CO2 emission from the combustion of biofuels is excluded. A subdivision according to road traffic categories cannot be made based on the data used by Statistics Netherlands. In the IPCC method, these total sales are disaggregated according to the various road traffic categories in accordance with their share in energy consumption (see Section 1.5.1). Note that total greenhouse gas emissions due to road traffic in the IPCC method are therefore related to total fuel sales. However, when the energy consumption by road traffic is compared with the energy sales to road traffic, there are differences. The reasons for these differences are the following:
stockpiling is included in sales; both approaches (consumption and sales) contain statistical inaccuracies; in calculating the energy consumption, specific vehicle categories were not included that are
included in the sales figures. This concerns military vehicles and foreign diplomatic vehicles; " fuel purchases at the border". This concerns fuel purchased in the Netherlands (included in
sales) that is used abroad (not included in consumption) or fuel purchased abroad (not included in sales) that is used in the Netherlands (included in consumption).
These items cause an absolute difference per year, but due to the nature of the differences (such as fuel purchases at the border and stockpiling), the increase or decrease from year to year between energy consumption and energy sales also differs. .
31
1.6 Emission factors 1.6.1 . Actual and NEC emissions Government policy pays a great deal of attention to the combustion emissions from road traffic of CO, VOC, NOx, PM10, N2O and NH3. Therefore this section will extensively address the calculation of the emissions of these substances from road traffic. During this process, a distinction is made between the vehicle emissions regulated by the European Union (CO, VOC, NOx and PM10) and the non-regulated N2O and NH3 emissions. The calculation begins with ascertaining the basic emission factors (grams per vehicle kilometre) per weight class, vehicle class, year of manufacturing and road type. Table 1.1 shows the weight classes and table 1.2 environmental vehicle classes used. Because the amount of vehicle kilometres travelled is not known per vehicle class, but is known per weight class, the basic emission factors are aggregated into year-of-manufacturing factors. This takes place by firstly weighting the basic emission factors with the share of the various vehicle classes (= a combination of weight and vehicle classes) in the sales of new vehicles during a specific year. Then the vehicle kilometres travelled per weight class, vehicle class and year of manufacturing are obtained based on the annual number of kilometres per weight class and year of manufacturing. Tables 1.3 and 1.4 show the percentage of the various weight and vehicle classes for each vehicle category in the total vehicle fleet per year of manufacturing. The results of the calculations of the year of manufacturing emission factors for 2009 are shown in tables 1.13 - 1.15. Tables 1.36 - 1.39 give the basic emission factors, inclusive of correction factors. In 2011 TNO carried out a project on the emissions by powered two wheeled vehicles [ref 130: Dröge, R.
et al]. The results have been used in the 1990-2011 emission calculations. Based on this project, table 1.43 shows the average annual emission factors (CO, VOC, NOx and PM10) for motorcycles and mopeds during 1990-2011. The emission factors for evaporation are shown in Tables 1.17 and 1.18 and will be addressed in Section 1.6.1.4. Emission factors for the combustion of motor fuels; CO, VOC, NOx and particulate matter (PM10) The basic emission factors are calculated using VERSIT+ version 2b [ref : Smit et al, 2006a; 2007]. The following formula is used to determine the basic emission factor per vehicle class and road type Emission factor = BASw + BASw * (AGEw-1) + BASw * (ACCESSORIES-1) * PERCac + PERCc * BASc * AGEc Where:
BASw emissions per travelled kilometre for a hot engine, excluding the effect of ageing
AGEw the effect of ageing on “hot driving”, depending on the year of use
ACCESSORIES the effect of the presence of accessories, especially air conditioning
PERCac percentage of vehicle kilometres travelled with air conditioning switched on
PERCc average number of cold starts per kilometre travelled
BASc total extra emissions caused by driving with a cold engine
AGEc the effect of ageing on the extra emissions caused by “cold start”, depending on the year of use
Each of the above parameters is shown per road type:
urban area (RT1)
rural roads (RT2)
motorways (RT3) This section also contains a brief description of the backgrounds for ascertaining the above parameters.
32
In-use compliance programme and dedicated measuring programmes Since 1987, the basis for the recent emission factors of regulated components (CO, VOC, NOx and PM10) has been the annual in-use compliance programme of TNO. As part of this programme, every year dozens of passenger cars and trucks (including many common makes and models
10) have
been tested, primarily using the type approval test cycle. In the past, more vehicles were tested each year. In addition, supplementary (real-world) measurements are conducted on the available vehicles. The vehicles that are tested are selected so that they provide a good reflection of the total fleet of vehicles on Dutch roads over the years. In this process, the study takes account of vehicle sales, type of fuels, vehicle class (Euro1, Euro2, etc.) and year of manufacturing. The vehicles were, in the past,obtained by writing to the users of the selected vehicle types and asking whether or not they would be willing to submit their vehicle for a test. The response to this request is relatively low, about 25%, and has been relatively constant in recent years. As part of the final choice of the vehicles to be tested, an important criterion is that there is sufficient spread in mileages and regular maintenance. In addition, both privately owned and leased vehicles are tested. In this way, the tested vehicles reflect the average usage and maintenance condition of the total fleet of vehicles in the Netherlands. Nowadays, vehicles are often provided by rental companies and commercial parties. When they are submitted for testing, the vehicles are subjected to an NEDC type approval test, after which the measurement values are compared with the type approval values for the relevant vehicle (how high were the emissions of this type when the official type approval took place?) and with the applicable emission norms. The vehicles that did not pass the test were adjusted and measured again. In recent years there has been a sharp decline in the number of cars that don’t comply to the existing norms. On average petrol fuelled cars always comply, for diesel cars this is the case to a lesser degree. For the purpose of calculating the emissions from passenger cars TNO uses the measured emission factors before any maintenance is conducted. As a result, poorly tuned and/or poorly maintained vehicles are also included in the emission calculation. During the course of time the emphasis of the in-use compliance programme has moved more and more to map out real-world emission performances and not the execution of European NEDC type approval test cycles on new vehicles. This is to prevent the underestimation of the real vehicle emissions. VERSIT+ warm basic emission factors (BASw)
Since 2005, TNO Environmental Studies and Testing (TNO EST) uses the VERSIT+11
Traffic situation model [ref 113: Smit et al, 2007] to calculate the basic emission factors from the emission measurements database. With the use of VERSIT+ exact emission factors can be calculated for different traffic situations and scale levels [ref 119 Ligterink, N.E., Lange, R. de, 2009]. The emission factors follow from various analysis fed by different kinds of measuring data. VERSIT+ LD (light duty) has been developed for light vehicles, as passenger cars and vans, with which accurate emissions can be predicted of streams of traffic in specific traffic situations [ref 111 : Smit
et al, 2006a, 2007]. For the dsetermination of the basic emission factors (BASw) of light duty vehicles first the driving behaviour dependance and the statistical varation per vehicle has been investigated. Next the results have been used in a model with 42 light duty categories for each of the 5 emission components. The resulting model separates optimal driving behaviour and vehicle category dependances. VERSIT+ HD (heavy duty) [ref: Riemersma, 2004] is used to predict the emission factors of heavy duty vehicles (lorries, road tractors and buses). For older vehicles VERSIT+ HD is used with input based on European measurement data. These data have been obtained with less realistic tests, meaning that in some cases only the engine has been tested and in other cases measurements have been executed with several constant engine loads and engine speeds (rpm). For newer vehicles (Euro-III – Euro-V) measurement data are available which are closer to the real world practice. These new data are based on realistic driving behaviour, both from on-road measurements and measurements on test stands, have been used in a model to represent emissions during standard driving behaviour. The emission factors for buses often originate from test stand measurements with realistic driving behaviour for regular service buses. For the determination of the emission factors the PHEM model was used which has been developed by the Graz University of Technology. For older vehicles, pre-Euro-III the emission factors are still
10
vehicle type = manufacturer + model + motor type, for example Ford Escort 1.3 ICL 11
VERkeers SITuatie Model Plus, meaning traffic situation model plus
33
based on this model. Euro-III and later are based on in-house on-road measurements. [Ref. 131] The input is, just as for VERSIT+ LD, composed of speed-time diagrams which make the model suitable for the prediction of emissions in varying traffic situations. For the Emission Registration emission factors per vehicle class are calculated, specifically for the Dutch situation. Over the years, for most vehicle categories a many measurement data have become available; this means that the reliability of VERSIT+ is relatively high. However, individual vehicles can have large deviations from the average. TNO has even ascertained large variations of the measured emissions between two sequential measurements of the same vehicle. This is not the result of measurement errors, but of the great susceptibility of the engine management system, especially on petrol and LPG vehicles, to variations in how the test cycle is conducted on the dynamometer. VERSIT+ is used to predict emissions in specific traffic situations [eg. ref : Smit et al, 2006b], but can also be used to predict emission factors on a higher level of aggregation, like in this case. VERSIT+ cold start emissions (BASc and PERCc) The cold start emission is seen as an absolute extra emission per cold start. This emission is added for each road type to the emissions of the warm motor/catalyst. The advantage of this calculation method with respect to using a elevation factor is that if the emissions are reduced by half with a warm motor/catalyst, for example by replacing an old catalyst with a new one (with an increased conversion efficiency during warm operating conditions), the calculated average emissions during a cold start will scarcely change.
The extra emissions are expressed in grams per cold start. The measurements are done by testing the vehicles on the dynamometer using a real-world driving cycles with both a cold engine as well as a warmed-up engine. The difference in emissions between the cold engine and the warmed-up engine for the whole cycle is the cold start emission. For spark-ignition vehicles the cold-start emission dominates the total emission on the test. For compression ignition engines the effects of cold start is only limited, and not necessarily an increase in emission.
The extra emissions for heavy commercial vehicles are assumed to be zero, due on the one hand to the small quantity of extra emissions per cold start (diesel) and on the other hand to the much lower number of cold starts in relationship to the number of kilometres travelled.
To complete the calculation, information was also required about the occurrence of cold starts. Based on the OVG 1995 (CBS, 1996), it was determined that the average trip length is 14.5 km and the number of starts (cold plus warm) per travelled kilometre is therefore approximately 0.07 (equal to 6333/91,878).
After this, an estimation was made for each motive concerning the number of cold starts in the total number of starts. For the motives commuting, visiting/stays, education and touring/hiking it can be stated with a large degree of certainty that virtually every start of the passenger car is with a cold motor/catalyst. For the other motives, the percentages are relatively arbitrary. On average, based on the assumptions about the percentage of cold starts per motive, it has been determined that approximately 60% of the starts are cold starts. The total number of cold starts per travelled kilometre is therefore 0.04. The allocation of cold starts inside and outside the urban area is based on the distribution of the number of households inside and outside the urban area, combined with differences in vehicle ownership per household between non-urban and urban areas. It is assumed that on the third road type (motorway) there are only vehicles driving with warm engines and exhaust gas treatment devices, as in all cases one has to drive to the motorway. Based on this information, it has been determined that approximately 95% of all cold starts take place within the urban area. In 1995, according to Statistics Netherlands, approximately 25% of the passenger vehicle kilometres took place within the urban area, and more than 35% on rural roads. From this information can be derived that the number of cold starts per passenger car kilometre within the urban area is approximately 0.15 and for rural roads approximately 0.005. These values use the emission calculations for all categories of passenger cars, despite the intuitive perception that the average trip length of small vehicles is less than large vehicles, and therefore the number of starts per kilometre is higher. This is counterbalanced by the fact that small vehicles are especially used for motives where relatively fewer starts take place with a cold motor.
34
VERSIT+ Aging (AGEw and AGEc) The effects of vehicle aging are determined using data from the in-use compliance programme of TNO. The sample includes multiple vehicles with different odometer readings of various vehicle types (for example a Volkswagen Golf or a Peugeot 205). By comparing the emissions at different odometer readings a trend in emission increase or decrease can be observed dring the course of time. The running-in period of several thousand of kilometres is not taken into account.
A distinction is made according to the effect of ageing on the emission factor with a warm motor and and exhaust gas treatment techniques and according to the effect of ageing on the extra emissions following a cold start. In the case of a warm engine the change in emissions due to ageing is primarily determined by the fact that the conversion efficiency of the warm catalyst declines in the course of time and is also caused by ageing of technical aspects of the motor in the form of, for example, wear of piston rings and valves. In the case of a cold engine the change in emissions due to ageing is caused by the fact that it takes longer for the exhaust gas treatment device to come up to an appropriate temperature (and its maximal conversion performance). VERSIT+ air conditioner effects (ACCESSORIES and PERCac) The percentage of new passenger cars that are equipped with air conditioners has increased rapidly in recent years. The RAI
12 has calculated that this percentage was 45% in 1998 and in recent years a
large majority of (new) cars is equipped with such a device. For the determination of the correction factors for the use of air conditioners, measurements performed by EMPA [Weilenmann, 2005] are used. EMPA has measured vehicles under different circumstances (regarding temperature and time in the sun). TNO EST has used these measurements to derive correction factors for the Dutch situation. The only EMPA measurements used are the measurements where the vehicle had top be kept at a certain temperature by the air conditioner.
In the TNO study conducted for NOVEM [ref 35: Gense, 2000], additional tests were performed on 5 vehicles, with and without the air conditioning turned on. During the measurements with the air conditioning on, it was left turned on full during the entire test. This is an extreme situation that virtually never occurs in practice. Under normal conditions of use, depending on the weather, the air conditioning operates at full capacity for only a portion of the travel time. As a result, the measurements reflect a "worst-case situation".
The most important reason for the ascertained negative effects resulting from the use of air conditioners is that the engine management system is generally not adjusted to the use of an air conditioner because during the vehicle type approval test, the air conditioner can remain turned off. The use of an air conditioner affects the operation of the lambda control system, which causes the conversion efficiency of the catalyst to decrease. In addition, even without deterioration of the lambda control, the increase in the total energy being generated leads to increased emissions and fuel consumption.
For diesel vehicles, an air conditioner operating at full capacity sometimes leads to a decrease in emissions. The reason for this is that diesel engines emit more components resulting from incomplete combustion (CO and VOC) when the motor has a relatively low load than with a higher load. In some cases, the increased motor load that is linked with the use of the air conditioner therefore has a beneficial effect on the emissions. The effect with a cold motor has not been ascertained by the TNO, but it is expected that there will be a neutral emission behaviour because a small increase in engine emissions (with a cold catalyst) will be compensated by a shorter warm-up time for the catalyst (due to the higher load on the motor). The fuel consumption, in contrast, will increase in a similar fashion as with a warm motor due to the increased load on the engine.
No data are known about the average use duration of vehicle air conditioners in the Netherlands. Research from France has shown that vehicle air conditioners are used on average 200 hours per year. TNO has calculated that the average passenger car is used for 570 hours per year. If is assumed that air conditioners in vehicles in the Netherlands, due to the colder climate, are used for only 100 hours per year, and that the average driving speed does not differ between driving with the air conditioner on or off, then the percentage of kilometres that are travelled with the air conditioner on is approximately 18%.
12
Mobility sector organization
35
Emission factors for the combustion of motor fuels; N2O and NH3 N2O The emission factors of passenger cars for each vehicle class, fuel type and road type are based on recent research conducted by TNO [ref 34: Feijen-Jeurissen et al., 2001]. This research indicates that the newest petrol-fuelled vehicles emit less N2O than the first generation of such vehicles with a three-way catalyst. The extent to which this difference concerns technical advances or ageing cannot be derived from the research results. Table 1.16 shows the basic emission factors as measured in the TNO study. For other vehicle categories, the default values as given by the IPCC have been used [IPCC, 1996]. These factors are also shown in Table 1.16. It should be noted that the emission factors provided by the IPCC for heavy diesel vehicles (including trucks) are significantly higher than those found in the TNO study. In the TNO study, a single measurement was conducted on a heavy diesel engine, which showed that the relevant diesel engine did not emit any measurable amounts of N2O. Nevertheless, in the emission method the IPCC default values will be used for the time being due to the very limited number of measurements in the TNO study. There is a great deal of uncertainty about N2O emissions, especially from heavy diesel vehicles. NH3 The emission factors for passenger cars for each vehicle class, fuel type and road type are based on recent, still unpublished research conducted by TNO-WT [ref 59: Winkel, 2002]. The TNO study measured the NH3 emissions of passenger cars that represent various Euro vehicle classes. The traffic task group therefore decided not to use emission factors per Euro class because these, in view of the small number of values, are too uncertain, especially for diesel passenger cars. For LPG vehicles it was chosen to calculate the average emission factor for LPG vehicles with a catalyst by taking the ratio of the emission factors of Euro2 LPG and Euro2 petrol vehicles and multiplying these with the average emission factor for petrol vehicles (see Table 1.16). The emission factors for passenger cars without catalysts and for other road vehicles originate from the COPERT III emission model of the EEA [ref 60:
Ntziachristos and Samaras, 2000]. Many modern heavy-duty vehicles have SCR after-treatment systems, with the risk of NH3 slip. In most cases the slip is limited. Emission factors for the combustion of motor fuels; SO2, CO2 and heavy metals The emission factors have been derived from the sulphur, carbon and heavy metal content of the motor fuels. Table 1.30 shows the fuel quality data for various statistical years for calculating the emissions of SO2 and lead. It is assumed that 75% of the lead leaves the exhaust as air-polluting particulates and that 95% of the sulphur is converted into SO2. The CO2 factors have been included in Table 1.31 for each type of fuel. The amounts of heavy metals in motor fuels are shown in Table 1.29A. It is assumed that the content of heavy metals (except lead) is independent of the statistical year. Emission factors for the evaporation of motor fuels The basic emission factors are shown in Table 1.17. These factors have been converted into average factors per vehicle, per day (see Table 1.18). The backgrounds concerning the origin and choice of the emission factors are described in Section 1.4.1. Other emission factors Particulate matter emission from tyres, brake linings and the road surface Table 1.19A shows the factors used. For the backgrounds, see Section 1.4.1; regarding the emission factors for brake wear, see the fact sheet "emissions from brake linings" [ref 107: RWS-Waterdienst]. Leakage losses and combustion of engine oil Table 1.20 shows an example set of the emission factors for 1996. The basis data for converting to emission factors according to the age of the vehicle are shown in Table 1.21. For the backgrounds, see Section 1.4.1: leakage and consumption. The heavy metal factors for engine oil in mg per kg of oil (leakage and consumption) are shown in Table 1.29A.
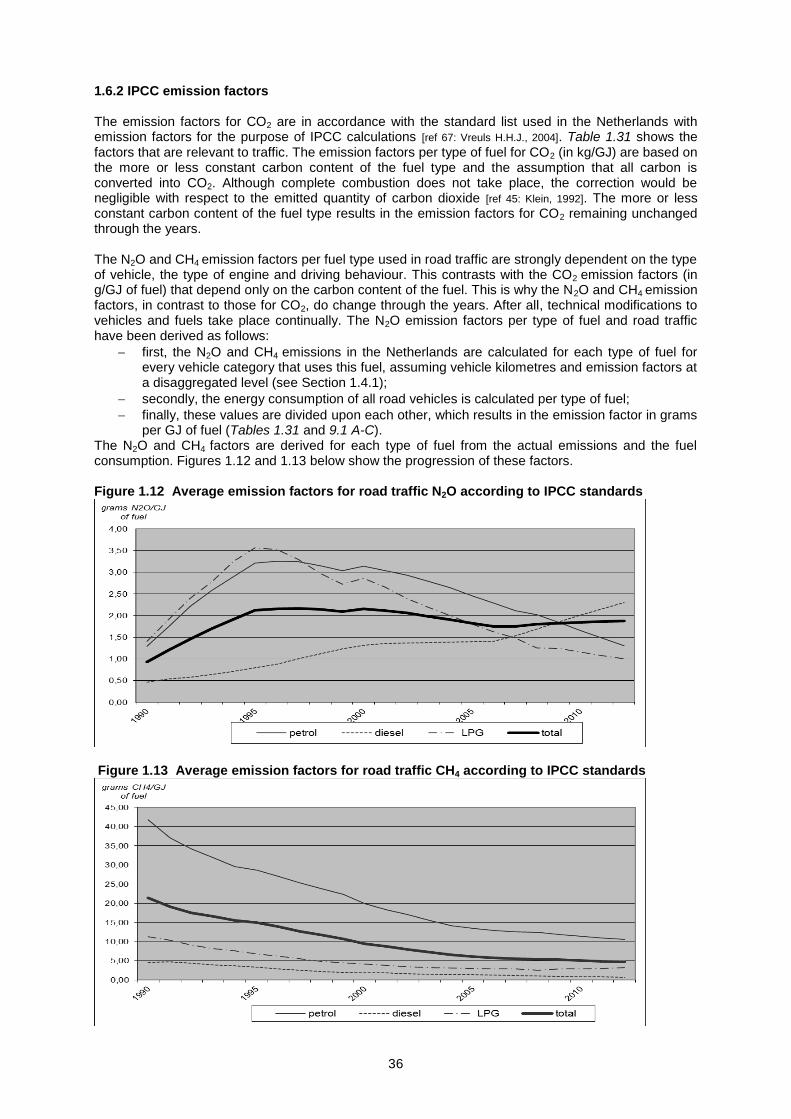
36
1.6.2 IPCC emission factors The emission factors for CO2 are in accordance with the standard list used in the Netherlands with emission factors for the purpose of IPCC calculations [ref 67: Vreuls H.H.J., 2004]. Table 1.31 shows the factors that are relevant to traffic. The emission factors per type of fuel for CO2 (in kg/GJ) are based on the more or less constant carbon content of the fuel type and the assumption that all carbon is converted into CO2. Although complete combustion does not take place, the correction would be negligible with respect to the emitted quantity of carbon dioxide [ref 45: Klein, 1992]. The more or less constant carbon content of the fuel type results in the emission factors for CO2 remaining unchanged through the years. The N2O and CH4 emission factors per fuel type used in road traffic are strongly dependent on the type of vehicle, the type of engine and driving behaviour. This contrasts with the CO2 emission factors (in g/GJ of fuel) that depend only on the carbon content of the fuel. This is why the N2O and CH4 emission factors, in contrast to those for CO2, do change through the years. After all, technical modifications to vehicles and fuels take place continually. The N2O emission factors per type of fuel and road traffic have been derived as follows:
first, the N2O and CH4 emissions in the Netherlands are calculated for each type of fuel for every vehicle category that uses this fuel, assuming vehicle kilometres and emission factors at a disaggregated level (see Section 1.4.1);
secondly, the energy consumption of all road vehicles is calculated per type of fuel;
finally, these values are divided upon each other, which results in the emission factor in grams per GJ of fuel (Tables 1.31 and 9.1 A-C).
The N2O and CH4 factors are derived for each type of fuel from the actual emissions and the fuel consumption. Figures 1.12 and 1.13 below show the progression of these factors. Figure 1.12 Average emission factors for road traffic N2O according to IPCC standards
Figure 1.13 Average emission factors for road traffic CH4 according to IPCC standards
37
1.7 Substance profiles 1.7.1 VOC caused by combustion of motor fuels VOC profiles and PAH profiles For the VOC profiles that are used to break down VOC emissions into individual components, a distinction is made according to the type of fuel. For petrol vehicles, a distinction is also made according to those with and without a catalyst, because the catalyst oxidizes certain VOC components more effectively than others. The profile shows the fractions of the various VOC components (approximately 40) in total VOC emissions. The VOC profiles per type of fuel originate from the literature studies conducted by TNO [ref 55: VROM,1993] and [ref. 125: Broeke, Hulskotte, 2009]. They are shown in Tables 1.34A and 1.34B. TNO is also the source of the PAH profiles, expressed in grams/kg of VOC emissions [ref 55: VROM,1993]
and [ref. 125: Broeke, Hulskotte, 2009]. Tables 1.34C and 1.34D show these profiles per type of fuel, where – like the VOC profiles – a distinction is made between petrol used with and without a catalyst and diesel fuelled vehicles from before and after 2000. In addition, petrol for two-stroke engines has a deviating profile, which is the result of the combustion of the motor oil that is present in the fuel. PM10-profile Table 1.42 shows the share of PM2,5 in the PM10 emissions. 1.7.2 VOC caused by evaporation of motor fuels The VOC components in the evaporative emissions are also calculated with a VOC profile that was ascertained by TNO (see Table 1.34A). This profile is based on “Emissiefactoren vluchtige organische stoffen uit verbrandingsmotoren”
13 [ref 55: VROM,1993] but has been modified because the maximum
benzene and aromatics content of petrol was reduced on 1 January 2000 due to EU legislation. The stricter requirements regarding benzene are shown in the table below. Table 1C Several emission-relevant requirements for motor petrol according to EN228
Parameter 1999 2000
Benzene content, vol. % (maximum) 5 1 Aromatics content, vol.% (maximum) - 42 Vapour pressure summer kPa (maximum) 80 60 Sulphur content, mg/kg (maximum) 500 150
The reduction of the content of benzene and aromatics in petrol has direct consequences for the benzene and aromatics content in the evaporative emissions of these petrol-fuelled vehicles. The link between the benzene content in petrol and the benzene content in the exhaust gas, however, is not unequivocal: at low speeds, according to Heeb et al. [ref 66: Heeb et al., 2002], the benzene content in the exhaust gas declines by 20-30% when the benzene content in the petrol declines from 2% to 1% per volume, while at high speeds the benzene content in the exhaust gas actually increases. Because this relationship is too complex to model in the Emission Inventory, and because the decline of the benzene content in exhaust gas is relatively small on balance, the traffic task group decided to leave the benzene content in the exhaust gas unchanged. However, the benzene content in petrol and in petrol vapour has been modified. In addition, the toluene content in petrol and petrol vapour has been corrected with retroactive effect for historical years. Although we know of no structural research regarding the enforcement of these internationally-applicable agreements, based on the best available information we have assumed that no structural violation of these requirements concerning motor petrol occurs in the Netherlands. In Belgium, it appeared that the petrol indeed contained less than 1% of benzene by volume in 2000, while in 1999, this was still more than 1% by volume [ref 62, 63: FAPETRO, 1999 and 2000]. A number of the emission profiles linked to petrol or petrol vapour that are applied in the Emission Inventory have therefore been modified. Based on the available information [ref 61: EU, 2002]; [ref 62: FAPETRO, 1999]; [ref 63: FAPETRO, 2000];
[ref 64: Machrafi and Mertens, 1999]; [ref 65: Shell, 2000], it was decided to use two emission profiles for benzene
13
VOC emission factors from combustion engines
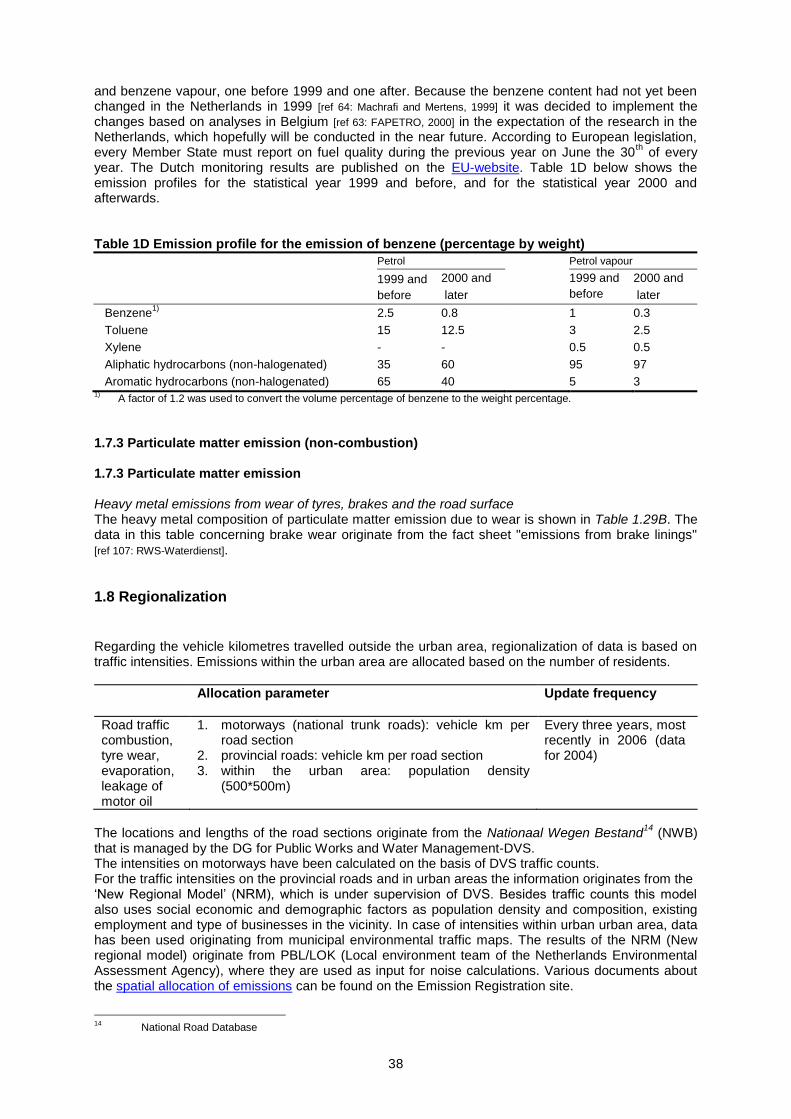
38
and benzene vapour, one before 1999 and one after. Because the benzene content had not yet been changed in the Netherlands in 1999 [ref 64: Machrafi and Mertens, 1999] it was decided to implement the changes based on analyses in Belgium [ref 63: FAPETRO, 2000] in the expectation of the research in the Netherlands, which hopefully will be conducted in the near future. According to European legislation, every Member State must report on fuel quality during the previous year on June the 30
th of every
year. The Dutch monitoring results are published on the EU-website. Table 1D below shows the emission profiles for the statistical year 1999 and before, and for the statistical year 2000 and afterwards. Table 1D Emission profile for the emission of benzene (percentage by weight)
Petrol Petrol vapour
1999 and
before
2000 and
later
1999 and
before
2000 and
later
Benzene1)
2.5 0.8 1 0.3
Toluene 15 12.5 3 2.5
Xylene - - 0.5 0.5
Aliphatic hydrocarbons (non-halogenated) 35 60 95 97
Aromatic hydrocarbons (non-halogenated) 65 40 5 3 1) A factor of 1.2 was used to convert the volume percentage of benzene to the weight percentage.
1.7.3 Particulate matter emission (non-combustion) 1.7.3 Particulate matter emission Heavy metal emissions from wear of tyres, brakes and the road surface The heavy metal composition of particulate matter emission due to wear is shown in Table 1.29B. The data in this table concerning brake wear originate from the fact sheet "emissions from brake linings" [ref 107: RWS-Waterdienst].
1.8 Regionalization Regarding the vehicle kilometres travelled outside the urban area, regionalization of data is based on traffic intensities. Emissions within the urban area are allocated based on the number of residents.
Allocation parameter
Update frequency
Road traffic combustion, tyre wear, evaporation, leakage of motor oil
1. motorways (national trunk roads): vehicle km per road section
2. provincial roads: vehicle km per road section 3. within the urban area: population density
(500*500m)
Every three years, most recently in 2006 (data for 2004)
The locations and lengths of the road sections originate from the Nationaal Wegen Bestand
14 (NWB)
that is managed by the DG for Public Works and Water Management-DVS. The intensities on motorways have been calculated on the basis of DVS traffic counts. For the traffic intensities on the provincial roads and in urban areas the information originates from the ‘New Regional Model’ (NRM), which is under supervision of DVS. Besides traffic counts this model also uses social economic and demographic factors as population density and composition, existing employment and type of businesses in the vicinity. In case of intensities within urban urban area, data has been used originating from municipal environmental traffic maps. The results of the NRM (New regional model) originate from PBL/LOK (Local environment team of the Netherlands Environmental Assessment Agency), where they are used as input for noise calculations. Various documents about the spatial allocation of emissions can be found on the Emission Registration site.
14
National Road Database
39
1.9 Uncertainties This section provides an explanation of estimates of the uncertainties in the emissions as shown in Appendix 1. When estimating the uncertainties in activity data, emission factors and the resulting uncertainties in emissions, the traffic task group used the classification system of the EPA from the United States. The classification is as follows:
A = The data originate from extremely accurate (high precision) measurements. B = The data originate from accurate measurements. C = The data originate from a published source, such as government statistics or industrial
trade figures. D = The data are generated by extrapolating other measured activities. E = The data are generated by extrapolating data from other countries.
It should be emphasized that the estimates of uncertainties are arbitrary and subjective in many cases. The uncertainties in the ultimate emission estimates are therefore only indicative.
1.9.1 Uncertainties in activity data (Appendix 1A)
The number of vehicles that is used, among other things, for calculating oil leakage and evaporative emissions originates from the RDW Centre for Vehicle Technology and Information. The RDW i. E. the Dutch Road authorities register all motor vehicles in the Netherlands; consequently, the number of vehicles is based on extremely precise measurements (A). Until 2006 the vehicle kilometres travelled by passenger cars were measured by the PAP (Passengercar panel). At present, this information originates from the OVG/MON in combination with the database of the NAP (National Car Passport). This concerns reasonably accurate measurements (A), but with uncertainties due to the under-representation of "frequent drivers" (such as lease drivers) in the sample. During the transition from the PAP to the OVG, most of this uncertainty has probably been eliminated. On the other hand other uncertainties have been introduced, due to the type of survey which is not primarely intended to determine car kilometres. The number of vehicle kilometres travelled by lorries, road tractors and buses has been based on data from the NAP (National Carr Passport) from 2001 onwards, and BedrijfsvoertuigenEnquete – BVE
15 of
1993. The share of kilometres abroad in the total vehicle kilometres by Dutch vehicles has been determined on the basis of results of CBS-goods transport statistics. The kilometres travelled by foreign vehicles in the Netherlands have been derived from European transport surveys. The number of vehicle kilometres travelled by light commercial vehicles (vans) has been based on NAP data and data from the BVE of 1993. The share of kilometres abroad in the total vehicle kilometres by Dutch vehicles has been estimated 4%. The kilometres travelled by foreign vehicles in the Netherlands has been equated with Dutch vehicle kilometres abroad. The uncertainty in the whole range of results for commercial vehicles has been classified B. The data of light commercial vehicles and of heavy commercial vehicles after 2001 can be given an A-classification. The vehicle kilometre data for special purpose vehicles have been based on the discontinued BVE and therefore due for revision. The subdivision of the number of passenger car kilometres according to year of manufacture increases the uncertainty. The subdivision according to road types (within urban areas, rural roads, motorways) also increases the uncertainty. Although the number of kilometres travelled on motorways is precisely measured, the number of kilometres travelled on rural roads is significantly less accurate. The number of kilometres travelled within urban areas is in fact a remainder of the above two road types and is therefore significantly more uncertain than the number of motorway kilometres. Until 2000 the specific fuel consumption of road vehicles was measured in the PAP and the BVE. However, this did not concern actual measurements, but one-time estimates by the respondents. The uncertainty in these estimates is probably quite large. Nevertheless, this data is given the A
15
Commercial Vehicles Survey
40
classification due to the large sample size. After 2000 the specific consumption figures have been extrapolated based on expert judgement. The fuel consumption per road type is calculated from the average consumption by using model calculations for the variations in fuel consumption between travelling on various road types, and is therefore more uncertain than the average consumption. The fuel consumption by road vehicles concerns calculated figures (resulting from specific fuel consumption and vehicle kilometres) and is more uncertain than both elements separately. Fuel sales to road traffic are determined based on a survey among fuel suppliers (oil companies) and is relatively accurate (A). These figures are used to calculate the IPCC-emissions. 1.9.2 Uncertainties in emission factors (Appendix 1B) Regarding the uncertainty in the emission factors of road vehicles, a distinction can be made according to 1) fuel-related emission factors, 2) regulated combustion and emission factors 3) non-regulated combustion and emission factors, 4) evaporative emission factors and 5) wear emission factors. Note to 1: Fuel-related emission factors are used when calculating CO2, SO2 and heavy metals. These emissions are calculated by multiplying the fuel consumption with fuel-related emission factors (grams/kg of fuel). Of these emission factors, CO2 is the most certain because this depends only on the carbon content of the fuel, and this carbon content is relatively certain. SO2 depends on the sulphur content, and since in recent years this has not been structurally measured, the sulphur content, especially of petrol, is very uncertain. Although the emission factors for heavy metals are based on a recent study, they are still uncertain because the content of heavy metals depends on the composition of the refined crude oil and the fuel additives. Both can vary strongly. Note to 2: Regulated combustion and emission factors are used for CO, VOC, NOx and in the case of diesel vehicles, for PM10 as well. Road vehicles have been subjected to emission norms for more than a decade; consequently, a relatively large number of measurement results are available. One example is the annual in-use compliance programme of the TNO, during which several dozen of vehicles are measured per year. The reliability of these emission factors is increased since using VERSIT+, but uncertainties still exist regarding the correction factors for the cold start, ageing and the use of air conditioners. Note to 3: Non-regulated combustion emission factors are used among other things for N2O and VOC components such as aromatics (including benzene) and PAHs. Because the profiles are from the mid-1980s and both the fuel composition and the engine technology have changed since then, the reliability of these profiles has declined sharply. In 2002, as expected, a large-scale measurement programme was conducted to update the VOC profiles. The N2O emission factors of passenger cars have recently been ascertained as part of a comprehensive measurement study and are therefore relatively reliable (B). Note to 4: Evaporative emission factors express the quantity of evaporated petrol per vehicle per day. This depends on the age of the vehicle, because new vehicles must comply to stricter demands for the maximum evaporative emissions than older vehicles. Moreover, the evaporative emission depends on vehicle usage, because many short trips lead to more evaporative emissions than fewer long trips. In addition, the outdoor temperature is important. The evaporative emissions of road vehicles are scarcely measured in the Netherlands, and emission factors are therefore based on the emission norms and the measurement results in other European countries. Note to 5: Wear emission factors are derived from a mass balance and assumptions about the content of particulate matter in the total wear mass. This assumption is very uncertain. The zinc content of tyres, which was modified by the traffic task group, has been recently confirmed in research conducted by BLIC, a central organization of tyre manufacturers.
41
1.9.3 Uncertainties in the emissions (Appendix 1C) The uncertainties in emission estimates are derived from the uncertainty in activity data and emission factors in accordance with the rule that the uncertainty of the product of two uncertain factors is equal to the largest uncertainty in one of the two factors, therefore: - A * A = A - A * B = B - B * A = B - A * D = D, etc.
1.10 Points for improvement 1.10.1 Calculation methods None 1.10.2 Activity data None 1.10.3 Emission factors VERSIT+ is a statistical emission model based on emission measurements. For this reason with every model update it is preferred to use a much new measurement data (from TNO, international) as possible. Version 3 of the VERSIT+ model has been developed in 2008. With this the statistical method has been renewed to achieve a better relationship between the instantaneous emissions and the vehicle’s speed and acceleration. The generic driving behaviour variables per drive have been replaced by instantaneous variables for any moment. With this it has been seen to that optimal use is made of the different kinds of measurement data. More information about this subject can be found in a TNO report [ref 119: Ligterink en de Lange, 2009].
Besides this, work is being done on a new method to improve VERSIT+ correction and adjustment factors (ageing, airconditioning, cold start). In case new measurement data become available, they will be incorporated in the model.. Based on recent measurements and new insights into the typical mass of the various vehicle classes, TNO has made alterations in set of emission factors for EURO 5 and EURO 6 High Duty Vehicles, and EURO 6 buses. New PM10 factors have been applied for diesel passenger cars and delivery vans with a particle filter and Euro 4 without a filter. The NOx factors for EURO 5 diesel delivery vans on urban roads have been revised. New specific energy consumption factors have been determined for passenger cars, based on National Car Passport vehicle data (odometer readings) and TNO real-life measurements.
1.11 Verification Every year, a comprehensive trend analysis is conducted, where deviations larger than 5% with respect to the previous year must be explained.
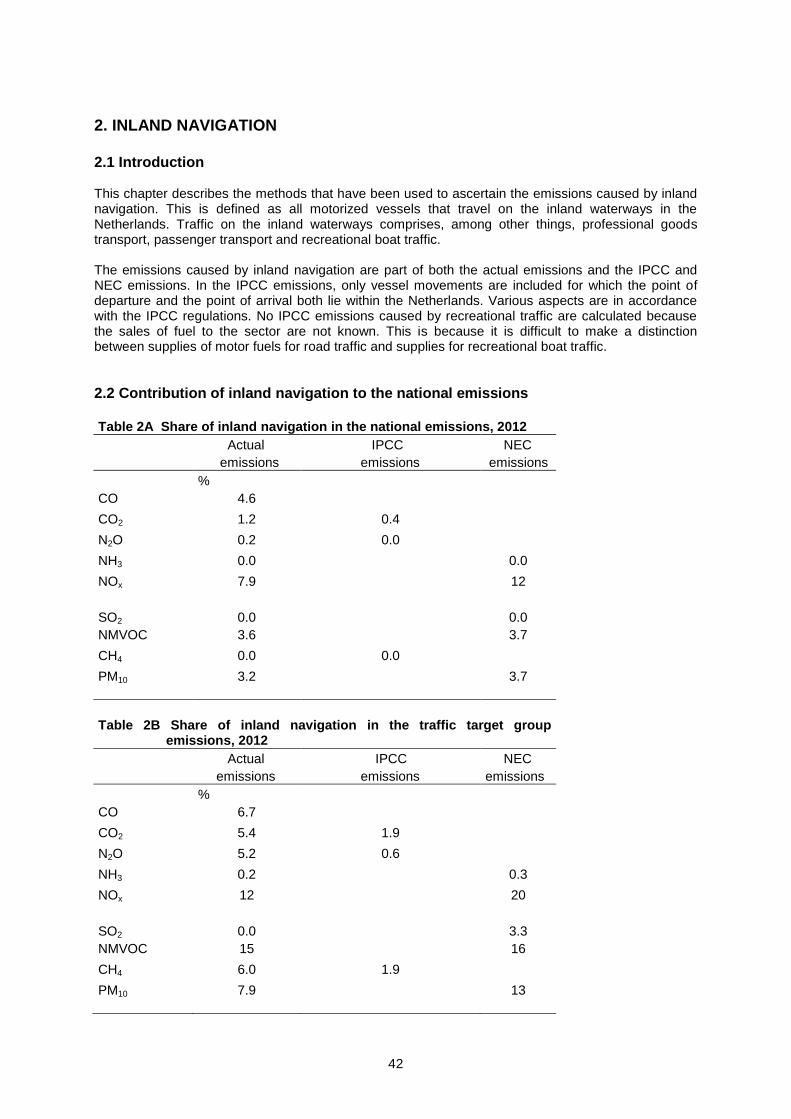
42
2. INLAND NAVIGATION
2.1 Introduction This chapter describes the methods that have been used to ascertain the emissions caused by inland navigation. This is defined as all motorized vessels that travel on the inland waterways in the Netherlands. Traffic on the inland waterways comprises, among other things, professional goods transport, passenger transport and recreational boat traffic. The emissions caused by inland navigation are part of both the actual emissions and the IPCC and NEC emissions. In the IPCC emissions, only vessel movements are included for which the point of departure and the point of arrival both lie within the Netherlands. Various aspects are in accordance with the IPCC regulations. No IPCC emissions caused by recreational traffic are calculated because the sales of fuel to the sector are not known. This is because it is difficult to make a distinction between supplies of motor fuels for road traffic and supplies for recreational boat traffic.
2.2 Contribution of inland navigation to the national emissions
Table 2A Share of inland navigation in the national emissions, 2012
Actual IPCC NEC
emissions emissions emissions
%
CO 4.6
CO2 1.2 0.4
N2O 0.2 0.0
NH3 0.0 0.0
NOx 7.9 12
SO2 0.0 0.0
NMVOC 3.6 3.7
CH4 0.0 0.0
PM10 3.2 3.7
Table 2B Share of inland navigation in the traffic target group
emissions, 2012
Actual IPCC NEC
emissions emissions emissions
%
CO 6.7
CO2 5.4 1.9
N2O 5.2 0.6
NH3 0.2 0.3
NOx 12 20
SO2 0.0 3.3
NMVOC 15 16
CH4 6.0 1.9
PM10 7.9 13
43
2.3 Description of the process The propulsion that is used in inland navigation for goods and passenger transport in the Netherlands is provided by diesel engines. The combustion processes that take place in these diesel engines cause emissions of air pollutants. The most important substances emitted are carbon dioxide, nitrogen oxides, particulate matter (PM10), carbon monoxide, hydrocarbons and sulphur dioxide. Carbon dioxide and sulphur dioxide are caused by the oxidation of the carbon and sulphur present in the fuel. The emissions of these substances therefore depend completely on the contents of carbon and sulphur in the fuel and quantity of fuel that is combusted. Nitrogen oxides are primarily caused by the high temperatures and pressures in the combustion engines, which causes the nitrogen present in the atmosphere to combine with oxygen. Carbon monoxide, hydrocarbons and particulates are products of incomplete combustion. The emissions of the latter substances therefore mainly depend on the technical properties of the engines and the way in which these engines are used. The propulsion of recreational vessels takes place using both petrol and diesel engines. With petrol engines, a distinction can be made between outboard engines (usually two cycle) and inboard engines (usually four cycle). Diesel engines are inboard engines. The most widely sold engines are small outboard engines. Petrol engines usually have an underwater exhaust, which results in a significant portion of the emitted substances dissolving in the water and therefore not entering the atmosphere. Diesel engines have an above-water exhaust. Nevertheless, diesel engines can also cause water pollution, especially when the cooling water from the motor is discharged through the exhaust. Generally speaking, engines for recreational vessels are comparable with automobile engines. However, in terms of technology and the related emission properties, they are about 10 years behind in development. Because safety – and therefore the operational security of the engines – is an important priority, especially with seagoing vessels, the petrol engines are adjusted to have a very rich mixture. As a result, CO and VOC emissions are significantly higher than those of comparable engines in road traffic. In contrast, NOx emissions are negligible. Besides the emissions resulting from the propulsion of inland shipping vessels, emissions also take place of volatile organic substances (VOC) due to de-gassing of cargo fumes by inland shipping vessels in the Netherlands. The de-gassing of cargo tanks to the outside air is often referred to as "ventilating", to distinguish this from de-gassing to a vapour processing facility. Although the term does not properly indicate the actual process, in the present report "ventilating" will be used to indicate cargo fumes being released to the outside air. In principle, cargo fumes that remain in a cargo tank after unloading are blown into the air with the use of ventilating fans. In this way, the next trip can begin with a clean tank. Partly as a result of government policy, there are exceptions to this process. Cargo fumes that are released when loading ships are classified as part of the emissions of the loading installation and are therefore not included in this report. These emissions are largely allocated to the industrial target group (refineries and chemical industry). The exceptions to this are the loading emissions during ship-to-ship transfer. Only the emissions of the eight most important products or product groups have been included in the calculations. These emissions comprise approximately 90% of the total emissions from this source. The basis for this assumption is the transported quantity of other volatile organic substances and a rough estimate of the emission factors of these substances. They do not include the following: - the emissions of cargo fumes via pressure release valves; - incidental emissions from cargoes to water or air resulting from accidents or careless handling; - emissions of fuel vapours from fuel storage tanks.
44
2.4 Calculation methods 2.4.1 Actual and NEC emissions Combustion of motor fuels: CO, NOx, VOC, particulate matter (PM10/PM2,5), SO2 and CO2 Professional inland shipping
The calculation of the emissions has been developed as part of Emissieregistratie en– Monitoring Scheepvaart
16 (EMS). This project has been implemented on behalf of the former Ministry of
Transport, Public Works and Water Management, coordinated by DG for Public Works and Water
Management, and executed by TNO among others. The emission calculation is based on the energy consumption per vessel class, which is derived from vessel kilometres. For 28 vessel classes, the power demand (kW) is calculated for the various inland waterway types and rivers. During this process, a distinction has been made between loaded and unloaded ships. In addition, the average travel speed of the various vessel classes in relation to the water, is ascertained depending on the vessel class and the maximum speed allowed on the route that is travelled. The general formula for calculating emissions is the following: Emissions = Number . Power . Time . Emission factor The formula in the box below is used for calculating the emission of substance (s) in one direction (d) specifically for one vessel class (v,c), carrying a cargo or not (b), on every distinct route (r) on the Dutch inland waterways:
The combination of the number of vessels, their power and their speed is the explanatory variable for emissions. The unit of the explanatory variable for emissions is "kWh". The emission factor is expressed in “kg/kWh”, the same unit that is used to express emission norms. The emission factors are dependent on the engine’s year of construction.
For calculating the above emission formula, a calculation model has been designed. This model is managed by TNO. The calculation protocols and backgrounds of the EMS form the basis of the emission calculations [ref 100: Hulskotte, 2003]. The complete set of protocols (in Dutch) can be found on the website of the Dutch Emission Registration.
16
Emission registration and monitoring of shipping
Emissions from propulsion engines = the sum of vessel classes, cargo situations, routes and directions of:
{number of vessel passages times average power used times average emission factor times length of route divided by speed} or E v,c,b,r,s,d = Nv,c,b,r,d . Pbv,b,r . Lr/(Vv,r,d + Vr) . EFv,s (1) Where: E v,c,b,r,s,d = Emission per vessel class, (kg) Nv,c,b,r,d = Number of vessels of this class on the route and with this cargo situation sailing in this direction Pbv,b,r = Average power of this vessel class on the route (kW) EFv,s = Average emission factor of the engines of this vessel class (kg/kWh) Lr = Length of the route (km) Vv,r = Average speed of the vessel in this class on this route (km/h) Vr = Rate of flow of the water on this route (km/h), (can also be a negative value)
v,c,b,r,s,d = indices for vessel class, aggregated cargo capacity class, cargo situation, route, substance, and direction of travel, respectively
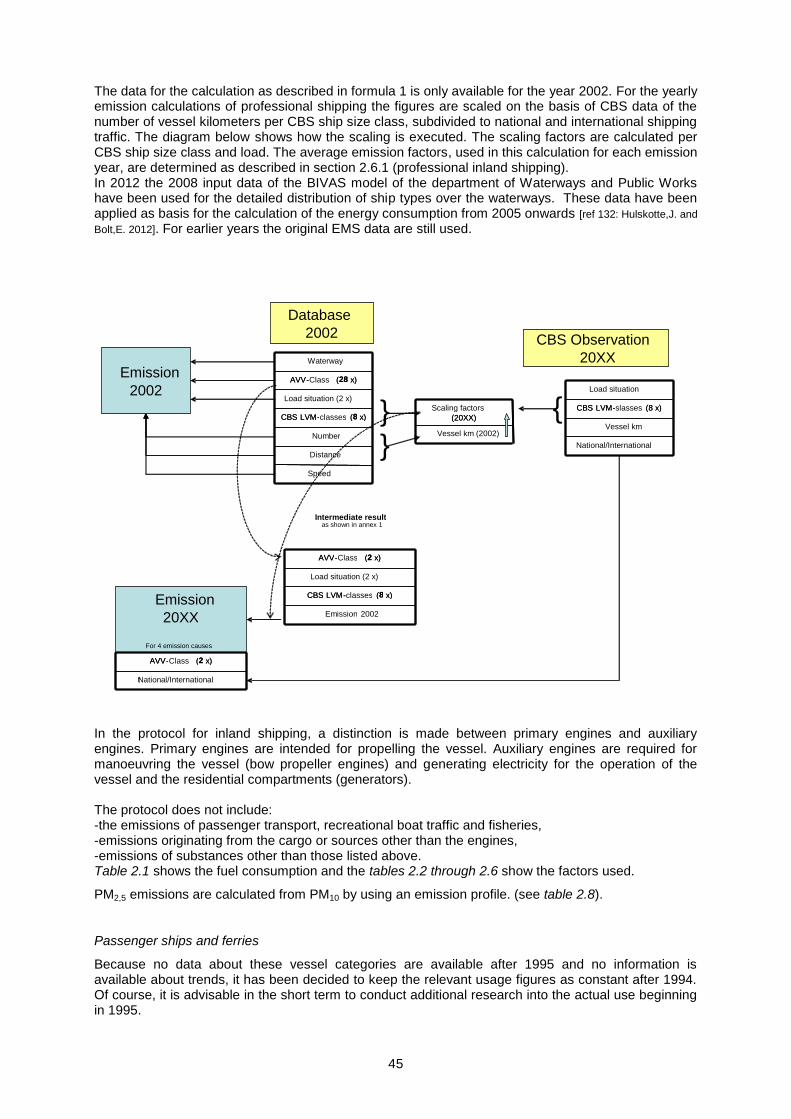
45
The data for the calculation as described in formula 1 is only available for the year 2002. For the yearly emission calculations of professional shipping the figures are scaled on the basis of CBS data of the number of vessel kilometers per CBS ship size class, subdivided to national and international shipping traffic. The diagram below shows how the scaling is executed. The scaling factors are calculated per CBS ship size class and load. The average emission factors, used in this calculation for each emission year, are determined as described in section 2.6.1 (professional inland shipping). In 2012 the 2008 input data of the BIVAS model of the department of Waterways and Public Works have been used for the detailed distribution of ship types over the waterways. These data have been applied as basis for the calculation of the energy consumption from 2005 onwards [ref 132: Hulskotte,J. and
Bolt,E. 2012]. For earlier years the original EMS data are still used. In the protocol for inland shipping, a distinction is made between primary engines and auxiliary engines. Primary engines are intended for propelling the vessel. Auxiliary engines are required for manoeuvring the vessel (bow propeller engines) and generating electricity for the operation of the vessel and the residential compartments (generators). The protocol does not include: -the emissions of passenger transport, recreational boat traffic and fisheries, -emissions originating from the cargo or sources other than the engines, -emissions of substances other than those listed above. Table 2.1 shows the fuel consumption and the tables 2.2 through 2.6 show the factors used.
PM2,5 emissions are calculated from PM10 by using an emission profile. (see table 2.8).
Passenger ships and ferries
Because no data about these vessel categories are available after 1995 and no information is available about trends, it has been decided to keep the relevant usage figures as constant after 1994. Of course, it is advisable in the short term to conduct additional research into the actual use beginning in 1995.
Emission
2002
Waterway
AVV - Class ( 28 x)
Load situation (2 x)
CBS LVM - classes ( 8 x)
Number
Distance
Speed
AVV - ( 28 x)
CBS LVM - ( 8 x)
}
}
Scaling factors (20XX)
Vessel km (2002)
(20XX)
Load situation
CBS LVM - slasses (8 x)
Vessel km
National/International
CBS LVM - (8 x)
Database
2002 CBS Observation
20XX
{
AVV - Class ( 2 x)
Load situation (2 x)
CBS LVM - classes ( 8 x)
Emission 2002
AVV - ( 2 x)
CBS LVM - ( 8 x)
Emission
20XX
For 4 emission causes AVV - Class ( 2 x)
National/International
AVV - ( 2 x)
t
Intermediate result as shown in annex 1
46
Recreational boat traffic The emissions are calculated by multiplying the explanatory variables for emissions, the number of recreational boats (allocated to open motor boats/cabin motor boats and open sailboats/cabin sailboats) with the average fuel consumption per boat type times the emission factor per substance, expressed in emission per engine type per quantity of fuel. The various types of boats are equipped with a specific allocation of engine types that determine the level of the emission factors. The emission factors are measured in quantities of emission per quantity of generated kinetic energy. By dividing them with the specific fuel consumption (fuel quantity required per unit of generated kinetic energy), an emission factor per quantity of fuel is obtained. For the water emissions, the calculations are described in the fact sheet "engine emissions of recreational boat traffic" [ref 108: RWS-Waterdienst, 2005]. The air-contaminating emissions from recreational boat traffic are also included in this fact sheet. The emission factors for macro-components (in grams/kg fuel) for recreational boats with petrol and diesel engines are shown in Tables 2.1 through 2.6. Combustion of motor fuels: N2O and NH3 The combustion emissions within the Netherlands of N2O and NH3 are calculated using the IPCC defaults for N2O [ref 68: IPCC, 1997] and the emission factors of the EEA for NH3 [ref 60: Ntziachristos and
Samaras, 2000] (Table 2.6). These emission factors are multiplied by the total fuel consumption of inland navigation in the Netherlands. Combustion of motor fuels: VOC and PAH components and heavy metals The calculation of the combustion emissions of VOC and PAH components, including methane, takes place using profiles. First, as described in Section 1.4.1, the combustion emissions of VOC are calculated. The profiles indicate the fractions of the various VOC and PAH components in this "total" VOC. By multiplying total VOC emissions with the fractions from these profiles, the emissions of individual VOC and PAH components are estimated. The emissions of heavy metals are calculated by multiplying the fuel consumption with the emission factors that are based on the metal content of the marine fuels. The emission factors, expressed in grams per kg of fuel, are shown in Table 2.6. The emission profiles for VOC and PAH components are shown in table 2.7. De-gassing cargo fumes to the atmosphere The calculation of the emissions (including VOC emissions) are conducted for each substance using the following formula:
Weight of VOC (vapour) emitted = mass of unloaded cargo (A) * percentage after which the hold is ventilated (B) * evaporation factor (C)
The required data fall into three categories: − (A) transport data, originating from statistical information; − (B) data about the practice of loading and unloading (also linked partially to regulations); − (C) chemical and physical data, originating from the relevant literature. In this formula, the weight of the unloaded cargo is the explanatory variable for emissions. The emission factor is arrived at by multiplying the evaporation factor with the percentage of the unloaded cargo after which the hold is ventilated. A comprehensive description of the methodology can be found in the protocol established as part of the EMS project [ref 99: Bolt, 2003].
47
2.4.2 IPCC emissions Professional inland shipping
According to the IPCC protocol, the greenhouse gas emissions of inland navigation must be calculated based on the fuel supplied for vessel movements which have their points of departure and arrival within the Netherlands. Because it is impossible to distinguish between fuel deliveries for national and international use, the fuel consumption for national vessel movements are calculated using the EMS system. This amount is then multiplied with the same factors that are used to determine the actual emissions. To be able to do this a CBS database is used which contains the number of vessel kilometres on the Dutch waterways per vessel size class with a distinction between national and international journeys. Passenger boats and ferries
The IPCC emissions have been set equal to the actual emissions. Here as well, it is impossible to split off the fuel deliveries to this category of vessels from total fuel deliveries. Recreational boat traffic
No IPCC figures for recreational boat traffic are provided. These are included in the IPCC emissions for road traffic. The fuel sales on which this is based also comprise the fuels supplied to recreational boat traffic.
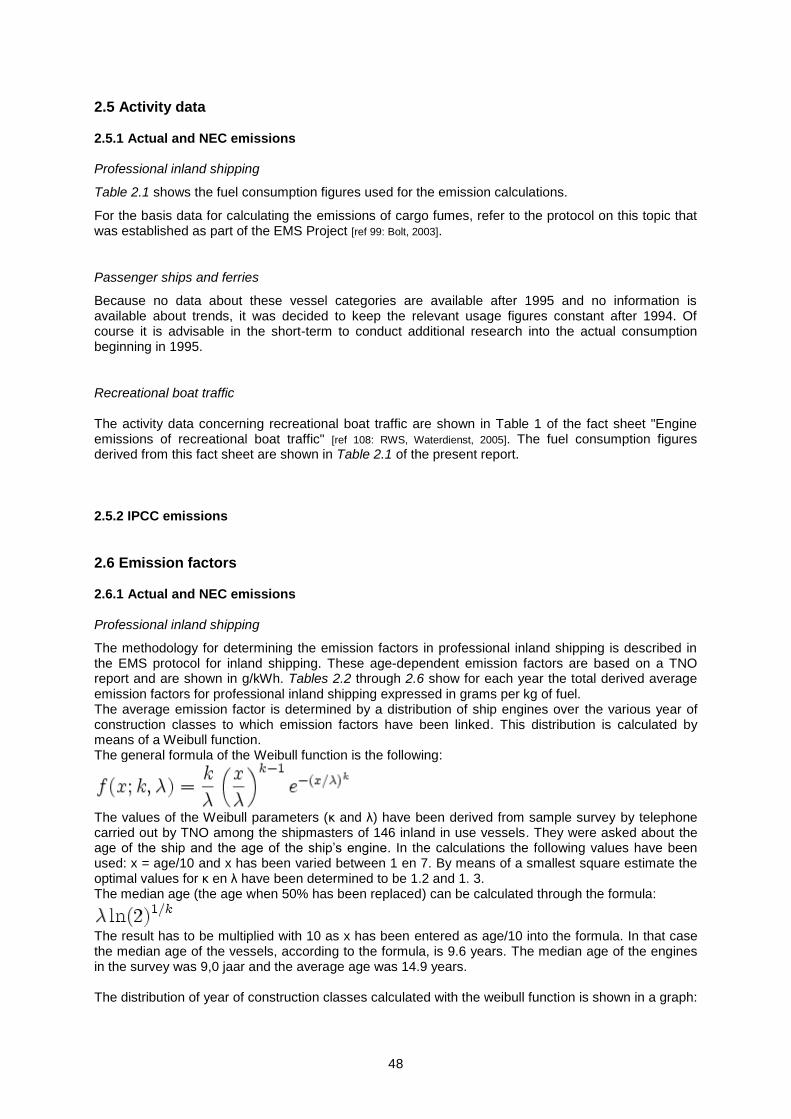
48
2.5 Activity data 2.5.1 Actual and NEC emissions Professional inland shipping
Table 2.1 shows the fuel consumption figures used for the emission calculations.
For the basis data for calculating the emissions of cargo fumes, refer to the protocol on this topic that was established as part of the EMS Project [ref 99: Bolt, 2003].
Passenger ships and ferries
Because no data about these vessel categories are available after 1995 and no information is available about trends, it was decided to keep the relevant usage figures constant after 1994. Of course it is advisable in the short-term to conduct additional research into the actual consumption beginning in 1995.
Recreational boat traffic The activity data concerning recreational boat traffic are shown in Table 1 of the fact sheet "Engine emissions of recreational boat traffic" [ref 108: RWS, Waterdienst, 2005]. The fuel consumption figures derived from this fact sheet are shown in Table 2.1 of the present report.
2.5.2 IPCC emissions
2.6 Emission factors 2.6.1 Actual and NEC emissions Professional inland shipping
The methodology for determining the emission factors in professional inland shipping is described in the EMS protocol for inland shipping. These age-dependent emission factors are based on a TNO report and are shown in g/kWh. Tables 2.2 through 2.6 show for each year the total derived average emission factors for professional inland shipping expressed in grams per kg of fuel. The average emission factor is determined by a distribution of ship engines over the various year of construction classes to which emission factors have been linked. This distribution is calculated by means of a Weibull function. The general formula of the Weibull function is the following:
The values of the Weibull parameters (κ and λ) have been derived from sample survey by telephone carried out by TNO among the shipmasters of 146 inland in use vessels. They were asked about the age of the ship and the age of the ship’s engine. In the calculations the following values have been used: x = age/10 and x has been varied between 1 en 7. By means of a smallest square estimate the optimal values for κ en λ have been determined to be 1.2 and 1. 3. The median age (the age when 50% has been replaced) can be calculated through the formula:
The result has to be multiplied with 10 as x has been entered as age/10 into the formula. In that case the median age of the vessels, according to the formula, is 9.6 years. The median age of the engines in the survey was 9,0 jaar and the average age was 14.9 years. The distribution of year of construction classes calculated with the weibull function is shown in a graph:
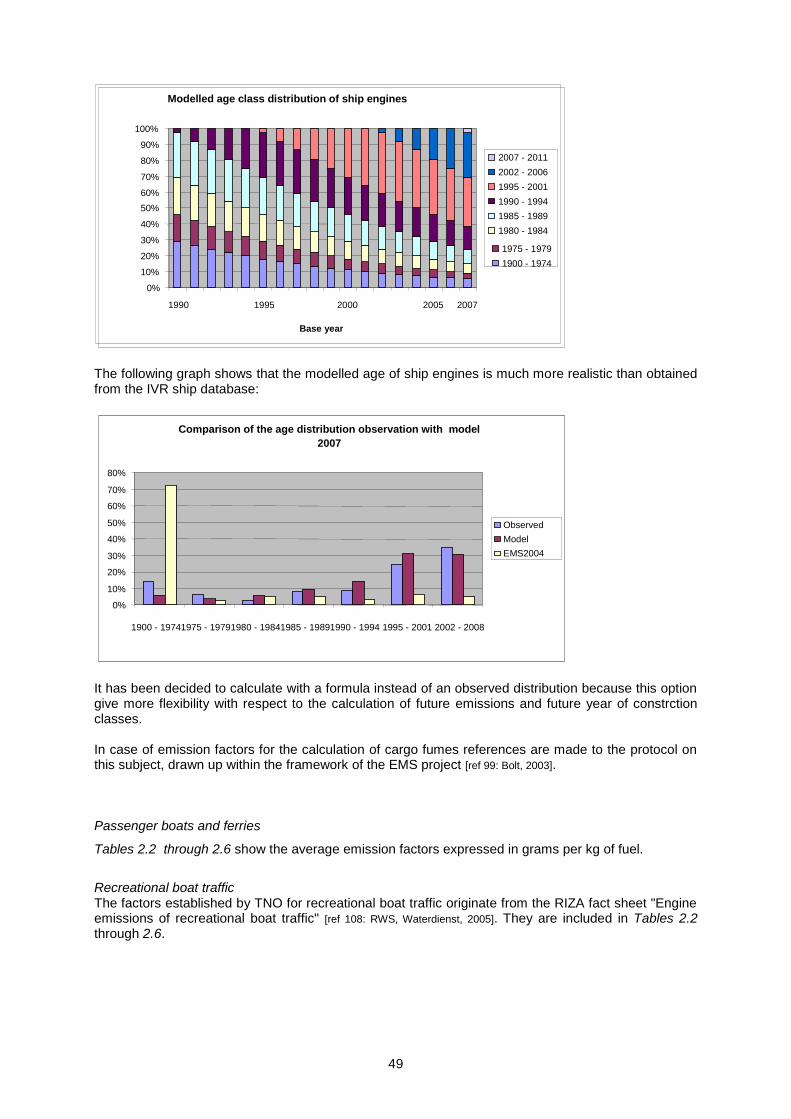
49
The following graph shows that the modelled age of ship engines is much more realistic than obtained from the IVR ship database:
It has been decided to calculate with a formula instead of an observed distribution because this option give more flexibility with respect to the calculation of future emissions and future year of constrction classes. In case of emission factors for the calculation of cargo fumes references are made to the protocol on this subject, drawn up within the framework of the EMS project [ref 99: Bolt, 2003]. Passenger boats and ferries
Tables 2.2 through 2.6 show the average emission factors expressed in grams per kg of fuel.
Recreational boat traffic The factors established by TNO for recreational boat traffic originate from the RIZA fact sheet "Engine emissions of recreational boat traffic" [ref 108: RWS, Waterdienst, 2005]. They are included in Tables 2.2 through 2.6.
Comparison of the age distribution observation with model 2007
0%
10%
20%
30%
40%
50%
60%
70%
80%
1900 - 1974 1975 - 1979 1980 - 1984 1985 - 1989 1990 - 1994 1995 - 2001 2002 - 2008
Observed Model EMS2004
Modelled age class distribution of ship engines
0%
10%
20%
30%
40%
50% 60%
70%
80%
90%
100%
1990 1995 2000 2005 2007
Base year
2007 - 2011 2002 - 2006 1995 - 2001 1990 - 1994 1985 - 1989 1980 - 1984
1975 - 1979 1900 - 1974
50
2.6.2 IPCC emissions The CO2 factors used are in accordance with the list of energy carriers used in the Netherlands and the standard CO2 emission factors [ref 87: Vreuls, 2004]. 2.7 Substance profiles The VOC and PAH profiles have been established by (tables 2.7A through 2.7C) [ref 55: VROM, 1993]. Table 2.8 gives the share of PM2,5 in the PM10-emissions.
2.8 Regionalization The sections of inland waterways and their lengths originate from the NWB (section on main waterways). This database is maintained by the Transport Research Centre. Statistics Netherlands (via StatLine) provides the data for the number and type of inland waterway vessels and also for the numbers of recreational boats (motorboats and sailboats). The data on the numbers of mooring places in yacht harbours originate from the Kennis- en Informatiecentrum Recreatie
17 (KIR).
Table 2C Regionalization of emissions from inland navigation
Allocation parameter
Update frequency
Inland shipping (on shipping routes) combustion, leaching, evaporation, spills
Vessel /tonne-kilometre per shipping route section (depending on cargo)
Every three years, most recently in 2006 (data from 2004)
Inland shipping (in harbours) leaching, spills
Number of vessels entering harbours per year
Every three years, most recently in 2005 (data from 2003)
Recreational traffic (on shipping routes) combustion, leaching, evaporation, spills
Vessel kilometres per shipping route section Every three years, most recently in 2005 (data from 2003)
Recreational traffic (in harbours) leaching, spills
Number of moorings at yacht harbours Every three years, most recently in 2005 (data from 2003)
2.9 Uncertainties The uncertainties in emission estimates have been derived from the uncertainty in activity data and emission factors in accordance with the rule that the uncertainty of the product of two uncertain factors is equal to the greatest uncertainty of one of the two factors, therefore: - A * A = A - A * B = B - B * A = B - C * C = C - A * D = D
etc. The results are shown in Appendix 1.
17
Expertise Centre on Leisure and Recreation
51
2.10 Points for improvement General -The fuel consumption of passenger boats and ferries has not been determined since 1994. This lack of information should certainly be dealt with. -There are doubts about the reliability of the data concerning the number of recreational boats and the number of hours of their usage on the waterways. Weak points of engine emissions in professional inland waterway shipping The structure of table with the emission accounting variabel for the vessel movements on the Waal and the IJssel in particular is liable to be improved strongly Weak points concerning cargo fumes emissions Important uncertainties are the following: -What is the subdivision according to individual substances within the “not named elsewhere” classes, or remainder categories? -What is the percentage of loading cycles with a compatible substance where degassing is actually avoided because a vapour processing facility is available and is being used? -What percentage of the loading does not take place directly onshore? -Which saturation factor must be used for emptied tanks, and how large are the cargo residues that can still evaporate? -To what extent is the latest state of affairs concerning the legislation incorporated in the calculations. This has to be verified. Most important points of improvement for motor emissions in professional inland shipping -It is strongly recommended to implement the annual derivation of the table with shipping movements by using software that is specially developed and tested for this purpose. If the basis observations of shipping traffic on the Waal river are inadequate for this, something must certainly be done about the situation in view of the large share of this shipping route in the national total. Most important points of improvement for cargo fumes emissions Besides more reliable data from practice about the above emission factors, there should be harmonization with the calculation method that is used for VOC emissions in the industrial target group. The calculated emissions must be consistent and it must be clear which emissions are attributed to shipping and which are attributed to industry. The calculation proposed here makes a distinction between different sequential cargoes, which is an important piece of information not only when determining emissions, but also the effects of policy measures. After the first calculation of the emissions during the EMS project there have been no further calculations. In this context it is important to know that in the meantime measures have been carried out to reduce these emissions.
2.11 Verification Every year, a comprehensive trend analysis is conducted where deviations larger than 5% with respect to the previous year must be explained.
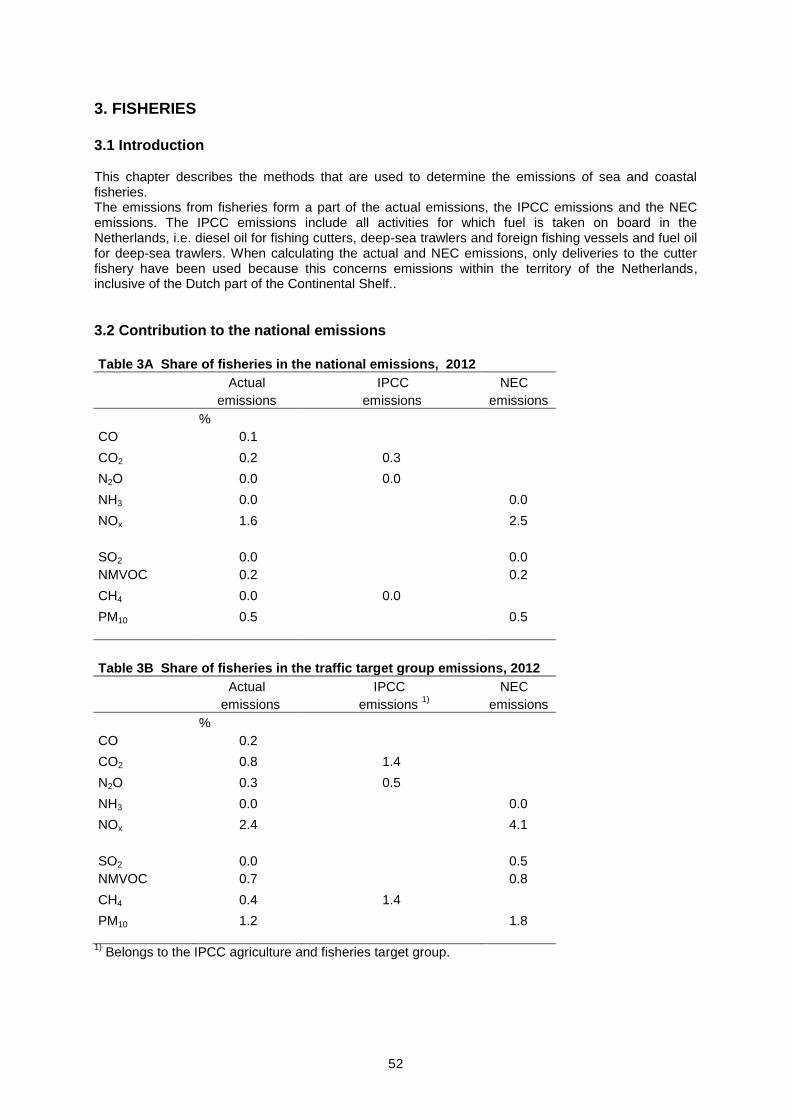
52
3. FISHERIES
3.1 Introduction This chapter describes the methods that are used to determine the emissions of sea and coastal fisheries. The emissions from fisheries form a part of the actual emissions, the IPCC emissions and the NEC emissions. The IPCC emissions include all activities for which fuel is taken on board in the Netherlands, i.e. diesel oil for fishing cutters, deep-sea trawlers and foreign fishing vessels and fuel oil for deep-sea trawlers. When calculating the actual and NEC emissions, only deliveries to the cutter fishery have been used because this concerns emissions within the territory of the Netherlands, inclusive of the Dutch part of the Continental Shelf..
3.2 Contribution to the national emissions
Table 3A Share of fisheries in the national emissions, 2012
Actual IPCC NEC
emissions emissions emissions
%
CO 0.1
CO2 0.2 0.3
N2O 0.0 0.0
NH3 0.0 0.0
NOx 1.6 2.5
SO2 0.0 0.0
NMVOC 0.2 0.2
CH4 0.0 0.0
PM10 0.5 0.5
Table 3B Share of fisheries in the traffic target group emissions, 2012
Actual IPCC NEC
emissions emissions 1)
emissions
%
CO 0.2
CO2 0.8 1.4
N2O 0.3 0.5
NH3 0.0 0.0
NOx 2.4 4.1
SO2 0.0 0.5
NMVOC 0.7 0.8
CH4 0.4 1.4
PM10 1.2 1.8
1) Belongs to the IPCC agriculture and fisheries target group.
53
3.3 Description of the process Diesel engines are used to propel fishing vessels and to generate electrical power onboard fishing vessels. These diesel engines can be fuelled with either diesel oil (distillate) or heavy fuel oil (a residue of the refining process). The combustion process that takes place in these diesel engines causes emissions of air pollutants.
3.4 Calculation methods 3.4.1 Actual and NEC emissions When calculating the actual and NEC emissions, the same activity data and calculation method is used as when calculating the IPCC emissions (see Section 3.4.2), provided that only the in-harbour and national continental shelf emissions are included. Because it is not known how much fuel consumption this concerns, it was decided that the best approach was to use the total fuel consumption for the cutter fishery as the basis for calculating the actual and NEC emissions. In order to estimate the fuel consumption on the national continental shelf, we used data from the Agricultural Economics Research Institute (LEI) about the fuel consumption of the cutter fishery that sails under the Dutch flag. This concerns the upscaled results of a survey of 30% of the fleet of Dutch fishing cutters that are reported in the publication of the LEI titled “Visserij in Cijfers”
18 [ref 85: Taal, C. et
al., various years]. The LEI estimates that approximately 75% of this fuel consumption takes place on the national continental shelf [telephone conversation, 27-2-2003], but that there are still other types of Dutch and foreign fishing vessels on the national continental shelf. It is assumed that the total fuel consumption by Dutch and foreign fishing vessels on the national continental shelf is equal to the total fuel consumption by the Dutch cutter fishery (therefore both on and outside the national continental shelf). The emissions of heavy metals have been calculated by multiplying fuel consumption with emission factors that are based on the metal content of marine fuels. The calculation of the combustion emissions of the VOC and PAH components, including methane, takes place by using profiles. First, the combustion emissions of VOC are calculated. The profiles indicate the fractions of the various VOC and PAH components in this "total" VOC. By multiplying the total VOC emissions with the fractions from these profiles, the total emissions of individual VOC and PAH components are estimated. PM2,5 emissions are calculated from PM10 by using an emission profile. (see section 3.7).
3.4.2 IPCC emissions The emissions are calculated per fuel type; a separate calculation is conducted for heavy fuel oil and diesel. It is assumed that diesel oil is used in four-cycle engines and heavy fuel oil in two-cycle engines. For calculating the emissions of CO2, CH4 and NO2, the IPCC standard emission factors are used exclusively, with the exception of the CO2 emission factor for diesel oil, which is country-specific. The emission calculation for each year proceeds according to the following formula: Emission = Σf ( fuel consumptionf x combustion valuef x emission factorf) Where: Emission (tonnes/year) fuel consumption (tonnes/year) combustion value (TJ/tonne) emission factor (tonnes/TJ fuel) f = fuel type (diesel oil or fuel oil) .
18
The Fisheries in Figures
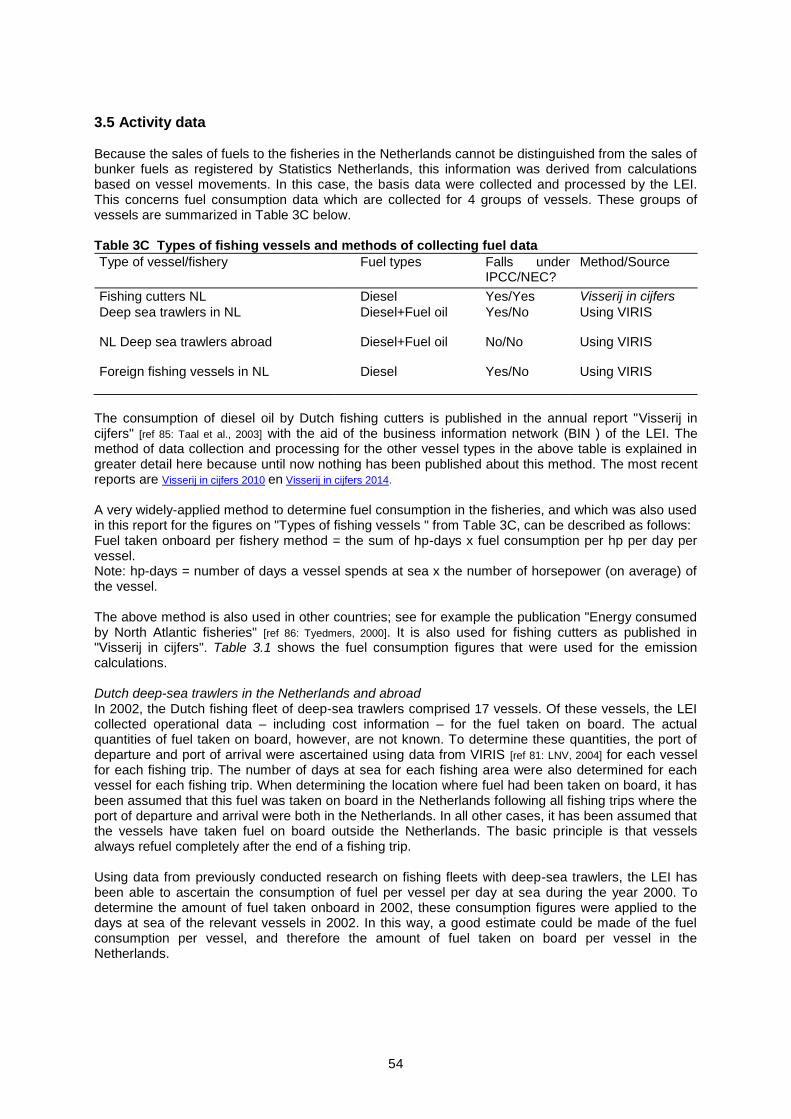
54
3.5 Activity data Because the sales of fuels to the fisheries in the Netherlands cannot be distinguished from the sales of bunker fuels as registered by Statistics Netherlands, this information was derived from calculations based on vessel movements. In this case, the basis data were collected and processed by the LEI. This concerns fuel consumption data which are collected for 4 groups of vessels. These groups of vessels are summarized in Table 3C below. Table 3C Types of fishing vessels and methods of collecting fuel data
Type of vessel/fishery Fuel types Falls under IPCC/NEC?
Method/Source
Fishing cutters NL Diesel Yes/Yes Visserij in cijfers
Deep sea trawlers in NL Diesel+Fuel oil Yes/No Using VIRIS
NL Deep sea trawlers abroad Diesel+Fuel oil No/No Using VIRIS
Foreign fishing vessels in NL Diesel Yes/No Using VIRIS
The consumption of diesel oil by Dutch fishing cutters is published in the annual report "Visserij in cijfers" [ref 85: Taal et al., 2003] with the aid of the business information network (BIN ) of the LEI. The method of data collection and processing for the other vessel types in the above table is explained in greater detail here because until now nothing has been published about this method. The most recent reports are Visserij in cijfers 2010 en Visserij in cijfers 2014. A very widely-applied method to determine fuel consumption in the fisheries, and which was also used in this report for the figures on "Types of fishing vessels " from Table 3C, can be described as follows: Fuel taken onboard per fishery method = the sum of hp-days x fuel consumption per hp per day per vessel. Note: hp-days = number of days a vessel spends at sea x the number of horsepower (on average) of the vessel. The above method is also used in other countries; see for example the publication "Energy consumed by North Atlantic fisheries" [ref 86: Tyedmers, 2000]. It is also used for fishing cutters as published in "Visserij in cijfers". Table 3.1 shows the fuel consumption figures that were used for the emission calculations. Dutch deep-sea trawlers in the Netherlands and abroad In 2002, the Dutch fishing fleet of deep-sea trawlers comprised 17 vessels. Of these vessels, the LEI collected operational data – including cost information – for the fuel taken on board. The actual quantities of fuel taken on board, however, are not known. To determine these quantities, the port of departure and port of arrival were ascertained using data from VIRIS [ref 81: LNV, 2004] for each vessel for each fishing trip. The number of days at sea for each fishing area were also determined for each vessel for each fishing trip. When determining the location where fuel had been taken on board, it has been assumed that this fuel was taken on board in the Netherlands following all fishing trips where the port of departure and arrival were both in the Netherlands. In all other cases, it has been assumed that the vessels have taken fuel on board outside the Netherlands. The basic principle is that vessels always refuel completely after the end of a fishing trip. Using data from previously conducted research on fishing fleets with deep-sea trawlers, the LEI has been able to ascertain the consumption of fuel per vessel per day at sea during the year 2000. To determine the amount of fuel taken onboard in 2002, these consumption figures were applied to the days at sea of the relevant vessels in 2002. In this way, a good estimate could be made of the fuel consumption per vessel, and therefore the amount of fuel taken on board per vessel in the Netherlands.
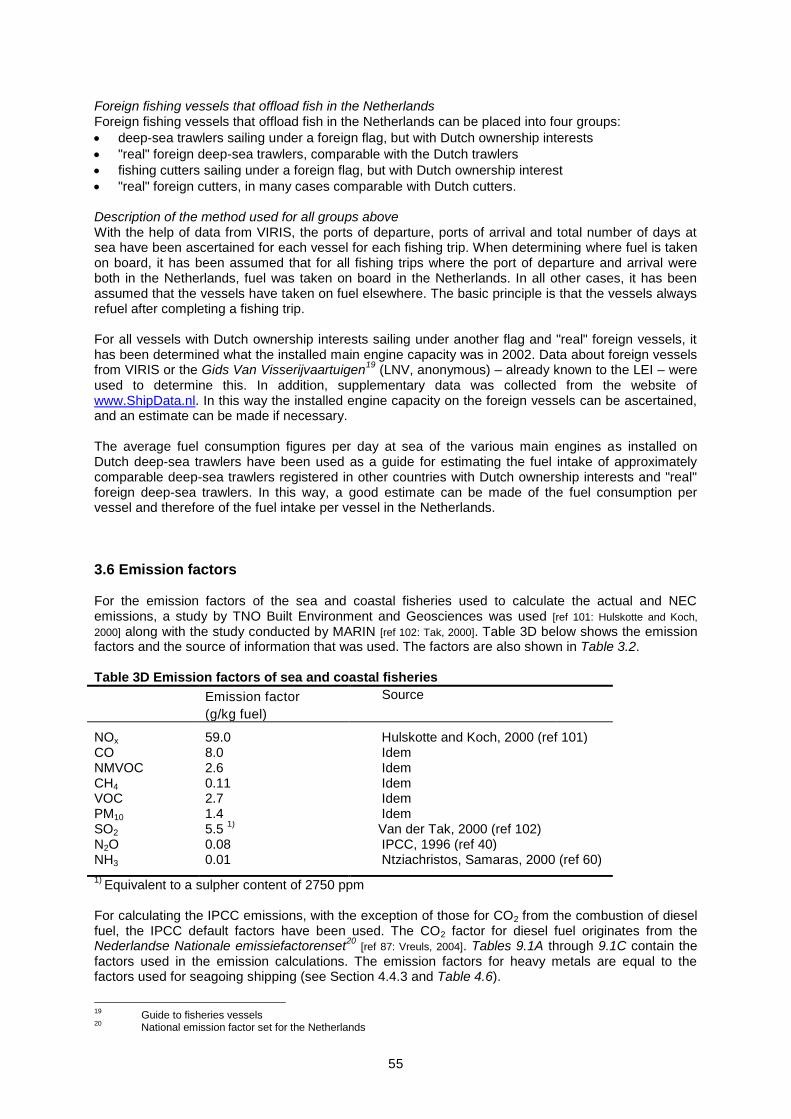
55
Foreign fishing vessels that offload fish in the Netherlands
Foreign fishing vessels that offload fish in the Netherlands can be placed into four groups:
deep-sea trawlers sailing under a foreign flag, but with Dutch ownership interests
"real" foreign deep-sea trawlers, comparable with the Dutch trawlers
fishing cutters sailing under a foreign flag, but with Dutch ownership interest
"real" foreign cutters, in many cases comparable with Dutch cutters. Description of the method used for all groups above With the help of data from VIRIS, the ports of departure, ports of arrival and total number of days at sea have been ascertained for each vessel for each fishing trip. When determining where fuel is taken on board, it has been assumed that for all fishing trips where the port of departure and arrival were both in the Netherlands, fuel was taken on board in the Netherlands. In all other cases, it has been assumed that the vessels have taken on fuel elsewhere. The basic principle is that the vessels always refuel after completing a fishing trip. For all vessels with Dutch ownership interests sailing under another flag and "real" foreign vessels, it has been determined what the installed main engine capacity was in 2002. Data about foreign vessels from VIRIS or the Gids Van Visserijvaartuigen
19 (LNV, anonymous) – already known to the LEI – were
used to determine this. In addition, supplementary data was collected from the website of www.ShipData.nl. In this way the installed engine capacity on the foreign vessels can be ascertained, and an estimate can be made if necessary. The average fuel consumption figures per day at sea of the various main engines as installed on Dutch deep-sea trawlers have been used as a guide for estimating the fuel intake of approximately comparable deep-sea trawlers registered in other countries with Dutch ownership interests and "real" foreign deep-sea trawlers. In this way, a good estimate can be made of the fuel consumption per vessel and therefore of the fuel intake per vessel in the Netherlands.
3.6 Emission factors For the emission factors of the sea and coastal fisheries used to calculate the actual and NEC emissions, a study by TNO Built Environment and Geosciences was used [ref 101: Hulskotte and Koch,
2000] along with the study conducted by MARIN [ref 102: Tak, 2000]. Table 3D below shows the emission factors and the source of information that was used. The factors are also shown in Table 3.2. Table 3D Emission factors of sea and coastal fisheries
Emission factor
(g/kg fuel)
Source
NOx 59.0 Hulskotte and Koch, 2000 (ref 101) CO 8.0 Idem NMVOC 2.6 Idem CH4 0.11 Idem VOC 2.7 Idem PM10 1.4 Idem SO2 5.5
1) Van der Tak, 2000 (ref 102)
N2O 0.08 IPCC, 1996 (ref 40) NH3 0.01 Ntziachristos, Samaras, 2000 (ref 60)
1) Equivalent to a sulpher content of 2750 ppm
For calculating the IPCC emissions, with the exception of those for CO2 from the combustion of diesel fuel, the IPCC default factors have been used. The CO2 factor for diesel fuel originates from the Nederlandse Nationale emissiefactorenset
20 [ref 87: Vreuls, 2004]. Tables 9.1A through 9.1C contain the
factors used in the emission calculations. The emission factors for heavy metals are equal to the factors used for seagoing shipping (see Section 4.4.3 and Table 4.6).
19
Guide to fisheries vessels 20
National emission factor set for the Netherlands
56
3.7 Substance profiles The VOC and PAH profiles have been ascertained by TNO Built Environment and Geosciences (Tables 2.7A through 2.7C) [ref 55: VROM, 1993]. Table 3.3 shows the assumed share of PM2,5 in the PM10-emissions.
3.8 Regionalization Not estimated. 3.9 Uncertainties The uncertainties in emission estimates have been derived from the uncertainty in activity data and emission factors in accordance with the rule that the uncertainty of the product of two uncertain factors is equal to the largest uncertainty in one of the two factors, therefore: - A * A = A - A * B = B - B * A = B - C * C = C - A * D = D
etc. The results are listed in Appendix 1.
3.10 Points for improvement See the monitoring protocol for the fisheries (1A4) on website of the Dutch Emission Registration.
3.11 Verification Every year, a comprehensive trend analysis is conducted where deviations larger than 5% with respect to the previous year must be explained.
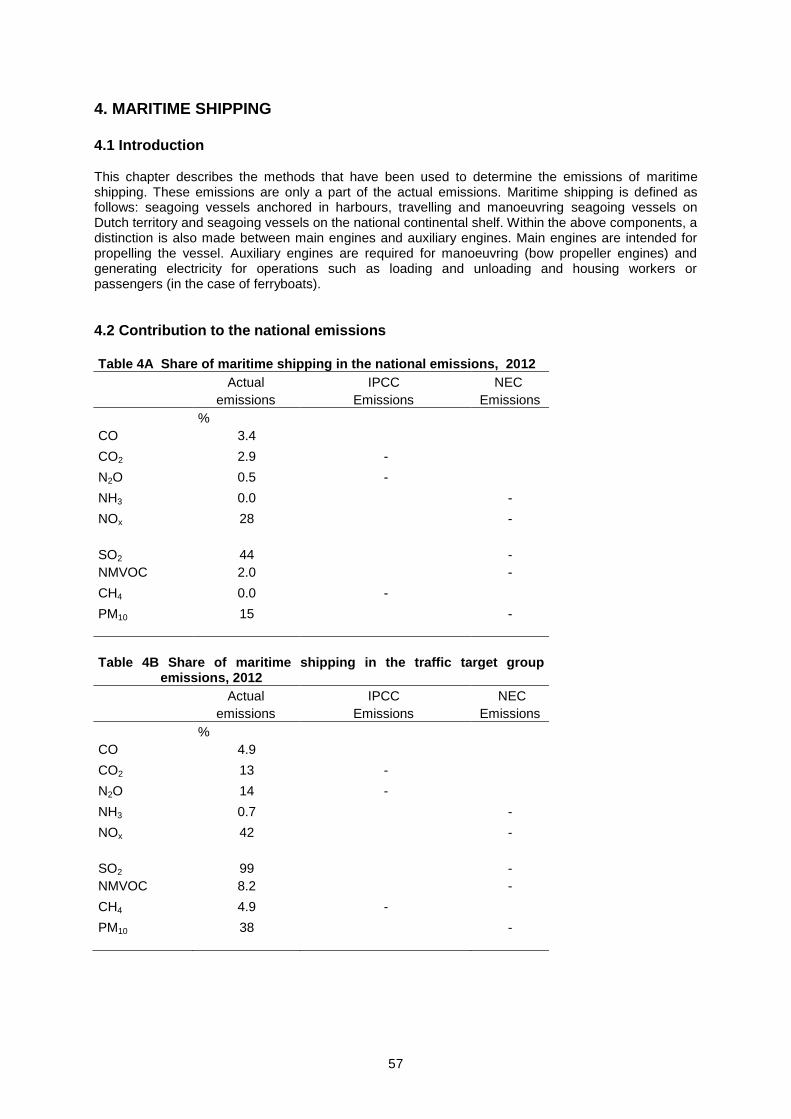
57
4. MARITIME SHIPPING
4.1 Introduction This chapter describes the methods that have been used to determine the emissions of maritime shipping. These emissions are only a part of the actual emissions. Maritime shipping is defined as follows: seagoing vessels anchored in harbours, travelling and manoeuvring seagoing vessels on Dutch territory and seagoing vessels on the national continental shelf. Within the above components, a distinction is also made between main engines and auxiliary engines. Main engines are intended for propelling the vessel. Auxiliary engines are required for manoeuvring (bow propeller engines) and generating electricity for operations such as loading and unloading and housing workers or passengers (in the case of ferryboats).
4.2 Contribution to the national emissions
Table 4A Share of maritime shipping in the national emissions, 2012
Actual IPCC NEC
emissions Emissions Emissions
%
CO 3.4
CO2 2.9 -
N2O 0.5 -
NH3 0.0 -
NOx 28 -
SO2 44 -
NMVOC 2.0 -
CH4 0.0 -
PM10 15 -
Table 4B Share of maritime shipping in the traffic target group
emissions, 2012
Actual IPCC NEC
emissions Emissions Emissions
%
CO 4.9
CO2 13 -
N2O 14 -
NH3 0.7 -
NOx 42 -
SO2 99 -
NMVOC 8.2 -
CH4 4.9 -
PM10 38 -
58
4.3 Description of the process Generating electricity in harbours takes place using diesel engines and, in the case of large seagoing vessels, also boilers. The propulsion of seagoing vessels on routes within the national continental shelf, other route-linked shipping channels on Dutch territory and generating electricity in harbours takes place primarily with the aid of diesel engines. Other engines which are based on the combustion of fossil fuels, but which are seldom used, are gas turbines and steam engines. The combustion processes that take place in all these engines cause emissions of air pollutants. The most important substances released are CO2, NOx, particulate matter (PM10), CO, VOC and SO2. CO2 and SO2 are caused by the oxidation of the carbon and sulphur present in the fuel through combustion. Emissions of these substances are therefore completely dependent on the contents of carbon and sulphur in the fuel and the quantity of fuel that is combusted. Nitrogen oxides (NOx) are primarily caused by the high temperatures and pressures in combustion engines, which cause the nitrogen present in the atmosphere to combine with oxygen. CO, VOC and PM10 are products of incomplete combustion. The emissions of the latter substances therefore depend primarily on the technological properties of the engines and the way in which these engines are used.
4.4 Calculation methods The original method for the calculation of the emissions has been developed in the framework of the EMS project, which is conducted on behalf of the Ministry of Transport, Public Works and Water Management (by TNO and other organizations) and is coordinated by the former Transport Research Centre (AVV), at present the Traffic and Shipping Department. The complete set of protocols (in Dutch) can be found on the website of the Dutch Emission Registration. Recently a modified calculation method has been introduced using AIS data (see van der Tak et al. 2010 , 2011, and 2012). 4.4.1 Combustion of motor fuels; CO, NOx, VOC, particulate matter (PM10/PM2,5), SO2 and CO2 The emissions are calculated by multiplying explanatory variables for emissions with emission factors. PM2,5 emissions are calculated from PM10 by using an emission profile. (see section 4.7).
Seagoing vessels at anchor Since 2008 the presence of sea-going vessels in the harbour areas Westerschelde, Rijnmond, IJmond and Eems is determined on the basis of AIS data. Since 2005 all trading vessels larger than 300 GT (Gross Ton) are equipped with an Automatic Identification System (AIS). AIS systems continuously transmit ship information such as destination, position, speed and course. Statistical information such as the name of the ship, the IMO number, ship type, size, destination, and draught are transmitted every 6 minutes. Dynamic information such as position, speed and course are transmitted every 2 to 6 seconds. A survey conducted by TNO on board 89 large seagoing vessels in the Rotterdam harbour in 2003 was used to determine the average fuel consumption per type of seagoing vessel per time unit during the period at anchor of the vessels in the harbour (see Appendix 1 of the EMS protocol). This fuel consumption per vessel was related to the size of the seagoing vessel in gross tonnage (GT). In addition, for each type of seagoing vessel, the allocation of the various types of fuel to the various types of engines and boilers was determined. The total fuel consumption is calculated by multiplying the period at anchor of visiting vessels (AIS data) by their fuel consumption as determined in the EMS model. The calculation method developed for the EMS protocol (see formulas 1, 2, and 3) has been continued, with exception of the period at anchor and the anchor location, which are determined on the basis of AIS data.
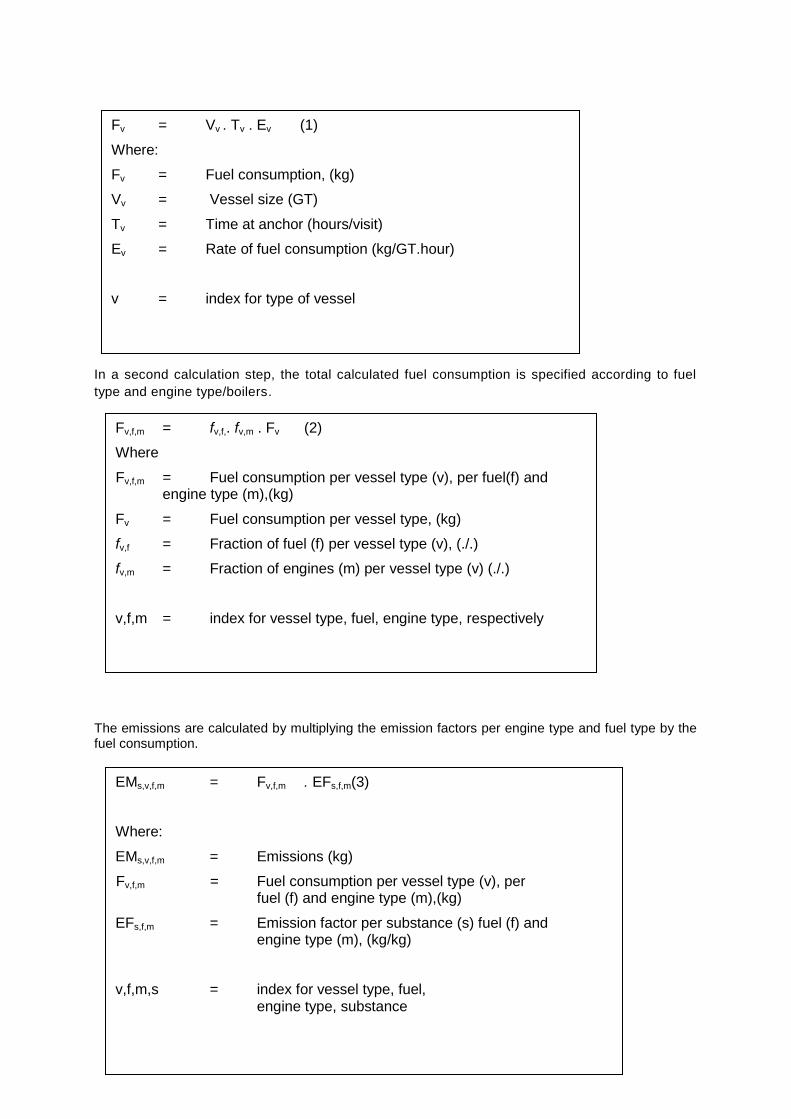
59
In a second calculation step, the total calculated fuel consumption is specified according to fuel
type and engine type/boilers.
The emissions are calculated by multiplying the emission factors per engine type and fuel type by the fuel consumption.
Fv,f,m = fv,f,. fv,m . Fv (2)
Where
Fv,f,m = Fuel consumption per vessel type (v), per fuel(f) and engine type (m),(kg)
Fv = Fuel consumption per vessel type, (kg)
fv,f = Fraction of fuel (f) per vessel type (v), (./.)
fv,m = Fraction of engines (m) per vessel type (v) (./.)
v,f,m = index for vessel type, fuel, engine type, respectively
EMs,v,f,m = Fv,f,m . EFs,f,m(3)
Where:
EMs,v,f,m = Emissions (kg)
Fv,f,m = Fuel consumption per vessel type (v), per fuel (f) and engine type (m),(kg)
EFs,f,m = Emission factor per substance (s) fuel (f) and engine type (m), (kg/kg)
v,f,m,s = index for vessel type, fuel, engine type, substance
Fv = Vv . Tv . Ev (1)
Where:
Fv = Fuel consumption, (kg)
Vv = Vessel size (GT)
Tv = Time at anchor (hours/visit)
Ev = Rate of fuel consumption (kg/GT.hour)
v = index for type of vessel
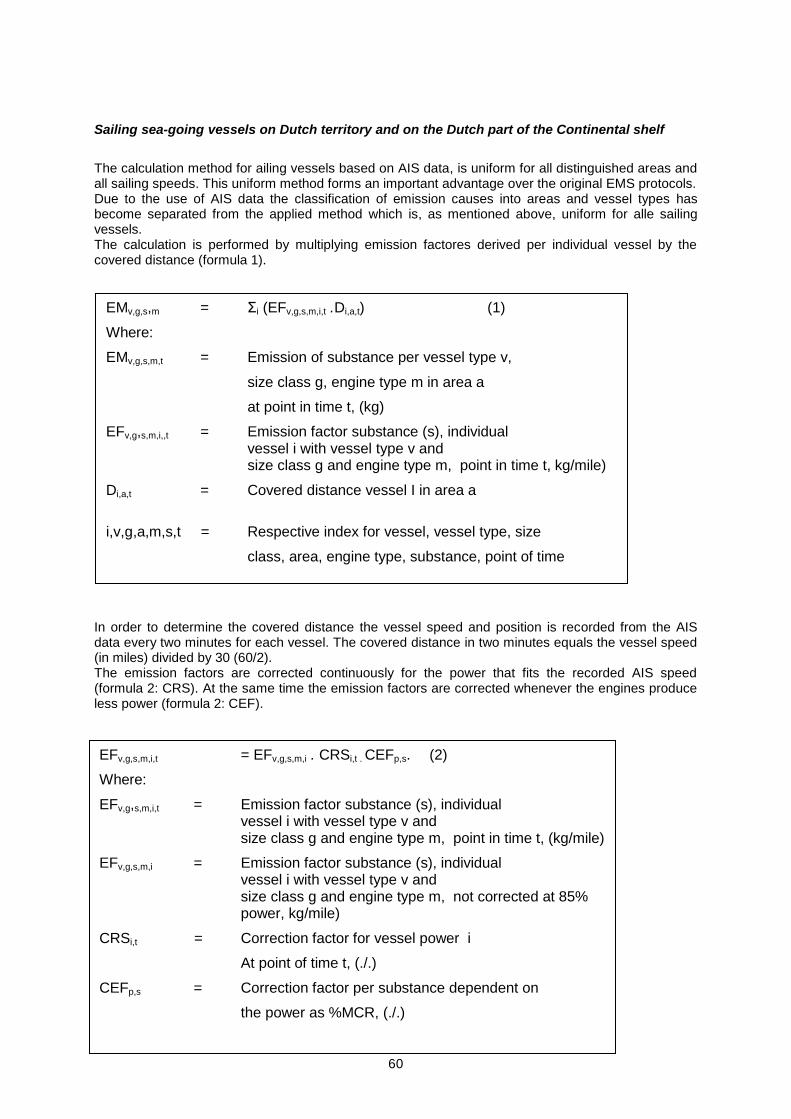
60
Sailing sea-going vessels on Dutch territory and on the Dutch part of the Continental shelf
The calculation method for ailing vessels based on AIS data, is uniform for all distinguished areas and all sailing speeds. This uniform method forms an important advantage over the original EMS protocols. Due to the use of AIS data the classification of emission causes into areas and vessel types has become separated from the applied method which is, as mentioned above, uniform for alle sailing vessels. The calculation is performed by multiplying emission factores derived per individual vessel by the covered distance (formula 1).
In order to determine the covered distance the vessel speed and position is recorded from the AIS data every two minutes for each vessel. The covered distance in two minutes equals the vessel speed (in miles) divided by 30 (60/2). The emission factors are corrected continuously for the power that fits the recorded AIS speed (formula 2: CRS). At the same time the emission factors are corrected whenever the engines produce less power (formula 2: CEF).
EMv,g,s,m = Σi (EFv,g,s,m,i,t .Di,a,t) (1)
Where:
EMv,g,s,m,t = Emission of substance per vessel type v,
size class g, engine type m in area a
at point in time t, (kg)
EFv,g,s,m,i,,t = Emission factor substance (s), individual vessel i with vessel type v and
size class g and engine type m, point in time t, kg/mile)
Di,a,t = Covered distance vessel I in area a
i,v,g,a,m,s,t = Respective index for vessel, vessel type, size
class, area, engine type, substance, point of time
EFv,g,s,m,i,t = EFv,g,s,m,i . CRSi,t . CEFp,s. (2)
Where:
EFv,g,s,m,i,t = Emission factor substance (s), individual vessel i with vessel type v and
size class g and engine type m, point in time t, (kg/mile)
EFv,g,s,m,i = Emission factor substance (s), individual vessel i with vessel type v and
size class g and engine type m, not corrected at 85% power, kg/mile)
CRSi,t = Correction factor for vessel power i
At point of time t, (./.)
CEFp,s = Correction factor per substance dependent on
the power as %MCR, (./.)
v,g,l,h,s,p = resp. index voor scheepstype, lengteklasse,
haven, stof, MCR%
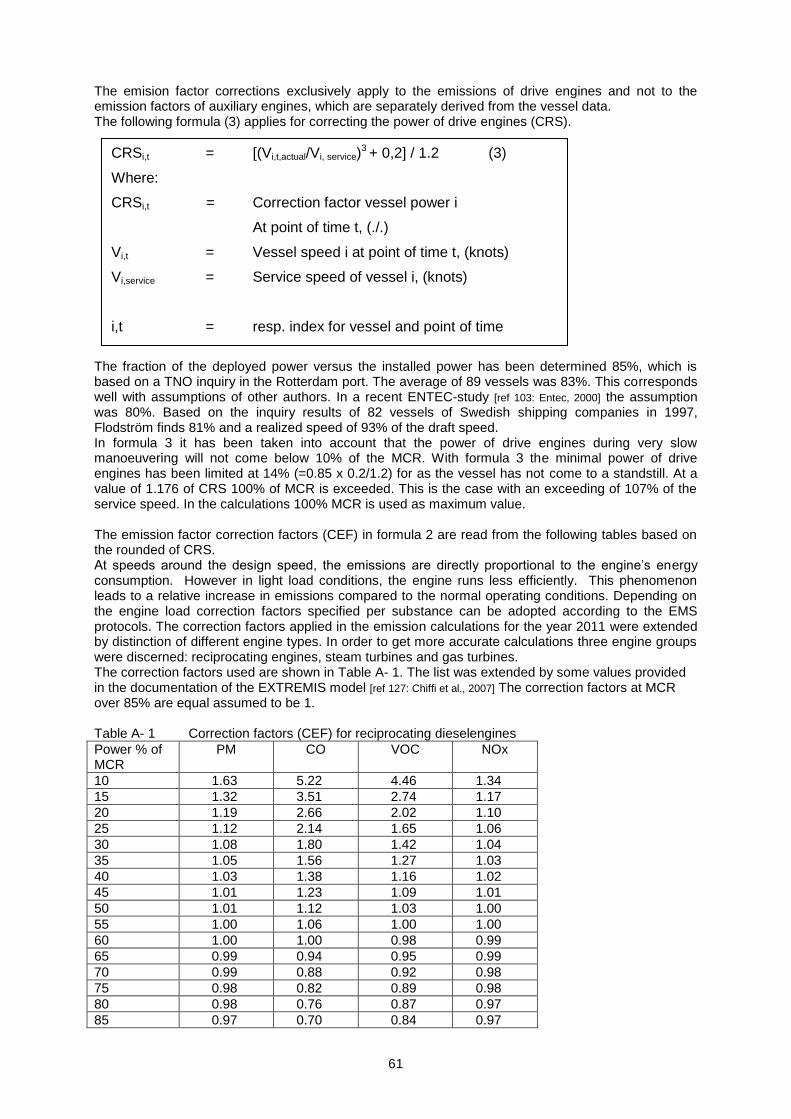
61
The emision factor corrections exclusively apply to the emissions of drive engines and not to the emission factors of auxiliary engines, which are separately derived from the vessel data. The following formula (3) applies for correcting the power of drive engines (CRS).
The fraction of the deployed power versus the installed power has been determined 85%, which is based on a TNO inquiry in the Rotterdam port. The average of 89 vessels was 83%. This corresponds well with assumptions of other authors. In a recent ENTEC-study [ref 103: Entec, 2000] the assumption was 80%. Based on the inquiry results of 82 vessels of Swedish shipping companies in 1997, Flodström finds 81% and a realized speed of 93% of the draft speed. In formula 3 it has been taken into account that the power of drive engines during very slow manoeuvering will not come below 10% of the MCR. With formula 3 the minimal power of drive engines has been limited at 14% (=0.85 x 0.2/1.2) for as the vessel has not come to a standstill. At a value of 1.176 of CRS 100% of MCR is exceeded. This is the case with an exceeding of 107% of the service speed. In the calculations 100% MCR is used as maximum value. The emission factor correction factors (CEF) in formula 2 are read from the following tables based on the rounded of CRS. At speeds around the design speed, the emissions are directly proportional to the engine’s energy consumption. However in light load conditions, the engine runs less efficiently. This phenomenon leads to a relative increase in emissions compared to the normal operating conditions. Depending on the engine load correction factors specified per substance can be adopted according to the EMS protocols. The correction factors applied in the emission calculations for the year 2011 were extended by distinction of different engine types. In order to get more accurate calculations three engine groups were discerned: reciprocating engines, steam turbines and gas turbines. The correction factors used are shown in Table A- 1. The list was extended by some values provided in the documentation of the EXTREMIS model [ref 127: Chiffi et al., 2007] The correction factors at MCR over 85% are equal assumed to be 1. Table A- 1 Correction factors (CEF) for reciprocating dieselengines
Power % of MCR
PM CO VOC NOx
10 1.63 5.22 4.46 1.34
15 1.32 3.51 2.74 1.17
20 1.19 2.66 2.02 1.10
25 1.12 2.14 1.65 1.06
30 1.08 1.80 1.42 1.04
35 1.05 1.56 1.27 1.03
40 1.03 1.38 1.16 1.02
45 1.01 1.23 1.09 1.01
50 1.01 1.12 1.03 1.00
55 1.00 1.06 1.00 1.00
60 1.00 1.00 0.98 0.99
65 0.99 0.94 0.95 0.99
70 0.99 0.88 0.92 0.98
75 0.98 0.82 0.89 0.98
80 0.98 0.76 0.87 0.97
85 0.97 0.70 0.84 0.97
CRSi,t = [(Vi,t,actual/Vi, service)3 + 0,2] / 1.2 (3)
Where:
CRSi,t = Correction factor vessel power i
At point of time t, (./.)
Vi,t = Vessel speed i at point of time t, (knots)
Vi,service = Service speed of vessel i, (knots)
i,t = resp. index for vessel and point of time
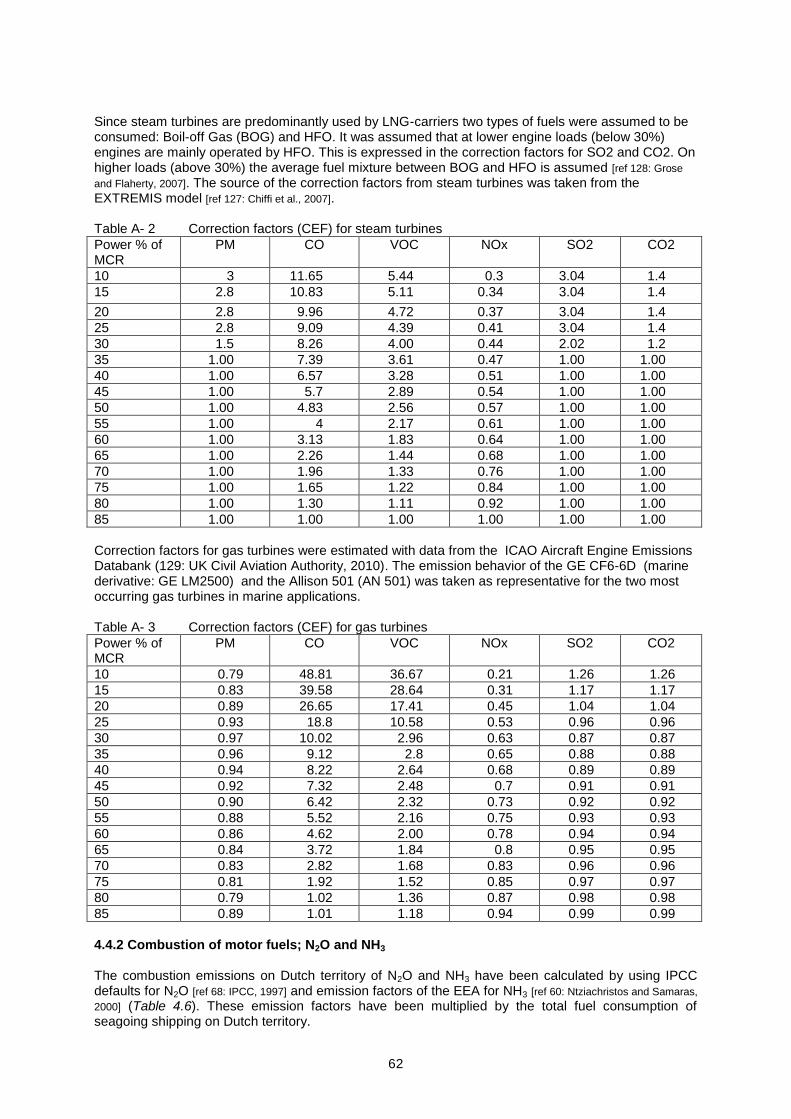
62
Since steam turbines are predominantly used by LNG-carriers two types of fuels were assumed to be consumed: Boil-off Gas (BOG) and HFO. It was assumed that at lower engine loads (below 30%) engines are mainly operated by HFO. This is expressed in the correction factors for SO2 and CO2. On higher loads (above 30%) the average fuel mixture between BOG and HFO is assumed [ref 128: Grose
and Flaherty, 2007]. The source of the correction factors from steam turbines was taken from the EXTREMIS model [ref 127: Chiffi et al., 2007]. Table A- 2 Correction factors (CEF) for steam turbines
Power % of MCR
PM CO VOC NOx SO2 CO2
10 3 11.65 5.44 0.3 3.04 1.4
15 2.8 10.83 5.11 0.34 3.04 1.4
20 2.8 9.96 4.72 0.37 3.04 1.4
25 2.8 9.09 4.39 0.41 3.04 1.4
30 1.5 8.26 4.00 0.44 2.02 1.2
35 1.00 7.39 3.61 0.47 1.00 1.00
40 1.00 6.57 3.28 0.51 1.00 1.00
45 1.00 5.7 2.89 0.54 1.00 1.00
50 1.00 4.83 2.56 0.57 1.00 1.00
55 1.00 4 2.17 0.61 1.00 1.00
60 1.00 3.13 1.83 0.64 1.00 1.00
65 1.00 2.26 1.44 0.68 1.00 1.00
70 1.00 1.96 1.33 0.76 1.00 1.00
75 1.00 1.65 1.22 0.84 1.00 1.00
80 1.00 1.30 1.11 0.92 1.00 1.00
85 1.00 1.00 1.00 1.00 1.00 1.00
Correction factors for gas turbines were estimated with data from the ICAO Aircraft Engine Emissions Databank (129: UK Civil Aviation Authority, 2010). The emission behavior of the GE CF6-6D (marine derivative: GE LM2500) and the Allison 501 (AN 501) was taken as representative for the two most occurring gas turbines in marine applications. Table A- 3 Correction factors (CEF) for gas turbines
Power % of MCR
PM CO VOC NOx SO2 CO2
10 0.79 48.81 36.67 0.21 1.26 1.26
15 0.83 39.58 28.64 0.31 1.17 1.17
20 0.89 26.65 17.41 0.45 1.04 1.04
25 0.93 18.8 10.58 0.53 0.96 0.96
30 0.97 10.02 2.96 0.63 0.87 0.87
35 0.96 9.12 2.8 0.65 0.88 0.88
40 0.94 8.22 2.64 0.68 0.89 0.89
45 0.92 7.32 2.48 0.7 0.91 0.91
50 0.90 6.42 2.32 0.73 0.92 0.92
55 0.88 5.52 2.16 0.75 0.93 0.93
60 0.86 4.62 2.00 0.78 0.94 0.94
65 0.84 3.72 1.84 0.8 0.95 0.95
70 0.83 2.82 1.68 0.83 0.96 0.96
75 0.81 1.92 1.52 0.85 0.97 0.97
80 0.79 1.02 1.36 0.87 0.98 0.98
85 0.89 1.01 1.18 0.94 0.99 0.99
4.4.2 Combustion of motor fuels; N2O and NH3 The combustion emissions on Dutch territory of N2O and NH3 have been calculated by using IPCC defaults for N2O [ref 68: IPCC, 1997] and emission factors of the EEA for NH3 [ref 60: Ntziachristos and Samaras,
2000] (Table 4.6). These emission factors have been multiplied by the total fuel consumption of seagoing shipping on Dutch territory.
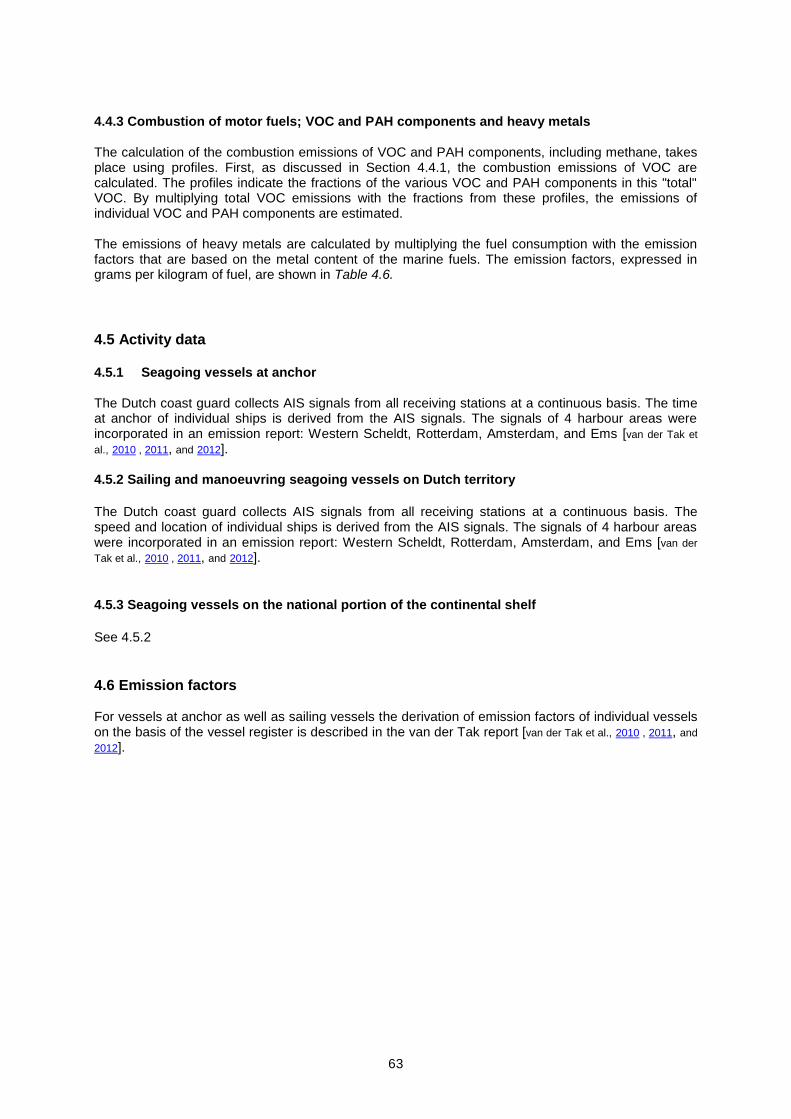
63
4.4.3 Combustion of motor fuels; VOC and PAH components and heavy metals The calculation of the combustion emissions of VOC and PAH components, including methane, takes place using profiles. First, as discussed in Section 4.4.1, the combustion emissions of VOC are calculated. The profiles indicate the fractions of the various VOC and PAH components in this "total" VOC. By multiplying total VOC emissions with the fractions from these profiles, the emissions of individual VOC and PAH components are estimated. The emissions of heavy metals are calculated by multiplying the fuel consumption with the emission factors that are based on the metal content of the marine fuels. The emission factors, expressed in grams per kilogram of fuel, are shown in Table 4.6.
4.5 Activity data 4.5.1 Seagoing vessels at anchor The Dutch coast guard collects AIS signals from all receiving stations at a continuous basis. The time at anchor of individual ships is derived from the AIS signals. The signals of 4 harbour areas were incorporated in an emission report: Western Scheldt, Rotterdam, Amsterdam, and Ems [van der Tak et
al., 2010 , 2011, and 2012]. 4.5.2 Sailing and manoeuvring seagoing vessels on Dutch territory
The Dutch coast guard collects AIS signals from all receiving stations at a continuous basis. The speed and location of individual ships is derived from the AIS signals. The signals of 4 harbour areas were incorporated in an emission report: Western Scheldt, Rotterdam, Amsterdam, and Ems [van der
Tak et al., 2010 , 2011, and 2012].
4.5.3 Seagoing vessels on the national portion of the continental shelf
See 4.5.2
4.6 Emission factors For vessels at anchor as well as sailing vessels the derivation of emission factors of individual vessels on the basis of the vessel register is described in the van der Tak report [van der Tak et al., 2010 , 2011, and 2012].
64
4.7 Substance profiles The VOC and PAH profiles have been ascertained by TNO. (see Tables 4.7A, B and C) [ref 55: VROM,
1993]. Table 4.8 shows the assumed share of PM2,5 in the PM10-emissions 4.8 Regionalization The Maritime Research Institute Netherlands (MARIN) processes the AIS data yearly to a data set of regionalized emission data. Within the Dutch Emission Registration the energie consumption and the variabel GT hours per vessel type are used for regionalizing emissions (Hulskotte, 2010). Table 4C Regionalization of seagoing shipping emissions
Allocation parameter
Update frequency
Seagoing shipping (on the national continental shelf, excluding seagoing fisheries) Combustion, spills
TJ per vessel type per 5*5km Yearly, based on AIS data
Seagoing shipping on Dutch territory Seagoing fisheries (on national continental shelf) Combustion, spills
TJ per vessel type per 5*5km Number of nautical miles sailed per 5*5km
Yearly, based on AIS data Every three years, most recently in 2006 (data from 2004)
Seagoing shipping (in harbours, excluding seagoing fisheries) Corrosion, spills
GT hours per vessel type per 5*5km
Yearly, based on AIS data
Seagoing fisheries (in harbours), corrosion, spills
Number of vessels entering the harbour per year
Every three years, most recently in 2006 (data from 2004)
65
4.9 Uncertainties The uncertainties in emission estimates have been derived from the uncertainty in activity data and emission factors in accordance with the rule that the uncertainty of the product of two uncertain factors is equal to the largest uncertainty in one of the two factors, therefore: - A * A = A - A * B = B - B * A = B - C * C = C - A * D = D
etc. The results are shown in Appendix 1.
4.10 Points for improvement 4.10.1 Seagoing vessels at anchor
The fuel consumption of vessels at anchor is not linear to the size of the vessels. The determination
of non linear correlations between the vessel size and fuel consumption could lead to an improvement
of the results.
4.10.2 Sailing and manoeuvring seagoing vessels on Dutch territory
- Implementing measurements in practice concerning particulate matter emissions from seagoing
vessels that burn heavy fuel oil.
- Determine the possibility of conducting a systematic data collection on the sulphur content of
fuels. To know the extent of the uphold of IMO Annex VI is an important parameter in the
calculation of SO2 and PM emissions. 4.10.3 Seagoing vessels on the national continental shelf
- Implementing measurements in practice concerning particulate matter emissions from seagoing
vessels that burn heavy fuel oil.
- The service speed of the vessels should perhaps be modified somewhat to be more in
accordance with reality.
- Determine the possibility of conducting a systematic data collection on the sulphur content of
fuels.
4.11 Verification Every year a comprehensive trend analysis is conducted, where deviations larger than 5% with respect to the previous year must be explained.
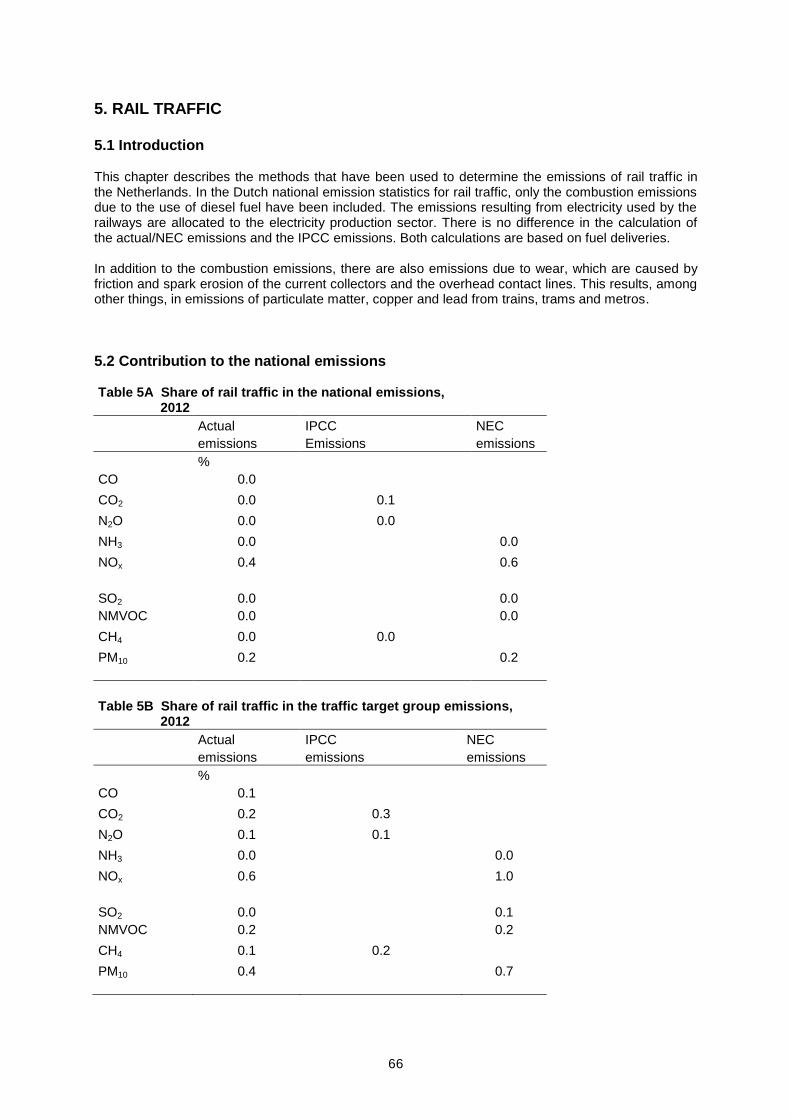
66
5. RAIL TRAFFIC
5.1 Introduction This chapter describes the methods that have been used to determine the emissions of rail traffic in the Netherlands. In the Dutch national emission statistics for rail traffic, only the combustion emissions due to the use of diesel fuel have been included. The emissions resulting from electricity used by the railways are allocated to the electricity production sector. There is no difference in the calculation of the actual/NEC emissions and the IPCC emissions. Both calculations are based on fuel deliveries. In addition to the combustion emissions, there are also emissions due to wear, which are caused by friction and spark erosion of the current collectors and the overhead contact lines. This results, among other things, in emissions of particulate matter, copper and lead from trains, trams and metros.
5.2 Contribution to the national emissions Table 5A Share of rail traffic in the national emissions,
2012
Actual IPCC NEC
emissions Emissions emissions
%
CO 0.0
CO2 0.0 0.1
N2O 0.0 0.0
NH3 0.0 0.0
NOx 0.4 0.6
SO2 0.0 0.0
NMVOC 0.0 0.0
CH4 0.0 0.0
PM10 0.2 0.2
Table 5B Share of rail traffic in the traffic target group emissions,
2012
Actual IPCC NEC
emissions emissions emissions
%
CO 0.1
CO2 0.2 0.3
N2O 0.1 0.1
NH3 0.0 0.0
NOx 0.6 1.0
SO2 0.0 0.1
NMVOC 0.2 0.2
CH4 0.1 0.2
PM10 0.4 0.7
67
5.3 Description of the process For the traffic and transport target group, only the direct emissions of the rail traffic have been included. These are primarily the emissions of air-polluting substances caused by the combustion processes that take place in the engines of the diesel locomotives. In addition, there are emissions caused by wear processes. With electrically-propelled trains (for both passenger and goods transport), trams and metros, there is wear due to friction and spark erosion of the current collectors and overhead contact lines. This results, among other things, in emissions of particulate matter, copper and lead.
5.4 Calculation methods 5.4.1 Combustion emissions of CO, VOC, NOx, PM10/PM2,5, SO2, CO2 and heavy metals The combustion emissions of rail traffic are estimated by multiplying the fuel consumption by the emission factors per kg of consumed fuel. PM2,5 emissions are calculated from PM10 by using an emission profile. (see section 5.7). 5.4.2 Combustion emissions of N2O and NH3 The combustion emissions of N2O and NH3 on Dutch territory are calculated by using the IPCC defaults for N2O [ref 68: IPCC, 1997] and the emission factors of the EEA for NH3 [ref 60: Ntziachristos and
Samaras, 2000] (see Table 5.2). These emission factors have been multiplied by the total fuel consumption of rail traffic with diesel engines on Dutch territory. 5.4.3 PM10 and heavy metals due to wear of overhead contact lines and carbon brushes The emission calculations are based on a study conducted by NSTO (currently AEA Technology) in 1992 concerning the wear of overhead contact lines and the carbon brushes of the current collectors on electric trains [ref 72: CTO, 1993]. The total emission of copper in 1992 was estimated by the NSTO at 20.7 ktonnes, of which 3 ktonnes was attributed to carbon brushes. In combination with the electricity consumption for that year provided by the Dutch railways (approx. 1200 million kWh) and the fact that overhead contact lines are comprised entirely of copper, and carbon brushes are comprised of 25% copper, the total quantity of wear particles originating from overhead contact lines and current collectors can be determined per kWh of electricity consumption (overhead contact lines: approx. 15 mg/kWh; carbon brushes: approx. 10 mg/kWh). For trams and metros, the wear of the overhead contact lines is assumed to be identical per kWh of electricity consumption. The wear of current collectors is not included, because no information is available on this topic. Carbon brushes, besides copper, contain 10% lead and 65% carbon. Based on the NSTO study referred to above, the percentage of particulate matter in the total quantity of wear debris is estimated at 20%. Due to their low weight, these particles probably remain airborne. According to TNO Built Environment and Geosciences [ref 30: Coenen and Hulskotte, 1998], approximately 65% of the wear debris ends up in the immediate vicinity of the railway, while 5% enters the ditches alongside the railway. According to the NSTO study, the remainder of the wear debris (10%) does not enter the environment, but attaches itself to the train surface and is captured in the train washing facilities. 5.5 Activity data For the most recent years the fuel consumption data originate from VIVENS (Association for joint purchase of energy for railway companies); the filling stations are managed by ProRail. Table 5.1 shows the consumption figures and the origin of the data..
68
5.6 Emission factors 5.6.1 Combustion emissions of CO, VOC, NOx, PM10, SO2, CO2 and heavy metals The emission factors, expressed in grams of emissions per kg of combusted fuel, are ascertained by the MNP (the Netherlands Environmental Assessment Agency - formerly the National Institute for Public Health and the Environment) [ref 71: RIVM/LAE, 1993] in consultation with the former NS
21 (see
Table 5.2). The emissions of heavy metals are calculated by multiplying the fuel consumption with the emission factors that are based on the metal content of the fuels. The emission factors in grams per kilogramme of fuel are identical to the factors for diesel fuel for passenger cars (Table 1.26A). 5.6.2 Combustion emissions of N2O and NH3 The emission factors used for N2O are the same as the IPCC default values [ref 68: IPCC, 1997]. For the calculation of the NH3 emissions, the EEA values were used [ref 60: Ntziachristos and Samaras, 2000]. 5.6.3 PM10 and heavy metals due to wear of overhead contact lines and carbon brushes See 5.4.3.
5.7 Substance profiles The VOC and PAH profiles have been ascertained by TNO Built Environment and Geosciences; these are equivalent to the diesel profiles for traffic on the inland waterways (Tables 2.7 A, B and C) [ref 55:
VROM, 1993]. Table 5.3 shows the assumed share of PM2,5 in the PM10 emissions.
5.8 Regionalization The emissions of rail transport (goods and passengers) are divided proportionally according to the number of vehicle kilometres per day per railway section on average for one year. A distinction is made between diesel and electrical trains. The intensities are calculated based on the data from AEA Rail Technologies about the number and type of rail vehicles per hour per railway section. Table 5C Regionalization of rail traffic emissions
Allocation parameter
Update frequency
Railway combustion emissions Intensities per railway section, diesel propulsion (rail vehicle km)
Every three years, most recently in 2004 (data from 2002)
Railway wear debris emissions, copper
Intensities per railway section, electrical propulsion (rail vehicle km)
Every three years, most recently in 2004 (data from 2002)
21
Dutch Railways
69
5.9 Uncertainties The uncertainties in emission estimates have been derived from the uncertainty in activity data and emission factors in accordance with the rule that the uncertainty of the product of two uncertain factors is equal to the largest uncertainty in one of the two factors, therefore: - A * A = A - A * B = B - B * A = B - C * C = C - A * D = D
etc. The results are shown in Appendix 1.
5.10 Points for improvement The emission factors are outdated (see 5.6.1). In view of the major changes on the rail network, especially with diesel-powered goods transport, a study into the necessity of revising these factors is advisable. There is doubt about the correctness of the applied data for diesel fuel consumption. De figures of recent years seem on the low side. Statistics Netherlands is investigating the matter.
5.11 Verification Every year a comprehensive trend analysis is conducted, where deviations larger than 5% with respect to the previous year must be explained.
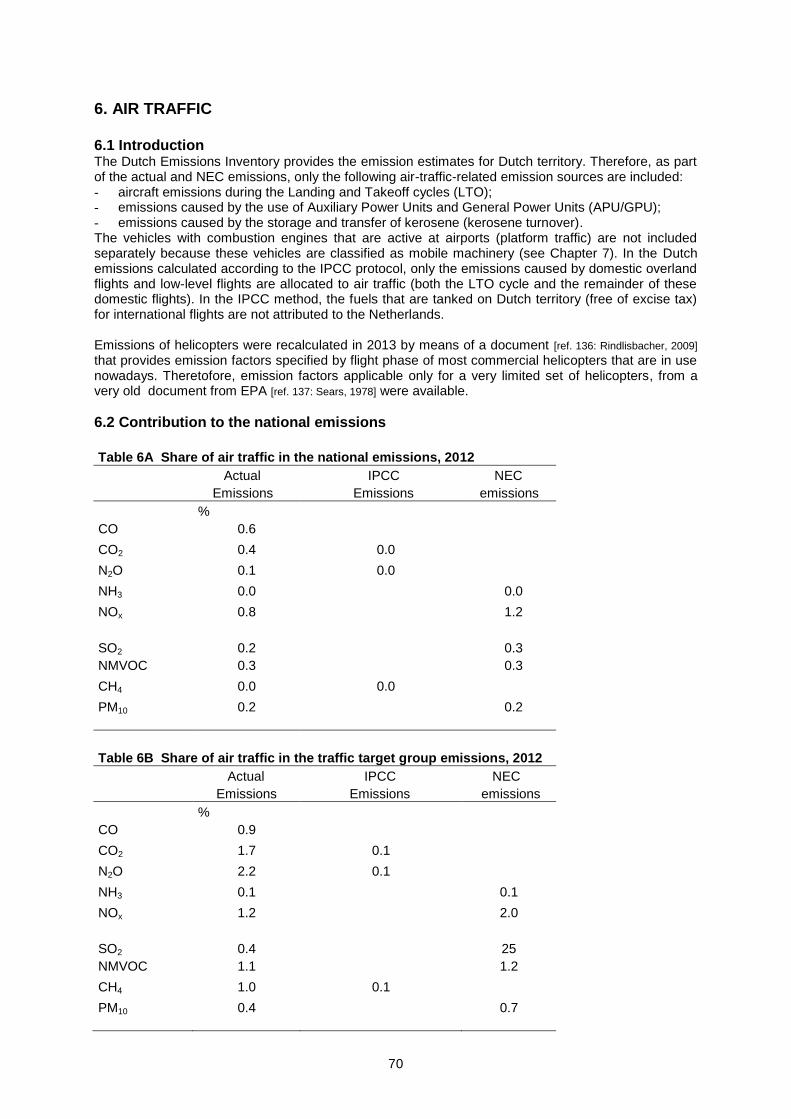
70
6. AIR TRAFFIC
6.1 Introduction The Dutch Emissions Inventory provides the emission estimates for Dutch territory. Therefore, as part of the actual and NEC emissions, only the following air-traffic-related emission sources are included: - aircraft emissions during the Landing and Takeoff cycles (LTO); - emissions caused by the use of Auxiliary Power Units and General Power Units (APU/GPU); - emissions caused by the storage and transfer of kerosene (kerosene turnover). The vehicles with combustion engines that are active at airports (platform traffic) are not included separately because these vehicles are classified as mobile machinery (see Chapter 7). In the Dutch emissions calculated according to the IPCC protocol, only the emissions caused by domestic overland flights and low-level flights are allocated to air traffic (both the LTO cycle and the remainder of these domestic flights). In the IPCC method, the fuels that are tanked on Dutch territory (free of excise tax) for international flights are not attributed to the Netherlands. Emissions of helicopters were recalculated in 2013 by means of a document [ref. 136: Rindlisbacher, 2009] that provides emission factors specified by flight phase of most commercial helicopters that are in use nowadays. Theretofore, emission factors applicable only for a very limited set of helicopters, from a very old document from EPA [ref. 137: Sears, 1978] were available.
6.2 Contribution to the national emissions
Table 6A Share of air traffic in the national emissions, 2012
Actual IPCC NEC
Emissions Emissions emissions
%
CO 0.6
CO2 0.4 0.0
N2O 0.1 0.0
NH3 0.0 0.0
NOx 0.8 1.2
SO2 0.2 0.3
NMVOC 0.3 0.3
CH4 0.0 0.0
PM10 0.2 0.2
Table 6B Share of air traffic in the traffic target group emissions, 2012
Actual IPCC NEC
Emissions Emissions emissions
%
CO 0.9
CO2 1.7 0.1
N2O 2.2 0.1
NH3 0.1 0.1
NOx 1.2 2.0
SO2 0.4 25
NMVOC 1.1 1.2
CH4 1.0 0.1
PM10 0.4 0.7
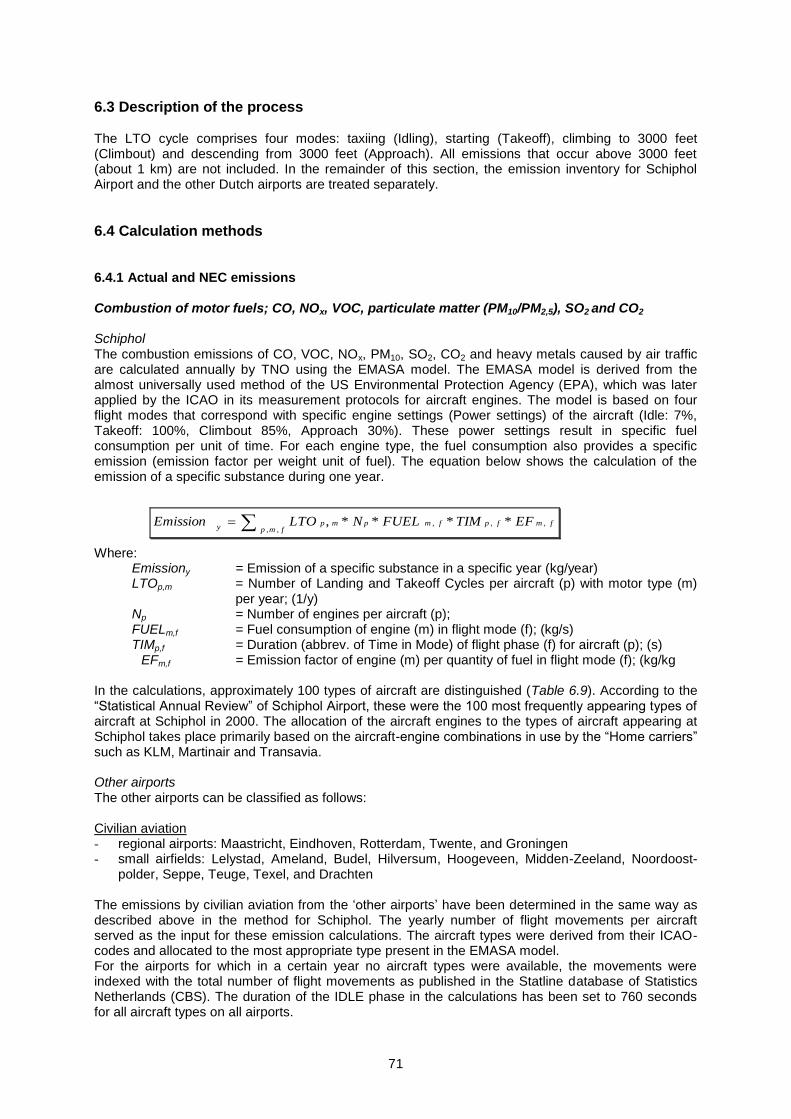
71
6.3 Description of the process The LTO cycle comprises four modes: taxiing (Idling), starting (Takeoff), climbing to 3000 feet (Climbout) and descending from 3000 feet (Approach). All emissions that occur above 3000 feet (about 1 km) are not included. In the remainder of this section, the emission inventory for Schiphol Airport and the other Dutch airports are treated separately.
6.4 Calculation methods 6.4.1 Actual and NEC emissions Combustion of motor fuels; CO, NOx, VOC, particulate matter (PM10/PM2,5), SO2 and CO2 Schiphol The combustion emissions of CO, VOC, NOx, PM10, SO2, CO2 and heavy metals caused by air traffic are calculated annually by TNO using the EMASA model. The EMASA model is derived from the almost universally used method of the US Environmental Protection Agency (EPA), which was later applied by the ICAO in its measurement protocols for aircraft engines. The model is based on four flight modes that correspond with specific engine settings (Power settings) of the aircraft (Idle: 7%, Takeoff: 100%, Climbout 85%, Approach 30%). These power settings result in specific fuel consumption per unit of time. For each engine type, the fuel consumption also provides a specific emission (emission factor per weight unit of fuel). The equation below shows the calculation of the emission of a specific substance during one year.
Where: Emissiony = Emission of a specific substance in a specific year (kg/year) LTOp,m = Number of Landing and Takeoff Cycles per aircraft (p) with motor type (m)
per year; (1/y) Np = Number of engines per aircraft (p); FUELm,f = Fuel consumption of engine (m) in flight mode (f); (kg/s) TIMp,f = Duration (abbrev. of Time in Mode) of flight phase (f) for aircraft (p); (s) EFm,f = Emission factor of engine (m) per quantity of fuel in flight mode (f); (kg/kg In the calculations, approximately 100 types of aircraft are distinguished (Table 6.9). According to the “Statistical Annual Review” of Schiphol Airport, these were the 100 most frequently appearing types of aircraft at Schiphol in 2000. The allocation of the aircraft engines to the types of aircraft appearing at Schiphol takes place primarily based on the aircraft-engine combinations in use by the “Home carriers” such as KLM, Martinair and Transavia. Other airports The other airports can be classified as follows: Civilian aviation - regional airports: Maastricht, Eindhoven, Rotterdam, Twente, and Groningen - small airfields: Lelystad, Ameland, Budel, Hilversum, Hoogeveen, Midden-Zeeland, Noordoost-
polder, Seppe, Teuge, Texel, and Drachten The emissions by civilian aviation from the ‘other airports’ have been determined in the same way as described above in the method for Schiphol. The yearly number of flight movements per aircraft served as the input for these emission calculations. The aircraft types were derived from their ICAO-codes and allocated to the most appropriate type present in the EMASA model. For the airports for which in a certain year no aircraft types were available, the movements were indexed with the total number of flight movements as published in the Statline database of Statistics Netherlands (CBS). The duration of the IDLE phase in the calculations has been set to 760 seconds for all aircraft types on all airports.
fmp
fmfpfmpmpy
EFTIMFUELNLTOEmission,,
,,, ****,
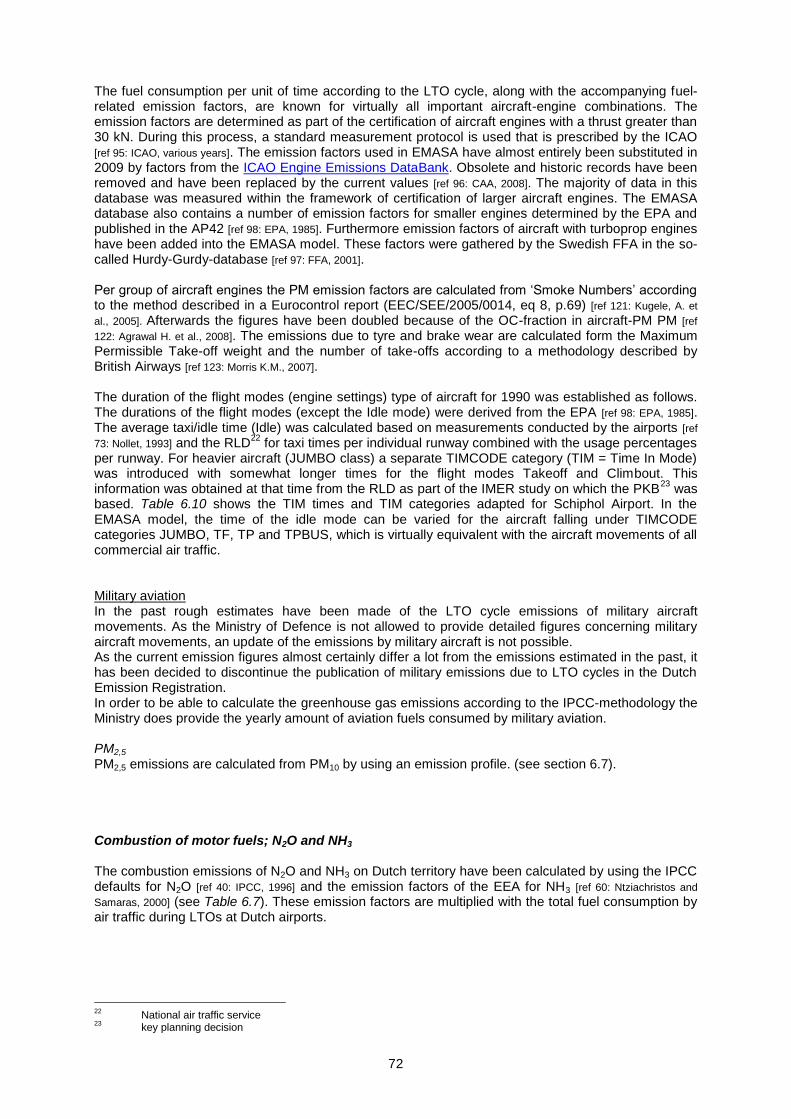
72
The fuel consumption per unit of time according to the LTO cycle, along with the accompanying fuel-related emission factors, are known for virtually all important aircraft-engine combinations. The emission factors are determined as part of the certification of aircraft engines with a thrust greater than 30 kN. During this process, a standard measurement protocol is used that is prescribed by the ICAO [ref 95: ICAO, various years]. The emission factors used in EMASA have almost entirely been substituted in 2009 by factors from the ICAO Engine Emissions DataBank. Obsolete and historic records have been removed and have been replaced by the current values [ref 96: CAA, 2008]. The majority of data in this database was measured within the framework of certification of larger aircraft engines. The EMASA database also contains a number of emission factors for smaller engines determined by the EPA and published in the AP42 [ref 98: EPA, 1985]. Furthermore emission factors of aircraft with turboprop engines have been added into the EMASA model. These factors were gathered by the Swedish FFA in the so-called Hurdy-Gurdy-database [ref 97: FFA, 2001]. Per group of aircraft engines the PM emission factors are calculated from ‘Smoke Numbers’ according to the method described in a Eurocontrol report (EEC/SEE/2005/0014, eq 8, p.69) [ref 121: Kugele, A. et
al., 2005]. Afterwards the figures have been doubled because of the OC-fraction in aircraft-PM PM [ref
122: Agrawal H. et al., 2008]. The emissions due to tyre and brake wear are calculated form the Maximum Permissible Take-off weight and the number of take-offs according to a methodology described by British Airways [ref 123: Morris K.M., 2007]. The duration of the flight modes (engine settings) type of aircraft for 1990 was established as follows. The durations of the flight modes (except the Idle mode) were derived from the EPA [ref 98: EPA, 1985]. The average taxi/idle time (Idle) was calculated based on measurements conducted by the airports [ref
73: Nollet, 1993] and the RLD22
for taxi times per individual runway combined with the usage percentages per runway. For heavier aircraft (JUMBO class) a separate TIMCODE category (TIM = Time In Mode) was introduced with somewhat longer times for the flight modes Takeoff and Climbout. This information was obtained at that time from the RLD as part of the IMER study on which the PKB
23 was
based. Table 6.10 shows the TIM times and TIM categories adapted for Schiphol Airport. In the EMASA model, the time of the idle mode can be varied for the aircraft falling under TIMCODE categories JUMBO, TF, TP and TPBUS, which is virtually equivalent with the aircraft movements of all commercial air traffic. Military aviation In the past rough estimates have been made of the LTO cycle emissions of military aircraft movements. As the Ministry of Defence is not allowed to provide detailed figures concerning military aircraft movements, an update of the emissions by military aircraft is not possible. As the current emission figures almost certainly differ a lot from the emissions estimated in the past, it has been decided to discontinue the publication of military emissions due to LTO cycles in the Dutch Emission Registration. In order to be able to calculate the greenhouse gas emissions according to the IPCC-methodology the Ministry does provide the yearly amount of aviation fuels consumed by military aviation. PM2,5
PM2,5 emissions are calculated from PM10 by using an emission profile. (see section 6.7). Combustion of motor fuels; N2O and NH3 The combustion emissions of N2O and NH3 on Dutch territory have been calculated by using the IPCC defaults for N2O [ref 40: IPCC, 1996] and the emission factors of the EEA for NH3 [ref 60: Ntziachristos and
Samaras, 2000] (see Table 6.7). These emission factors are multiplied with the total fuel consumption by air traffic during LTOs at Dutch airports.
22
National air traffic service 23
key planning decision
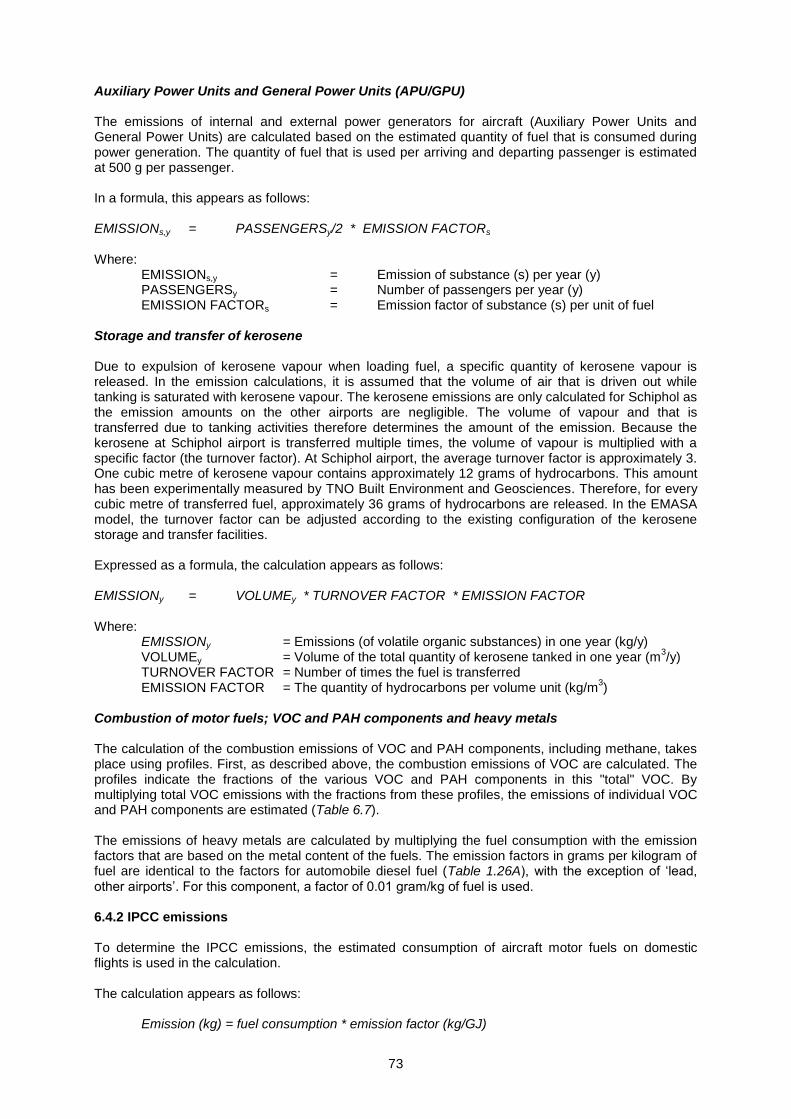
73
Auxiliary Power Units and General Power Units (APU/GPU) The emissions of internal and external power generators for aircraft (Auxiliary Power Units and General Power Units) are calculated based on the estimated quantity of fuel that is consumed during power generation. The quantity of fuel that is used per arriving and departing passenger is estimated at 500 g per passenger. In a formula, this appears as follows: EMISSIONs,y = PASSENGERSy/2 * EMISSION FACTORs
Where:
EMISSIONs,y = Emission of substance (s) per year (y) PASSENGERSy = Number of passengers per year (y) EMISSION FACTORs = Emission factor of substance (s) per unit of fuel
Storage and transfer of kerosene Due to expulsion of kerosene vapour when loading fuel, a specific quantity of kerosene vapour is released. In the emission calculations, it is assumed that the volume of air that is driven out while tanking is saturated with kerosene vapour. The kerosene emissions are only calculated for Schiphol as the emission amounts on the other airports are negligible. The volume of vapour and that is transferred due to tanking activities therefore determines the amount of the emission. Because the kerosene at Schiphol airport is transferred multiple times, the volume of vapour is multiplied with a specific factor (the turnover factor). At Schiphol airport, the average turnover factor is approximately 3. One cubic metre of kerosene vapour contains approximately 12 grams of hydrocarbons. This amount has been experimentally measured by TNO Built Environment and Geosciences. Therefore, for every cubic metre of transferred fuel, approximately 36 grams of hydrocarbons are released. In the EMASA model, the turnover factor can be adjusted according to the existing configuration of the kerosene storage and transfer facilities. Expressed as a formula, the calculation appears as follows: EMISSIONy = VOLUMEy * TURNOVER FACTOR * EMISSION FACTOR Where:
EMISSIONy = Emissions (of volatile organic substances) in one year (kg/y) VOLUMEy = Volume of the total quantity of kerosene tanked in one year (m
3/y)
TURNOVER FACTOR = Number of times the fuel is transferred EMISSION FACTOR = The quantity of hydrocarbons per volume unit (kg/m
3)
Combustion of motor fuels; VOC and PAH components and heavy metals The calculation of the combustion emissions of VOC and PAH components, including methane, takes place using profiles. First, as described above, the combustion emissions of VOC are calculated. The profiles indicate the fractions of the various VOC and PAH components in this "total" VOC. By multiplying total VOC emissions with the fractions from these profiles, the emissions of individual VOC and PAH components are estimated (Table 6.7). The emissions of heavy metals are calculated by multiplying the fuel consumption with the emission factors that are based on the metal content of the fuels. The emission factors in grams per kilogram of fuel are identical to the factors for automobile diesel fuel (Table 1.26A), with the exception of ‘lead, other airports’. For this component, a factor of 0.01 gram/kg of fuel is used. 6.4.2 IPCC emissions To determine the IPCC emissions, the estimated consumption of aircraft motor fuels on domestic flights is used in the calculation. The calculation appears as follows:
Emission (kg) = fuel consumption * emission factor (kg/GJ)
74
6.5 Activity data
6.5.1 Actual and NEC emissions The number of aircraft movements per aircraft type for 2009 is shown in Table 6.9. The StatLine databank of Statistics Netherlands provides figures about the total number of aircraft movements at Dutch airports beginning in 1997.
The fuel consumption has been derived from the CO2 emissions. Table 6.1 shows the fuel consumption figures used in the emission calculations.
6.5.2 IPCC emissions For estimating the fuel consumption on domestic flights, the SKRL report of the RLD was used. According to this report, 27.9 ktonnes of CO2 emissions in 2000 resulted from domestic flights. There appears to be an error in the SKRL report concerning the CO2 calculations of AVGAS. Instead of 3.18, an emission factor of 1.45 per kg of AVGAS was used (SKRL report, page 21). If this error is corrected, the amount of CO2 generated by domestic flights is 41.4 ktonnes. The fuel consumption can be derived from this figure. No data are available to make an adequate time series. Because this concerns an insignificant quantity of fuel, the figure has been kept constant for 1990-2004. It appears it will be possible to establish a more reliable figure in the future; since 1 January 2005, excise tax has been levied on aircraft fuel that is used for domestic flights. This offers possibilities to acquire the desired data from the Ministry of Finance.
6.6 Emission factors For the year 2012, Table 6.9 provides the EMASA emission factors per type of aircraft (see 6.4.1) for a large number of engine type-aircraft type combinations. This table, with an aggregation of the factors for each flight mode, provides an indication of the variations for each aircraft type. For current data, the ICAO emissions databank (ICAO Engine Emissions DataBank) can be consulted. The emission factors for N2O and NH3 are the IPCC default values for N2O [ref 40: IPCC, 1996] and EEA factors for NH3 [ref 60: Ntziachristos and Samaras, 2000] (see Table 6.7). See Section 6.4.1 for information about the emission factors for the storage and transfer of kerosene and the fuel consumption of Auxiliary Power Units and General Power Units (APU/GPU).
6.7 Substance profiles The VOC and PAH profiles have been ascertained by TNO Built Environment and Geosciences (see Tables 6.8A, B and C) [ref 55: VROM, 1993]. Table 6.11 shows the assumed share of PM2,5 in the PM10 emissions.
6.8 Regionalization This is based on the flight data from the various airports.
6.9 Uncertainties The uncertainties in emission estimates have been derived from the uncertainty in activity data and emission factors in accordance with the rule that the uncertainty of the product of two uncertain factors is equal to the largest uncertainty in one of the two factors, therefore: - A * A = A - A * B = B - B * A = B
etc. The results are shown in Appendix 1.

75
6.10 Points for improvement The determination of the fuel consumption of domestic air traffic, used to calculate the IPCC emissions, must be improved. This currently involves a global estimate.
6.11 Verification Every year a comprehensive trend analysis is conducted, where deviations larger than 5% with respect to the previous year must be explained.
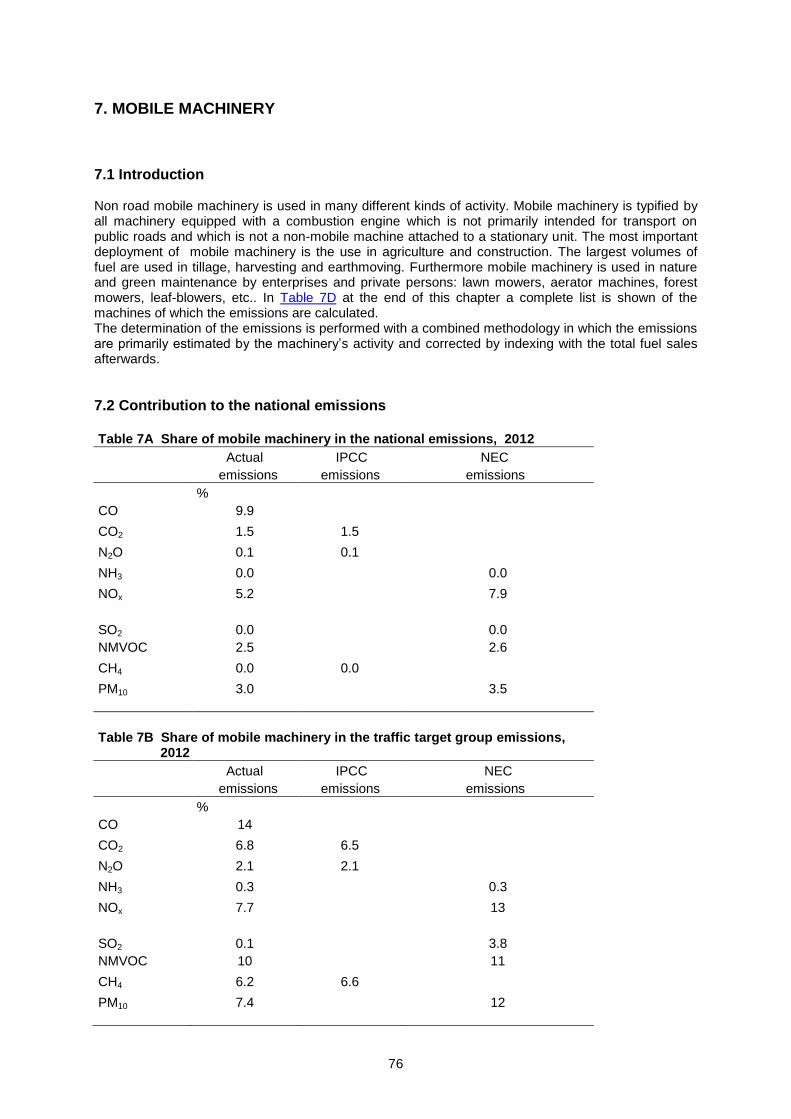
76
7. MOBILE MACHINERY
7.1 Introduction Non road mobile machinery is used in many different kinds of activity. Mobile machinery is typified by all machinery equipped with a combustion engine which is not primarily intended for transport on public roads and which is not a non-mobile machine attached to a stationary unit. The most important deployment of mobile machinery is the use in agriculture and construction. The largest volumes of fuel are used in tillage, harvesting and earthmoving. Furthermore mobile machinery is used in nature and green maintenance by enterprises and private persons: lawn mowers, aerator machines, forest mowers, leaf-blowers, etc.. In Table 7D at the end of this chapter a complete list is shown of the machines of which the emissions are calculated. The determination of the emissions is performed with a combined methodology in which the emissions are primarily estimated by the machinery’s activity and corrected by indexing with the total fuel sales afterwards.
7.2 Contribution to the national emissions
Table 7A Share of mobile machinery in the national emissions, 2012
Actual IPCC NEC
emissions emissions emissions
%
CO 9.9
CO2 1.5 1.5
N2O 0.1 0.1
NH3 0.0 0.0
NOx 5.2 7.9
SO2 0.0 0.0
NMVOC 2.5 2.6
CH4 0.0 0.0
PM10 3.0 3.5
Table 7B Share of mobile machinery in the traffic target group emissions,
2012
Actual IPCC NEC
emissions emissions emissions
%
CO 14
CO2 6.8 6.5
N2O 2.1 2.1
NH3 0.3 0.3
NOx 7.7 13
SO2 0.1 3.8
NMVOC 10 11
CH4 6.2 6.6
PM10 7.4 12
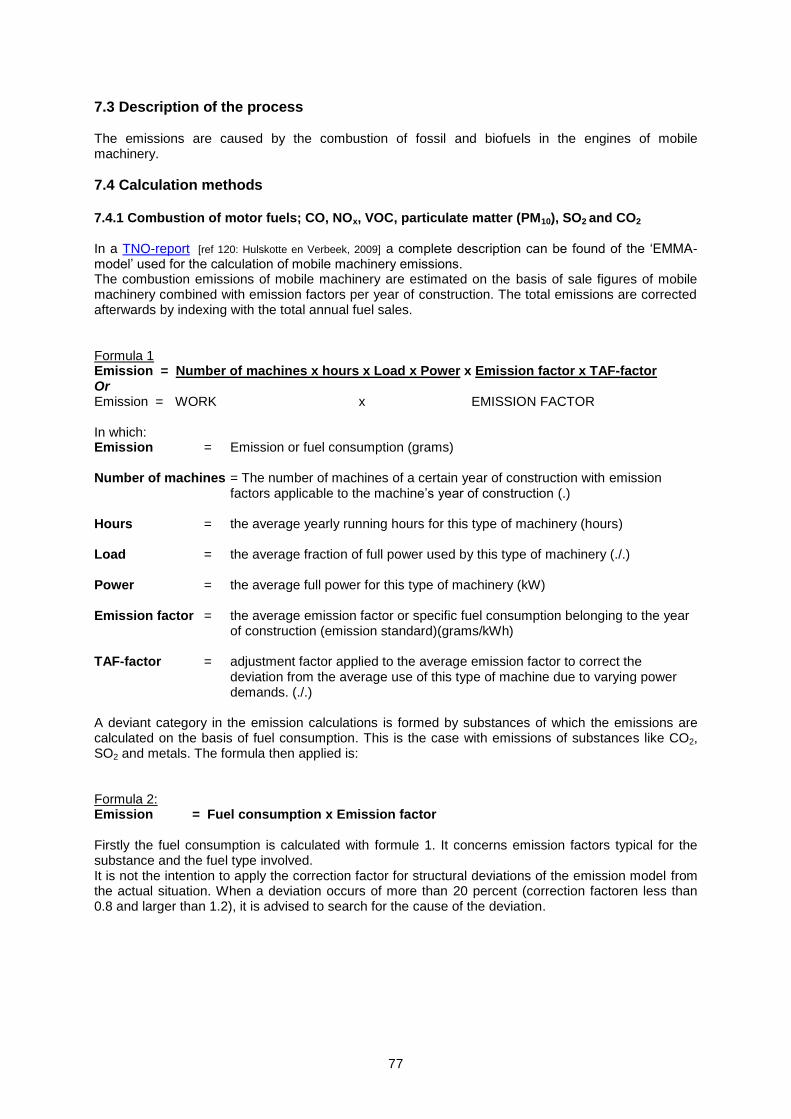
77
7.3 Description of the process The emissions are caused by the combustion of fossil and biofuels in the engines of mobile machinery.
7.4 Calculation methods 7.4.1 Combustion of motor fuels; CO, NOx, VOC, particulate matter (PM10), SO2 and CO2 In a TNO-report [ref 120: Hulskotte en Verbeek, 2009] a complete description can be found of the ‘EMMA-model’ used for the calculation of mobile machinery emissions. The combustion emissions of mobile machinery are estimated on the basis of sale figures of mobile machinery combined with emission factors per year of construction. The total emissions are corrected afterwards by indexing with the total annual fuel sales. Formula 1 Emission = Number of machines x hours x Load x Power x Emission factor x TAF-factor Or Emission = WORK x EMISSION FACTOR In which: Emission = Emission or fuel consumption (grams) Number of machines = The number of machines of a certain year of construction with emission
factors applicable to the machine’s year of construction (.) Hours = the average yearly running hours for this type of machinery (hours) Load = the average fraction of full power used by this type of machinery (./.) Power = the average full power for this type of machinery (kW) Emission factor = the average emission factor or specific fuel consumption belonging to the year
of construction (emission standard)(grams/kWh) TAF-factor = adjustment factor applied to the average emission factor to correct the
deviation from the average use of this type of machine due to varying power demands. (./.)
A deviant category in the emission calculations is formed by substances of which the emissions are calculated on the basis of fuel consumption. This is the case with emissions of substances like CO2, SO2 and metals. The formula then applied is: Formula 2: Emission = Fuel consumption x Emission factor Firstly the fuel consumption is calculated with formule 1. It concerns emission factors typical for the substance and the fuel type involved. It is not the intention to apply the correction factor for structural deviations of the emission model from the actual situation. When a deviation occurs of more than 20 percent (correction factoren less than 0.8 and larger than 1.2), it is advised to search for the cause of the deviation.
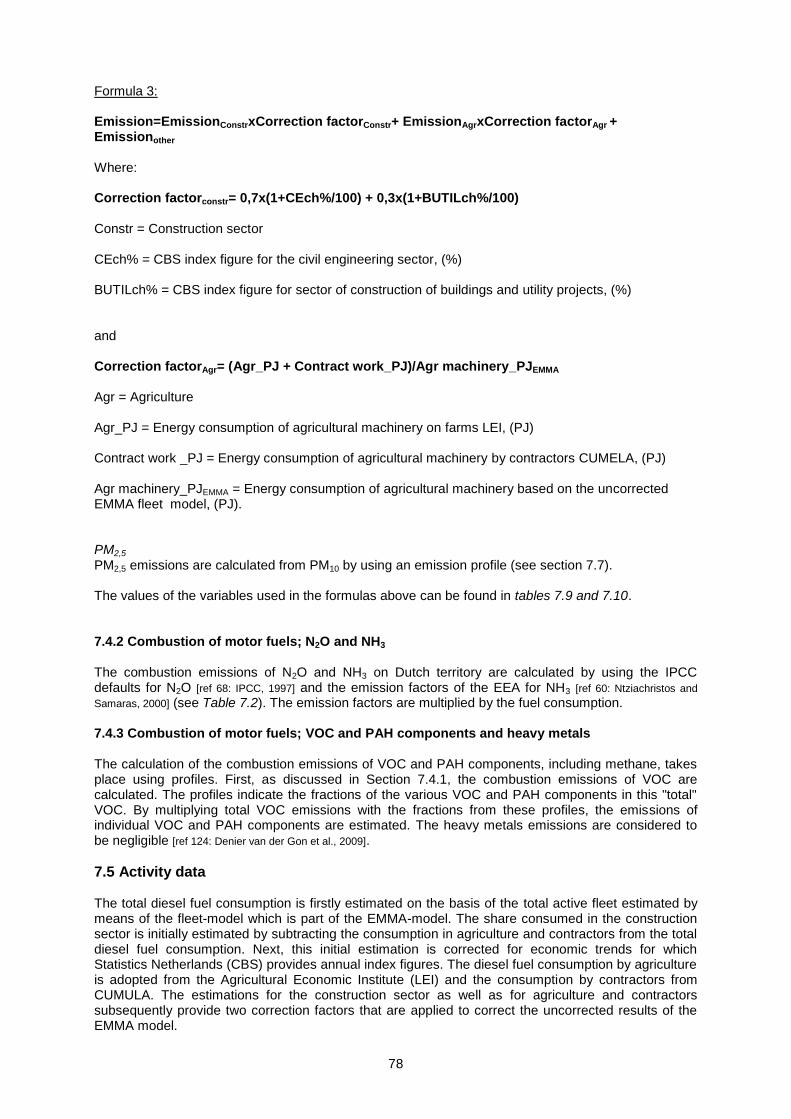
78
Formula 3: Emission=EmissionConstrxCorrection factorConstr+ EmissionAgrxCorrection factorAgr + Emissionother Where: Correction factorconstr= 0,7x(1+CEch%/100) + 0,3x(1+BUTILch%/100) Constr = Construction sector CEch% = CBS index figure for the civil engineering sector, (%) BUTILch% = CBS index figure for sector of construction of buildings and utility projects, (%) and Correction factorAgr= (Agr_PJ + Contract work_PJ)/Agr machinery_PJEMMA Agr = Agriculture Agr_PJ = Energy consumption of agricultural machinery on farms LEI, (PJ) Contract work _PJ = Energy consumption of agricultural machinery by contractors CUMELA, (PJ) Agr machinery_PJEMMA = Energy consumption of agricultural machinery based on the uncorrected EMMA fleet model, (PJ). PM2,5 PM2,5 emissions are calculated from PM10 by using an emission profile (see section 7.7). The values of the variables used in the formulas above can be found in tables 7.9 and 7.10. 7.4.2 Combustion of motor fuels; N2O and NH3 The combustion emissions of N2O and NH3 on Dutch territory are calculated by using the IPCC defaults for N2O [ref 68: IPCC, 1997] and the emission factors of the EEA for NH3 [ref 60: Ntziachristos and
Samaras, 2000] (see Table 7.2). The emission factors are multiplied by the fuel consumption. 7.4.3 Combustion of motor fuels; VOC and PAH components and heavy metals The calculation of the combustion emissions of VOC and PAH components, including methane, takes place using profiles. First, as discussed in Section 7.4.1, the combustion emissions of VOC are calculated. The profiles indicate the fractions of the various VOC and PAH components in this "total" VOC. By multiplying total VOC emissions with the fractions from these profiles, the emissions of individual VOC and PAH components are estimated. The heavy metals emissions are considered to be negligible [ref 124: Denier van der Gon et al., 2009].
7.5 Activity data The total diesel fuel consumption is firstly estimated on the basis of the total active fleet estimated by means of the fleet-model which is part of the EMMA-model. The share consumed in the construction sector is initially estimated by subtracting the consumption in agriculture and contractors from the total diesel fuel consumption. Next, this initial estimation is corrected for economic trends for which Statistics Netherlands (CBS) provides annual index figures. The diesel fuel consumption by agriculture is adopted from the Agricultural Economic Institute (LEI) and the consumption by contractors from CUMULA. The estimations for the construction sector as well as for agriculture and contractors subsequently provide two correction factors that are applied to correct the uncorrected results of the EMMA model.
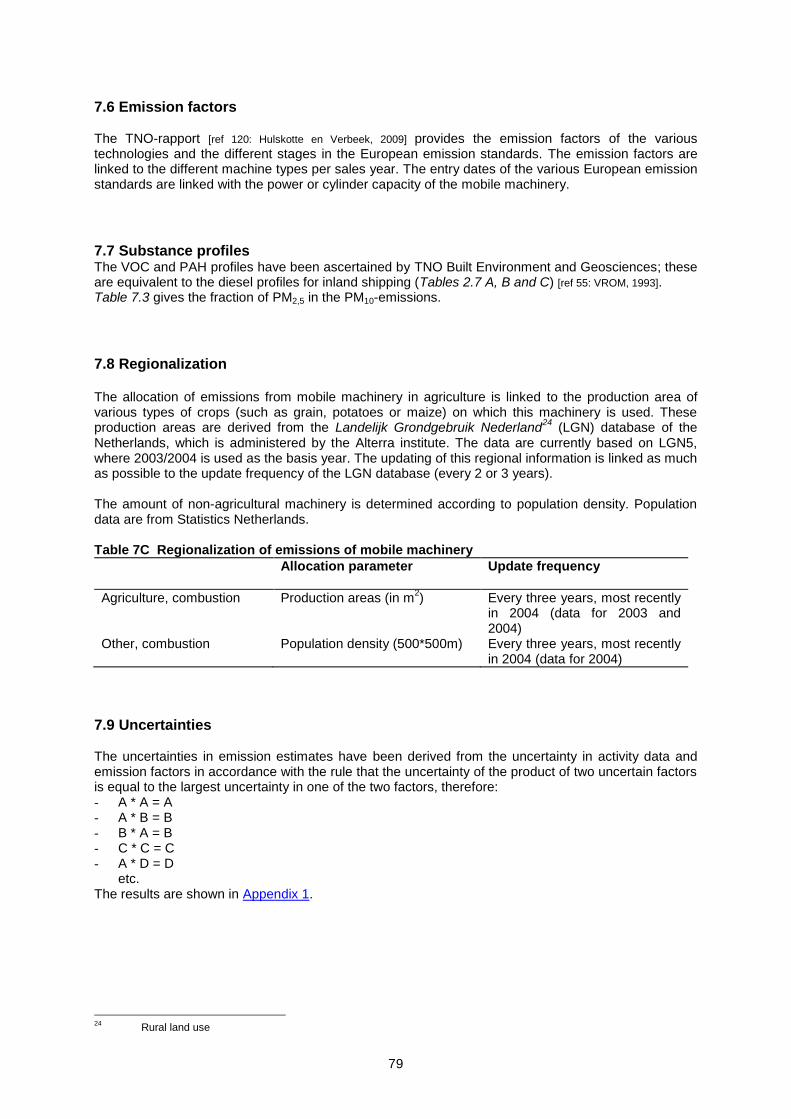
79
7.6 Emission factors The TNO-rapport [ref 120: Hulskotte en Verbeek, 2009] provides the emission factors of the various technologies and the different stages in the European emission standards. The emission factors are linked to the different machine types per sales year. The entry dates of the various European emission standards are linked with the power or cylinder capacity of the mobile machinery.
7.7 Substance profiles The VOC and PAH profiles have been ascertained by TNO Built Environment and Geosciences; these are equivalent to the diesel profiles for inland shipping (Tables 2.7 A, B and C) [ref 55: VROM, 1993]. Table 7.3 gives the fraction of PM2,5 in the PM10-emissions.
7.8 Regionalization The allocation of emissions from mobile machinery in agriculture is linked to the production area of various types of crops (such as grain, potatoes or maize) on which this machinery is used. These production areas are derived from the Landelijk Grondgebruik Nederland
24 (LGN) database of the
Netherlands, which is administered by the Alterra institute. The data are currently based on LGN5, where 2003/2004 is used as the basis year. The updating of this regional information is linked as much as possible to the update frequency of the LGN database (every 2 or 3 years). The amount of non-agricultural machinery is determined according to population density. Population data are from Statistics Netherlands. Table 7C Regionalization of emissions of mobile machinery
Allocation parameter
Update frequency
Agriculture, combustion Production areas (in m2) Every three years, most recently
in 2004 (data for 2003 and 2004)
Other, combustion Population density (500*500m) Every three years, most recently in 2004 (data for 2004)
7.9 Uncertainties The uncertainties in emission estimates have been derived from the uncertainty in activity data and emission factors in accordance with the rule that the uncertainty of the product of two uncertain factors is equal to the largest uncertainty in one of the two factors, therefore: - A * A = A - A * B = B - B * A = B - C * C = C - A * D = D
etc. The results are shown in Appendix 1.
24
Rural land use
80
7.10 Points for improvement In this section the shortcomings are repeated with possible recommendations for further investigation. a) The gas oil (red diesel fuel) in the construction sector is liable to relatively strong economic
fluctuations. At present the correction for this phenomenon takes place on the basis of financial CBS parameters instead of physical indicators. It could be investigated if there are enterprises or institutions that have trend figures of gas oil consumption at their disposal.
b) There is a lack of input data for several machines and sectors. It concerns specialized machinery in seaports (transhipment of containers) and at airports (various types). Furthermore data is lacking about for instance motorized pumps and part of the mobile electrical generators (for instance in road construction). In the garden sector and private households weakly founded or extrapolated figures have been used. With targeted research into these data relatively high figures for the VOC emissions can be replaced by improved figures.
c) The application of a generic drop out function for all machinery might have led to declinations in the fleet composition (age profile) compared with reality in the case of certain important machines like agricultural tractors, excavators, and shovels. Investigations into the age profile and the use of the active fleet could lead to a considerable improvement of the reliability of the emission figures. In view of the relatively high number agricultural tractors are first to be considered for further investigation.
d) The effect of varying engine loads has hardly been examined. For some machines it is of great importance to have a better knowledge of the influence on the actual emissions. A specific measurement scheme for investigating the effect of transient engine loads in the machine’s daily practise could lead to a far better foundation of the emission data.
e) Via a specific measurement scheme the effect of longer or shorter postponed maintenance on the emissions of building machinery due to highly varying hire and lease practices, as they occur in the market, could be further investigated.
7.11 Verification Every year a comprehensive trend analysis is conducted, where deviations larger than 5% with respect to the previous year must be explained.
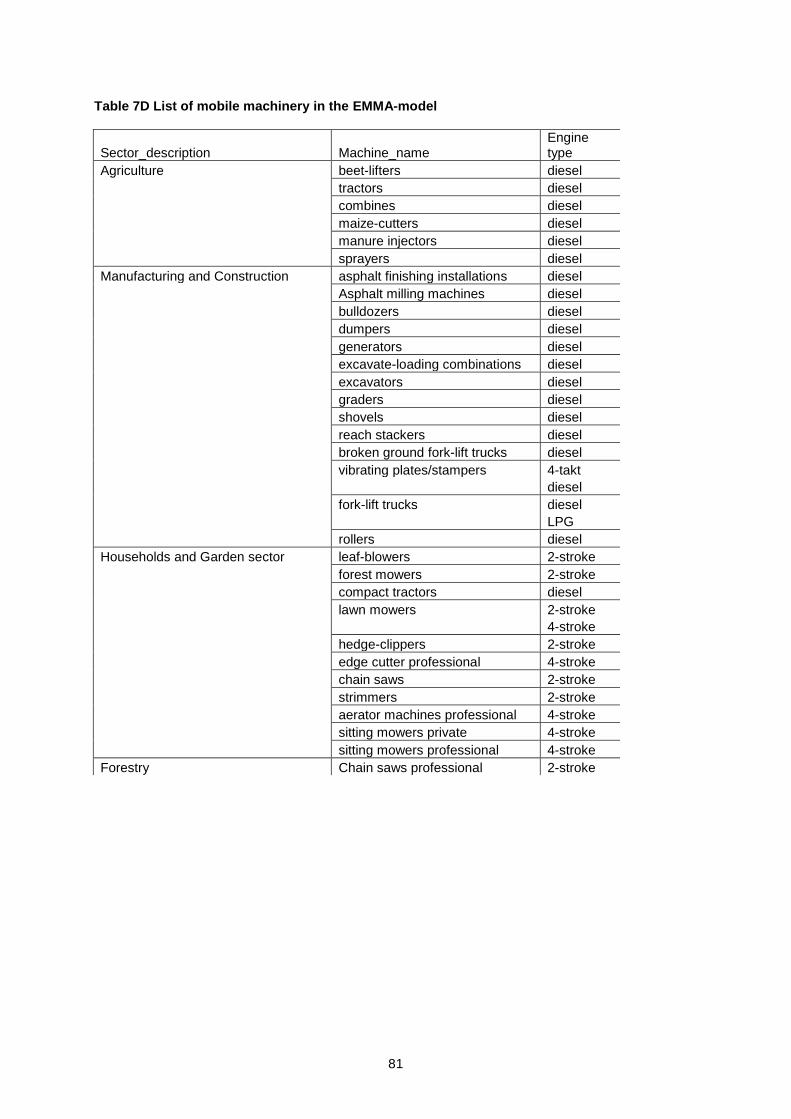
81
Table 7D List of mobile machinery in the EMMA-model
Sector_description Machine_name Engine type
Agriculture beet-lifters diesel
tractors diesel
combines diesel
maize-cutters diesel
manure injectors diesel
sprayers diesel
Manufacturing and Construction asphalt finishing installations diesel
Asphalt milling machines diesel
bulldozers diesel
dumpers diesel
generators diesel
excavate-loading combinations diesel
excavators diesel
graders diesel
shovels diesel
reach stackers diesel
broken ground fork-lift trucks diesel
vibrating plates/stampers 4-takt
diesel
fork-lift trucks diesel
LPG
rollers diesel
Households and Garden sector leaf-blowers 2-stroke
forest mowers 2-stroke
compact tractors diesel
lawn mowers 2-stroke
4-stroke
hedge-clippers 2-stroke
edge cutter professional 4-stroke
chain saws 2-stroke
strimmers 2-stroke
aerator machines professional 4-stroke
sitting mowers private 4-stroke
sitting mowers professional 4-stroke
Forestry Chain saws professional 2-stroke
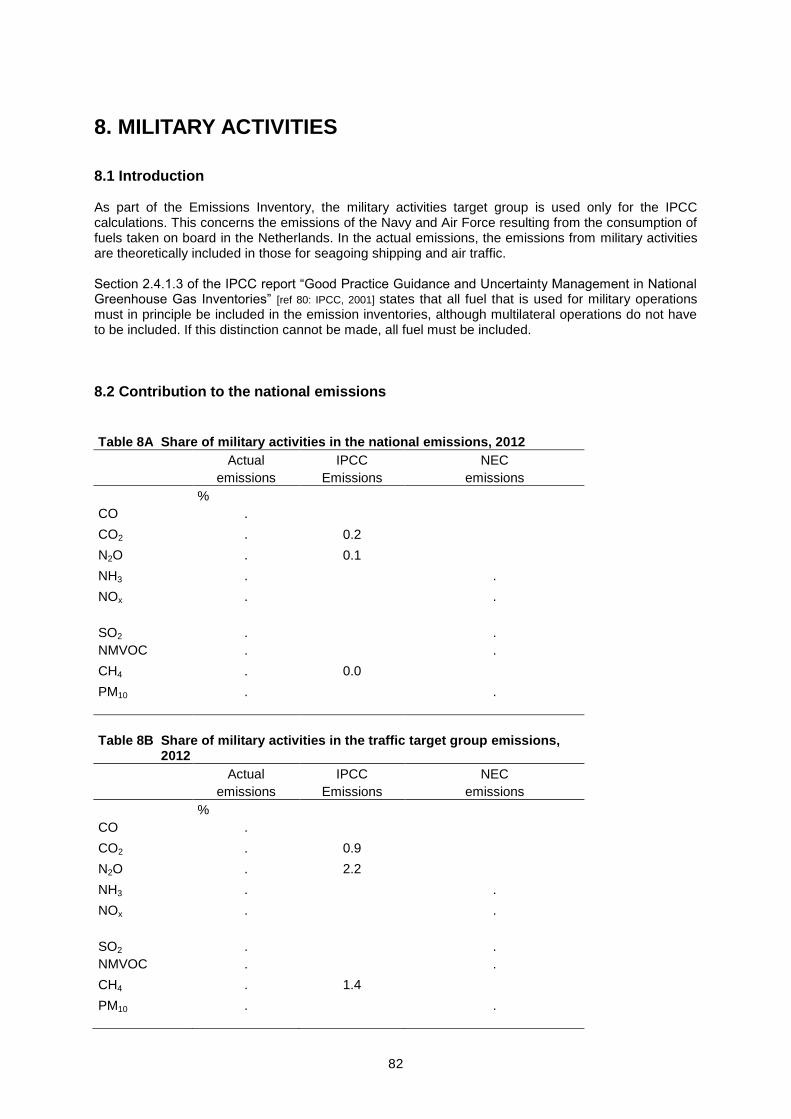
82
8. MILITARY ACTIVITIES
8.1 Introduction As part of the Emissions Inventory, the military activities target group is used only for the IPCC calculations. This concerns the emissions of the Navy and Air Force resulting from the consumption of fuels taken on board in the Netherlands. In the actual emissions, the emissions from military activities are theoretically included in those for seagoing shipping and air traffic. Section 2.4.1.3 of the IPCC report “Good Practice Guidance and Uncertainty Management in National Greenhouse Gas Inventories” [ref 80: IPCC, 2001] states that all fuel that is used for military operations must in principle be included in the emission inventories, although multilateral operations do not have to be included. If this distinction cannot be made, all fuel must be included.
8.2 Contribution to the national emissions
Table 8A Share of military activities in the national emissions, 2012
Actual IPCC NEC
emissions Emissions emissions
%
CO .
CO2 . 0.2
N2O . 0.1
NH3 . .
NOx . .
SO2 . .
NMVOC . .
CH4 . 0.0
PM10 . .
Table 8B Share of military activities in the traffic target group emissions, 2012
Actual IPCC NEC
emissions Emissions emissions
%
CO .
CO2 . 0.9
N2O . 2.2
NH3 . .
NOx . .
SO2 . .
NMVOC . .
CH4 . 1.4
PM10 . .
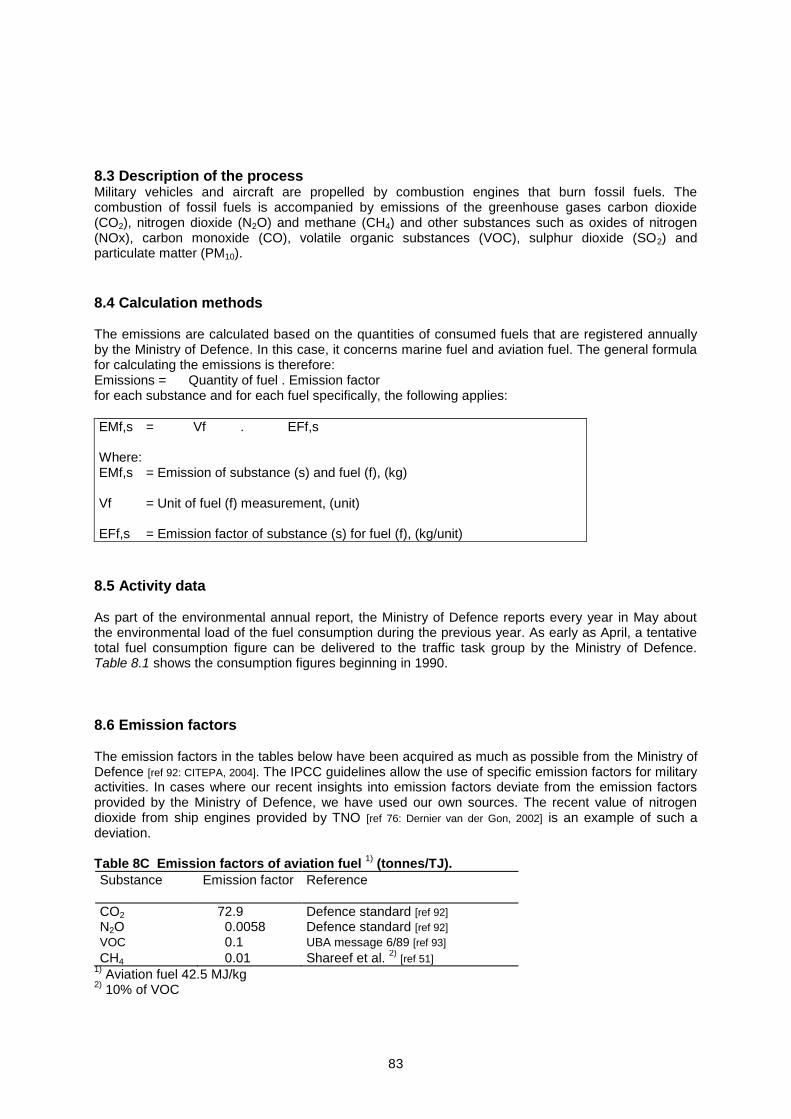
83
8.3 Description of the process Military vehicles and aircraft are propelled by combustion engines that burn fossil fuels. The combustion of fossil fuels is accompanied by emissions of the greenhouse gases carbon dioxide (CO2), nitrogen dioxide (N2O) and methane (CH4) and other substances such as oxides of nitrogen (NOx), carbon monoxide (CO), volatile organic substances (VOC), sulphur dioxide (SO2) and particulate matter (PM10).
8.4 Calculation methods The emissions are calculated based on the quantities of consumed fuels that are registered annually by the Ministry of Defence. In this case, it concerns marine fuel and aviation fuel. The general formula for calculating the emissions is therefore: Emissions = Quantity of fuel . Emission factor for each substance and for each fuel specifically, the following applies:
EMf,s = Vf . EFf,s Where: EMf,s = Emission of substance (s) and fuel (f), (kg) Vf = Unit of fuel (f) measurement, (unit) EFf,s = Emission factor of substance (s) for fuel (f), (kg/unit)
8.5 Activity data As part of the environmental annual report, the Ministry of Defence reports every year in May about the environmental load of the fuel consumption during the previous year. As early as April, a tentative total fuel consumption figure can be delivered to the traffic task group by the Ministry of Defence. Table 8.1 shows the consumption figures beginning in 1990.
8.6 Emission factors The emission factors in the tables below have been acquired as much as possible from the Ministry of Defence [ref 92: CITEPA, 2004]. The IPCC guidelines allow the use of specific emission factors for military activities. In cases where our recent insights into emission factors deviate from the emission factors provided by the Ministry of Defence, we have used our own sources. The recent value of nitrogen dioxide from ship engines provided by TNO [ref 76: Dernier van der Gon, 2002] is an example of such a deviation. Table 8C Emission factors of aviation fuel
1) (tonnes/TJ).
Substance
Emission factor Reference
CO2 72.9 Defence standard [ref 92] N2O 0.0058 Defence standard [ref 92] VOC 0.1 UBA message 6/89 [ref 93]
CH4 0.01 Shareef et al. 2)
[ref 51] 1)
Aviation fuel 42.5 MJ/kg 2)
10% of VOC
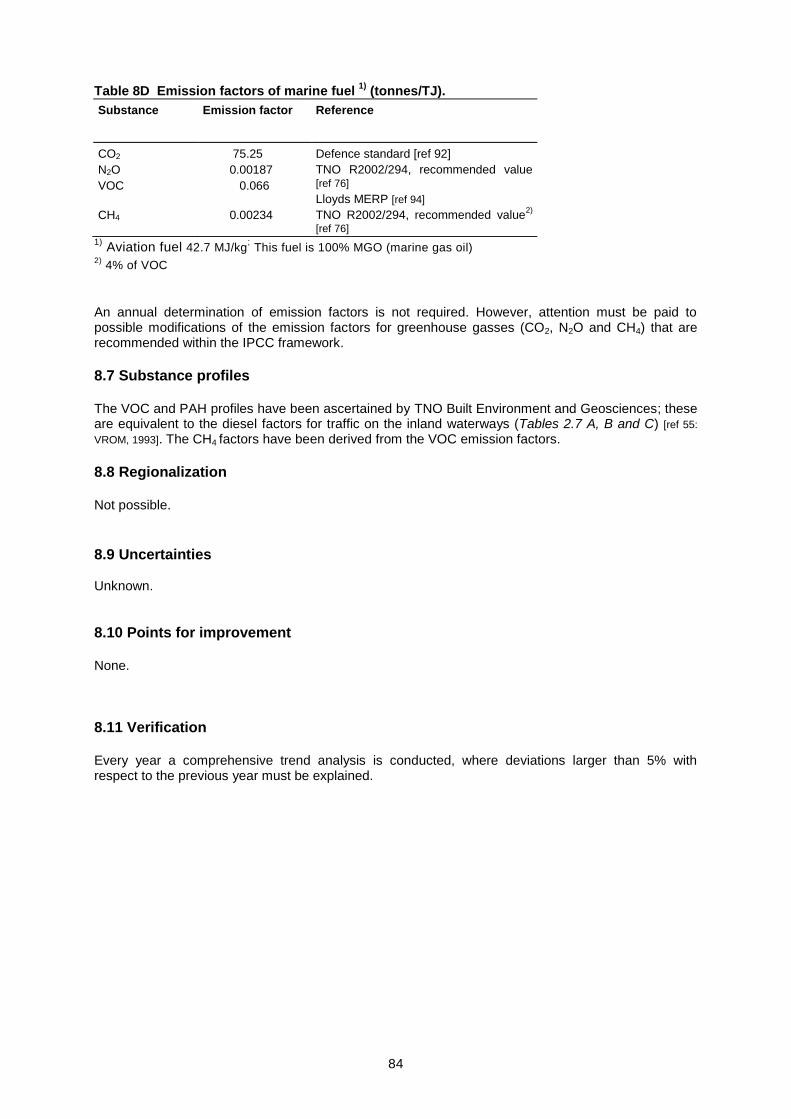
84
Table 8D Emission factors of marine fuel 1)
(tonnes/TJ).
Substance
Emission factor Reference
CO2 75.25 Defence standard [ref 92]
N2O
VOC
0.00187
0.066
TNO R2002/294, recommended value
[ref 76]
Lloyds MERP [ref 94]
CH4 0.00234 TNO R2002/294, recommended value2)
[ref 76]
1) Aviation fuel 42.7 MJ/kg
; This fuel is 100% MGO (marine gas oil)
2) 4% of VOC
An annual determination of emission factors is not required. However, attention must be paid to possible modifications of the emission factors for greenhouse gasses (CO2, N2O and CH4) that are recommended within the IPCC framework. 8.7 Substance profiles The VOC and PAH profiles have been ascertained by TNO Built Environment and Geosciences; these are equivalent to the diesel factors for traffic on the inland waterways (Tables 2.7 A, B and C) [ref 55:
VROM, 1993]. The CH4 factors have been derived from the VOC emission factors.
8.8 Regionalization Not possible.
8.9 Uncertainties Unknown.
8.10 Points for improvement None.
8.11 Verification Every year a comprehensive trend analysis is conducted, where deviations larger than 5% with respect to the previous year must be explained.
85
9. IPCC METHOD
9.1 Introduction The emissions of the greenhouse gases CO2, CH4 and N2O by the transport sector in the Netherlands are calculated using two methodologies: a top-down approach based on fuel sales data and a bottom-up approach based on vehicle kilometres driven and specific fuel consumption per vehicle kilometre on Dutch territory. In this chapter the differences between both approaches are described in more detail. Top-down approach based on fuel sold As part of international policy efforts in the area of climate change, which are coordinated by the Intergovernmental Panel on Climate Change (IPCC), it is mandatory to conduct an annual greenhouse gas emission inventory. In order to prevent overlap of data between various countries, the IPCC recommends calculating greenhouse gas emissions based on fuel sales data [ref 8: Thoughton et al., 1997]. In the Netherlands, as in most other countries, fuel sales data are known at an aggregate level. For example, the total amount of fuel sold per fuel type (i.e. petrol, diesel, LPG) to road transport is reported annually by Statistics Netherlands. These aggregated sales data are used to calculate the greenhouse gas emissions by road transport top-down, as reported to the UNFCCC.. In the present report, the top-down method is referred to as the IPCC method. N.B. According to the IPCC requirements the CO2 emissions from biomass combustion are not included in the national emission totals, but are reported separately as an information item (see table 9.4). Bottom-up approach based on fuel used The energy consumption and the accompanying greenhouse gas emissions from road transport can also be calculated in a “bottom-up” fashion. First, energy consumption and greenhouse gas emission factors per vehicle kilometre are derived for different vehicle types. Combining these specific fuel consumption and emission factors with data on vehicle kilometres driven results in the total amount of fuel used (per fuel type) and resulting greenhouse gas emissions on Dutch territory. In the Netherlands, this method has been used for a number of years in the emission inventory of mobile sources (see the remainder of this report). In the present report, this bottom-up method is referred to as the Dutch territory method, which is used for determining the actual and the NEC emissions.
9.2 Why are there two estimation methods? A decision was made to use both methods for greenhouse gas emissions in the Dutch emissions statistics. There are two reasons for this. First, the IPCC makes an inventory of worldwide greenhouse gas emissions. To prevent duplication of data and to minimize differences in calculation methods between countries, the IPCC has prescribed a method that uses national statistics about fuel sales in individual countries. The estimates for the total fuel sales to road transport are probably more reliable than the estimates of the total fuel consumption based on vehicle kilometres and fuel efficiency. Nevertheless, using this top-down method alone is not sufficient; for policy reasons it is also necessary to understand the greenhouse gas emissions of the individual vehicle categories of road transport. In order to aggregate the greenhouse gas emissions from road transport according to vehicle categories, the bottom up method is essential. Both methods must therefore be used. The second reason is that it is advisable in any case to use both methods; this is because comparing the final results of the two independent calculation methods provides information about the reliability of the final greenhouse gas emission estimates for traffic and transport in the Netherlands. However, both methods are not directly comparable. Section 9.3 addresses this issue in more detail.
9.3 The most important differences between the two methods The essential difference between the IPCC method and the Dutch territory method (based on energy consumption) is that the IPCC method is based on fuel sales in a single country and the Dutch territory
86
method is based on fuel consumption on Dutch territory. There are other methodological differences as well. These primarily concern the method of attributing emissions to the Netherlands. Crucially important to this process is an IPCC recommendation: “International bunker fuels are combusted in vessels at sea and by airplanes (both undertaking international movements) and therefore should be included in global greenhouse gas estimations. Following guidance, the IPCC recommends that every country estimate emissions from international bunker fuels sold within national boundaries, but that these emissions would be reported separately and, as far as possible, excluded from national totals”. This recommendation has been included in the IPCC method. In the Dutch territory method, the approach is different; this method aims to make an estimate of the emissions that take place on Dutch territory. This method does not address the issue of the difference between bunker fuels and non-bunker fuels, but only looks at what portion of the activities of air transport and maritime and inland shipping take place on Dutch territory. For civil aviation, the Dutch territory method takes into account the emissions that take place during the LTO (landing and take off) cycle of all aircraft movements at Dutch airports (see Chapter 6). In the IPCC method, only the emissions from domestic overland flights and low-level flights are attributed to the Netherlands (both the LTO cycle and the remainder of these domestic flights). The emissions resulting from the combustion of bunker fuels that are sold on Dutch territory (free of excise tax) for international aviation are not attributed to the Netherlands in the IPCC method. The bunker emissions are reported to the IPCC, but not attributed to individual countries. For inland shipping, the Dutch territory method includes the emissions of all activities that take place on Dutch inland waterways. In the IPCC method, only the emissions of domestic navigation on the inland waterways (with point of origin and destination both within the Netherlands) are attributed to the national emission totals. For maritime shipping, the Dutch territory method includes the emissions of vessels sailing on Dutch waters and those at anchor in Dutch harbours (see Chapter 4) as well as those on the Westerschelde
25. The bunker fuels sold on Dutch territory (free of excise tax) must not be
attributed to the Netherlands in accordance with the IPCC guidelines. However, the sales of bunker fuels to fishing vessels in the Netherlands must be added to the national total.
9.4 Emission factors for the IPCC method Tables 9.1A, B and C provide a summary of the emission factors and conversion factors that have been used in calculating the greenhouse gas emissions of mobile sources in accordance with the IPCC guidelines. For further information, please refer to the website of the Dutch Emission Registration. Tables 9.2A, B, C and 9.3 provide the factors which have been applied in the calculation of the IPCC emissions by road transport. The CO2 factors have been corrected for the use of biofuels and the N2O and CH4 factors have been derived from the actual emissions and calculated fuel consumption according to the ‘bottom-up’ approach (see 9.1).
9.5 Deliveries of motor fuels for road transport As mentioned above, the IPCC emissions of road traffic are based on the Dutch sales of motor fuels. Table 9.4 shows the annual sales of both fossile fuels and biofuels during 1990-2011. Note that the CO2 emissions due to the consumption of biofuels are not taken into account in the national emission totals according to the IPCC requirements. The table includes an estimation of the use of natural gas in road transport (CNG/LNG).
10. CHANGES WITH RESPECT TO PREVIOUS VERSIONS OF THE REPORT
The most important yearly methodological changes from 2004 onwards are reported in Table 10.1. The most recent changes concern the 2014 emission registration, which reports the emissions during the period 1990 – 2012.
25
Western Scheldt
87
REFERENCES
1. CBSa. Several volumes. De mobiliteit van de Nederlandse Bevolking (the mobility of the Dutch
population), Statistics Netherlands, StatLine, Voorburg/Heerlen. 2. CBSb, several volumes. Het bezit en gebruik van personenauto's (ownership and use of
passenger cars), Voorburg/Heerlen. Discontinued since statistical year 1999 3. CBSc, several volumes. Het bezit en gebruik van bedrijfsvoertuigen (ownership and use of
commercial vehicles), CBS, Voorburg/Heerlen. Discontinued. 4. Brink, R.M.M. van den, 1996. Deeltjesemissie door wegverkeer (particle emissions by road
traffic), Rijksinstituut voor Volksgezondheid en Milieu (RIVM), Bilthoven. 5. CROW, 1997. Hergebruik van asfalt met teer (reuse of tar asphalt), CROW, Ede, januari 1997. 6. Roovaart, J.van den, 2000. Notitie over gebruik van ZOAB t.b.v. taakgroep Verkeer (memo
about the use of porous asphalt), RIZA. 7. Feenstra, J.F., P.J.F. van der Most, 1985. Diffuse bronnen van waterverontreiniging (diffuse
sources of water pollution), IVM-rapport E85/15, Instituut voor Milieuvraagstukken (IVM), Amsterdam.
8. Thoughton, J.T. et al, 1997. (J.T. Thoughton, L.G. Meira Filho, B. Lim, K. Tréanton, I. Mamaty. 9. Baas, 1991. Literatuuronderzoek naar de lachgasemissie door het wegverkeer (literature
study into the N2O emission by road traffic), TNO-IMW-rapport R91/322. 10. Barbusse, S., D. Clodic, J.P. Roumegoux, 1998. Mobile air conditioning. Measurement and
simulation of energy and fuel consumption. The Earth Technology Forum, Washington DC, 1998.
11. Brink, R.M.M. van den, 1997. Memo 17-12-'97. 12. Brink, R.M.M. van den, 1999. Notitie PAK’s in wegdekslijtage (memo about PAH’s in road
surface particulate matter), RIVM, Bilthoven, 26 oktober 1999. 13. Brink, R.M.M. van den, et al, 2000. R.M.M. van den Brink (RIVM), N.L.J. Gense (TNO-WT),
J.A.P.Klein (CBS). Nieuwe Berekeningsmethodiek Emissies Wegverkeer (new calculation method for road traffic emissions). Paper for the second Colloquium Traffic, Environment and Technology (RIVM), 29 June 2000.
14. Brink, R.M.M. van den, 2001. Inventarisatie broeikasgasemissies Verkeer en vervoer (inventory of transport greenhouse gas emissions), RIVM-notitie, 19 maart 2001, Rijksinstituut voor Volksgezondheid en Milieu (RIVM), Bilthoven.
15. Carter en Bradow, 1984. 16. Cavalini, P.M., L. Hendrickx, A.J. Rooijers, 1995. Verschillen tussen groepen automobilisten
met betrekking tot milieurelevant gedrag (differences in environmentally relevant behaviour of various groups of motorists), Milieu, nr. 1995/1, pp. 18-25.
17. CBSa. Statistiek van Motorvoertuigen (motor vehicle fleet statistics). SDU/uitgeverij/CBS-publikaties, Den Haag. Discontinued. See Statline for recent data,
18. CBSb. Verkeersprestatie op het verharde Nederlandse wegennet (vehicle miles on Dutch roads), Maandstatistiek Verkeer en Vervoer. SDU/uitgeverij/CBS-publikaties, Den Haag.
19. CBSc, 1993. Motorrijden in Nederland (motor cycling in the Netherlands), Cijfers over bezit en gebruik (data on ownership and use). Voorburg/Heerlen.
20. CBSf, several volumes. Statistiek van het Personenvervoer (Statistics on passenger transport). CBS, Voorburg/Heerlen.
21. CBSg, several volumes. Energieverbruik in het wegverkeer (energy consumption in road traffic), Maandstatistiek Verkeer en Vervoer. SDU/uitgeverij/CBS-publikaties, Den Haag. Discontinued.
22. CBSi, several volumes. Nederlandse Energiehuishouding (NEH) (Energy balance sheets), Voorburg/Heerlen: Centraal Bureau voor de Statistiek, verschijnt jaarlijks. See Statline.
23. CBSj. Internal data. Statistics Netherlands CBS (not published). 24. CBSn. 1990-1994: Jaarboek toerisme en vrijetijdsbesteding (annual report on tourism and
leasure activities)/ Centraal Bureau voor de Statistiek, Hoofdafdeling Sociaal-Culturele Statistieken. SDU/uitgeverij/CBS-publikaties, Den Haag. From 1995 onwards the figures are published in: Toerisme en recreatie in cijfers (tourism and recreation in figures), compiled in cooperation with the Netherlands Bureau for Tourism and congresses (NBTC) The latest edition concerns 2010.
25. CBS, 1988. Inkomend toerisme: toeringcarpassagiers in Nederland (coach passengers in The Netherlands). A.Maas, W.E. Bernelot Moens. Sociaal-culturele berichten 1988-3.
88
26. CBS, 1992. Luchtverontreiniging, emissies door wegverkeer, 1980-1990 (Air pollution, emissions by road traffic). SDU/uitgeverij/CBS-publikaties,Den Haag.
27. CBS, 1993. Luchtverontreiniging, emissies door wegverkeer, methodiek vaststelling emissiefactoren (methodology of the assessment of emission factors for road traffic).
28. CBS, 1995. Inkomend toerisme (Entering tourism). Index: feiten en cijfers over onze samenleving (Facts and figures of our society, juli 1995.
29. CBS, 1999. EMMOB-files, Emissies Mobiele Bronnen (Mobile source emissions), Emissiejaarrapport 97/98 (for Annual emission report of The Netherlands), internal CD, Voorburg, May 1999.
30. Coenen, P.W.H.G., J.H.J. Hulskotte, 1998, Onderzoek naar de emissies naar oppervlaktewater van railverkeer in de provincie Zuid-Holland (survey into the emissions to surface waters by rail transport in the province of South Holland), rapprtnr. TNO Built Environment and Geosciences-R098/C01, TNO Built Environment and Geosciences, Apeldoorn, april 1998.
31. Consumentenbond (Dutch Consumers’ Organization), 1993. Quoted in: Adviesbureau (Consultancy) ‘Milieudata’, 1997.
32. CORINAIR, 1999. Atmospheric Emission Inventory Guidebook: Road Transport, Chapter B760, EMEP/CORINAIR, September 1999. (http://reports.eea.eu.int/EMEPCORINAIR/en/group07.pdf)
33. Egglestone, S., Gorien, N., Joumard, R., Rijkeboer, R, Zamaras, Z., Zierock, K.-H., 1989. Summary Report of the Corinair Working Group on Emission Factors for calculating 1985 Emissions from Road Traffic. Berlijn, EnviCon.
34. Feijen-Jeurissen, M., H. Oonk, N. Gense, 2001. N2O emissions from automobile sources: - emissions and trends, TNO Built Environment and Geosciences, Apeldoorn, March 2001.
35. Gense, N.L.J., 2000 Driving style, fuel consumption and tail pipe emissions. Final report. TNO report: 00.OR.VM.021.1/NG., TNO Automotive, Delft, March 2000.
36. Gense, N.L.J., I.R. Wilmink, I. De Vlieger, 1999. Emissies en Files (emissions and traffic-jams), tweede conceptrapport, TNO report: 99.OR.VM.023.1/NG., TNO Automotive, Delft, March 2000.
37. Harmelen, A.K. van, et al. Emissies en Afval in Nederland (Annual report of emissions and waste in The Netherlands). Jaarrapport 1998 en ramingen 1999. CCDM, Rapportagereeks Doelgroepmonitoring nr. 6, november 2000.
38. Harrington, W., V. Mc.Connell, A. Ando., 2000. Are vehicle emission inspection programs living up to expectations?, Transportation Research Part D, Vol. 5, pp. 153-172, 2000.
39. Hildemann, 1991, Consumentenbond (Dutch Consumers’ organization), 1993 en Polasek, 1994. In: Adviesbureau Milieudata, 1997.
40. IPCC, 1996. Guidelines for National Greenhouse Gas Inventories .Volume 3, Inventory Reference Manual, Revised 1996 Bracknell (UK): IPCC WGI Technical Support Unit.
41. Janssen van de Laak, W.H., 1997. Afstromend regenwater, een probleem?, in: J.A. Annema en R.M.M. van den Brink (red.).
42. Joumard, R., R. Vidon, C. Pruvost, P. Tassel, G. de Soete, 1995. Changes in pollutant emissions form passenger cars under cold start conditions, The French National Institute for Transport and Safety Research (INRETS), Bron Cedex, March 1995.
43. Kågeson, P. , 1998. Cycle-Beating and the EU Test Cycle for Cars, European Federation for Transport and Environment (T&E), Brussels, November 1998.
44. Keuken, M.P., J. Baas, 1997. “Fijn stof emissies door wegverkeer; resultaten meetcampagne in 1996” (Measuring campaign for particulates by road traffic), TNO Built Environment and Geosciences, Delft, May 1997.
45. Klein, J.A.P., 1992. Luchtverontreiniging Emissies door Wegverkeer. Methodiek Vaststelling Emissiefactoren (methodology for determining road traffic emission factors), Publikatiereeks Statistische Onderzoekingen M45, SDU/uitgeverij/CBS-publikaties, Den Haag (report compiled by CBS for the former Ministry of Waterways and Public Works).
46. LeFranc, F., 1999. Update VERSIT light duty vehicles, TNO Automotive, Delft, May 1999. 47. Milieudata, Adviesbureau, 1997. 'Metalen in brandstoffen voor wegverkeer”, oktober 1997. 48. Most, P.F.J. van der, C.Veldt, 1992. Emission Factors Manual Parcom-Atmos, Emission
factors for air pollutants 1992. TNO Built Environment and Geosciences, Apeldoorn, december 1992.
49. RAI. Segmentenoverzicht, personenwagens op registratiedatum (survey of passenger car segments per date of registration). RAI Vereniging, Amsterdam
50. Rogge, 1993. Quoted in: Adviesbureau (consultancy) Milieudata, 1997 (arithmetic mean).
89
51. Shareef, G.S., W.A. Butler, L.A. Bravo, M.B. Stockton, 1988, Air emissions species manual, Vol. I: Volatile organic compound (VOC) species profiles. Radian Corp., EPA report 450/2-88-003a.
52. STOWA, 1998, Emissies uit scheepsmotoren (emissions from ship’s engines, STOWA-rapport 98-12, Harlingen.
53. TNO, vanaf 1990. Steekproefcontroleprogramma (sample survey vehicle emissions), annual reports 1989-1990, TNO-Wegtransportmiddelen/TNO-Industrie en Techniek (www.tno.nl/industrie_en_techniek/markten/automotive_and_transporta/powertrains/environmental_studies_and/), Delft.
54. TRL, 1998. The inspection in in-use cars in order to attain mimimum emissions of pollutants and optimum energy efficiency, Detailed Report 6 – Remote Sensing, Transport Research Laboratory.
55. VROM, 1993. Publikatiereeks Emissieregistratie. Emissiefactoren Vluchtige organische stoffen uit verbrandingsmotoren (emission factors for VOC’s from combustion engines). no. 10, april 1993, Den Haag.
56. Wilbers, P., 1994. De econometer; een praktijkproef (practical testing), Traffic Test, Veenendaal, november 1994.
57. WSV, 1994. 58. Zonneveld, E.A., 1991. Emissiefactoren van kooldioxide en de kooldioxide-uitworp door het
stoken van fossiele brandstoffen (emission and emission factors for fossile fuels), 1975-1989. Kwartaalbericht Milieustatistieken (quarterly environmental bulletin) 1991/1, 25-26 (CBS), Den Haag, Sdu-uitgeverij/CBS-publikaties.
59. Winkel, R.G., 2002. NH3 emission results of Dutch car park, draft report, TNO-Automotive, Delft, February 2002.
60. Ntziachristos, L., Z. Samaras, 2000. COPERT III; Computer Programme to calculate emissions from road transport, methodology and emission factors (version 2.1), European Energy Agency (EEA), Copenhagen, November 2000.
61. EU, 2002. EU Publication sheet, C 145 E/71, 2002-6-18. 62. FAPETRO, 1999. Verslag van de activiteiten van het fonds voor de analyse van
petroleumproducten (report of activities of Belgian Fund for analysis of petroleum products). 63. FAPETRO, 2000. Verslag van de activiteiten van het fonds voor de analyse van
petroleumproducten. 64. Machrafi, H., W. Mertens, 1999. Verslag van het onderzoek naar het benzeen (benzene
survey report), studentverslagen TU Eindhoven (Technical University). 65. Shell, 2000. Technical information on Shell Pura, Department of Technical Support Fuels,
2000/CSS/086. 66. Heeb, N.V., A.-M. Forss, M. Weilenman, 2002. Pre- and post-calayst-, fuel-, velocity- and
acceleration- dependent benzene emission data of gasoline-driven Euro-2 passenger cars and light duty vehicles, Atmospheric Environment, Vol. 26, pp. 4745-4756.
67. Vreuls H.H.J., The Netherlands: list of energy carriers and standard CO2 -emission factors, SenterNovem, 2004.
68. IPCC, 1997. Revised 1996 IPCC Guidelines for National Greenhouse Gas Emission Inventories, Reference Manual.
69. MNP, 2005. Greenhouse Gas Emissions in the Netherlands1990-2003, National Inventory Report 2005. RIVM report 773201009 / 2005.
70. EG, 2003. Besluit van de Raad van de Europese Unie betreffende de toetreding van de Europese Gemeenschap tot het Protocol van 1998 inzake vermindering van verzuring, eutrofiëring en ozon op leefniveau bij het Verdrag van 1979 betreffende grensoverschrijdende luchtverontreiniging over lange afstand (2003/507/EG). EU Publication sheet L179/1, 2003-7-17.
71. RIVM/LAE, 1993. Memo E.Rab about information from Dutch Rail (NS) on emission factors for diesel powered trains, Bilthoven.
72. CTO, 1993, Project koperemissie spoorwegverkeer (copper emissions by rail traffic), part I, II en III, Dutch Rail (NS), Centrum voor Technisch Onderzoek, Utrecht.
73. Nollet, 1993. Taxitijden (runway taxi times) t.b.v. PMMS-werkgroep 4 (herziene versie), NV Schiphol Airport, AOM93/025.RH, 23 februari 1993.
74. CITEPA, 2003. Off Road Land-Based Diesel Engines, Draft Background Document on the sector, Paris, May 2003.
75. LEI, several years. Rapporten Landbouw-Economisch Instituut (LEI Wageningen University). 76. Denier van der Gon H.A.C., Hulskotte, J.H.J., Emissiefactoren voor methaan en lachgas uit de
luchtvaart en de scheepvaart (emission factors for CH4 and N2O from aviation and shipping), TNO-report R2003/294, (2002).
90
77. Harmelen, A.K., Koch, W.R., CO2 emission factors for fuels in the Netherlands, TNO R2002/174, (2002).
78. Hulskotte J, Protocol voor de vaststelling van het brandstofgebruik en de broeikasgasemissies van de visserij in Nederland conform de IPCC-richtlijnen (protocol for the assessment of fuel consumption and greenhouse gas emissions from fisheries), TNO-rapport 3 2004/391, 2004.
79. IPCC, Revised 1996 IPCC Guidelines for national greenhouse gas inventories, reference manual, (1996).
80. IPCC, IPCC Good practice Guidance and uncertainty management in national greenhouse gas inventories, (2001).
81. LNV (now ministry of Economic Affairs, including Agriculture), data from VIRIS (visserij registratie en informatiesysteem: Fisheries registration and information system), directorate of fisheries (2004).
82. LNV, Gids van visserijvaartuigen (guide book of fishing vessels), directorate of fisheries, (year unknown).
83. Rypdal et al., EMEP/CORINAIR Emission Inventory Guidebook, (2000). 84. ShipData, website met gegevens over vissersschepen, www.shipdata.nl (2004). 85. Taal, C. et al., Visserij in cijfers, annual reports 2000 – 2010 (in Dutch), LEI, Wageningen UR.
Latest report published in 2011 (nr. 2010-057). ISBN 9789086153763 86. Tyedmers, P., Energy Consumed by North Atlantic Fisheries.
(www.mgmt.dal.ca/sres/pdfs/Energy_Tyedmers1.pdf), in Zeller, D., R. Watson, and D. Pauly (eds.), Fisheries Impacts on North Atlantic Ecosystems: Catch, effort and national/regional datasets, Fisheries Centre Research Reports 9(3), 12-34, (2003).
87. Vreuls, H.H.J., Nederlandse lijst van energiedragers en standaard CO2-emissiefactoren (list of fuels and standard CO2-emission factors). SenterNovem (2004). See www.broeikasgassen.nl (Background information for the Dutch National Inventory Report and emission inventories).
88. VROM, Methode voor de berekening van broeikasgasemissies (greenhouse gas emissions calculation method), Publication series Dutch Emission Registration, No. 37, 1997.
89. Bunkerworld, TWI - Data Archive & Latest TWI Figures (www.bunkerworld.com),(2004).
90. Hoen, A., R.M.M. van den Brink, J.A. Annema (2006) Verkeer en vervoer in de Welvaart en Leefomgeving (transport in relation to prosperity and environment), Background document for Transport Emission prognosis Verkeer en Vervoer, MNP rapportnr. 500076 002, Milieu- en Natuurplanbureau, Bilthoven.
91. Smit, R., R. Smokers, E. Schoen, A. Hensema, 2006. A new modelling approach for road traffic emissions: VERSIT+LD – Background and Methodology. TNO report 06.OR.PT.016.1/RS, TNO Science and Industry, Powertrains, Delft, July 14, 2006.
92. Oord, J.C.M. van, Ministery of Defence, Personal comments. Excel-file 2006-4-13. 93. Weyrauther, G. et.al., Ermittlung der Abgasemissionen aus dem Flugverkehrüber der
Bundesrepublik Deutschland. UBA-Berichte 6/89. 94. Lloyds Register, 1990. Marine Exhaust Emissions Research Programme, Steady Operations,
London, 1990. 95. ICAO, several years, International Civil Aviation Organisation. International standards and
recommended practices environmental protection, annex 16 to the convention on international civil aviation, first edition 1981.
96. DERA, 1999, Second revised edition of the ICAO Aircraft Engine Exhaust Emissions Databank, 8 February 1999.
97. FAA, 1996, Federal Aviation Agency, Federal Aviation Air Emissions Databank version 2.1. 98. EPA, 1985, Environmental Protection Agency, Compilation of air pollution emission factors,
volume 2, Mobile sources, 4th edition.
99. Bolt, E., EMS-protocol Emissies door Binnenvaart (emissions from inland navigation): Ontgassing van ladingdampen naar lucht (degassing of load vapours). Project Emissieregistratie en Monitoring Scheepvaart. Rijkswaterstaat, Adviesdienst Verkeer en Vervoer, (EMS project of Ministry of Waterways and public works) Rotterdam, 1 oktober 2003.
100. Hulskotte, J., E. Bolt, D. Broekhuizen, EMS-protocol Emissies door Binnenvaart: Verbrandingsmotoren (combustion engines). Project Emissieregistratie en Monitoring Scheepvaart. Rijkswaterstaat, Adviesdienst Verkeer en Vervoer, Rotterdam, 22 november 2003. See ref. 99.
101. Hulskotte, J., R. Koch, 2000, Emissiefactoren zeeschepen (emission factors for seagoing vessels). TNO Built Environment and Geosciences, rapport R 2000/221, TNO, Apeldoorn.
102. Tak, C. van der, Actualisatie T0-emissies. Marin Rapport nr. 16196.620/2, 10 juli 2000. 103. Entec, 2002 European Commission, Quantification of emissions from ships associated with
ship movements between ports in the European Community, ENTEC Limited, July 2002.
91
104. Oonk et. al., Emissiefactoren van zeeschepen voor de toepassing in de jaarlijkse emissieberekeningen (emission factors ofg seagoing vessels), TNO Built Environment and Geosciences R2003/438, oktober 2003.
105. MARIN, 2003, Emissieberekening routegebonden scheepvaartverkeer op NCP, op basis van aangepaste bronbestanden en emissiefactoren (emission calculations of route bound navigation on the Dutch Continental Shelf (NCP)), Rapport Nr 18717.620.1, 25 juli 2003.
106. Hulskotte et.al., 2003, Emissies door verbrandingsmotoren van zeeschepen op het Nederlands Continentaal Plat (combustion emissions for seagoing vessels on the NCP, EMS protocol, november 2003.
107. RIZA. Factsheet “emissies remvoeringen” (emission of brake wear). See: www.emissieregistratie.nl/erpubliek/misc/documenten.aspx?ROOT=Water\F
actsheets\English
108. RIZA, 2005. Factsheet “motoremissies recreatievaart” (exhaust from recreational boats). See hyperlink ref. 107.
109. AVV, 2007. Verkeersprestatie op rijkswegen in 2001 (Traffic performance on national roads). Rijkswaterstaat, Adviesdienst Verkeer en Vervoer.
110. NAP, 2006. Nationale Autopas. www.autopas.nl (‘National car passport’)
111. Smit, R., Smokers, R., Schoen, E. & Hensema, A. (2006a) A New Modelling Approach for Road traffic Emissions – VERSIT+ Light Duty, TNO Report 06.OR.VM.016.1/RS.
112. Smit, R., Van Mieghem, R. & Hensema, A. (2006b) Algemene PM10, NOx en NO2 emissiefactoren voor Nederlandse Snelwegen (emission factors for dutch motorways). TNO Report 06.OR.PT.029.1/RS.
113. Smit, R., Smokers, R., Rabé, E., 2007. A new modelling approach for road traffic emissions: VERSIT+, Transp. Res. Part D, Submitted.
114. Weilenmann, M (2005) Impact of Air Conditioning on Emissions of Gasoline Euro-3 Passenger Cars – Preliminary Report, EMPA, Dübendorf.
115. Riemersma, I.J. & Smokers, R. (2004) Ontwikkeling van het Versit+ HD emissiemodel, TNO, Delft (development of the Versit+ Heavy Duty emission model)
116. European Environment Agency (2007) EMEP/CORINAIR Emission Inventory Guidebook 2007. European Environment Agency, Kopenhagen, Denemarken.
117. RWS Waterdienst, Factsheet “Emissies door wegdekslijtage ten gevolge van het wegverkeer” (emissions from road surface wear). Downloadable via www.emissieregistratie.nl
118. RWS Waterdienst, Factsheet “Emissies door bandenslijtage ten gevolge van het wegverkeer” (emissions from tyre wear). Downloadable via www.emissieregistratie.nl
119. Ligterink, N.E., Lange, R. de, (2009), “Refined vehicle and driving behaviour dependencies in the VERSIT+ emission model”, ETAPP symposium.
120. Hulskotte J.H.J., Verbeek R., Emissiemodel Mobiele Machines gebaseerd op machineverkopen in combinatie met brandstofafzet (emission model for mobile machinery) (EMMA), TNO-034-UT-2009-01782_RPT-ML, november 2009.
121. Kugele, A. , Jelinek F., Gaffal R., Aircraft Particulate Matter Estimation through all Phases of Flight, Eurocontrol EEC/SEE/2005/0014
122. Agrawal H. et al., Characterization of chemical and particulate emissions from aircraft engines, Atmospheric Environment 41, 4380-4392, 2008
123. Morris K.M., Emissions from Aircraft; Airframe sources; Tyre and Brake wear, British Airways, 12 April 2007
124. Denier van der Gon, H., M. Verheul, W. Appelman, G. Klaver, P. Bosch, Metal contents of diesel and petrol fuel sold on the European Market, poster presented at CONCAWE, WORKSHOP ON ENVIRONMENT & HEALTH, Evaluating European Air Quality Research and Translating Priorities into Actions, 19 & 20 January 2009, Hotel Bedford, Brussels (Belgium).
125. Broeke, H.M. ten, Hulskotte J.H.J., Actuele VOS- en PAK-profielen van wegverkeer (VOC and PAH profiles), TNO-034-UT-2009-00604_RPT-ML, november 2009.
126. Molnár-in’t Veld en Dohmen-Kampert, Verkeersprestaties autobussen; methodebeschrijving en resultaten (traffic performance of buses; method description and results). Statistics Netherlands (CBS), Den Haag/Heerlen, 2011.
127. Chiffi F., Schrooten E., de Vlieger I., EX-TREMIS - Exploring non road Transport Emissions in Europe – Final Report. IPTS - Institute for Prospective Technological Studies. DG-JRC, 2007
128. Grose I. and J. Flaherty, LNG Carrier Benchmarking. LNG15 2007. Shell Global Solutions International BV, 2007.
129. UK Civil Aviation Authority, ICAO Engine Emissions Databank, updated December 2010 130. Dröge, R., Hensema, A., ten Broeke, H., Hulskotte, J. Emissions of two-wheeled vehicles.
TNO-report TNO-060-UT-2011-01556, Utrecht 2011.
92
131. Norbert E. Ligterink, Lóránt A. Tavasszy, and Ronald de Lange, "A velocity and payload dependent emission model for heavy-duty road freight transportation," Transportation Research Part D 17 (2012) 487-491
132. Hulskotte, J. and Bolt, E. , ‘EMS-protocol Emissies door binnenvaart: verbrandingsmotoren’ (Emissions by inland navigation: combustion engines), version 4. Emission Registration Task Force on Transportation (in preparation).
133. Molnár-in ’t Veld, Onderzoeksmethode berekenen verkeersprestaties van personenauto’s (Survey method calculation of traffic performance of passenger cars). Statistics Netherlands (CBS), Den Haag/Heerlen, 2014.
134. Kampert A., Van Melis,J., Molnár-in ’t Veld,H., Sijstermans,M., Willems,R. Methoderapport verkeersprestaties speciale voertuigen (Methodogical report vehicle kilometres special purpose vehicles )(abstract in English). Statistics Netherlands (CBS), Den Haag/Heerlen, 2014.
135. Molnár-in ’t Veld, H., Sijstermans, M., Staats, K., Buelens, B., Kruiskamp, P., Kampert, A., Meijers, R., van Melis, J. Methodologisch rapport verkeersprestaties motorfietsen en bromfietsen (Methodological report vehicle kilometres motorcycles and mopeds) (abstract in English). Statistics Netherlands (CBS), Den Haag/Heerlen, 2014.
136. Rindlisbacher, T., Guidance on the determination of helicopter emissions, Federal Office Of Civil Aviation (FOCA), Swiss Confederation, Reference: 0/ 3/33/33-05-20, 1 March 2009.
137. Sears, Air pollutant emission factors for military and civil aircraft, EPA-450/3-78-117, October 1978.
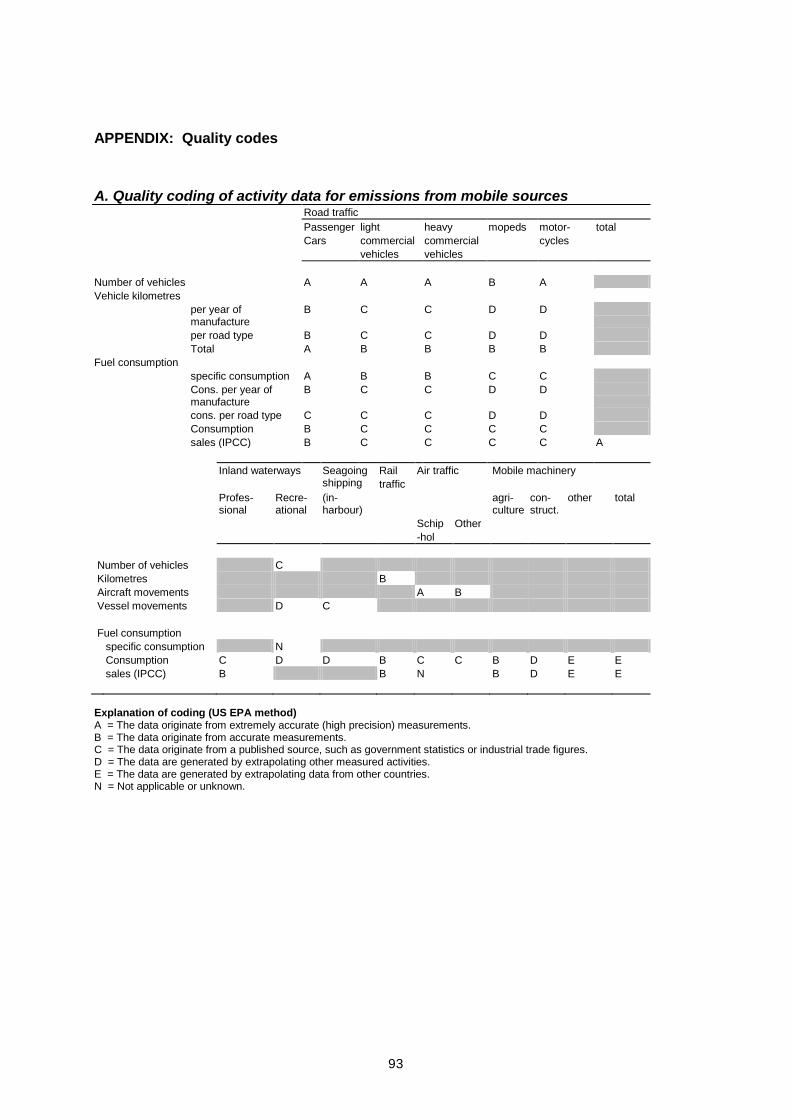
93
APPENDIX: Quality codes
A. Quality coding of activity data for emissions from mobile sources Road traffic
Passenger light heavy mopeds motor- total
Cars commercial commercial cycles
vehicles vehicles
Number of vehicles A A A B A
Vehicle kilometres
per year of manufacture
B C C D D
per road type B C C D D
Total A B B B B
Fuel consumption
specific consumption A B B C C
Cons. per year of manufacture
B C C D D
cons. per road type C C C D D
Consumption B C C C C
sales (IPCC) B C C C C A
Inland waterways Seagoing shipping
Rail
traffic
Air traffic Mobile machinery
Profes-sional
Recre-ational
(in- harbour)
agri- culture
con-struct.
other total
Schip Other
-hol
Number of vehicles C
Kilometres B
Aircraft movements A B
Vessel movements D C
Fuel consumption
specific consumption N
Consumption C D D B C C B D E E
sales (IPCC) B B N B D E E
Explanation of coding (US EPA method) A = The data originate from extremely accurate (high precision) measurements. B = The data originate from accurate measurements. C = The data originate from a published source, such as government statistics or industrial trade figures. D = The data are generated by extrapolating other measured activities. E = The data are generated by extrapolating data from other countries. N = Not applicable or unknown.
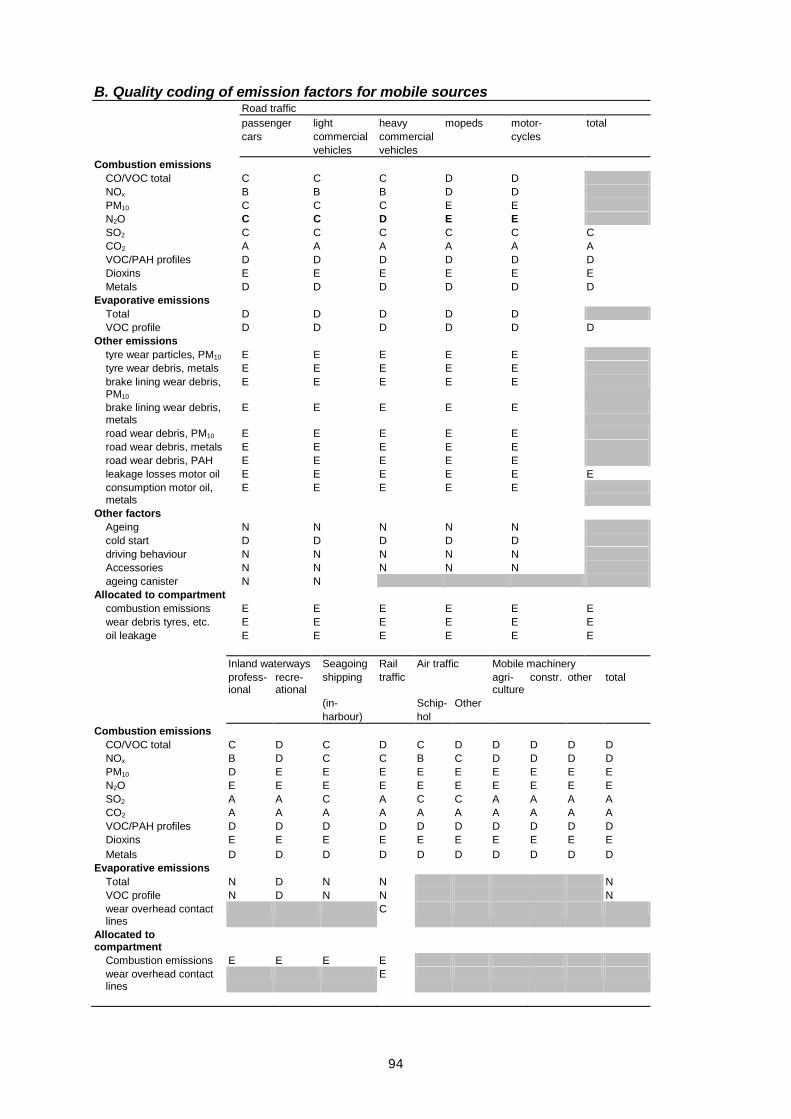
94
B. Quality coding of emission factors for mobile sources Road traffic
passenger light heavy mopeds motor- total
cars commercial commercial cycles
vehicles vehicles
Combustion emissions
CO/VOC total C C C D D
NOx B B B D D
PM10 C C C E E
N2O C C D E E
SO2 C C C C C C
CO2 A A A A A A
VOC/PAH profiles D D D D D D
Dioxins E E E E E E
Metals D D D D D D
Evaporative emissions
Total D D D D D
VOC profile D D D D D D
Other emissions
tyre wear particles, PM10 E E E E E
tyre wear debris, metals E E E E E
brake lining wear debris, PM10
E E E E E
brake lining wear debris, metals
E E E E E
road wear debris, PM10 E E E E E
road wear debris, metals E E E E E
road wear debris, PAH E E E E E
leakage losses motor oil E E E E E E
consumption motor oil, metals
E E E E E
Other factors
Ageing N N N N N
cold start D D D D D
driving behaviour N N N N N
Accessories N N N N N
ageing canister N N
Allocated to compartment
combustion emissions E E E E E E
wear debris tyres, etc. E E E E E E
oil leakage E E E E E E
Inland waterways Seagoing Rail Air traffic Mobile machinery
profess-ional
recre-ational
shipping traffic agri- culture
constr. other total
(in- Schip- Other
harbour) hol
Combustion emissions
CO/VOC total C D C D C D D D D D
NOx B D C C B C D D D D
PM10 D E E E E E E E E E
N2O E E E E E E E E E E
SO2 A A C A C C A A A A
CO2 A A A A A A A A A A
VOC/PAH profiles D D D D D D D D D D
Dioxins E E E E E E E E E E
Metals D D D D D D D D D D
Evaporative emissions
Total N D N N N
VOC profile N D N N N
wear overhead contact lines
C
Allocated to compartment
Combustion emissions E E E E
wear overhead contact lines
E
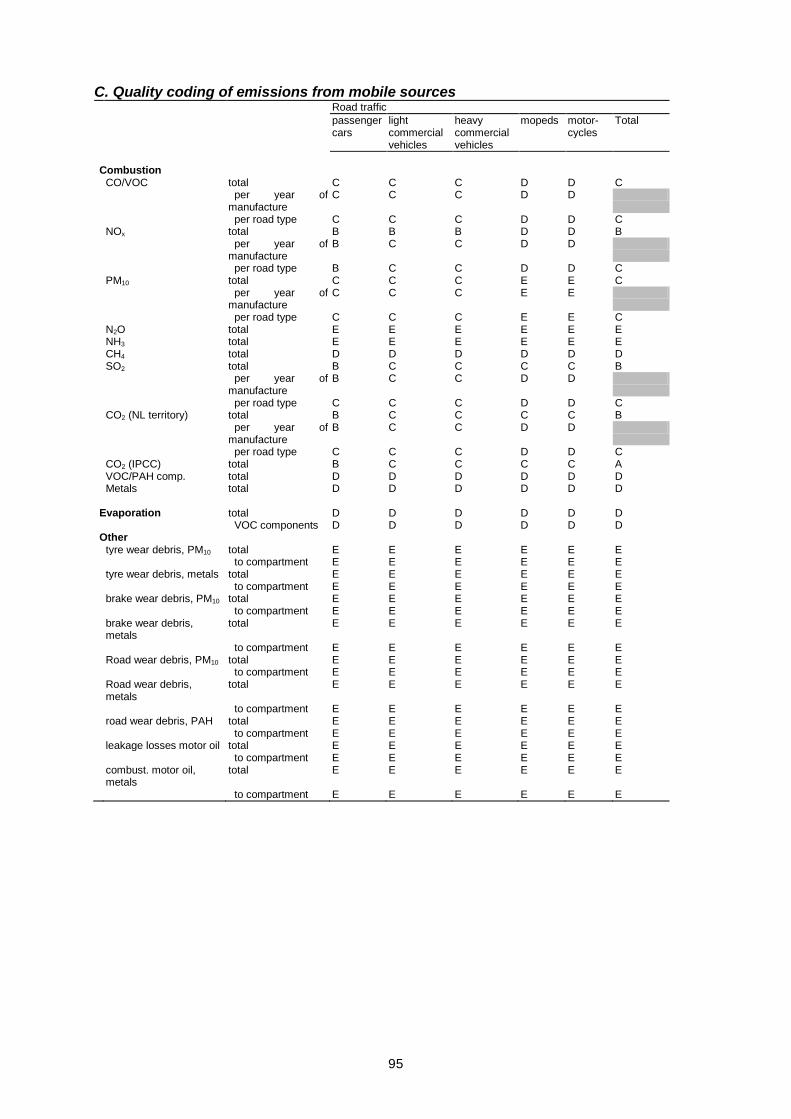
95
C. Quality coding of emissions from mobile sources Road traffic
passenger light heavy mopeds motor- Total cars commercial commercial cycles vehicles vehicles
Combustion CO/VOC total C C C D D C per year of
manufacture C C C D D
per road type C C C D D C NOx total B B B D D B per year of
manufacture B C C D D
per road type B C C D D C PM10 total C C C E E C per year of
manufacture C C C E E
per road type C C C E E C N2O total E E E E E E NH3 total E E E E E E CH4 total D D D D D D SO2 total B C C C C B per year of
manufacture B C C D D
per road type C C C D D C CO2 (NL territory) total B C C C C B per year of
manufacture B C C D D
per road type C C C D D C CO2 (IPCC) total B C C C C A VOC/PAH comp. total D D D D D D Metals total D D D D D D Evaporation total D D D D D D VOC components D D D D D D Other tyre wear debris, PM10 total E E E E E E to compartment E E E E E E tyre wear debris, metals total E E E E E E to compartment E E E E E E brake wear debris, PM10 total E E E E E E to compartment E E E E E E brake wear debris,
metals total E E E E E E
to compartment E E E E E E Road wear debris, PM10 total E E E E E E to compartment E E E E E E Road wear debris,
metals total E E E E E E
to compartment E E E E E E road wear debris, PAH total E E E E E E to compartment E E E E E E leakage losses motor oil total E E E E E E to compartment E E E E E E combust. motor oil,
metals total E E E E E E
to compartment E E E E E E
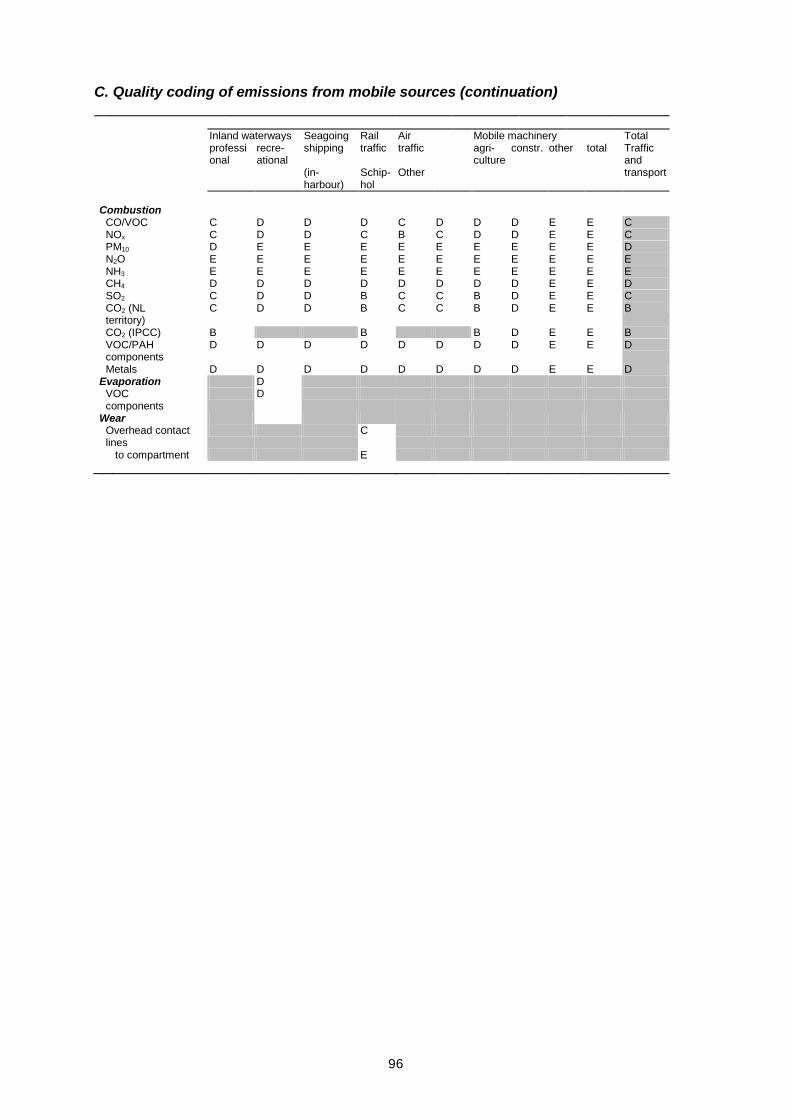
96
C. Quality coding of emissions from mobile sources (continuation)
Inland waterways Seagoing Rail Air Mobile machinery Total professi
onal recre-ational
shipping traffic traffic agri-culture
constr. other total Traffic and transport (in- Schip- Other
harbour) hol
Combustion CO/VOC C D D D C D D D E E C NOx C D D C B C D D E E C PM10 D E E E E E E E E E D N2O E E E E E E E E E E E NH3 E E E E E E E E E E E CH4 D D D D D D D D E E D SO2 C D D B C C B D E E C CO2 (NL
territory) C D D B C C B D E E B
CO2 (IPCC) B B B D E E B VOC/PAH
components D D D D D D D D E E D
Metals D D D D D D D D E E D Evaporation D VOC
components D
Wear Overhead contact
lines C
to compartment E