Embed Size (px)
Citation preview

Climate Security and Sustainable Development
METHODOLOGY
REDUCED EMISSIONS FROM COOKING AND HEATING:
Technologies and Practices to Displace Decentralized Thermal Energy
Consumption (TPDDTEC)
SDG 13
Publication Date: 07/10/2021
Version: 4.0
Next Planned Update: 06/10/2024
Contact details
The Gold Standard Foundation Chemin de Balexert 7-9
1219 Châtelaine International Environment House 2
Geneva, Switzerland Tel: +41 22 788 70 80
Email: [email protected]
SUMMARY
This methodology is applicable to project activities that introduce technologies and/or
practices that reduce or displace greenhouse gas (GHG) emissions from the thermal
energy consumption of households and/or residential, institutional, industrial, or
commercial facilities. It is a revised version of the Technologies and Practices to
Displace Decentralized Thermal Energy Consumption (TPDDTEC) v3.1 methodology.
This methodology shall be used in conjunction with the GHG Emissions Reduction &
Sequestration Product Requirements and projects and programmes applying this
methodology may be issued with GSVERs.

METHODOLOGY-SDG IQ Reduced emissions from cooking and heating
2
ACKNOWLEDGMENT
Several organisations and individuals have contributed to the development of this
methodology and/or to the development of previous Gold Standard methodologies
from which this new methodology is partly built on.
Special thanks to:
ClimateCare: Adam Harvey
Oxford University: Tim Heaton, Amber Tomas
Impact Carbon: Evan Haigler, Matt Evans
Carbon Bridge: Bridget McIntosh, Emma Jenkin
Berkeley Air Monitoring Group: David Pennise, Michael Johnson
UC-Berkeley: Seth Shonkoff
E&Co: Erik Wurster
Yale University: Rob Bailis
Statoo Consulting: Diego Kuonen
Bosch and Siemens Home: Samuel N. Shiroff
Appliances Group GmbH:
The Gold Standard Technical Advisory Committee:
Matt Spannagle, Steve Thorne, Rob Fowler, Shelagh Whitley, Shigueo Watanabe,
Sudha Padmanabha, Liam Salter (Former), Rutger de Witt Wijnen, Alexia Kelly
(Former), Narendra Paruchuri (Former)
The Gold Standard Technical Team:
Meinrad Bürer, Abhishek Goyal, Vikash Talyan, Subuddhi Banthia, Sriskandh
Subramanian, Owen Hewlett
We would also like to thank Anu Chaudhary, Miguel Cortes, Suzanne Longworth, Tom
Owino and Owen Hewlett for their contribution to the revision of this methodology
(V3.1).
Inquiries should be directed to the Gold Standard Foundation secretariat at:

METHODOLOGY-SDG IQ Reduced emissions from cooking and heating
3
TABLE OF CONTENTS
SUMMARY ___________________________________________________________________ 1
ACKNOWLEDGMENT ___________________________________________________________ 2
TABLE OF CONTENTS ................................................................................................. 3
1| DEFINITION _______________________________________________________________ 4
2| SCOPE, APPLICABILITY, AND ENTRY INTO FORCE _________________________________ 4
Scope ........................................................................................................ 4
Applicability ................................................................................................ 5
Safeguards ................................................................................................. 7
Entry into force ........................................................................................... 7
3| BASELINE METHODOLOGY ____________________________________________________ 8
Project Boundary ......................................................................................... 8
Emissions sources included in the project boundary ........................................... 8
Demonstration of additionality ....................................................................... 9
Baseline scenario ......................................................................................... 9
Selection and justification of the baseline scenarios ........................................... 9
Project scenario ..........................................................................................11
Selection and justification of the project scenarios ............................................11
Changes to the baseline and project scenarios .................................................11
Suppressed demand baseline scenario ............................................................12
Emission reductions calculation .....................................................................12
Leakage emissions ......................................................................................17
Adjustment factors ......................................................................................18
Changes required for methodology implementation in 2nd and 3rd crediting periods .18
Data and parameters not monitored ...............................................................19
4| MONITORING METHODOLOGY ________________________________________________30
Monitoring data and information requirements ...................................................30
Data and parameters monitored......................................................................34
Baseline scenario survey................................................................................43
General requirements for sampling ..................................................................43
General Requirements for Quality Assurance and Quality Control ..........................45
ANNEX - 1: SUPPRESSED DEMAND AND SATISFACTORY LEVEL OF SERVICE .......... 46
ANNEX - 2: COMPLEMENTARY GUIDELINES FOR KITCHEN PERFORMANCE TESTING 48
ANNEX - 3: PROJECT PREPARATION AND MONITORING SCHEDULE (FOR ONE
CREDITING PERIOD) ...................................................................................... 55
ANNEX - 4: AGING TEST APPROACH FOR PROJECT FUEL UPDATES ....................... 56
Data and parameters not monitored ........................................................................57
Data and parameters monitored .............................................................................57
DOCUMENT HISTORY ...................................................................................... 59

METHODOLOGY-SDG IQ Reduced emissions from cooking and heating
4
1| Definition
For the purpose of this methodology, the following definitions apply:
a. Continuous useful energy output: Energy transferred to the contents of
a cooking vessel, including the sensible heat that raises the temperature of
the contents of the cooking vessel and the latent heat of evaporation of
water from the cooking vessel, divided by the time of the operation of the
cooking task.
b. Double counting: Occurs when the same emission reduction is used
more than once to achieve mitigation obligations, as a result of double-
issuance, double-use, or double-claiming.
c. Technical life: Average time for which the project technology may
continue to be operated for an extended period in a safe manner and with
minimal loss of performance.
d. Technology: In this methodology, the single or multiple technologies
and/or practices applied in the project activity that result in emission
reduction.
2| Scope, Applicability, and entry into force
Scope
This methodology is applicable to project activities that introduce technologies
and/or practices that reduce or displace greenhouse gas (GHG) emissions
from the thermal energy consumption of households and/or residential,
institutional, industrial, or commercial facilities. Throughout the methodology
the term ‘technology’ should be read as the single or multiple technologies
and/or practices applied in the project activity. Refer to Table 1 for examples
of applicable technologies and practices.
Where there is no installation of improved devices and project claims emission
reductions from improved practices only, project shall provide a detailed
discussion of the chosen monitoring approach to demonstrate that quantified
emission reductions result exclusively from the practices introduced by the
project activity.
Project may involve progressive distribution of technology where
implementation of the technology may occur in a gradual manner and
adoption can increase over the project’s crediting period.
METHODOLOGY-SDG IQ Reduced emissions from cooking and heating
5
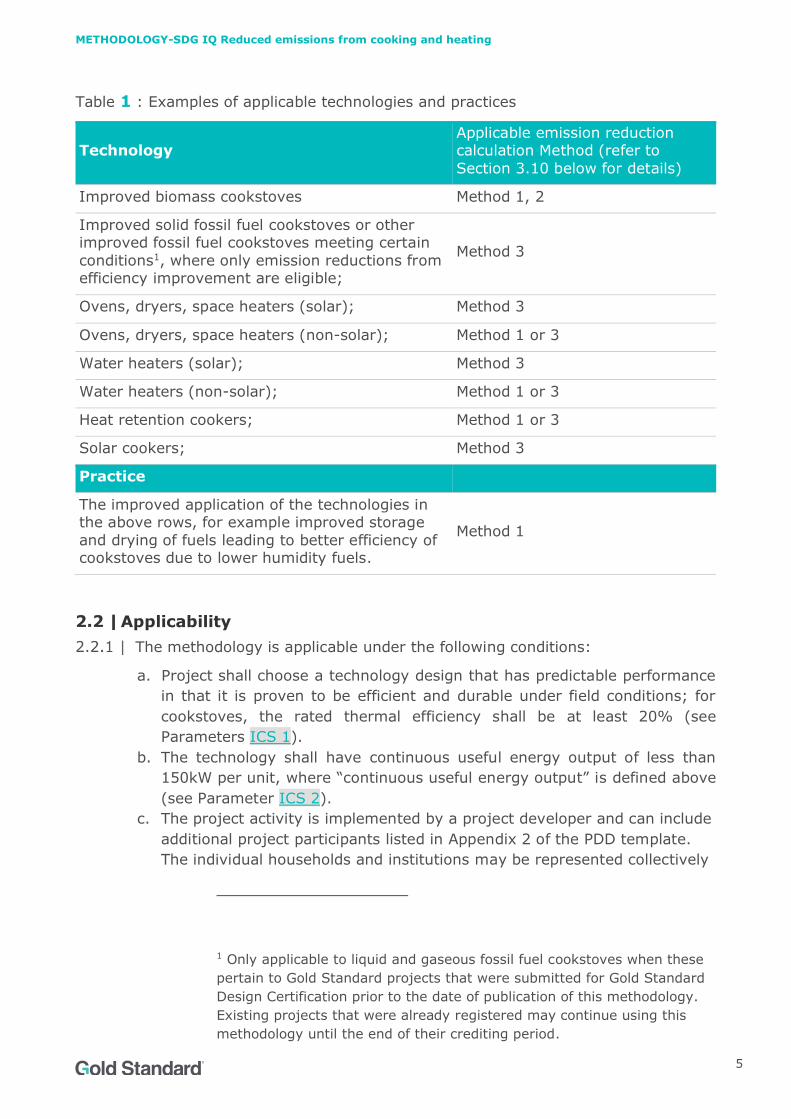
Table 1 : Examples of applicable technologies and practices
Technology Applicable emission reduction calculation Method (refer to
Section 3.10 below for details)
Improved biomass cookstoves Method 1, 2
Improved solid fossil fuel cookstoves or other improved fossil fuel cookstoves meeting certain
conditions1, where only emission reductions from efficiency improvement are eligible;
Method 3
Ovens, dryers, space heaters (solar); Method 3
Ovens, dryers, space heaters (non-solar); Method 1 or 3
Water heaters (solar); Method 3
Water heaters (non-solar); Method 1 or 3
Heat retention cookers; Method 1 or 3
Solar cookers; Method 3
Practice
The improved application of the technologies in the above rows, for example improved storage
and drying of fuels leading to better efficiency of cookstoves due to lower humidity fuels.
Method 1
Applicability
The methodology is applicable under the following conditions:
a. Project shall choose a technology design that has predictable performance
in that it is proven to be efficient and durable under field conditions; for
cookstoves, the rated thermal efficiency shall be at least 20% (see
Parameters ICS 1).
b. The technology shall have continuous useful energy output of less than
150kW per unit, where “continuous useful energy output” is defined above
(see Parameter ICS 2).
c. The project activity is implemented by a project developer and can include
additional project participants listed in Appendix 2 of the PDD template.
The individual households and institutions may be represented collectively
1 Only applicable to liquid and gaseous fossil fuel cookstoves when these
pertain to Gold Standard projects that were submitted for Gold Standard
Design Certification prior to the date of publication of this methodology.
Existing projects that were already registered may continue using this
methodology until the end of their crediting period.

METHODOLOGY-SDG IQ Reduced emissions from cooking and heating
6
by community organizations, etc., but do not individually act as project
participants.
d. The project developer must design incentive mechanism(s), which should
be effective as fast as possible, for the elimination of inefficient baseline
stoves that are replaced by the project cooking devices and describe the
incentive mechanism(s) in the PDD/VPA-DD at the time of validation.
e. To avoid double counting or double claiming, the project developer must:
i. clearly communicate its ownership rights and intention of claiming
the emission reductions resulting from the project activity to the
following parties by contract or clear written assertions in the
transaction paperwork: all other project participants; project
technology manufacturers; and retailers of the project technology or
the renewable fuel in use; and
ii. inform and notify the end users that they cannot claim emission
reductions from the project, and
iii. exclude from the project activity, cooking devices included in any
other voluntary market or CDM project activity/PoA, and strive not
to displace the cooking devices of another CDM or voluntary
project/PoA. See data and parameters not monitored, Avoidance of
double counting or double claiming with other mitigation actions, for
details on this demonstration.
f. Project activities making use of solid fossil fuel in the project scenario or
other improved fossil fuel cookstoves meeting certain conditions described
in the footnote to Table 1 (e.g. switch from three-stone fire biomass
stoves to LPG stoves) may only claim emission reductions for energy
efficiency improvement aspect and shall assume the same baseline and
project fuel for emission reduction calculations.
g. Project activities making use of a new solid biomass feedstock in the
project situation (e.g. switch to green charcoal or renewable biomass
briquettes) must comply with relevant specific requirements for biomass
related project activities, as defined in the latest version of the Community
Services Activity Requirements. The specific requirements apply to both
plantations established for the project activity and/or existing plantations
that will supply biomass feedstock.
h. Adequate evidence is supplied to demonstrate that indoor air pollution
(IAP) levels are not worsened compared to the baseline, and greenhouse
gases emitted by the project fuel/stove combination are estimated with
METHODOLOGY-SDG IQ Reduced emissions from cooking and heating
7
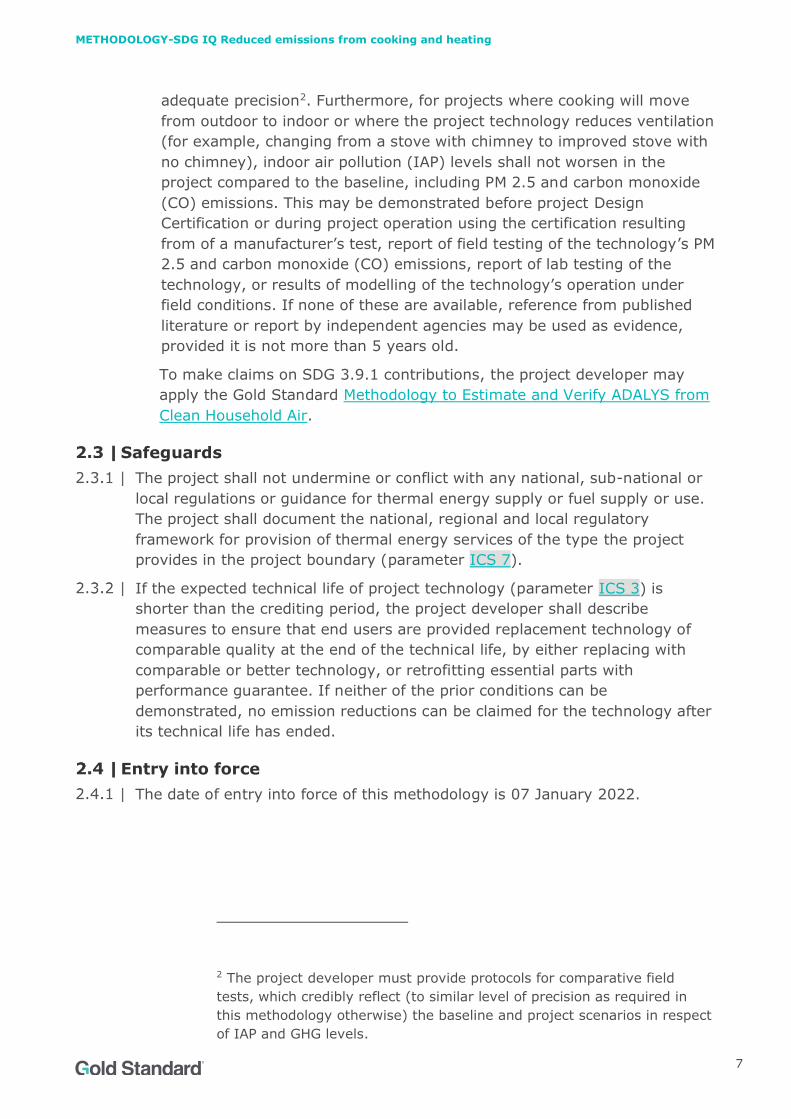
adequate precision2. Furthermore, for projects where cooking will move
from outdoor to indoor or where the project technology reduces ventilation
(for example, changing from a stove with chimney to improved stove with
no chimney), indoor air pollution (IAP) levels shall not worsen in the
project compared to the baseline, including PM 2.5 and carbon monoxide
(CO) emissions. This may be demonstrated before project Design
Certification or during project operation using the certification resulting
from of a manufacturer’s test, report of field testing of the technology’s PM
2.5 and carbon monoxide (CO) emissions, report of lab testing of the
technology, or results of modelling of the technology’s operation under
field conditions. If none of these are available, reference from published
literature or report by independent agencies may be used as evidence,
provided it is not more than 5 years old.
To make claims on SDG 3.9.1 contributions, the project developer may
apply the Gold Standard Methodology to Estimate and Verify ADALYS from
Clean Household Air.
Safeguards
The project shall not undermine or conflict with any national, sub-national or
local regulations or guidance for thermal energy supply or fuel supply or use.
The project shall document the national, regional and local regulatory
framework for provision of thermal energy services of the type the project
provides in the project boundary (parameter ICS 7).
If the expected technical life of project technology (parameter ICS 3) is
shorter than the crediting period, the project developer shall describe
measures to ensure that end users are provided replacement technology of
comparable quality at the end of the technical life, by either replacing with
comparable or better technology, or retrofitting essential parts with
performance guarantee. If neither of the prior conditions can be
demonstrated, no emission reductions can be claimed for the technology after
its technical life has ended.
Entry into force
The date of entry into force of this methodology is 07 January 2022.
2 The project developer must provide protocols for comparative field
tests, which credibly reflect (to similar level of precision as required in
this methodology otherwise) the baseline and project scenarios in respect
of IAP and GHG levels.
METHODOLOGY-SDG IQ Reduced emissions from cooking and heating
8
3| Baseline Methodology
Project Boundary
Project developer shall provide clear definitions of project boundary, target
area, and fuel production and collection area:
a. The project boundary is the physical, geographical sites of the project
technologies/practices including the fuel collection and production area.
i. Where the baseline fuel is woody biomass (including charcoal), the
project boundary also includes the area within which this woody
biomass is grown and collected.
ii. For projects using processed fuels, this boundary also includes the
baseline and project fuel production (e.g. charcoal, plant oil) and
solid waste and effluents disposal or treatment facilities associated
with fuel processing.
iii. In cases where the project activity introduces the use of a new
biomass feedstock into the project situation, the fuel production and
collection area is the area within which this new biomass is
produced, collected and supplied.
b. The target area is the region(s) or town(s) where the considered baseline
scenario(s) are deemed to be uniform across political borders. This area
could be within a single country, or across multiple adjacent countries. The
target area provides an outer limit to the project boundary in which the
project has a target population.
Emissions sources included in the project boundary
Emissions from fuels can occur during fuel production, transport and
consumption.
a. Baseline emissions from any gases marked below may be omitted for
simplification.
b. All project emissions from any of the gases marked below must be
accounted for, unless demonstrably negligible or not applicable to the
individual project.
c. Project emissions from transportation of fuel/biomass shall be accounted if
the transportation distance (including both long-distance and home
delivery transport) is more than 200 km; otherwise they can be neglected.
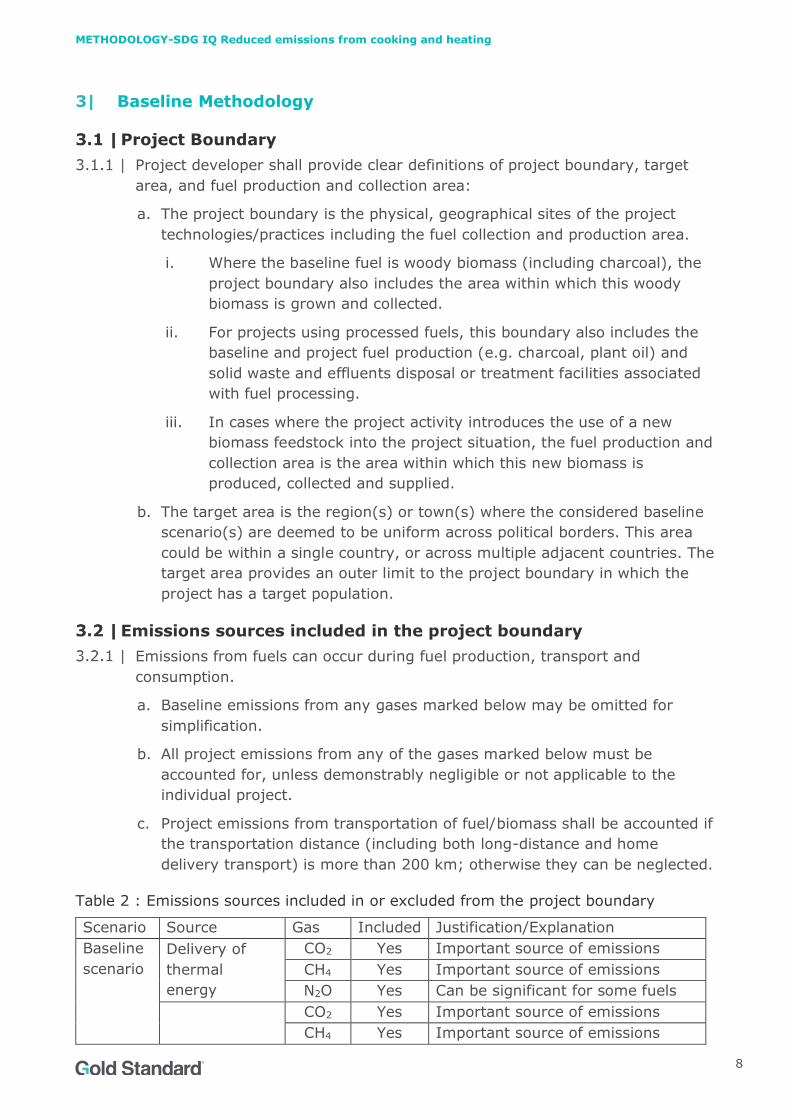
Table 2 : Emissions sources included in or excluded from the project boundary
Scenario Source Gas Included Justification/Explanation
Baseline
scenario
Delivery of
thermal
energy
CO2 Yes Important source of emissions
CH4 Yes Important source of emissions
N2O Yes Can be significant for some fuels
CO2 Yes Important source of emissions
CH4 Yes Important source of emissions
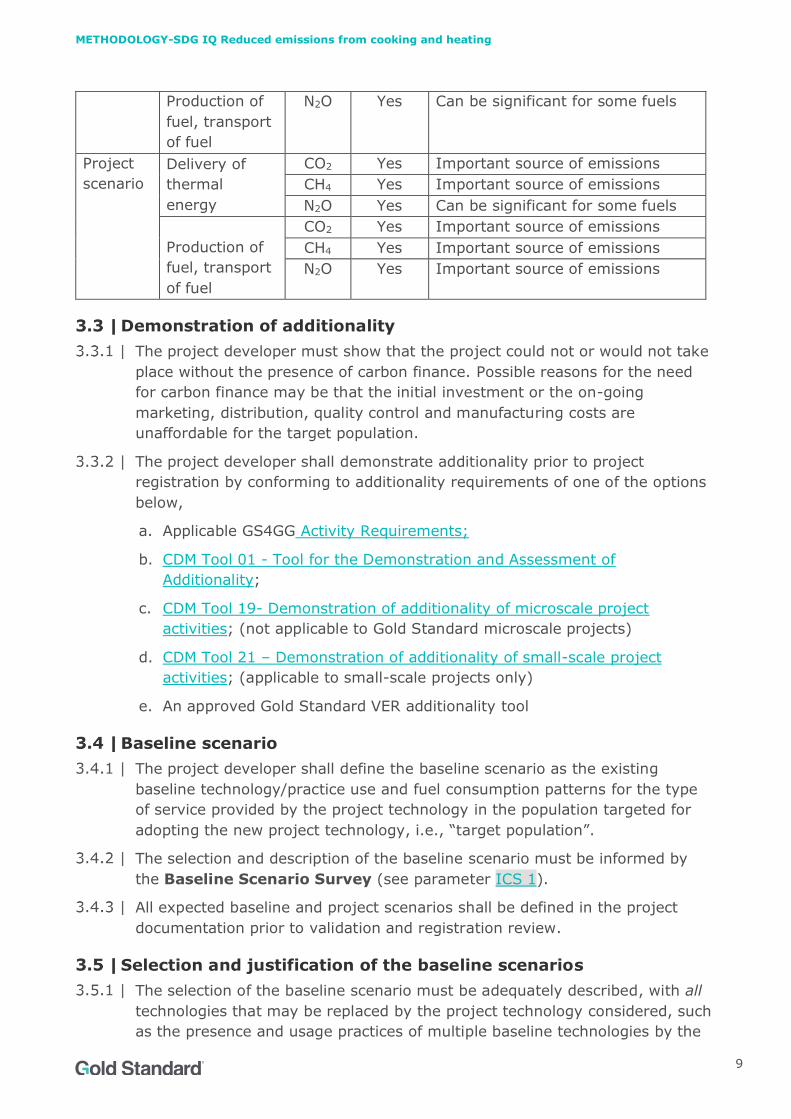
METHODOLOGY-SDG IQ Reduced emissions from cooking and heating
9
Production of
fuel, transport
of fuel
N2O Yes Can be significant for some fuels
Project
scenario
Delivery of
thermal
energy
CO2 Yes Important source of emissions
CH4 Yes Important source of emissions
N2O Yes Can be significant for some fuels
Production of
fuel, transport
of fuel
CO2 Yes Important source of emissions
CH4 Yes Important source of emissions
N2O Yes Important source of emissions
Demonstration of additionality
The project developer must show that the project could not or would not take
place without the presence of carbon finance. Possible reasons for the need
for carbon finance may be that the initial investment or the on-going
marketing, distribution, quality control and manufacturing costs are
unaffordable for the target population.
The project developer shall demonstrate additionality prior to project
registration by conforming to additionality requirements of one of the options
below,
a. Applicable GS4GG Activity Requirements;
b. CDM Tool 01 - Tool for the Demonstration and Assessment of
Additionality;
c. CDM Tool 19- Demonstration of additionality of microscale project
activities; (not applicable to Gold Standard microscale projects)
d. CDM Tool 21 – Demonstration of additionality of small-scale project
activities; (applicable to small-scale projects only)
e. An approved Gold Standard VER additionality tool
Baseline scenario
The project developer shall define the baseline scenario as the existing
baseline technology/practice use and fuel consumption patterns for the type
of service provided by the project technology in the population targeted for
adopting the new project technology, i.e., “target population”.
The selection and description of the baseline scenario must be informed by
the Baseline Scenario Survey (see parameter ICS 1).
All expected baseline and project scenarios shall be defined in the project
documentation prior to validation and registration review.
Selection and justification of the baseline scenarios
The selection of the baseline scenario must be adequately described, with all
technologies that may be replaced by the project technology considered, such
as the presence and usage practices of multiple baseline technologies by the

METHODOLOGY-SDG IQ Reduced emissions from cooking and heating
10
target population (“stove-stacking”). It is not legitimate to compare the
project to only the most inefficient technology being used by the target
population.
Project developers must consider distinct baseline scenarios when the project
activity targets end user populations that consume significantly different fuels.
For example, end users cooking predominantly with wood are significantly
different from end users cooking predominantly with charcoal and would thus
warrant a different baseline scenario.
When the project includes different project technology types, the project
developer must analyse whether multiple baseline scenarios are applicable in
relation to the different project technologies, depending on fuel type and
baseline technology use patterns in target population. For example, one
baseline scenario may represent rural end users predominantly using
inefficient wood stoves, while a second baseline scenario may represent an
urban target population predominantly using inefficient charcoal stoves.
A different baseline scenario is not necessarily required for each different
technology in the project activity. For example, different improved wood stove
models in the project activity could be compared to the same wood stove
baseline scenario, and different improved charcoal stove models in the project
activity could be compared to the same inefficient charcoal stove baseline
scenario.
In a project activity where all units are installed at the start, or in a non-
industrial project activity with gradual technology adoption, the baseline is
considered fixed in time during the considered crediting period. It therefore
does not require continuous monitoring or updating.
In project activities targeting industrial applications 3 where the emission
reductions occur within the industrial premises, a fixed baseline can only be
considered for the expected remaining lifetime of the baseline devices as per
the CDM tool 10 – Tool to determine the remaining lifetime of equipment. This
baseline must be reassessed if emission reductions are claimed for the rest of
the considered crediting period.
In project activities targeting multiple distributed technologies e.g. improved
cookstoves and oven technologies, cross-effect between the baseline and
project scenarios including potential leakage must be accounted for. The
purpose and scope of each technology shall be defined in the PDD, the
3 Industrial applications are those having to do with the business of
manufacturing products and involving a sale and distribution chain (e.g.
food & beverage processing is considered an industrial application as long
as the food or beverage are not sold and consumed at the production site
as in the case for restaurants).

METHODOLOGY-SDG IQ Reduced emissions from cooking and heating
11
baseline scenario surveys should be carried out at the same time, and the
baseline scenario shall be defined such that baseline fuel use is divided
appropriately between the technologies.
a. For example, in case a Safe Drinking Water Supply (SWS) project were to
be implemented in a household where an improved cookstove (ICS) had
already been implemented, the baseline of the SWS project would have to
consider the efficiency of the ICS in its baseline determination.
b. For example, in case an ICS is implemented in a household where a SWS
project has already been implemented, then the SWS project should
update its baseline to take into account the change in cooking technology.
Project scenario
The project scenario is defined by the fuel consumption of end users within a
target population that adopt a project technology. Emission reductions are
credited by comparing fuel consumption in the project scenario to the
corresponding baseline scenario.
Selection and justification of the project scenarios
When different project technologies are included in a project activity, the
project developer must analyse whether multiple project scenarios should be
identified.
The project developer may identify multiple project scenarios given the
different types of project technologies included in a project activity. Also,
different project scenarios can be credited against the same baseline scenario
if it is deemed applicable. For example, the same baseline scenario for
inefficient wood stoves could be compared to separate project scenarios for
two different improved wood stove models in the project activity.
Project technologies with similar design and performance characteristics may
be included under a single project scenario. For example, different improved
cook stoves can be considered similar if they are based on the same
fundamental combustion technology and their respective thermal efficiencies
or specific consumptions do not differ by more than +/-5% in absolute terms
from that of the design to be implemented most frequently in the project
activity.
Project technologies with significantly different performance characteristics,
more than +/-5% in absolute terms, (e.g. fuel consumption characteristics in
the case of stoves) are treated as independent project scenarios and are
monitored and calculated separately.
Changes to the baseline and project scenarios
New baseline and project scenarios can be added to a project during the
crediting period, by following the Design Change Requirements. When a new
baseline or project scenario is created, the baseline and/or project studies,
respectively, must be conducted prior to verification and crediting with

METHODOLOGY-SDG IQ Reduced emissions from cooking and heating
12
respect to the new scenario. Emission reductions cannot be credited for a new
project scenario, or in relation to a new baseline scenario, until the respective
project studies or baseline studies have been conducted and the request for
design change has been approved.
When minor differences in the existing baseline and project scenarios (less
than +/-5% in absolute terms from the expectation) occur during the
crediting period, adjustment factors can be applied to account for minor
variability in fuel consumption or technology design parameter, without the
need to create a new baseline or project scenario. In this case, the project
developer shall refer to the discussion in section 3.12.
Suppressed demand baseline scenario
The methodology allows for a baseline scenario to take into account
suppressed demand. The large scale4 project or commercial and/or
institutional premises, applying this methodology is not allowed to claim
suppressed demand baseline. Refer to Annex 1 for suppressed demand
description.
For suppressed demand baseline scenario, the project developer shall provide
evidence5 that the project technology users, or a “cluster” of such users within
the project population, are deprived of a reasonable level of human
development or humanely acceptable benchmark in comparison to their
peers.
When the suppressed demand baseline is applied, the level of thermal energy
consumption in the baseline scenario will not correspond to the pre-project
situation but to a satisfied demand level, which will be equal to or lower than
the project level of satisfied demand. Annex 1 provides more guidance and
examples.
Projects applying a suppressed demand baseline shall, at the time of crediting
period renewal, apply any general rules or guidelines for suppressed demand
published under GS4GG at the time of registration and crediting period
renewal, as applicable.
Emission reductions calculation
The methods for calculating emission reductions vary depending on the
characteristics of the project activity. One of the following three methods
applies to most improved biomass cookstoves, ovens, water heaters, solar
4 For the purpose of this methodology, the project is considered large
scale activity when aggregate energy savings of the project activity
exceeds 60 GWh per year or 180 GWhthermal per year in fuel input.
5 In the form of project-specific field studies, project-relevant reports by
qualified entities, official government data, or credible published literature
for the project area.
METHODOLOGY-SDG IQ Reduced emissions from cooking and heating
13
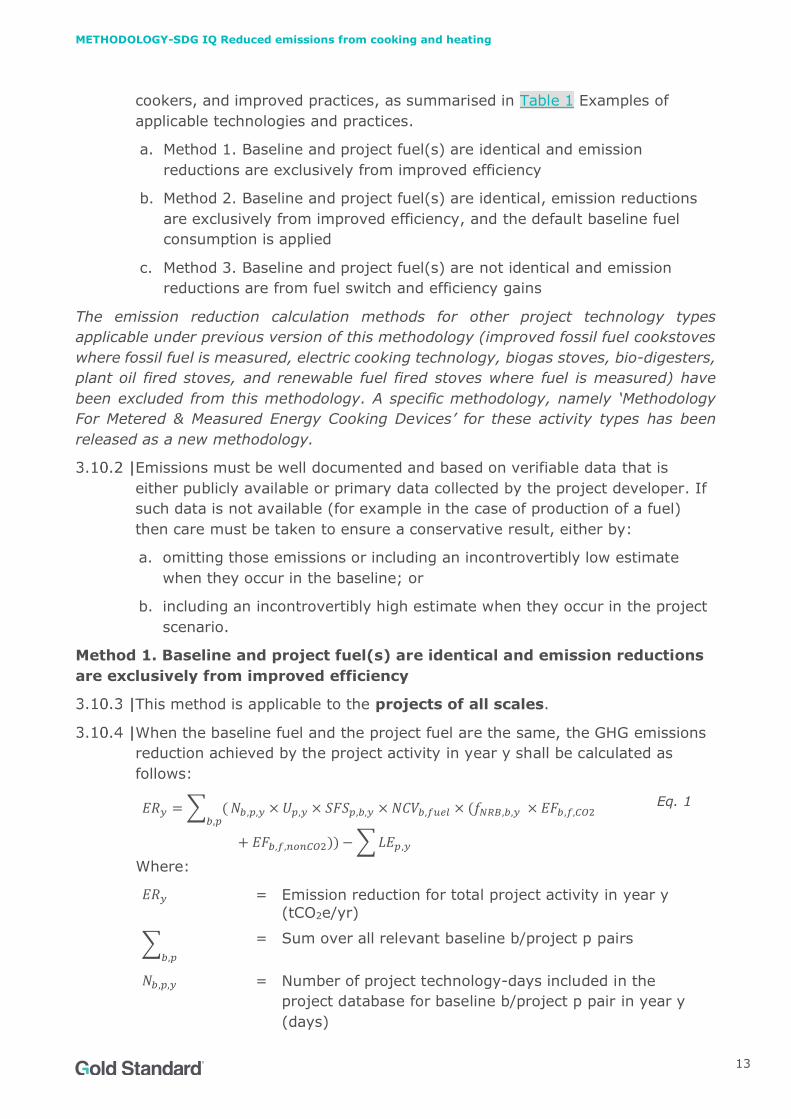
cookers, and improved practices, as summarised in Table 1 Examples of
applicable technologies and practices.
a. Method 1. Baseline and project fuel(s) are identical and emission
reductions are exclusively from improved efficiency
b. Method 2. Baseline and project fuel(s) are identical, emission reductions
are exclusively from improved efficiency, and the default baseline fuel
consumption is applied
c. Method 3. Baseline and project fuel(s) are not identical and emission
reductions are from fuel switch and efficiency gains
The emission reduction calculation methods for other project technology types
applicable under previous version of this methodology (improved fossil fuel cookstoves
where fossil fuel is measured, electric cooking technology, biogas stoves, bio-digesters,
plant oil fired stoves, and renewable fuel fired stoves where fuel is measured) have
been excluded from this methodology. A specific methodology, namely ‘Methodology
For Metered & Measured Energy Cooking Devices’ for these activity types has been
released as a new methodology.
Emissions must be well documented and based on verifiable data that is
either publicly available or primary data collected by the project developer. If
such data is not available (for example in the case of production of a fuel)
then care must be taken to ensure a conservative result, either by:
a. omitting those emissions or including an incontrovertibly low estimate
when they occur in the baseline; or
b. including an incontrovertibly high estimate when they occur in the project
scenario.
Method 1. Baseline and project fuel(s) are identical and emission reductions
are exclusively from improved efficiency
This method is applicable to the projects of all scales.
When the baseline fuel and the project fuel are the same, the GHG emissions
reduction achieved by the project activity in year y shall be calculated as
follows:
𝐸𝑅𝑦 = ∑ (𝑏,𝑝
𝑁𝑏,𝑝,𝑦 × 𝑈𝑝,𝑦 × 𝑆𝐹𝑆𝑝,𝑏,𝑦 × 𝑁𝐶𝑉𝑏,𝑓𝑢𝑒𝑙 × (𝑓𝑁𝑅𝐵,𝑏,𝑦 × 𝐸𝐹𝑏,𝑓,𝐶𝑂2
+ 𝐸𝐹𝑏,𝑓,𝑛𝑜𝑛𝐶𝑂2)) − ∑ 𝐿𝐸𝑝,𝑦
Eq. 1
Where:
𝐸𝑅𝑦 = Emission reduction for total project activity in year y
(tCO2e/yr)
∑𝑏,𝑝
= Sum over all relevant baseline b/project p pairs
𝑁𝑏,𝑝,𝑦 = Number of project technology-days included in the
project database for baseline b/project p pair in year y
(days)

METHODOLOGY-SDG IQ Reduced emissions from cooking and heating
14
𝑈𝑝,𝑦 = Cumulative Usage rate for technologies in project
scenario p in year y (fraction)
𝑆𝐹𝑆𝑝,𝑏,𝑦 = Specific fuel savings for an individual project
technology of baseline b/project p pair in year y (mass or volume units/technology*day) (Refer to Section 4.1
| below for further details)
𝑁𝐶𝑉𝑏,𝑓𝑢𝑒𝑙 = Net calorific value of the fuel(s) that is substituted or
reduced in baseline b (TJ/mass or volume units)
𝑓𝑁𝑅𝐵,𝑏,𝑦 = Fractional non-renewability status of woody biomass
fuel during year y (fraction). For biomass, it is the fraction of woody biomass that can be established as non-renewable. This parameter is omitted when f is a
fossil fuel.
𝐸𝐹𝑏,𝑓,𝐶𝑂2 = CO2 emission factor from use of fuel f (tCO2/TJ)
𝐸𝐹𝑏,𝑓,𝑛𝑜𝑛𝐶𝑂2 = Non-CO2 emission factor arising from use of fuel f,
when the baseline fuel f is biomass or charcoal
(tCO2e/TJ). This parameter is omitted when f is a fossil
fuel.
𝐿𝐸𝑝,𝑦 = Leakage for project scenario p in year y (tCO2e/yr)
Method 2. Baseline and project fuel(s) are identical, emission reductions are
exclusively from improved efficiency, and the default baseline fuel
consumption is applied
This method is only applicable to micro6 or small-scale projects7 where
the identical baseline and project fuel i.e., woody biomass is used by end
users.
The GHG emissions reduction achieved by the project activity in year y shall
be calculated as follows:
𝐸𝑅𝑦 = 𝑁𝑏,𝑝,𝑦 × 𝑈𝑝,𝑦 × (𝑆𝐹𝐶𝑏,𝑦 − 𝑆𝐹𝐶𝑝,𝑦) × ((𝑓𝑁𝑅𝐵,𝑦 × 𝐸𝐹𝑏,𝑓,𝐶𝑂2) +
𝐸𝐹𝑏,𝑓,𝑛𝑜𝑛𝐶𝑂2) × 𝑁𝐶𝑉𝑏,𝑓𝑢𝑒𝑙 − ∑ 𝐿𝐸𝑝,𝑦
Eq. 2
Where:
6 Project activities that generate less than or equal to 10,000 tCO2eq
emission reduction in each year of the crediting period.
7 Project activities that reduce energy consumption, on demand side, with
a maximum energy saving of 60 GWh per year (or an appropriate
equivalent) in any year of the crediting period. In the context of this
methodology, for project activities that improve thermal energy
efficiency, the maximum energy saving of 60 GWh(e) per year is
equivalent to 180 GWh(th) per year saving.
METHODOLOGY-SDG IQ Reduced emissions from cooking and heating
15
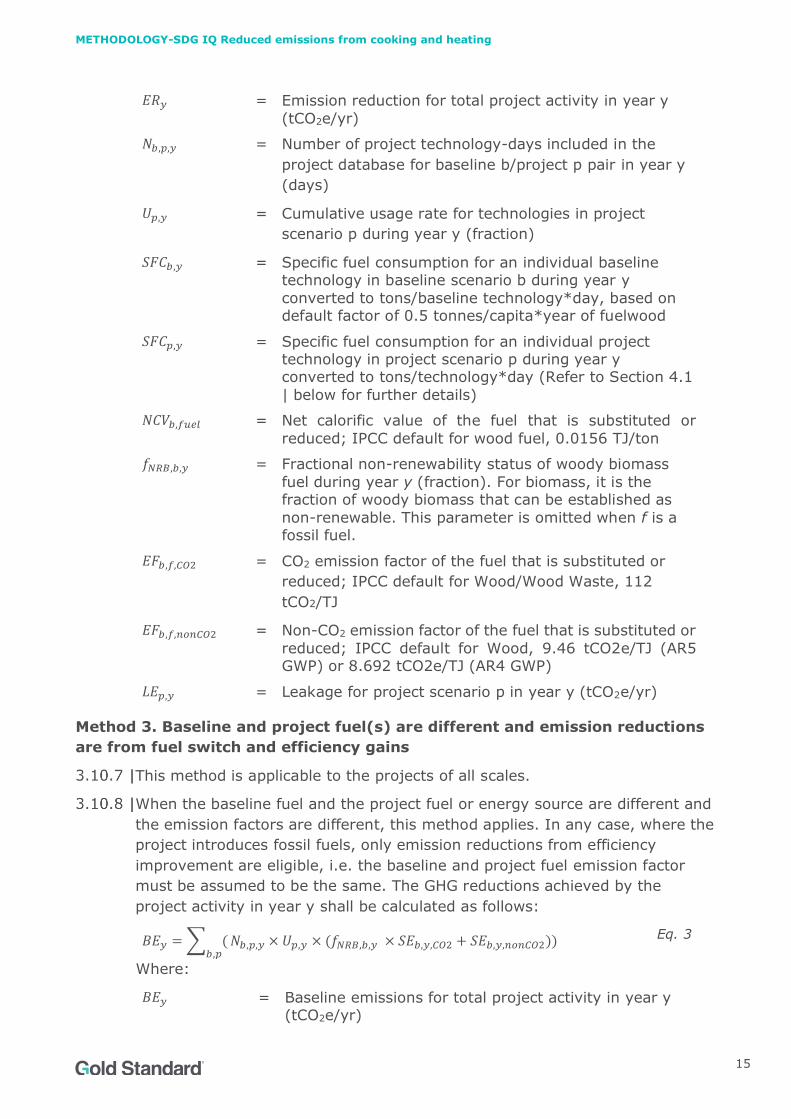
𝐸𝑅𝑦 = Emission reduction for total project activity in year y
(tCO2e/yr)
𝑁𝑏,𝑝,𝑦 = Number of project technology-days included in the
project database for baseline b/project p pair in year y
(days)
𝑈𝑝,𝑦 = Cumulative usage rate for technologies in project
scenario p during year y (fraction)
𝑆𝐹𝐶𝑏,𝑦 = Specific fuel consumption for an individual baseline technology in baseline scenario b during year y
converted to tons/baseline technology*day, based on default factor of 0.5 tonnes/capita*year of fuelwood
𝑆𝐹𝐶𝑝,𝑦 = Specific fuel consumption for an individual project technology in project scenario p during year y converted to tons/technology*day (Refer to Section 4.1
| below for further details)
𝑁𝐶𝑉𝑏,𝑓𝑢𝑒𝑙 = Net calorific value of the fuel that is substituted or
reduced; IPCC default for wood fuel, 0.0156 TJ/ton
𝑓𝑁𝑅𝐵,𝑏,𝑦 = Fractional non-renewability status of woody biomass
fuel during year y (fraction). For biomass, it is the fraction of woody biomass that can be established as
non-renewable. This parameter is omitted when f is a fossil fuel.
𝐸𝐹𝑏,𝑓,𝐶𝑂2 = CO2 emission factor of the fuel that is substituted or
reduced; IPCC default for Wood/Wood Waste, 112
tCO2/TJ
𝐸𝐹𝑏,𝑓,𝑛𝑜𝑛𝐶𝑂2 = Non-CO2 emission factor of the fuel that is substituted or
reduced; IPCC default for Wood, 9.46 tCO2e/TJ (AR5 GWP) or 8.692 tCO2e/TJ (AR4 GWP)
𝐿𝐸𝑝,𝑦 = Leakage for project scenario p in year y (tCO2e/yr)
Method 3. Baseline and project fuel(s) are different and emission reductions
are from fuel switch and efficiency gains
This method is applicable to the projects of all scales.
When the baseline fuel and the project fuel or energy source are different and
the emission factors are different, this method applies. In any case, where the
project introduces fossil fuels, only emission reductions from efficiency
improvement are eligible, i.e. the baseline and project fuel emission factor
must be assumed to be the same. The GHG reductions achieved by the
project activity in year y shall be calculated as follows:
𝐵𝐸𝑦 = ∑ (𝑏,𝑝
𝑁𝑏,𝑝,𝑦 × 𝑈𝑝,𝑦 × (𝑓𝑁𝑅𝐵,𝑏,𝑦 × 𝑆𝐸𝑏,𝑦,𝐶𝑂2 + 𝑆𝐸𝑏,𝑦,𝑛𝑜𝑛𝐶𝑂2)) Eq. 3
Where:
𝐵𝐸𝑦 = Baseline emissions for total project activity in year y (tCO2e/yr)

METHODOLOGY-SDG IQ Reduced emissions from cooking and heating
16
∑𝑏,𝑝
= Sum over all relevant baseline b/project p pairs
𝑁𝑏,𝑝,𝑦 = Number of project technology-days included in the
project database for baseline b/project p pair year y
(days)
𝑈𝑝,𝑦 = Cumulative usage rate for technologies in project
scenario p in year y (fraction)
𝑆𝐸𝑏,𝑦,𝐶𝑂2 = Specific CO2 emissions for a baseline b technology in
year y (tCO2/technology*day) (Refer to Section 4.1 | below for further details)
𝑆𝐸𝑏,𝑦,𝑛𝑜𝑛−𝐶𝑂2 = Specific non-CO2 emissions for a baseline b technology
in year y (tCO2e/technology*day) (Refer to Section 4.1 | below for further details)
𝑓𝑁𝑅𝐵,𝑏,𝑦 = Fraction of biomass used in year y for baseline scenario b that can be established as non-renewable biomass
(fraction). This term is included when the baseline practice was use of biomass, even if a fossil fuel
baseline emission factor must be applied due to the project activity introducing fossil fuel.
𝑃𝐸𝑦 = ∑ (𝑏,𝑝
𝑁𝑏,𝑝,𝑦 × 𝑈𝑝,𝑦 × (𝑓𝑁𝑅𝐵,𝑏,𝑦 × 𝑆𝐸𝑝,𝑦,𝐶𝑂2 + 𝑆𝐸𝑝,𝑦,𝑛𝑜𝑛𝐶𝑂2)) Eq. 4
Where:
𝑃𝐸𝑦 = Project emissions for total project activity in year y (tCO2e/yr)
𝑆𝐸𝑝,𝑦,𝐶𝑂2 = Specific CO2 emissions for a project p technology in year y (tCO2/technology*day) (Refer to Section 4.1 |
below for further details)
𝑆𝐸𝑝,𝑦,𝑛𝑜𝑛−𝐶𝑂2 = Specific non-CO2 emissions for a project p technology in year y (tCO2e/technology*day) (Refer to Section 4.1 |
below for further details)
𝑓𝑁𝑅𝐵,𝑏,𝑦 = Fraction of biomass used in year y for baseline scenario
b that can be established as non-renewable biomass (fraction). This term is excluded from the equation
when the project is using a fossil fuel.
𝐸𝑅𝑦 = 𝐵𝐸𝑦 − 𝑃𝐸𝑦 − ∑ 𝐿𝐸𝑝,𝑦𝑝
Eq. 5
Where:
𝐸𝑅𝑦 = Emission reduction for total project activity in year y (tCO2e/yr)
𝐿𝐸𝑝,𝑦 = Leakage for project scenario p in year y (tCO2e/yr)
METHODOLOGY-SDG IQ Reduced emissions from cooking and heating
17
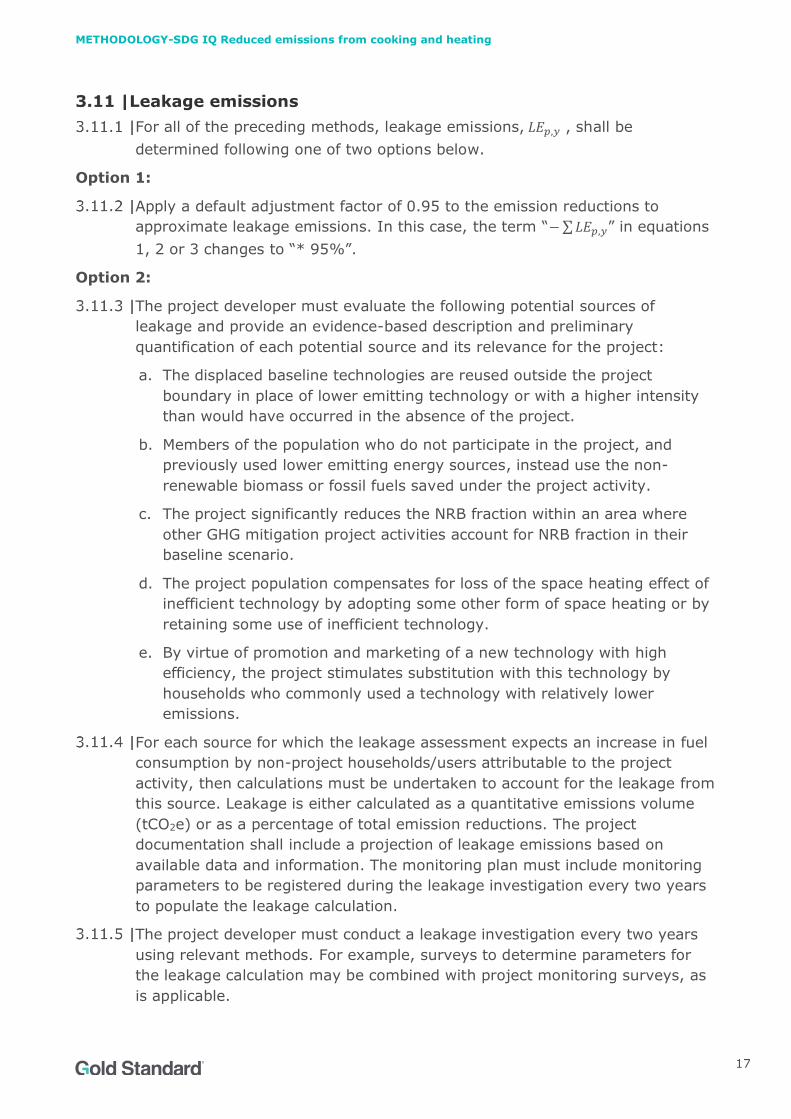
Leakage emissions
For all of the preceding methods, leakage emissions, 𝐿𝐸𝑝,𝑦 , shall be
determined following one of two options below.
Option 1:
Apply a default adjustment factor of 0.95 to the emission reductions to
approximate leakage emissions. In this case, the term “− ∑ 𝐿𝐸𝑝,𝑦” in equations
1, 2 or 3 changes to “* 95%”.
Option 2:
The project developer must evaluate the following potential sources of
leakage and provide an evidence-based description and preliminary
quantification of each potential source and its relevance for the project:
a. The displaced baseline technologies are reused outside the project
boundary in place of lower emitting technology or with a higher intensity
than would have occurred in the absence of the project.
b. Members of the population who do not participate in the project, and
previously used lower emitting energy sources, instead use the non-
renewable biomass or fossil fuels saved under the project activity.
c. The project significantly reduces the NRB fraction within an area where
other GHG mitigation project activities account for NRB fraction in their
baseline scenario.
d. The project population compensates for loss of the space heating effect of
inefficient technology by adopting some other form of space heating or by
retaining some use of inefficient technology.
e. By virtue of promotion and marketing of a new technology with high
efficiency, the project stimulates substitution with this technology by
households who commonly used a technology with relatively lower
emissions.
For each source for which the leakage assessment expects an increase in fuel
consumption by non-project households/users attributable to the project
activity, then calculations must be undertaken to account for the leakage from
this source. Leakage is either calculated as a quantitative emissions volume
(tCO2e) or as a percentage of total emission reductions. The project
documentation shall include a projection of leakage emissions based on
available data and information. The monitoring plan must include monitoring
parameters to be registered during the leakage investigation every two years
to populate the leakage calculation.
The project developer must conduct a leakage investigation every two years
using relevant methods. For example, surveys to determine parameters for
the leakage calculation may be combined with project monitoring surveys, as
is applicable.

METHODOLOGY-SDG IQ Reduced emissions from cooking and heating
18
When appropriate, the potential sources of leakage should be assessed in the
context of suppressed demand and satisfied level of service. If suppressed
demand conditions as defined in Annex 1 are demonstrated to apply, the
evaluation may consider whether the leakage may not exist or may be
diminished.
Leakage risks that are deemed very low can be ignored as long as the case
for their insignificance is substantiated.
Adjustment factors
In case, during the crediting period, it is observed that baseline and/or project
scenarios vary slightly, affecting fuel savings, due to differences in project
technology type, size, usage pattern, and other pertinent variables,
adjustment factors may be applied to allow for realistic comparisons of project
technologies to the baseline scenarios. Adjustment factors fine tune the
baseline and/or project scenarios without requiring project developers to
independently monitor new baseline and project scenarios.
In such a case, project developers shall develop appropriate adjustment
factors through quantitative assessment and analysis of baseline and project
monitoring studies, as well as through additional targeted lab and field
monitoring.
Representative sampling with appropriate weighting must be conducted in
pertinent monitoring studies to ensure adjustments within scenarios and
across scenarios are realistic.
Adjustment factors cannot be used to estimate the consumption of one type
of fuel based on the observed consumption for a different fuel.
Indicative examples of when and how to apply adjustment factors:
a. A project developer may have conducted a PFT for an improved charcoal
stove with a 500 cm3 fuel chamber. Fuel consumption in the baseline and
project scenario could be adjusted to credit similar improved charcoal
stove models of different sizes based on a ratio of the difference in fuel
chamber volumes, as long as clear correlations between stove size and
standard adult-meals are identified and demonstrated.
b. Monitoring two sizes of the same stove model could show that the larger
stove cooks food for more people, but is not more efficient per person-
meal. In this case a size adjustment factor for person-meals cooked would
be appropriate but an efficiency adjustment factor would not be
appropriate.
Changes required for methodology implementation in 2nd and 3rd
crediting periods
When the project developers apply for crediting period renewal, the baseline
fuel consumption must be reassessed, in addition to other relevant
methodological parameters as per the latest version of the methodology

METHODOLOGY-SDG IQ Reduced emissions from cooking and heating
19
available at the time submission of renewal of crediting period and GS4GG
crediting period renewal requirements.
Data and parameters not monitored
Data/parameter ID ICS 1
Data / Parameter: Baseline scenario survey results
Data unit: NA
Description: Report of the results of the baseline scenario survey
Source of data: The report presents the results of the Baseline Scenario
Survey, described in section 3.4 | above, relevant for the
baseline scenario definition.
Any comment: Undertake at the start of the first crediting period, or
more frequently if the project activity targets industrial
applications (see 3.4, Baseline Scenario).
Data/parameter ID ICS 2
Data / Parameter: Project technology description
Data unit: NA
Description:
The detailed description of the project technology shall
include as a minimum:
- Manufacturer name,
- product name (if applicable),
- technology type,
- capacity characteristics,
- continuous useful energy output demonstration,
- rated thermal efficiency, for the following cases:
- improved biomass cookstoves, fuel-based
ovens, water heaters, improved fossil fuel
cookstoves (solid fuel or existing liquid &
gaseous fuel projects), and renewable fuel fired
stoves.
- Any performance certifications from National
Standards body or certification body recognised by
national standards body also shall be provided.
Source of data: Any of the following sources shall be used:
- Manufacturer specifications
- Certifications by national standards body or an
appropriate certification party recognised by national
standards body
- Commercial guarantee
- Technical reports from the installer

METHODOLOGY-SDG IQ Reduced emissions from cooking and heating
20
- For stoves built on-site at the end user location,
reports of Standard WBT by stove manufacturer or
installer
Professional opinion or expert opinion is not accepted as a
source for this parameter.
Any comment: For any information not available at the time of
validation, validating VVB shall include a FAR.
Project developer shall provide this information to
verifying VVB before completion of verification report.
No issuance shall be requested for project technologies
for which the project technology details are not verified
by the verifying VVB prior to completion of verification
report.
Data/parameter ID ICS 3
Data / Parameter: Expected technical life of project technology
Data unit: Operating hours (e.g. “5,500 hours”) or time period (e.g.
“five years”)
Description: The expected technical life of an individual project
technology shall be defined in the PDD.
Source of data: Fixed and recorded at the time of registration or
distribution
Any of the following sources shall be used:
- Manufacturer specifications
- Certification by national standards body or an
appropriate certification party recognised by national
standards body
- Commercial guarantee or Guarantee from the
installer
- For stoves built on-site at the end user location, field
reports, which comply with the general requirements
for sampling (Section 4.4), of average technical life
of the same stove type operated under similar
conditions (socioeconomic and cultural). Simulation
modelling may be applied together with such field
reports to estimate the average technical life.
Professional opinion or expert opinion is not accepted as a source for this parameter.
Any comment: If the expected technical life of project technology is
shorter than the crediting period, describe measures to

METHODOLOGY-SDG IQ Reduced emissions from cooking and heating
21
ensure that end users are provided replacement
technology of comparable or higher quality at the end of
the technical life, by either
- replacing with comparable or better technology, or
- retrofitting essential parts with performance
guarantee.
The project shall ensure that the units are replaced or
retrofitted at the end of their technical life within a
crediting period to continue claiming emission reductions.
However, a new project or programme cannot be
registered for replacement/retrofitted project devices.
If project devices are retrofitted/repaired before or at the
end of the device’s estimated technical life, emission
reductions may be claimed for these devices during the
extended lifetime only if the details of the retrofits/repairs
undertaken (e.g. parts replaced, specifications followed,
personnel conducting the repairs and date of retrofitting)
on each device are documented and in addition, one of the
following options is implemented:
a. Extended lifetime is demonstrated through a
warranty from the original manufacturer, or a
guarantee from a company with demonstrated
experience in cookstove repair that assures the
performance of the stove in its entirety comparable
to the original device including with regard to
efficiency, safety and indoor emissions; or
b. Extended lifetime or the durability of the retrofitted
device is demonstrated through a durability test
performed according to requirements in ISO
19867-1 for durability or a comparable national
standard. Certification by a relevant national
standards body or an appropriate certifying agent
recognized by that body may be supplied based on
sample tests specified by the standard applied.
Data/parameter ID ICS 4
Data / Parameter: Indoor air pollution (IAP) levels of the project technology
Data unit: NA
Description: For projects where cooking will move from outdoor to
indoor or where the project technology reduces ventilation
(for example, changing from a stove with chimney to

METHODOLOGY-SDG IQ Reduced emissions from cooking and heating
22
improved stove with no chimney), demonstration that
Indoor air pollution (IAP) levels are not worsened in the
project scenario compared to the baseline, including PM
2.5 and carbon monoxide (CO) emissions.
Source of data: For the description of IAP level of the project technology,
any of the following sources shall be used:
- certification resulting from of a manufacturer’s test,
- report of field testing of the technology,
- report of lab testing of the technology, or
- results of modelling of the technology’s operation
under field conditions.
- For stoves built on-site at the end user location,
existing reports of lab or field testing of similar
technology.
For the IAP level of the baseline scenario, the following
sources shall be used:
- certification resulting from of a manufacturer’s test,
- report of field testing of the technology,
- report of lab testing of the technology,
- results of modelling of the technology’s operation
under field conditions, or
- Expert opinion
For both project and baseline technologies, if none of
these are available, reference from published literature or
report by independent agencies may be used as evidence,
provided it is not more than 5 years old.
Any comment: Any information not available at validation shall be
included as a FAR and provided before completion of
verification report.
Only for project types where this evidence is required, no
issuance shall be requested for project technologies for
which IAP levels have not been verified by the verifying
VVB prior to completion of verification report.
Data/parameter ID ICS 5
Data / Parameter: Avoidance of double counting or double claiming among
project participants
Data unit: NA
Description: Evidence of avoidance of double counting or double
claiming with other parties directly involved with the

METHODOLOGY-SDG IQ Reduced emissions from cooking and heating
23
project or programme.
Source of data: Written assertions with the project developer of the
ownership rights and intention of selling the emission
reductions resulting from the project activity directed at
or signed with all the applicable parties of the following:
- all other project participants;
- project technology producers; and
- retailers of the project technology or the renewable fuel.
Any comment: Any written assertions not available at validation shall be
included as a FAR and be provided and verified at the time
of first verification.
Data/parameter ID ICS 6
Data / Parameter: Avoidance of double counting or double claiming with
other mitigation actions
Data unit: NA
Description: Review and analysis of mitigation actions in other
voluntary market or UNFCCC/compliance mechanisms
Source of data: Using publicly available information from Gold Standard
and other voluntary standards, at a minimum Verra and
any recognized national or regional standards in the
project location, and UNFCCC CDM project & PoA
database:
- identify and list any mitigation actions of similar
technology, i.e. that provide the same kind of output
and use the same kind of equipment or conversion
process, operating in overlapping spatial boundaries.
If one or more are identified: - describe the practices that will be implemented to
ensure that the programme or project activity
quantifies emission reductions only from technology
it has implemented,
- describe the practices to avoid that the programme
or project activity implementation displaces
technology of other mitigation actions, and
- design a method to discount emission reductions in
case the programme or project activity is found to
displace or operate alongside another mitigation
action.
Any comment: Undertake at the time of project design review and VPA
inclusion review.

METHODOLOGY-SDG IQ Reduced emissions from cooking and heating
24
VVB shall validate the information reported by the project
and report findings and opinion specifically on this point in
the validation or verification report.
Data/parameter ID ICS 7
Data / Parameter: Regulatory framework for provision of thermal energy
services
Data unit: NA
Description:
Evidence that the project does not undermine or conflict
with any national, sub-national or local regulations or
guidance for thermal energy supply/devices or fuel supply
or use
Source of data: List and provide a summary of any national, sub-national
and local regulations or guidance for provision of thermal
energy services/devices of the type the project provides
in the project boundary, including any tariff requirements.
Describe how the project complies with the regulatory
framework.
Any comment: Undertake at the start of each crediting period.
Data/parameter ID ICS 8
Data / Parameter: 𝐸𝐹𝑏,𝑓,𝐶𝑂2
Data unit: tCO2/TJ
Description: CO2 emission factor arising from use of fuels in baseline
scenario
Source of data: Wood: Methodology default, 112 tCO2/TJ
Charcoal:
Methodology default, 112 tCO2/TJ (combustion only)
Methodology default, 165.22 tCO2/TJ (includes charcoal
production emissions)
Methodology cap, 197.15 tCO2/TJ (includes charcoal
production emissions)
Other fuels: IPCC defaults
When emissions from fuel production, transport, and
similar are included to determine a project-specific
emission factor, then the following shall apply as well:
- The project boundary must include these processes

METHODOLOGY-SDG IQ Reduced emissions from cooking and heating
25
- Avoidance of double counting considerations (see
two parameter tables) must cover all steps in the
project boundary
- The determination of the specific emissions from
these sources is fully documented and evidenced in
the PDD
These provisions may be applied to include the actual
GHG emissions happening upstream in charcoal
production in the charcoal emission factor; however,
emission factors higher than the methodology cap are not
permitted.
Any comment: Charcoal should apply the emission factor for charcoal
fuel.
For Method 3, this parameter is used to calculate 𝑆𝐸𝑏,𝑦,𝐶𝑂2
Data/parameter ID ICS 9
Data / Parameter: 𝐸𝐹𝑏,𝑓,𝑛𝑜𝑛𝐶𝑂2
Data unit: tCO2/TJ
Description: Non-CO2 emission factor arising from use of fuels in
baseline scenario
Source of data: Wood: Methodology default:
- 9.46 tCO2e/TJ (AR5 GWP) or
- 8.692 tCO2e/TJ (AR4 GWP)
Charcoal: Methodology defaults:
- 5.865 tCO2e/TJ (AR5 GWP) (combustion only)
- 44.83 tCO2e/TJ (AR5 GWP) (includes charcoal
production emissions),
- Methodology cap: 92.29 tCO2e/TJ (AR5 GWP)
(includes charcoal production emissions)
- or
- 5.298 tCO2e/TJ (AR4 GWP) (combustion only)
- 40.26 tCO2e/TJ (AR4 GWP) (includes charcoal
production emissions)
- Methodology cap: 82.90 tCO2e/TJ (AR4 GWP)
(includes charcoal production emissions)
Other fuels:
Any of the following, in order of preference:
- IPCC defaults
- project-specific field tests prior to first verification
by a qualified entity that is certified or accredited by
National Standards body
METHODOLOGY-SDG IQ Reduced emissions from cooking and heating
26
- project-relevant measurement reports by qualified
entities
- national defaults
- credible published literature for the project area
If either project-specific or project-relevant results are
used, these must be cross-checked with IPCC defaults
and differences shall be justified using evidence.
When emissions from fuel production, transport, and
similar are included to determine a project-specific
emission factor, then the following shall apply as well:
- The project boundary must include these processes
- Avoidance of double counting considerations (see
two parameter tables) must cover all steps in the
project boundary
- The determination of the specific emissions from
these sources is fully documented and evidenced in
the PDD
These provisions may be applied to include the actual
GHG emissions happening upstream in charcoal
production in the charcoal emission factor; however,
emission factors higher than the methodology cap are not
permitted.
Any comment: In Method 3, this parameter is used to calculate
𝑆𝐸𝑏,𝑦,𝑛𝑜𝑛−𝐶𝑂2
If the emission factor is expressed in tonnes of CH4 or
N2O, it shall be converted to tCO2e using the applicable
GWP and this shall be documented in the PDD.
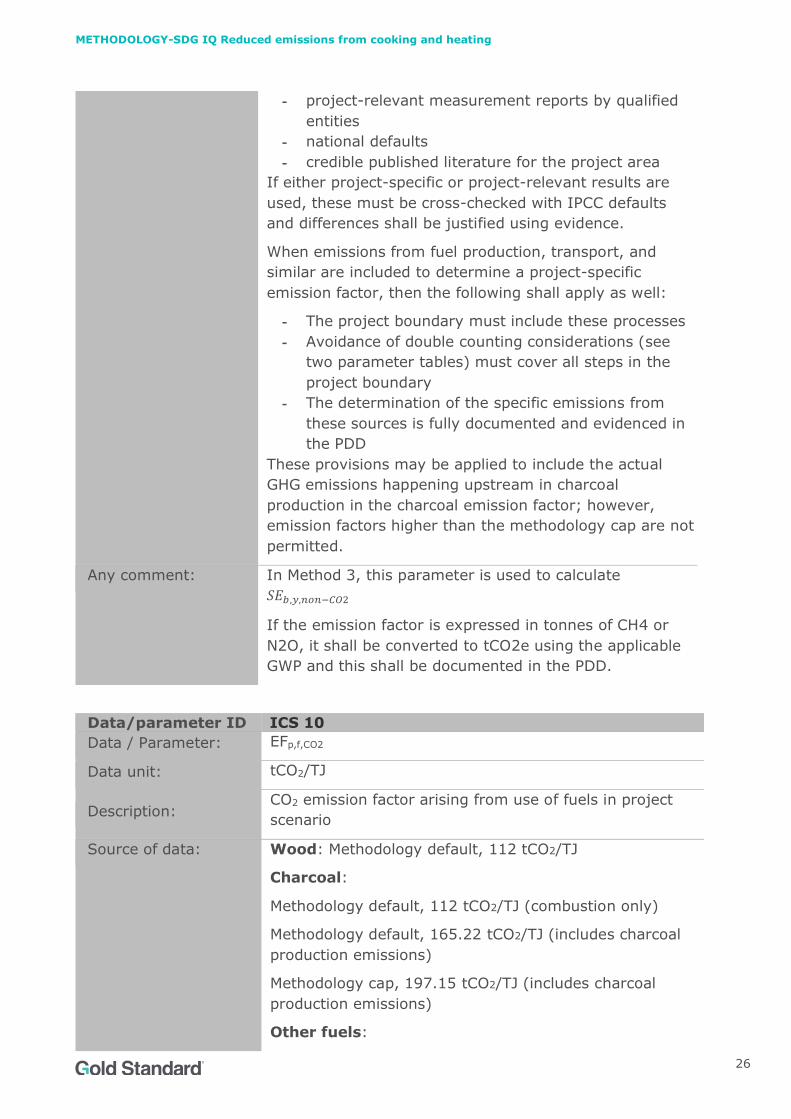
Data/parameter ID ICS 10
Data / Parameter: EFp,f,CO2
Data unit: tCO2/TJ
Description: CO2 emission factor arising from use of fuels in project
scenario
Source of data: Wood: Methodology default, 112 tCO2/TJ
Charcoal:
Methodology default, 112 tCO2/TJ (combustion only)
Methodology default, 165.22 tCO2/TJ (includes charcoal
production emissions)
Methodology cap, 197.15 tCO2/TJ (includes charcoal
production emissions)
Other fuels:

METHODOLOGY-SDG IQ Reduced emissions from cooking and heating
27
- IPCC defaults
When emissions from fuel production, transport, and
similar are included to determine a project-specific
emission factor, then the following shall apply as well:
- The project boundary must include these processes
- Avoidance of double counting considerations (see
two parameter tables) must cover all steps in the
project boundary
- The determination of the specific emissions from
these sources shall be fully documented and
evidenced in the PDD
These provisions may be applied to include the actual
GHG emissions happening upstream in charcoal
production in the charcoal emission factor; however,
emission factors higher than the methodology cap are not
permitted. If emissions of this nature are included in the
baseline emission factor, then they shall also be included
in the project emission factor.
Any comment: In Method 3, this parameter is used to calculate 𝑆𝐸𝑝,𝑦,𝐶𝑂2
This has same value as 𝐸𝐹𝑏,𝑓,𝐶𝑂2 in projects which reduce
use of the same fuel.
Data/parameter ID ICS 11
Data / Parameter: EFp,f,nonCO2
Data unit: tCO2/TJ
Description: Non-CO2 emission factor arising from use of fuels in
project scenario
Source of data: Wood: Methodology default:
- 9.46 tCO2e/TJ (AR5 GWP) or - 8.692 tCO2e/TJ (AR4 GWP)
Charcoal: Methodology defaults:
- 5.865 tCO2e/TJ (AR5 GWP) (combustion only)
- 44.83 tCO2e/TJ (AR5 GWP) (includes charcoal
production emissions),
- Methodology cap: 92.29 tCO2e/TJ (AR5 GWP)
(includes charcoal production emissions)
- or
- 5.298 tCO2e/TJ (AR4 GWP) (combustion only)
- 40.26 tCO2e/TJ (AR4 GWP) (includes charcoal
production emissions)
- Methodology cap: 82.90 tCO2e/TJ (AR4 GWP)
(includes charcoal production emissions)

METHODOLOGY-SDG IQ Reduced emissions from cooking and heating
28
Other fuels: Any of the following, in order of preference:
- IPCC defaults,
- project-specific field tests prior to first verification by
a qualified entity that is certified or accredited by
National Standard body
- project-relevant measurement reports by qualified
entities,
- national defaults
- credible published literature for the project area,
If either project-specific or project-relevant results are
used, these must be cross-checked with IPCC defaults
and differences shall be justified using evidence.
When emissions from fuel production, transport, and
similar are included to determine a project-specific
emission factor, then the following shall apply as well:
- The project boundary must include these processes
- Avoidance of double counting considerations (see
two parameter tables) must cover all steps in the
project boundary
- The determination of the specific emissions from
these sources is fully documented and evidenced in
the PDD
- The determination of the specific emissions from
these sources shall be fully documented and evidenced in the PDD.
These provisions may be applied to include the actual
GHG emissions happening upstream in charcoal
production in the charcoal emission factor; however,
emission factors higher than the methodology cap are not
permitted. If emissions of this nature are included in the
baseline emission factor, then they shall also be included
in the project emission factor.
Any comment: In Method 3, this parameter is used to calculate
𝑆𝐸𝑝,𝑦,𝑛𝑜𝑛−𝐶𝑂2
-
Data/parameter ID ICS 12
Data / Parameter: 𝑁𝐶𝑉𝑏,𝑓𝑢𝑒𝑙
Data unit: TJ/ton
Description: Net calorific value of the fuels used in the baseline
Source of data: Wood: Methodology default, 0.0156 TJ/ton
Charcoal: Methodology default, 0.0295 TJ/ton

METHODOLOGY-SDG IQ Reduced emissions from cooking and heating
29
Other fuels:
- IPCC defaults
- project-specific testing by a qualified entity that is
certified or accredited
- project-relevant measurement reports by a qualified
entity
If either project-specific or project-relevant results are
used, these must be cross-checked with IPCC defaults
and differences shall be justified using evidence.
Any comment: The methodology default emission factor must be applied
when the methodology default NCV is applied.
In Method 3, this parameter is used to calculate 𝑆𝐸𝑏,𝑦,𝐶𝑂2
and 𝑆𝐸𝑏,𝑦,𝑛𝑜𝑛−𝐶𝑂2
Data/parameter ID ICS 13
Data / Parameter: 𝑁𝐶𝑉𝑝,𝑓𝑢𝑒𝑙
Data unit: TJ/ton
Description: Net calorific value of the fuels used in the project
Source of data: Wood: Methodology default, 0.0156 TJ/ton
Charcoal: Methodology default, 0.0295 TJ/ton
Other fuels:
- IPCC defaults
- project-specific testing by a qualified entity that is
certified or accredited
- project-relevant measurement reports by a qualified
entity
If either project-specific or project-relevant results are
used, these must be cross-checked with IPCC defaults
and differences shall be justified using evidence.
Any comment: The methodology default emission factor must be applied
when the methodology default NCV is applied.
In Method 3, this parameter is used to calculate 𝑆𝐸𝑝,𝑦,𝐶𝑂2
and 𝑆𝐸𝑝,𝑦,𝑛𝑜𝑛−𝐶𝑂2
Data/parameter ID ICS 14
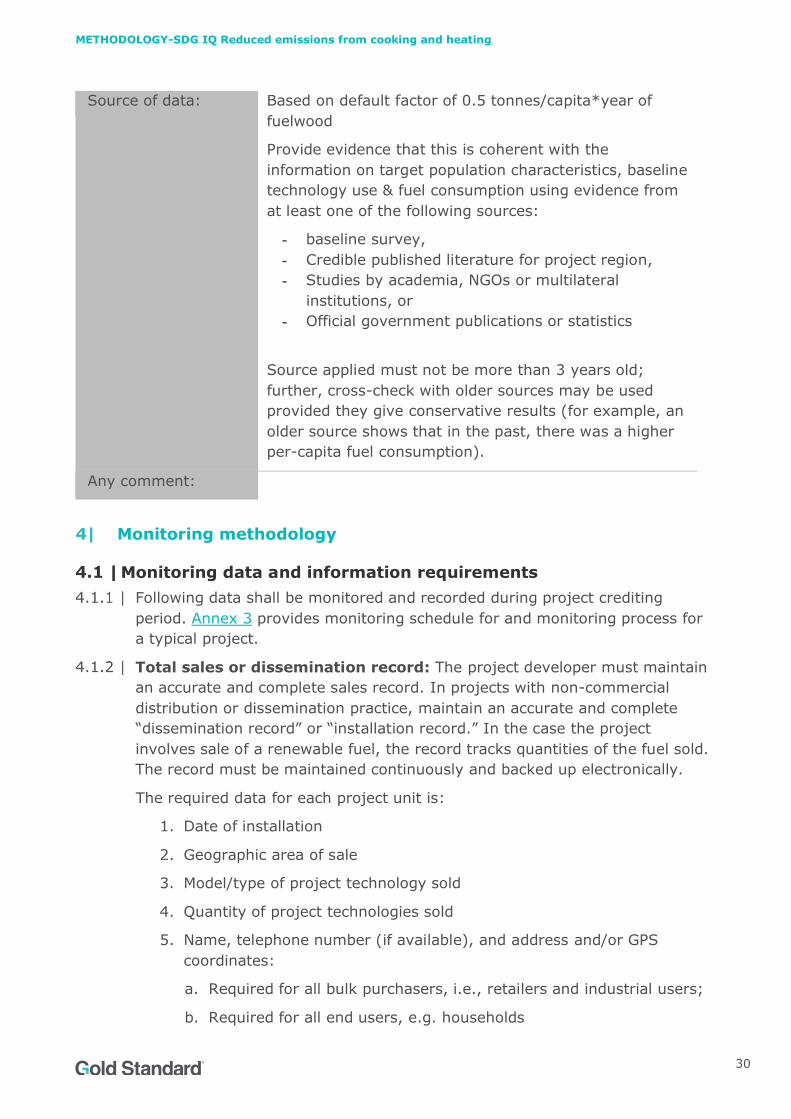
Data / Parameter: 𝑆𝐹𝐶𝑏,𝑦
Data unit: Tons/baseline technology*day
Description: Specific fuel consumption for an individual baseline
technology in baseline scenario b during year y
METHODOLOGY-SDG IQ Reduced emissions from cooking and heating
30
Source of data: Based on default factor of 0.5 tonnes/capita*year of
fuelwood
Provide evidence that this is coherent with the
information on target population characteristics, baseline
technology use & fuel consumption using evidence from
at least one of the following sources:
- baseline survey,
- Credible published literature for project region,
- Studies by academia, NGOs or multilateral
institutions, or
- Official government publications or statistics
Source applied must not be more than 3 years old;
further, cross-check with older sources may be used
provided they give conservative results (for example, an
older source shows that in the past, there was a higher
per-capita fuel consumption).
Any comment:
4| Monitoring methodology
Monitoring data and information requirements
Following data shall be monitored and recorded during project crediting
period. Annex 3 provides monitoring schedule for and monitoring process for
a typical project.
Total sales or dissemination record: The project developer must maintain
an accurate and complete sales record. In projects with non-commercial
distribution or dissemination practice, maintain an accurate and complete
“dissemination record” or “installation record.” In the case the project
involves sale of a renewable fuel, the record tracks quantities of the fuel sold.
The record must be maintained continuously and backed up electronically.
The required data for each project unit is:
1. Date of installation
2. Geographic area of sale
3. Model/type of project technology sold
4. Quantity of project technologies sold
5. Name, telephone number (if available), and address and/or GPS
coordinates:
a. Required for all bulk purchasers, i.e., retailers and industrial users;
b. Required for all end users, e.g. households

METHODOLOGY-SDG IQ Reduced emissions from cooking and heating
31
6. Mode of use: domestic, institutional commercial, other.
Project Database: The project database lists all the project technology units
that have been sold or distributed by the project and have not surpassed their
technical life. It is derived from the total sales record (or dissemination record
in case of non-commercial distribution) and must be maintained continuously.
Within the database, project technologies units are labelled, at a minimum,
with their corresponding project scenario p and their date of
sale/dissemination.
Technologies aged beyond their technical life, and not replaced or retrofitted,
are removed from the project database and no longer credited.
Project Surveys: The project surveys include the usage survey (Up,y), Usage
Survey- use of other stoves (ICS 16), and the baseline and project
performance field tests (BFT and PFT). The general requirements for these are
described here.
The project surveys have the same sample sizing and data collection
guidelines as the baseline scenario survey. Refer to section 4.3.
The project surveys are only conducted with end users representative of the
project scenario and currently using the project technology (except for the
case of a renewal of the crediting period which requires a re-assessment of
the baseline fuel consumption).
Usage Survey (𝑈𝑝,𝑦): The objective of the usage survey is to provide a single
usage parameter that is weighted based on the age distribution for project
technologies in the Project Database, 𝑈𝑝,𝑦. This usage parameter must be
established to account for drop off rates as project technologies age and are
replaced, or for reduced use by end users for other motives. The usage
parameter may be monitored using remote monitoring with the application of
Continuous Stove Monitors (CSMs). For more details, please refer to the
Requirements and Guidelines: Usage Rate Monitoring.
The usage survey determines the usage proportion for each age cohort of
technologies being credited for each project scenario p. The age cohorts in the
survey are established as follows:
- Participants in a usage survey with technologies in the first year of use
(age0-1) must have technologies that have been in use on average at
least 0.5 years or longer.
- Participants in a usage survey with technologies in the second year of
use (age1-2) must be conducted with technologies that have been in use
on average at least 1.5 years, and so on.
Since the parameter of interest is the usage proportion for each age cohort,
the sample size is defined for each age cohort following the general
requirements for sampling (Section 4.4) with a minimum of 30 samples for
project technologies of each age cohort being credited, except where the age

METHODOLOGY-SDG IQ Reduced emissions from cooking and heating
32
cohort comprises fewer than 30 units, in which case all units shall be
sampled.
The usage survey must be conducted in line with the requirements and
guidelines of Requirements and Guidelines: Usage Rate Monitoring for further
details and example. VVB shall refer to the checklist for assessment of
reported data provided in Requirements and Guidelines: Usage Rate
Monitoring.
Usage Survey- use of other stoves (ICS 16): As part of the usage survey,
the project developer must also collect data on the presence and usage
practices of baseline and other non-project technology by project technology
end users and prepare descriptive statistics of these practices. The same
method of in person interviews and expert observation within the kitchen in
question is suitable to collect these data. Where the usage survey indicates
usage of other non-project technology, this must be addressed in line with the
requirements for parameter ICS 20.
Field Tests: The baseline and project performance field tests (BFT and PFT)
measure real, observed technology performance in the field.
- When method 1 or 3 is applied, a field test is carried out both for
baseline and project scenarios, either by testing a paired sample
(baseline and project performance measured for same subjects) or by
testing an independent sample (different subjects for baseline and
project scenarios).
- When method 2 is applied, a PFT is required without any comparative
BFT since a default value is used for baseline fuel consumption.
The approach taken to conduct the performance tests must be such that:
- it is transparent and can easily be replicated,
- it is evidently conservative,
- the sample is randomly selected so as to not introduce a material bias,
- and the impact of daily and seasonal variations on the expected
average fuel consumption savings is accounted for.
The project developer must design the field test to ensure monitoring is
representative of technology and fuel use practices. It must be made explicit
to the households/institutions that they must behave and consume fuel
normally, using the technologies they normally use.
- For example, in the case of improved cook stove activities, participants
must be asked to cook typical meals during the study period, include
secondary stoves and fuels, exclude large parties or infrequent cooking
events, and match cooking tasks in the BFT and the PFT. Participants
should never be influenced to use a specific stove or fuel during the
study, nor deviate from typical stove and fuel practices.
The detailed instructions and requirements for BFT and PFT are found in
Annex 2, Kitchen Performance Test.
METHODOLOGY-SDG IQ Reduced emissions from cooking and heating
33
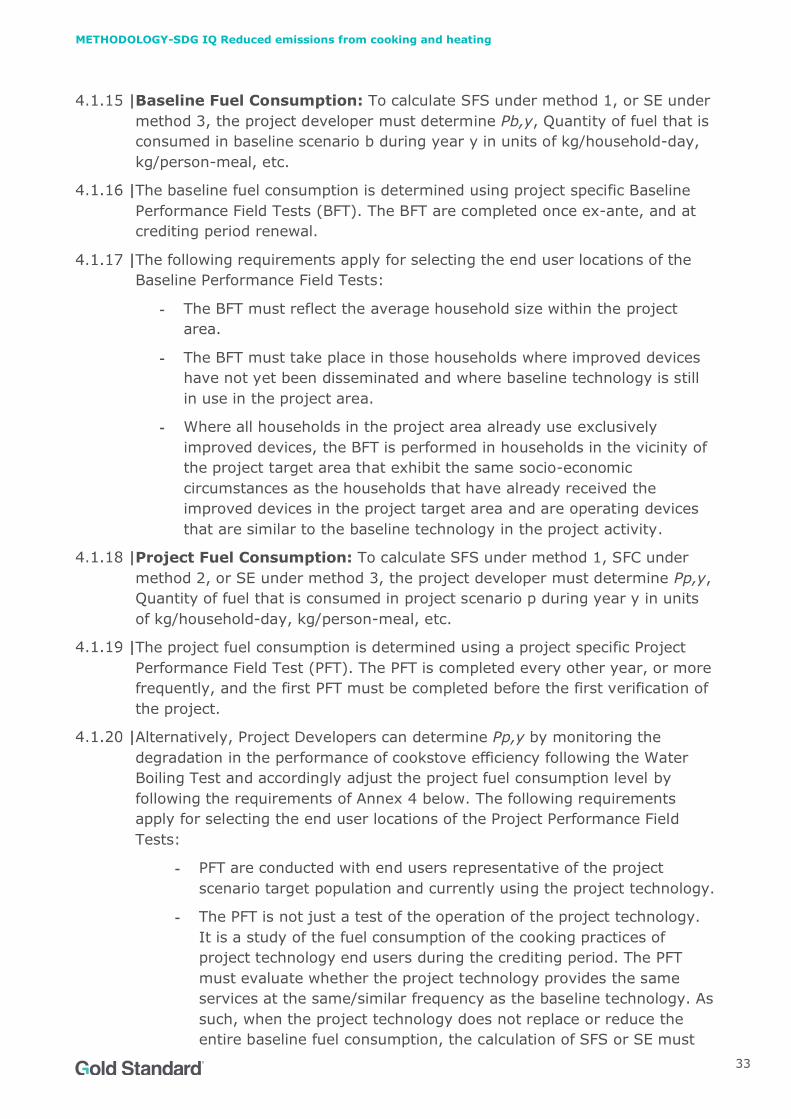
Baseline Fuel Consumption: To calculate SFS under method 1, or SE under
method 3, the project developer must determine Pb,y, Quantity of fuel that is
consumed in baseline scenario b during year y in units of kg/household-day,
kg/person-meal, etc.
The baseline fuel consumption is determined using project specific Baseline
Performance Field Tests (BFT). The BFT are completed once ex-ante, and at
crediting period renewal.
The following requirements apply for selecting the end user locations of the
Baseline Performance Field Tests:
- The BFT must reflect the average household size within the project
area.
- The BFT must take place in those households where improved devices
have not yet been disseminated and where baseline technology is still
in use in the project area.
- Where all households in the project area already use exclusively
improved devices, the BFT is performed in households in the vicinity of
the project target area that exhibit the same socio-economic
circumstances as the households that have already received the
improved devices in the project target area and are operating devices
that are similar to the baseline technology in the project activity.
Project Fuel Consumption: To calculate SFS under method 1, SFC under
method 2, or SE under method 3, the project developer must determine Pp,y,
Quantity of fuel that is consumed in project scenario p during year y in units
of kg/household-day, kg/person-meal, etc.
The project fuel consumption is determined using a project specific Project
Performance Field Test (PFT). The PFT is completed every other year, or more
frequently, and the first PFT must be completed before the first verification of
the project.
Alternatively, Project Developers can determine Pp,y by monitoring the
degradation in the performance of cookstove efficiency following the Water
Boiling Test and accordingly adjust the project fuel consumption level by
following the requirements of Annex 4 below. The following requirements
apply for selecting the end user locations of the Project Performance Field
Tests:
- PFT are conducted with end users representative of the project
scenario target population and currently using the project technology.
- The PFT is not just a test of the operation of the project technology.
It is a study of the fuel consumption of the cooking practices of
project technology end users during the crediting period. The PFT
must evaluate whether the project technology provides the same
services at the same/similar frequency as the baseline technology. As
such, when the project technology does not replace or reduce the
entire baseline fuel consumption, the calculation of SFS or SE must

METHODOLOGY-SDG IQ Reduced emissions from cooking and heating
34
adjust the baseline fuel consumption downward based on the cooking
services replaced by the project stove.
- As well, where the baseline technology or other non-project
technologies operate as backups or complementary units in parallel
with project technologies (“stove stacking”), the project fuel
consumption implications must be accounted for in the PFT.
- PFTs are required in the project situation even in cases where a ‘zero
emission’ project technology is introduced, so as to capture the
potential use of the baseline technology as backup or auxiliary units;
the potential introduction of an emitting backup or auxiliary project
technology introduced in parallel with the project technology; or the
use of a suitable non-renewable fuel in the project technology at
times when the supply of a renewable fuel is disrupted or for
preheating (e.g. plant oil stoves).
Data and parameters monitored
Data/parameter ID ICS 15
Data / Parameter: Avoidance of double counting or double claiming among
project technology end users
Data unit: NA
Description: Evidence of avoidance of double counting or double
claiming with project technology end users
Source of data: Evidence of informing / notification of end users, such as:
- leaflets distributed with the warranty card of the
product alerting end-users to the waiving of their
carbon rights in exchange for discount pricing of the
improved technology below its true cost,
- carbon title waiver forms signed by end users, etc.
Monitoring frequency: Monitored whenever project technology is sold or
otherwise disseminated
QA/QC procedures: Cross check using general internet search and search of
public records of Gold Standard and other voluntary
market and UNFCCC mechanisms
Any comment: -
Data/parameter ID ICS 16
Data / Parameter: Presence of stove stacking
Data unit: NA
Description:
Descriptive statistics of the presence and usage practices
of baseline- and other non-project-technology by project
technology end users

METHODOLOGY-SDG IQ Reduced emissions from cooking and heating
35
Source of data: Use one of the following methods:
- Measurement campaigns shall be undertaken using
data loggers such as stove utilization monitors
(SUMs) which can log the operation of all devices in
order to determine the average device utilization
intensity, or
- Usage Survey- use of other stoves, to capture
cooking habits and stove usage of households in the
region, including quantification of use of baseline
devices, by formulating questions and/or collecting
evidences to determine the frequency of usage of
both the project devices and baseline devices, or
monitoring surveys to capture the number of meals
cooked.
The surveys may be integrated with the usage
survey.
Monitoring frequency: Annual
QA/QC procedures: The calculation of SFSp,b,y, SFCp,y, SEb,y,CO2 and/or SEb,y,non-
CO2 shall be cross-checked with the observed presence of
stove stacking. Ensure any stove stacking is considered
so that emission reductions are calculated only from real
reduction of, or replacement of, baseline fuel use.
Cross-check results of this survey with independent
studies that are specific to the project region (or to the
project country, if regional studies are not available),
including but not limited to National publications, peer-
reviewed literature, third party assessments (for example
– WISDOM, FAO, UN and similar organizations) and/or
official data or statistics about cooking technologies, not
older than 5 years old.
Any comment: Whether or not the existing baseline technology is
surrendered, when an old technology remains in use in
parallel with the improved technology, or another
technology is put in use in parallel, the corresponding
emissions must be accounted for so that emission
reductions are not overestimated. For example:
- if the baseline fuel consumption was defined based
on the total fuel used for cooking by the user,
determine the percentage of meals or cooking
performed on the project technology and multiply
the baseline fuel usage by this percentage;
- adjust the baseline fuel consumption to be defined based only on the use of the cooking technology that
is directly replaced by the project technology.
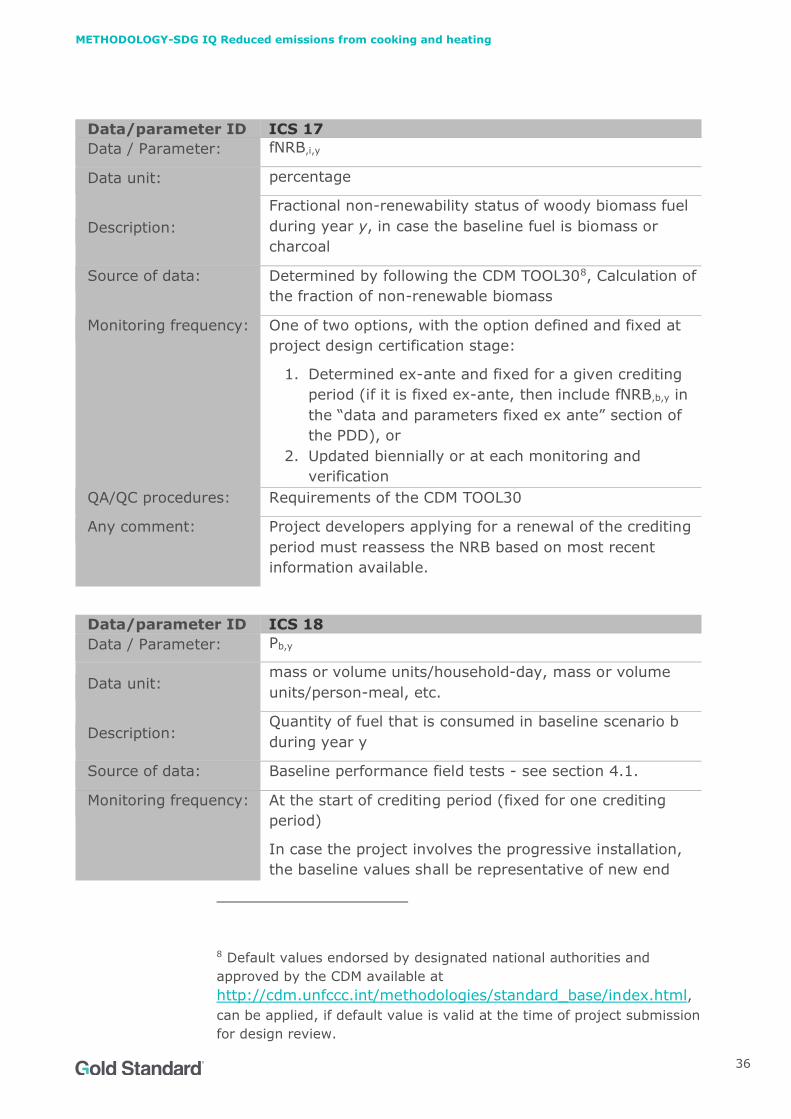
METHODOLOGY-SDG IQ Reduced emissions from cooking and heating
36
Data/parameter ID ICS 17
Data / Parameter: fNRB,i,y
Data unit: percentage
Description:
Fractional non-renewability status of woody biomass fuel
during year y, in case the baseline fuel is biomass or
charcoal
Source of data: Determined by following the CDM TOOL308, Calculation of
the fraction of non-renewable biomass
Monitoring frequency: One of two options, with the option defined and fixed at
project design certification stage:
1. Determined ex-ante and fixed for a given crediting
period (if it is fixed ex-ante, then include fNRB,b,y in
the “data and parameters fixed ex ante” section of
the PDD), or
2. Updated biennially or at each monitoring and
verification
QA/QC procedures: Requirements of the CDM TOOL30
Any comment: Project developers applying for a renewal of the crediting
period must reassess the NRB based on most recent
information available.
Data/parameter ID ICS 18
Data / Parameter: Pb,y
Data unit: mass or volume units/household-day, mass or volume
units/person-meal, etc.
Description: Quantity of fuel that is consumed in baseline scenario b
during year y
Source of data: Baseline performance field tests - see section 4.1.
Monitoring frequency: At the start of crediting period (fixed for one crediting
period)
In case the project involves the progressive installation,
the baseline values shall be representative of new end
8 Default values endorsed by designated national authorities and
approved by the CDM available at
http://cdm.unfccc.int/methodologies/standard_base/index.html,
can be applied, if default value is valid at the time of project submission
for design review.

METHODOLOGY-SDG IQ Reduced emissions from cooking and heating
37
users cooking practices included in the projects after
registration. If there are changes to the characteristics of
the end users (cooking practices and/or living standards),
the project developer shall conduct baseline KPTs for new
end-users and include as a new scenario or adjust the
values that have been provided at the time of project
registration.
QA/QC procedures: Compliance with the general requirements for sampling
(Section 4.4), general requirements for QA/QC (Section
4.5) and Annex 2 Kitchen performance test.
If the values resulting from the baseline KPTs are higher
than the following threshold value (on equivalent
terms), then the results shall be further substantiated by
independent third-party studies that are specific to the
project region, including but not limited to government
publications, peer-reviewed literature, third party
assessments (for example – WISDOM, FAO, UN and
similar organizations) and/or official data or statistics
about cooking technologies and fuel use. In any case, the
value applied shall not be higher than the cap value (on
equivalent terms).
Threshold value: 0.75 tonnes/person*year of fuelwood
Cap value: 0.95 tonnes/person*year of fuelwood
Any comment: Used to calculate SFS under method 1, and SE under
method 3.
Applicable adjustment factors may be applied.
Data/parameter ID ICS 19
Data / Parameter: Pp,y
Data unit: mass or volume units/household-day, mass or volume
units/person-meal, etc.
Description: Quantity of fuel that is consumed in project scenario p
during year y
Source of data: Project performance field tests - see section 4.1
Monitoring frequency: Updated every two years, or more frequently
The KPT values are valid for two years and may be
applied for before or after period, however the gap
between start date of first KPTs and second KPTs shall not
be more than two years.
QA/QC procedures: Compliance with the general requirements for sampling
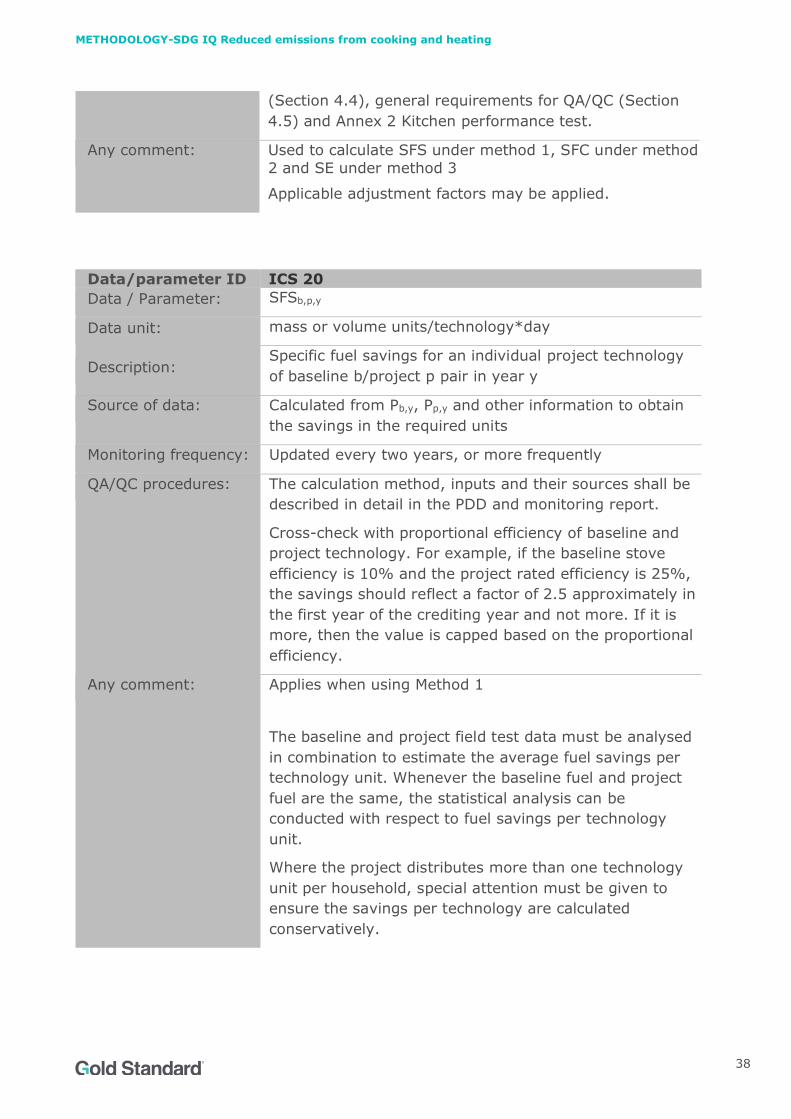
METHODOLOGY-SDG IQ Reduced emissions from cooking and heating
38
(Section 4.4), general requirements for QA/QC (Section
4.5) and Annex 2 Kitchen performance test.
Any comment: Used to calculate SFS under method 1, SFC under method
2 and SE under method 3
Applicable adjustment factors may be applied.
Data/parameter ID ICS 20
Data / Parameter: SFSb,p,y
Data unit: mass or volume units/technology*day
Description: Specific fuel savings for an individual project technology
of baseline b/project p pair in year y
Source of data: Calculated from Pb,y, Pp,y and other information to obtain
the savings in the required units
Monitoring frequency: Updated every two years, or more frequently
QA/QC procedures: The calculation method, inputs and their sources shall be
described in detail in the PDD and monitoring report.
Cross-check with proportional efficiency of baseline and
project technology. For example, if the baseline stove
efficiency is 10% and the project rated efficiency is 25%,
the savings should reflect a factor of 2.5 approximately in
the first year of the crediting year and not more. If it is
more, then the value is capped based on the proportional
efficiency.
Any comment: Applies when using Method 1
The baseline and project field test data must be analysed
in combination to estimate the average fuel savings per
technology unit. Whenever the baseline fuel and project
fuel are the same, the statistical analysis can be
conducted with respect to fuel savings per technology
unit.
Where the project distributes more than one technology
unit per household, special attention must be given to
ensure the savings per technology are calculated
conservatively.

METHODOLOGY-SDG IQ Reduced emissions from cooking and heating
39
Data/parameter ID ICS 21
Data / Parameter: SFCp,y
Data unit: tons/technology*day
Description: Specific fuel consumption for an individual project
technology in project scenario p during year y
Source of data: Calculated from Pp,y and other information to obtain the
consumption in the required units
Monitoring frequency: Updated every two years, or more frequently
QA/QC procedures: The calculation method and inputs shall be described in
detail in the PDD and monitoring report.
Cross-check baseline and project emission results with
proportional efficiency of baseline and project technology.
For example, if the baseline stove efficiency is 10% and
the project rated efficiency is 25%, the savings should
reflect a factor of 2.5 approximately in the first year of
the crediting year and not more. If it is more, then the
SFCp,y value set at a floor value based on the
proportional efficiency.
Any comment: Applies when using Method 2
Where the project distributes more than one technology
unit per household, special attention must be given to ensure the savings per technology are calculated conservatively.
Data/parameter ID ICS 22
Data / Parameter: SEb,y,CO2
Data unit: tCO2/technology*day
Description: Specific CO2 emissions for a baseline b technology in year
y
Source of data: Calculated from Pb,y, EFb,f,CO2 and other information to
obtain the emissions of the required units
Monitoring frequency: Updated every two years, or more frequently
QA/QC procedures: The calculation method and inputs shall be described in
detail in the PDD and monitoring report.
Cross-check the ratio of specific emissions of the baseline
and project (SEp,y,CO2) on energy terms with proportional
efficiency of baseline and project technology and/or
proportional emission factors of the two different fuels. If
the purported savings is more than efficiency and
emission factors improvements explain, then the baseline

METHODOLOGY-SDG IQ Reduced emissions from cooking and heating
40
value is capped based on the proportional efficiency or
proportional emission factors, whichever is more
appropriate to the project technology.
Any comment: Applies when using Method 3
Where the project distributes more than one technology unit per household, special attention must be given to
ensure the savings per technology are calculated conservatively.
Data/parameter ID ICS 23
Data / Parameter: SEp,y,CO2
Data unit: tCO2/technology*day
Description: Specific CO2 emissions for a project p technology in year y
Source of data: Calculated from Pp,y, EFp,f,CO2 and other information to
obtain the emissions in the required units
Monitoring frequency: Updated every two years, or more frequently
QA/QC procedures: The calculation method and inputs shall be described in
detail in the PDD and monitoring report.
Any comment: Applies when using Method 3
Where the project distributes more than one technology
unit per household, special attention must be given to ensure the savings per technology are calculated
conservatively.
Data/parameter ID ICS 24
Data / Parameter: SEb,y,non-CO2
Data unit: tCO2e/technology*day
Description: Specific non-CO2 emissions for a baseline b technology in
year y
Source of data: Calculated from Pb,y, EFb,f,nonCO2 and other information to
obtain the emissions in the required units
Monitoring frequency: Updated every two years, or more frequently
QA/QC procedures: The calculation method, inputs and their sources shall be
described in detail in the PDD and monitoring report.
Any comment: Applies when using Method 3
Where the project distributes more than one technology
unit per household, special attention must be given to

METHODOLOGY-SDG IQ Reduced emissions from cooking and heating
41
ensure the savings per technology are calculated
conservatively.
Data/parameter ID ICS 25
Data / Parameter: SEp,y,non-CO2
Data unit: tCO2e/technology*day
Description: Specific non-CO2 emissions for a project p technology in
year y
Source of data: Calculated from Pp,y, EFp,f,nonCO2 and other information to
obtain the savings in the required units
Monitoring frequency: Updated every two years, or more frequently
QA/QC procedures: The calculation method, inputs and their sources shall be
described in detail in the PDD and monitoring report.
Any comment: Applies when using Method 3
Where the project distributes more than one technology
unit per household, special attention must be given to
ensure the savings per technology are calculated
conservatively.
Data/parameter ID ICS 26
Data / Parameter: Up,y
Data unit: Percentage
Description: Weighted average usage rate in project scenario p during
year y
Source of data: Usage survey, following the description in section 4.1.
Usage survey.
The survey result must provide the statistically valid
proportion of users actively using the project technology
for each project technology age cohort.
From the annual usage survey results, calculate the
weighted average percent of users actively using the
project technology, where the weighting is by the
quantity of project technologies of each age cohort being
credited in a given project scenario.
Monitoring frequency: At least annually
Optionally, more frequently
QA/QC procedures: Compliance with the general requirements for sampling
(Section 4.4) and general requirements for QA/QC
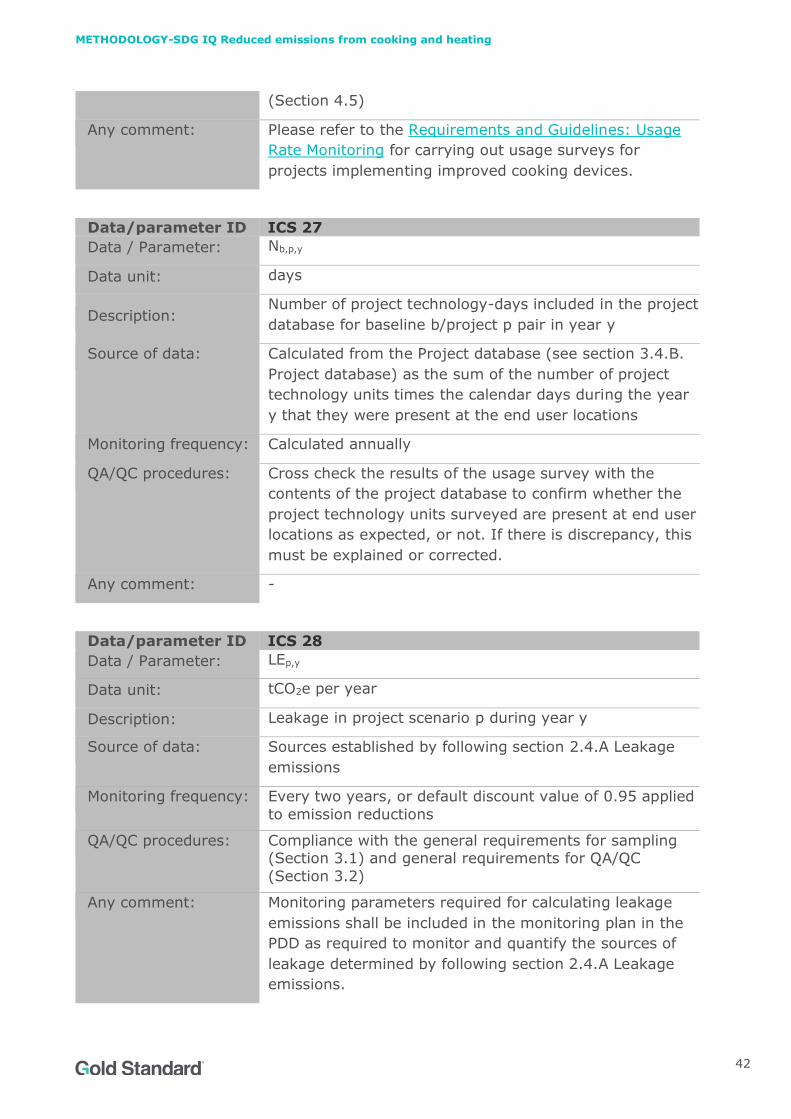
METHODOLOGY-SDG IQ Reduced emissions from cooking and heating
42
(Section 4.5)
Any comment: Please refer to the Requirements and Guidelines: Usage
Rate Monitoring for carrying out usage surveys for
projects implementing improved cooking devices.
Data/parameter ID ICS 27
Data / Parameter: Nb,p,y
Data unit: days
Description: Number of project technology-days included in the project
database for baseline b/project p pair in year y
Source of data: Calculated from the Project database (see section 3.4.B.
Project database) as the sum of the number of project
technology units times the calendar days during the year
y that they were present at the end user locations
Monitoring frequency: Calculated annually
QA/QC procedures: Cross check the results of the usage survey with the
contents of the project database to confirm whether the
project technology units surveyed are present at end user
locations as expected, or not. If there is discrepancy, this
must be explained or corrected.
Any comment: -
Data/parameter ID ICS 28
Data / Parameter: LEp,y
Data unit: tCO2e per year
Description: Leakage in project scenario p during year y
Source of data: Sources established by following section 2.4.A Leakage
emissions
Monitoring frequency: Every two years, or default discount value of 0.95 applied
to emission reductions
QA/QC procedures: Compliance with the general requirements for sampling (Section 3.1) and general requirements for QA/QC
(Section 3.2)
Any comment: Monitoring parameters required for calculating leakage
emissions shall be included in the monitoring plan in the
PDD as required to monitor and quantify the sources of
leakage determined by following section 2.4.A Leakage
emissions.

METHODOLOGY-SDG IQ Reduced emissions from cooking and heating
43
Baseline scenario survey
The baseline scenario survey provides critical information on target population
characteristics, baseline technology use, fuel consumption, leakage, and
sustainable development indicators.
Representativeness: The baseline survey requires in person interviews with
a robust sample of end users without project technologies that are
representative of end users targeted in the project activity.
Sample Sizing: The baseline survey should be carried out for each baseline
scenario using representative and random sampling, following these
guidelines for minimum sample size:
Group size Minimum sample size
<300 30 or population size, whichever is smaller
300 to 1000 10% of group size
> 1000 100
Data Collected: The data collected is specific to the characteristics of each
baseline scenario and should be tailored accordingly. Information on the
following needs to be gathered:
1. User follow up i. Address or location ii. Mobile telephone number and/or landline
telephone number (when possible)
2. End user characteristics
iii. Number of people served by baseline technology iv. Typical baseline technology usage patterns and
tasks (commercial, institutional, domestic, etc.)
3. Baseline
technology and fuels
v. Types of baseline technologies used and
estimated frequency vi. Types of fuels used and estimated quantities
vii. Seasonal variations in baseline technology and fuel use
viii. Sources of fuels; purchased, hand-collected, or etc., and prices paid or effort made, e.g. walking
distances, persons collecting, opportunity cost
General requirements for sampling
When sampling is applied to determine mean (average) parameter values or
proportion (yes/no) parameter values for both ex-ante and monitored data
and parameters, the following guidelines shall always be applied.
Furthermore, specific requirements apply for the sampling related to some
parameters, and these are described below or in the parameter tables.
A statistically valid sample can be used to determine parameter values, as per
the relevant requirements for sampling in the latest version of the CDM
Standard for sampling and surveys for CDM project activities and programme
of activities. 90% confidence interval and a 10% margin of error requirement
shall be achieved for the sampled parameters unless mentioned otherwise in

METHODOLOGY-SDG IQ Reduced emissions from cooking and heating
44
the methodology. In any case, for proportion parameter values, a minimum
sample size of 30, or the whole group size if this is lower than 30, must
always be applied.
Cross-VPA sampling is not allowed across groups larger than 10 VPAs, and
cross-VPA sampling is not allowed for large scale PoAs. The requirements
described here apply both when sampling is applied to a single VPA and to
permissible cross-VPA sampling.
For guidance, project developers may refer to the latest version of the CDM
Guidelines for sampling and surveys for CDM project activities and
programmes of activities for the type of sampling approach (simple random,
cluster, stratified etc.) applicable to their project context.
Requirements for Cases where Pairs of Baseline and Project Parameters are
Derived through Sampling
For determination of the parameters 𝑆𝐹𝑆𝑝,𝑏,𝑦 or 𝑆𝐸𝑅𝑏,𝑝,𝑦,𝐶𝑂2 under emission
reduction methods 1 and 3, there are two valid options for the statistical
analysis. In all cases, sample sizes must be derived following the general
requirements for sampling and be greater than 30. The two options are:
a. 90/30 rule. When the sample sizes are large enough to satisfy the
“90/30 rule,” i.e. the endpoints of the 90% confidence interval lie within
+/- 30% of the estimated mean, overall emission reductions can be
calculated on the basis of the estimated MEAN annual emission reduction
per unit or MEAN fuel annual savings per unit.
b. 90% confidence rule. When the sample sizes are such that the “90/30
rule” is not complied with, the emission or fuel saving result is not the
mean (or average) test result, but a lower value equivalent to the
LOWER BOUND of the one-sided 90% confidence interval.
Applying the rules to estimate baseline and project average emissions or
average fuel use separately is not permitted. The only exception is for cases
involving a single set of data; see the following section.
Requirements for Cases where only the Project Parameter is Derived through
Sampling
Under emission reductions method 2, where test data from a field test
sampling determines project fuel consumption, and a default factor is being
used to define a baseline, there are two valid options for the statistical
analysis. In all cases, the sample size must be derived following the general
requirements for sampling and must be greater than 30. The two options are:
a. 90/10 rule. When the sample size is large enough to satisfy the “90/10
rule,” i.e. the endpoints of the 90% confidence interval lie within +/-
10% of the estimated mean, overall emission reductions can be
calculated on the basis of the estimated MEAN fuel consumption per unit.
b. 90% confidence rule. When the sample sizes are such that the “90/10
rule” is not complied with, the fuel consumption result is not the mean

METHODOLOGY-SDG IQ Reduced emissions from cooking and heating
45
(or average) test result, but a higher value equivalent to the UPPER
BOUND of the one-sided 90% confidence interval.
General Requirements for Quality Assurance and Quality Control
The project developer is responsible for accurate and transparent record
keeping, monitoring and evaluation. All supporting documentation and records
for the project must be easily accessible for spot checking and cross
referencing by a third-party auditor.
Contact information in the total sales record must allow a project auditor to
easily contact and visit end users.
An auditor must be able to cross reference pertinent project documentation,
including archives such as production records (e.g. materials purchases,
internal logs), financial accounts and sales records, as well as wholesale
customer invoices, observations of retailer activities and sales performance.

METHODOLOGY-SDG IQ Reduced emissions from cooking and heating
46
ANNEX - 1: SUPPRESSED DEMAND AND SATISFACTORY
LEVEL OF SERVICE
In some developing countries the level of energy service is not sufficient to meet human
development needs due to lack of financial means and/or access to modern energy
infrastructure or resources. When a group of people are deprived of a reasonable level
of human development in comparison to their peers, the group of people is considered
to experience suppressed demand. I.e., it is assumed their use of energy would be
higher – high enough to achieve a satisfactory level of service- if only they had sufficient
resources.
When the opportunity to achieve a satisfactory level of service is available through
carbon finance, then, in the context of this Gold Standard methodology, project
developers can adjust the baseline scenario accordingly. Under such circumstances, the
baseline scenario may be determined from the satisfactory level of service achieved by
their peers, or from the project level of service achieved, with consideration for
conservativeness and trends of increasing living standards.
When the pre-project scenario is biomass use for energy, and a trend of increasing
living standards is observed in the population, then the hypothetical baseline scenario
may entail the replacement of a biomass baseline with a proxy of 100% fossil fuel. This
consideration must be analysed during baseline selection.
Indicative examples of baseline scenario determination under
suppressed demand
Example 1
Pre-project scenario: The target population in a baseline scenario experiences poverty-
related issues of an inability to cook resulting in malnourishment due to insufficient
access to cooking fuels.
Project impact: The project activity corrects this by introducing more efficient cooking
devices, making existing access to cooking fuels sufficient to avoid malnourishment.
Potential baseline definition: The amount of energy delivered to the pot (the ‘cooking
energy utilized’ or CEU) of the project scenario permits the affected population to
achieve a satisfactory level of service. The measured efficiency and fuel amount are
utilized to estimate the hypothetical baseline fuel use using pre-project cooking devices.
In such instances, evidence should support that the project level is satisfactory but not
excessive and that the previous level was unsatisfactory according to universally
accepted living standard benchmarks.
Example 2
Pre-project scenario: In a cold climate, a population lacks sufficient fuel to satisfy space
heating needs, resulting in substandard living conditions.
Project impact: A project introduces a new renewable energy technology that enables
improved energy access, achieving a satisfactory level of heating service.

METHODOLOGY-SDG IQ Reduced emissions from cooking and heating
47
Potential baseline definition: The total kitchen CEU (including cooking and space heating
supply) in the project scenario exceeds that in the pre-project scenario significantly.
The hypothetical baseline is set to a proxy technology based on the standard of living
achieved by peers.
METHODOLOGY-SDG IQ Reduced emissions from cooking and heating
48
ANNEX - 2: COMPLEMENTARY GUIDELINES FOR KITCHEN
PERFORMANCE TESTING
Complementary guidelines for fuel consumption
measurements
This annex addresses additional guidelines that should be applied when carrying out
one specific type of performance test, the measurement of fuel use by inefficient and
efficient stoves. This is known as the Kitchen Performance Test (KPT).
The principles of the KPT also apply to performance testing of other decentralized
energy-saving devices. This annex and associated KPT protocol9 may be used as a
preliminary guide to field performance tests (FTs) for the other technologies.
Developers of other decentralized thermal energy technologies may adapt these
principles appropriately to achieve accurate and conservative results.
The baseline survey and baseline KPT can be conducted concurrently with the same
end users.
When conducting a KPT following the current KPT protocol, follow these complementary
guidelines.
Step 1
Estimate the number of test subjects you will be visiting (your SAMPLE SIZE). Sample
sizes need to be larger if there is a lot of variation in the amounts of fuel used and
saved, which is often the case in KPTs. One way to start is to simply assume a typical
variation, expressed as a Coefficient of Variation or COV (typically in this context COVs
are in the range 0.5-2.0). Use the tables here to choose a provisional minimum sample
size using that COV estimate (a good starting point is to choose a mid-way value in the
range given in the tables)10. Note that this assumes simple random sampling (if you
use another method of sampling you will need to increase the sample size).
9 Kitchen Performance Test (KPT) Version 4.0.
https://cleancookingalliance.org/binary-
data/DOCUMENT/file/000/000/604-1.pdf
10 The difference between independent, paired and single sampling is
explained in the next step of this procedure. Another way to estimate
sample size is to find a study that has already been done in similar
conditions (same type of socioeconomic and cultural conditions) to your
project, and learn from this the MEAN value of tests, and the STANDARD
DEVIATION (SD). Dividing, you get the COV (= SD/MEAN), and then you
can use the table on this page.

METHODOLOGY-SDG IQ Reduced emissions from cooking and heating
49
If you choose a COV which is smaller than the real COV, it is likely that once you have
finished the tests, you will need to increase the sample size11. The validity of this
approach depends on a wider range of factors than the COV alone, and therefore a
minimum sample size of 30 is recommended (see below). Be sure to allow for “sample
size attrition”, that is dropouts; if you launch 40 tests for example, you are likely to
conclude with more than 30 valid results, even if some of the test subjects make
mistakes or some of the tests are incomplete. If previous experience shows a dropout
or attrition rate of 10% is likely, launch 10% more tests than suggested in the tables
here.
Table 3: Sample sizes in cases of PAIRED samples (households sampled in the
baseline and the project situation are the same).
COV 1.2 1.3 1.4 1.5 1.6 1.7 1.8 1.9 2
90/30 precision 45 53 61 70 80 90 101 112 124
Table 4 : Sample sizes in cases of INDEPENDENT samples (households sampled in the
project situation are different from households sampled in the baseline situation). This
is the size required for each of the baseline and project samples.
COV 1.2 1.3 1.4 1.5 1.6 1.7 1.8 1.9 2
90/30 precision 90 105 122 140 159 180 201 224 248
Table 5: Sample sizes in cases of SINGLE samples (where the tests are conducted for
either baseline or project scenario but not both).
COV 0.2 0.3 0.4 0.5 0.6 0.7 0.8 0.9 1
90/10 precision 12 26 45 70 101 137 179 226 279
11 This approach is legitimate if you can justify it by showing that the
supplementary households are ones which could have appeared in the
random sample originally or which otherwise qualify as consistent with
the aim of a sample which is representative of the project stove users and
their behaviour through the year.
METHODOLOGY-SDG IQ Reduced emissions from cooking and heating
50
Step 2
Select the kitchens sampled using a RANDOM selection method. There are different
ways of doing this, and it is up to you to choose an appropriate one that will give test
results which reflect the real fuel savings of the project population. 12
Step 3
Plan your tests so that they give a reliable and conservative result. In general, there
are two phases, the BEFORE phase (before the improved stove is adopted, the
baseline scenario) and the AFTER phase (after it is adopted, the project scenario). In
some cases you may not need to test fuel consumption in both phases (when using
default factors for baseline stoves). If you are doing both phases, consider whether it
is best to run both phases in the same kitchens (PAIRED sampling), or separate
phases in separate sets of kitchens having appropriately similar socio-economic and
cultural conditions (INDEPENDENT sampling). Larger sample sizes are required when
using two independent samples, but independent sampling may be the only option if a
fixed baseline has been established or if it is necessary to conduct the baseline and
project tests concurrently. In the case of paired sampling, consider how long you need
to give the subjects to get used to the project stoves before launching the AFTER
tests, so that your test will reflect real usage patterns in forthcoming years. If a
default efficiency is used for baseline stoves, then it is possible to run a KPT on the
project stove only, and combine the results with either a value of project stove
efficiency or a credible value for delivered cooking energy or for average baseline fuel
consumption, so calculating fuel saved. This case is called a SINGLE SAMPLE KPT.
Step 4
Choose an appropriate test period and an appropriate time of year (or multiple times
during the year). A recommended minimum test period is 3 days. It is important to
avoid times like festivals or holidays when more cooking is done than usual. The KPT
shall exclude large parties or infrequent cooking events, and match cooking tasks in
the baseline KPT to those in the project KPT. If you do include days of home cooking
(for example weekends) when people are not at work and eating more than usual at
home, you must make sure that they are balanced by an appropriate number of
working days when people eat less at home. The same applies to tests which include
cooks who sell their food publicly – these tests must include days when less food is
sold as well as days when food sales are high, in an appropriate ratio and erring
towards a conservative result. Think of ways of designing the test so that it captures a
cooking pattern representative of a whole year. For example, this may involve
12 Applicable common sampling approaches are outlined in Section 3.0,
Sampling Application Guidance, of the General Guidelines for Sampling
and Surveys for Small-Scale CDM Project Activities (EB 50 Report, Annex
30)

METHODOLOGY-SDG IQ Reduced emissions from cooking and heating
51
carrying out some of the tests in another season of the year when eating patterns or
food types are different, or prescribing a representative cooking pattern during a
single test (this latter approach is known as a Controlled Cooking Test, a variation on
the KPT).
Step 5
Make sure that all test subjects understand they are expected to cook normally during
the tests. The aim is to capture their usual behaviour in the kitchen, as if no tests
were happening, to feed the usual variation of people with the usual variation of food
types. Your tests must measure the fuel saved by the kitchen as a whole not by one
individual stove; for example it is common for a cook to use one hob sometimes, and
also an extra one or two hobs, at other times. Your project stove may be a two-hob
design or a one-hob design, either way there is the possibility that an extra non-
project hob or stove is occasionally used, in areas where project stoves are still a
novelty and the incentive system for elimination of non-project stoves is still ongoing.
Step 6
To conduct the tests, make sure the cooks use fuel only from a designated stock
which you have pre-weighed. Enter key data, such as the mass of the fuel at start of
tests as stocked for each subject, in an excel form such as the ones provided in KPT
guidelines referenced (see the first footnote of this section). It is recommended to
visit the subjects at least once a day to check that they are using only fuel from the
weighed stock, and are not adding un-weighed fuel to the stock. If more fuel is
needed, weigh before adding and enter the mass added in the data sheet.
For practical reasons, it is often best to provide fuel for the tests (to help control the
weighing and use of fuel), rather than have the subjects use fuel they are buying
themselves. Nevertheless, it is important that the fuel is typical of the fuel normally
used through the year, particularly in terms of moisture content. It is also important
that the subjects have any commonplace incentives to conserve fuel, for example pay
for fuel, if they normally do so, or collect the fuel themselves, if they normally do so,
otherwise they may use excessive amounts due to the free hand-out/availability.
Subjects may be told they will be rewarded for their effort and time at the end of the
test, once it is successfully completed.
Step 7
During the tests, find out how many people have eaten and how many meals each, so
that you can enter into the data sheet the number of “person-meals” (individual meals
as opposed to meals shared) cooked with the weighed fuel each day. Note that this
count can include meals sold commercially as well as meals consumed in the domestic
environment.

METHODOLOGY-SDG IQ Reduced emissions from cooking and heating
52
Step 8
Run a statistical analysis on the test results, to estimate the mean fuel savings.
If used data that has been collected as part of a separate study, make sure that the
sample was selected randomly. If this is not the case, then the data should not be
used.
Before beginning the analysis, be sure to check for “outliers”, i.e. values which are
very different to the majority of the sample13. Outliers should be examined to check
for mistakes with data recording, or investigated to ascertain if there were unusual
circumstances which led to that result. If so, then the observation should be removed
or corrected before the analysis. The distribution of sample values should also be
checked for skewness. If there are extreme outliers or skewness, or the data was not
collected by a simple random sample, then methods of analysis which are more
complicated than the approaches suggested here may be required.
In cases of paired and independent sampling, there are two valid options for the
statistical analysis:
- 90/30 rule. This option allows you to calculate emission reductions on the basis
of the estimated MEAN (or average) fuel saved by introduction of the improved
stove in one kitchen, or on the estimated MEAN (or average) fuel use in one
kitchen if using a single-sample. You can only use the mean if your test results
satisfy the 90/30 rule, i.e. the endpoints of the 90% confidence interval lie
within +/- 30% of the estimated mean. If this is not the case, then you can use
the test data gathered so far to estimate how much larger the sample size
needs to be. The mean value will always result in a larger estimate of fuel-
savings than the value obtained using the second option below, but in some
cases you might choose to analyze using the second option, because it is not
practical or too expensive to increase the sample size sufficiently.
13 One way to identify potential outliers is to produce a box-plot of the
data. Most statistical software enables this. Any points which are plotted
individually on the box-plot are candidates for outliers and should be
investigated. Equivalently, potential outliers can be identified as those
points which are either greater than 1.5 times the inter-quartile range
(IQR) from the third quartile, or less than 1.5 times the IQR from the first
quartile.

METHODOLOGY-SDG IQ Reduced emissions from cooking and heating
53
- 90% confidence rule (Lower bound of the one-sided14 90% confidence interval).
This option allows you to obtain a result even if 90/30 precision is not achieved,
although in a similar manner to the 90/30 rule, a minimum sample size of 30 is
recommended. You can use this approach when the 90/30 rule forces a sample
size which is difficult to implement in practice. The disadvantage is that the fuel
saving result is not the mean (or average) test result, but a lower value15. This
estimate is very conservative, and it will probably be worthwhile to augment
the sample size instead in cases when augmentation is practically possible.
The baseline and project KT data should be analysed in combination to estimate of the
mean fuel saving. It is not allowed to apply the rules to estimate baseline and project
fuel-use separately.
In cases of single samples for project KT, there are two valid options for the statistical
analysis:
- 90/10 rule. This option allows you to calculate emission reductions on the basis
of the estimated MEAN (or average) fuel saved by introduction of the improved
stove in one kitchen, or on the estimated MEAN (or average) fuel use in one
kitchen if using a single-sample. You can only use the mean if your test results
satisfy the 90/10 rule, i.e. the endpoints of the 90% confidence interval lie
within +/- 10% of the estimated mean. If this is not the case, then you can use
the test data gathered so far to estimate how much larger the sample size
needs to be. The mean value will always result in a larger estimate of fuel-
savings than the value obtained using the second option below, but in some
cases you might choose to analyze using the second option, because it is not
practical or too expensive to increase the sample size sufficiently.
- 90% confidence rule (Upper bound of the one-sided16 90% confidence interval).
This option allows you to obtain a result even if 90/10 precision is not achieved,
although in a similar manner to the 90/10 rule, a minimum sample size of 30 is
recommended. You can use this approach when the 90/10 rule forces a sample
size which is difficult to implement in practice. The disadvantage is that the
project fuel use result is not the mean (or average) test result, but a higher
14 The one-sided confidence interval is appropriate because it is relevant
here to specify the confidence that the estimate is conservative, e.g. that
the estimated fuel-savings are lower than (or to the low-side of) the true
fuel-savings.
15 Technically, it is the largest value that with a probability of 90% will be
less than the true mean.
16 The one-sided confidence interval is appropriate because it is relevant
here to specify the confidence that the estimate is conservative, e.g. that
the estimated fuel-savings are lower than (or to the low-side of) the true
fuel-savings.

METHODOLOGY-SDG IQ Reduced emissions from cooking and heating
54
value17. This estimate is very conservative, and it will probably be worthwhile to
augment the sample size instead in cases when augmentation is practically
possible.
Step 9
You may reward the test subjects once the tests are finished, for instance give them
one or two project stoves or other compensation. Since you have already analyzed
your data, you are in a good position to decide whether to extend the sample size
further, or re-run tests that for some reason were invalid.
17 Technically, it is the largest value that with a probability of 90% will be
more than the true mean.

METHODOLOGY-SDG IQ Reduced emissions from cooking and heating
55
ANNEX - 3: PROJECT PREPARATION AND MONITORING
SCHEDULE (FOR ONE CREDITING PERIOD)
Project preparation and
monitoring schedule
Prior to
validation
Prior to
first
verification18
Annual Every two
years
ER estimation for PDD ✔
Baseline studies
Indoor air pollution levels ✔
NRB assessment ✔
Baseline scenario survey ✔
Baseline Field Tests
(*except where default
values applied)
✔ ✔*
Project studies
Usage survey ✔
Usage survey -use of other
stoves
✔
Project Field Tests (PFT) ✔ ✔
Ongoing monitoring tasks
Maintenance of total sales
record and project
database
Continuous
Leakage assessment ✔
Updating NRB assessments
(*except where ex-ante
value applied)
✔*
18 Monitoring tasks must be completed prior to the first verification during which the given
project or baseline scenario is used for crediting.

METHODOLOGY-SDG IQ Reduced emissions from cooking and heating
56
ANNEX - 4: AGING TEST APPROACH FOR PROJECT FUEL
UPDATES
The approach provided in this Annex is limited to Small-scale projects only (i.e those
projects that result in annual energy savings upto 180GWhth as a result of switching
to the project technology) and micro-scale projects. This approach is additional to the
applicable monitoring requirements and procedures prescribed in section 4 above.
The project fuel consumption (Pp,y) (parameter ICS 19) shall be updated by carrying
out the biennial project KPTs to account for changes in the project scenario over time
as project technologies age. This annex provides an alternative method to biennial
project KPTs to update project fuel consumption. The project developer shall monitor
the degradation in the performance of cookstove efficiency following the Water Boiling
Test19 and accordingly adjust the project fuel consumption level. To apply the Ageing
Test approach, following the steps shall be followed;
a. Determine the efficiency of the project cookstove (ηnew,i,1) (parameter ICS 29):
The project developer shall carry out the Water Boiling Test to determine the thermal
efficiency of the project cookstove type i along with the project KPTs (resulting in
project wood consumption value (SFCp,1) (parameter ICS 30) prior to 1st issuance.
The efficiency of the project cookstove shall be determined in the field or laboratory,
following the latest version of Water Boling Test protocol, by an independent expert
or entity.
b. Monitor the degradation in the efficiency of project cookstove in year y (ηnew,i,y)
(parameter ICS 31):
The degradation in the efficiency of the project cookstove type i shall be monitored
annually (year y) by carrying out the WBT in the field or laboratory by an
independent expert or entity.
c. Update the project fuel consumption level (SFCp,i,y):
To update project fuel consumption, the fuel consumption level determined under
step a i.e., result of project KPTs prior to 1st issuance, shall be adjusted with the
ratio of efficiency level determined under step a. and the efficiency level determined
under step b. It would imply adjusting the project fuel consumption value for
efficiency degradation.
Ideally, the WBT shall not result in higher efficiency values at 2nd, 3rd or subsequent
years as compared to the first WBT results. In cases, where it is higher as compared
to the 1st WBT test results, the conservative values shall be applied for emission
reductions calculation.
19 https://cleancookingalliance.org/binary-data/DOCUMENT/file/000/000/399-1.pdf
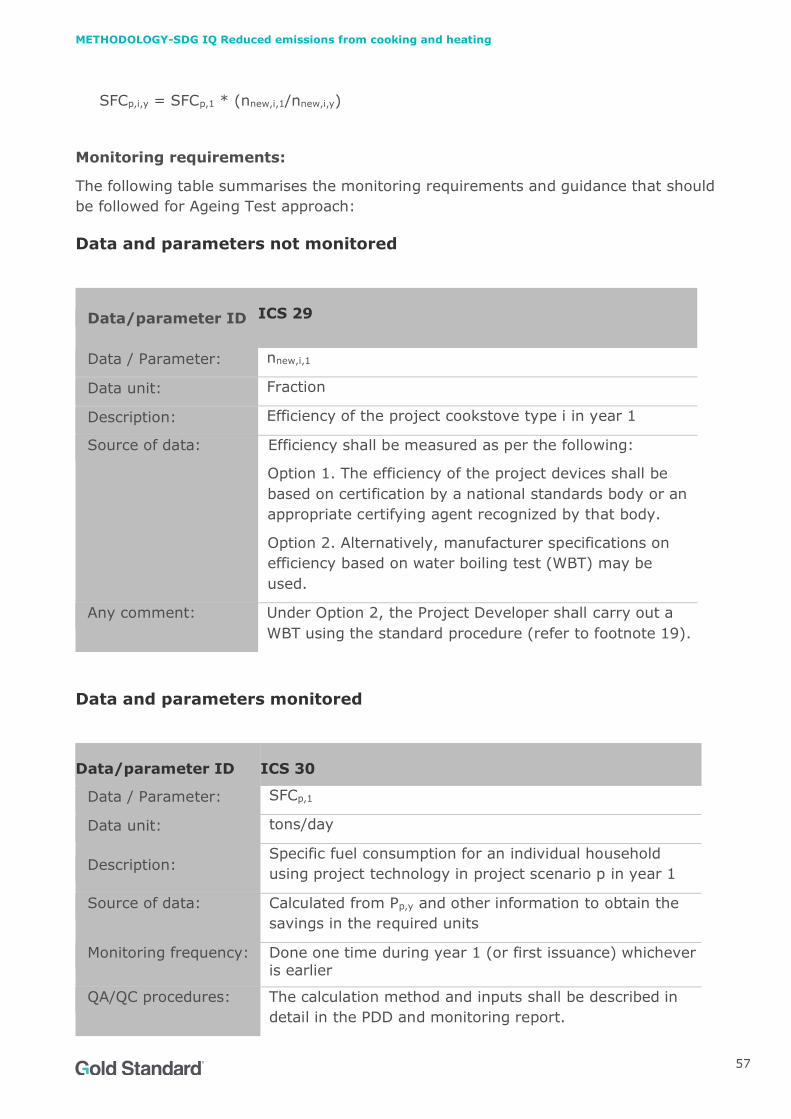
METHODOLOGY-SDG IQ Reduced emissions from cooking and heating
57
SFCp,i,y = SFCp,1 * (nnew,i,1/nnew,i,y)
Monitoring requirements:
The following table summarises the monitoring requirements and guidance that should
be followed for Ageing Test approach:
Data and parameters not monitored
Data/parameter ID ICS 29
Data / Parameter: nnew,i,1
Data unit: Fraction
Description: Efficiency of the project cookstove type i in year 1
Source of data: Efficiency shall be measured as per the following:
Option 1. The efficiency of the project devices shall be
based on certification by a national standards body or an
appropriate certifying agent recognized by that body.
Option 2. Alternatively, manufacturer specifications on
efficiency based on water boiling test (WBT) may be
used.
Any comment: Under Option 2, the Project Developer shall carry out a
WBT using the standard procedure (refer to footnote 19).
Data and parameters monitored
Data/parameter ID ICS 30
Data / Parameter: SFCp,1
Data unit: tons/day
Description: Specific fuel consumption for an individual household
using project technology in project scenario p in year 1
Source of data: Calculated from Pp,y and other information to obtain the
savings in the required units
Monitoring frequency: Done one time during year 1 (or first issuance) whichever is earlier
QA/QC procedures: The calculation method and inputs shall be described in
detail in the PDD and monitoring report.
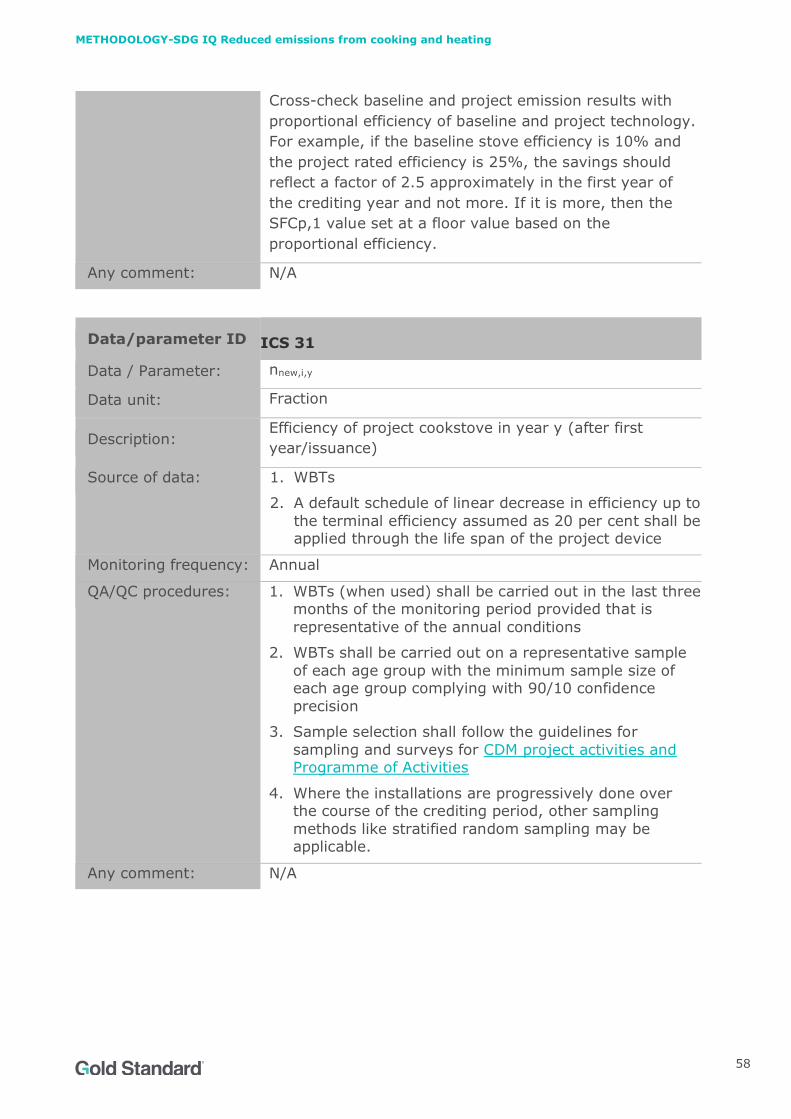
METHODOLOGY-SDG IQ Reduced emissions from cooking and heating
58
Cross-check baseline and project emission results with
proportional efficiency of baseline and project technology.
For example, if the baseline stove efficiency is 10% and
the project rated efficiency is 25%, the savings should
reflect a factor of 2.5 approximately in the first year of
the crediting year and not more. If it is more, then the
SFCp,1 value set at a floor value based on the
proportional efficiency.
Any comment: N/A
Data/parameter ID ICS 31
Data / Parameter: nnew,i,y
Data unit: Fraction
Description: Efficiency of project cookstove in year y (after first
year/issuance)
Source of data: 1. WBTs
2. A default schedule of linear decrease in efficiency up to
the terminal efficiency assumed as 20 per cent shall be applied through the life span of the project device
Monitoring frequency: Annual
QA/QC procedures: 1. WBTs (when used) shall be carried out in the last three months of the monitoring period provided that is
representative of the annual conditions
2. WBTs shall be carried out on a representative sample
of each age group with the minimum sample size of each age group complying with 90/10 confidence
precision
3. Sample selection shall follow the guidelines for
sampling and surveys for CDM project activities and Programme of Activities
4. Where the installations are progressively done over the course of the crediting period, other sampling
methods like stratified random sampling may be applicable.
Any comment: N/A

METHODOLOGY-SDG IQ Reduced emissions from cooking and heating
59
DOCUMENT HISTORY
Version Date Description
4.0 05/10/2021
1. Change in title of the methodology from ‘Gold Standard Technologies and
Practices to Displace Decentralized Thermal Energy Consumption
(TPDDTEC)’ to ‘Reduced Emissions from Cooking and Heating
(RECH):TPDDTEC’
2. Making editorial improvements
3. Updated to align the methodology with latest scientific understanding, provide
further clarity on key issues, promote consistency between various GS
methodologies. A summary of all key changes is available here.
3.1 25/08/2017 1. Making editorial improvements
2. Updated to align the methodology version with latest scientific understanding, provide further clarity
on key issues, promote consistency between various GS methodologies.
3.0 10/07/2017
2.0 24/04/2015
1.0 11/04/2011 First version