Embed Size (px)
Citation preview
Methodology for risk analysis in railway tunnels using Monte Carlo simulation
G. Vanorio & J. M. Mera Technical University of Madrid, Spain
Abstract
In the context of safety analyses for railway tunnels, various efforts have been made to try to identify and evaluate the possible consequences of undesired events. Very few of these efforts have proposed techniques or methodologies allowing the risks involved to be quantified. By counting on a Quantitative Risk Analysis (QRA) methodology applied in the planning of railway tunnels, we would be able to know and quantify the potential consequences of these risks. The present paper sets out a QRA Methodology, applied to railway tunnels, fundamentally based on the analysis and combination of scenarios, using the “Event Tree” and “Monte Carlo Simulation (MCS)” techniques. The basic tools for the methodology are the “PrecisionTree” and “@RISK” software programmes that allow events with uncertain occurrence probabilities to be analyzed using the formulation of decision-tree models and the risk assessed through the use of Monte Carlo simulations. The development of a QRA methodology, based on the use of “Event Tree” and “MCS” techniques, offers a powerful and effective way to quantify the risks of possible fatalities in railway tunnels. The application of the QRA methodology in the Planning or Conceptual Engineering phases of a project constitutes a fundamental tool as it allows the possible infrastructure types or solutions to be assessed and compared from the standpoint of safety in order to select the Tunnel System to be implemented. Keywords: quantitative risk analysis (QRA), Monte Carlo simulation (MCS), risks, safety, event tree, occurrence probabilities, uncertain variables, fatalities, tunnel system.
Computers in Railways XIII 673
www.witpress.com, ISSN 1743-3509 (on-line) WIT Transactions on The Built Environment, Vol 127, © 2012 WIT Press
doi:10.2495/CR120571
1 Introduction
Tunnel construction nowadays takes place in a totally different context from that of more than ten years ago, mostly due to the fact that the point of view of society itself has changed, and therefore our responsibility. Accidents in tunnels, with consequences for their builders or the surroundings, are no longer accepted as the inevitable price to be paid (Romana [1]). Accidents in railway tunnels may give rise to major harm for people, goods and the environment. The most serious risk is a collision inside a tunnel, followed by a fire. This risk may be catastrophic due to the entrapment of people and smoke in a confined space, in which smoke is propagated quickly, making it difficult to escape in time to a safe location and hindering the rescue actions. In recent years, safety-related aspects in railway tunnels have been debated and analyzed by different bodies and operators related to the activities of the railway sector. These discussion and analysis processes have led to the formulation of new recommendations, which have since become standards for application in the construction of new railway tunnels, as well as to the implementation of safety measures for pre-existing tunnels, but very few of these efforts have offered techniques or methodologies that allow the risks involved to be quantified (Alarc n [2]). This paper presents the development of Quantitative Risk Analysis (QRA) Methodology that allows us to carry out a quantitative assessment for the analysis of risks in railway tunnels, in which it is possible to analyze a series of possible scenarios for the Tunnel Systems implemented, fundamentally based on the event tree methodology, considering the possible frequencies of occurrence in terms of fatalities assigned to each scenario considered and on the use of the Monte Carlo simulation technique, which allows us to consider the uncertainty factors associated with the risks.
2 Risks in railway tunnels
Risk Analysis is a topical subject that is more and more present in major infrastructure projects and particularly in projects for underground works. The principal scenarios for the critical events that may arise in a railway tunnel include: Fires, Derailments and Collisions. Other scenarios relating for instance to acts of vandalism and deliberate attacks are not considered in a normal risk analysis procedure, as they do not represent the typical accidental events exclusively related to the Train-Tunnel system. In some particular cases, it may be necessary to take such scenarios into account in the very formulation of the risk analysis.
3 Types of railway tunnels
In view of the linear nature of tunnels, the different types are defined by the number of tracks and tunnels existing in the cross-section and the possible presence of a service and safety tunnel.
674 Computers in Railways XIII
www.witpress.com, ISSN 1743-3509 (on-line) WIT Transactions on The Built Environment, Vol 127, © 2012 WIT Press
ó
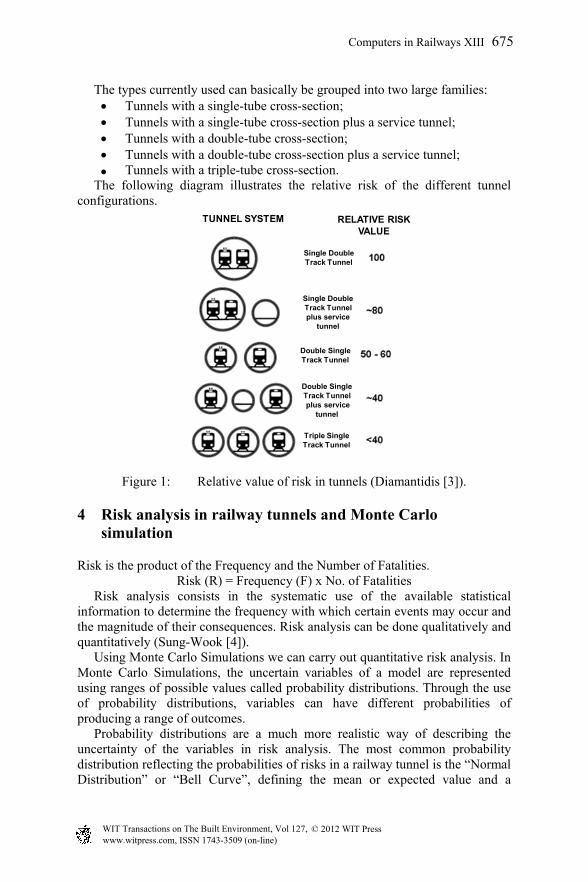
The types currently used can basically be grouped into two large families: Tunnels with a single-tube cross-section; Tunnels with a single-tube cross-section plus a service tunnel; Tunnels with a double-tube cross-section; Tunnels with a double-tube cross-section plus a service tunnel; Tunnels with a triple-tube cross-section.
The following diagram illustrates the relative risk of the different tunnel configurations.
Figure 1: Relative value of risk in tunnels (Diamantidis [3]).
4 Risk analysis in railway tunnels and Monte Carlo simulation
Risk is the product of the Frequency and the Number of Fatalities. Risk (R) = Frequency (F) x No. of Fatalities
Risk analysis consists in the systematic use of the available statistical information to determine the frequency with which certain events may occur and the magnitude of their consequences. Risk analysis can be done qualitatively and quantitatively (Sung-Wook [4]). Using Monte Carlo Simulations we can carry out quantitative risk analysis. In Monte Carlo Simulations, the uncertain variables of a model are represented using ranges of possible values called probability distributions. Through the use of probability distributions, variables can have different probabilities of producing a range of outcomes. Probability distributions are a much more realistic way of describing the uncertainty of the variables in risk analysis. The most common probability distribution reflecting the probabilities of risks in a railway tunnel is the “Normal Distribution” or “Bell Curve”, defining the mean or expected value and a
TUNNEL SYSTEM RELATIVE RISK VALUE
Single DoubleTrack Tunnel
Single DoubleTrack Tunnelplus service
tunnel
Double Single Track Tunnel
Double Single Track Tunnelplus service
tunnel
Triple Single Track Tunnel
Computers in Railways XIII 675
www.witpress.com, ISSN 1743-3509 (on-line) WIT Transactions on The Built Environment, Vol 127, © 2012 WIT Press
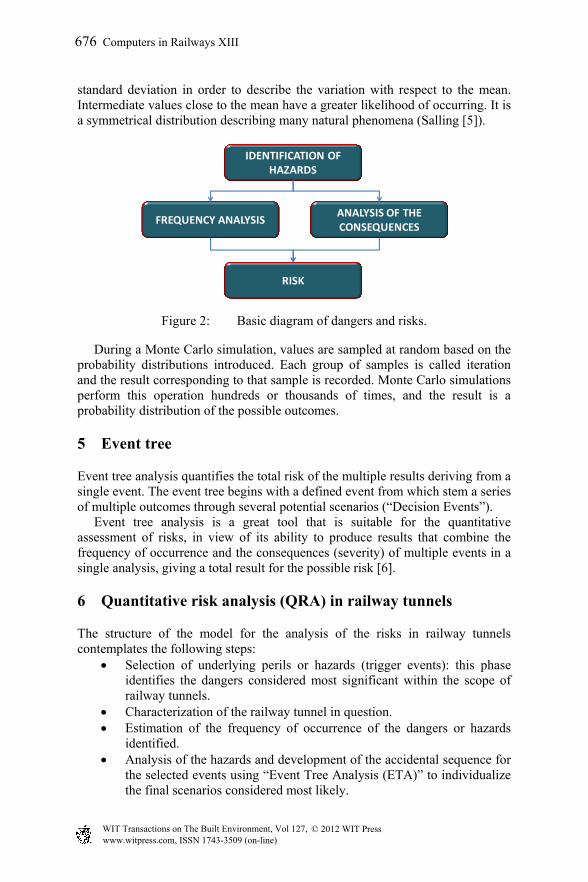
standard deviation in order to describe the variation with respect to the mean. Intermediate values close to the mean have a greater likelihood of occurring. It is a symmetrical distribution describing many natural phenomena (Salling [5]).
Figure 2: Basic diagram of dangers and risks.
During a Monte Carlo simulation, values are sampled at random based on the probability distributions introduced. Each group of samples is called iteration and the result corresponding to that sample is recorded. Monte Carlo simulations perform this operation hundreds or thousands of times, and the result is a probability distribution of the possible outcomes.
5 Event tree
Event tree analysis quantifies the total risk of the multiple results deriving from a single event. The event tree begins with a defined event from which stem a series of multiple outcomes through several potential scenarios (“Decision Events”). Event tree analysis is a great tool that is suitable for the quantitative assessment of risks, in view of its ability to produce results that combine the frequency of occurrence and the consequences (severity) of multiple events in a single analysis, giving a total result for the possible risk [6].
6 Quantitative risk analysis (QRA) in railway tunnels
The structure of the model for the analysis of the risks in railway tunnels contemplates the following steps:
Selection of underlying perils or hazards (trigger events): this phase identifies the dangers considered most significant within the scope of railway tunnels.
Characterization of the railway tunnel in question. Estimation of the frequency of occurrence of the dangers or hazards
identified. Analysis of the hazards and development of the accidental sequence for
the selected events using “Event Tree Analysis (ETA)” to individualize the final scenarios considered most likely.
IDENTIFICATION OF HAZARDS
ANALYSIS OF THE CONSEQUENCES
FREQUENCY ANALYSIS
RISK
676 Computers in Railways XIII
www.witpress.com, ISSN 1743-3509 (on-line) WIT Transactions on The Built Environment, Vol 127, © 2012 WIT Press
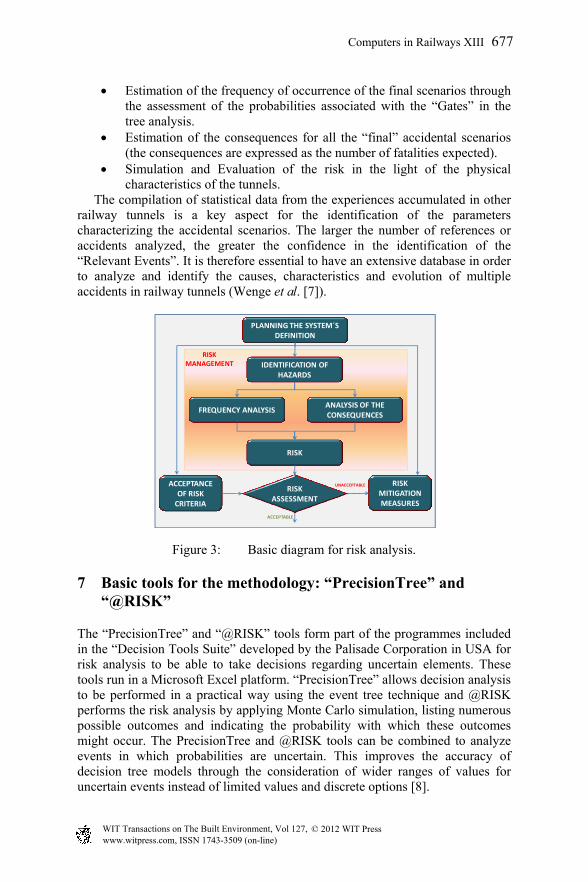
Estimation of the frequency of occurrence of the final scenarios through the assessment of the probabilities associated with the “Gates” in the tree analysis.
Estimation of the consequences for all the “final” accidental scenarios (the consequences are expressed as the number of fatalities expected).
Simulation and Evaluation of the risk in the light of the physical characteristics of the tunnels.
The compilation of statistical data from the experiences accumulated in other railway tunnels is a key aspect for the identification of the parameters characterizing the accidental scenarios. The larger the number of references or accidents analyzed, the greater the confidence in the identification of the “Relevant Events”. It is therefore essential to have an extensive database in order to analyze and identify the causes, characteristics and evolution of multiple accidents in railway tunnels (Wenge et al. [7]).
Figure 3: Basic diagram for risk analysis.
7 Basic tools for the methodology: “PrecisionTree” and “@RISK”
The “PrecisionTree” and “@RISK” tools form part of the programmes included in the “Decision Tools Suite” developed by the Palisade Corporation in USA for risk analysis to be able to take decisions regarding uncertain elements. These tools run in a Microsoft Excel platform. “PrecisionTree” allows decision analysis to be performed in a practical way using the event tree technique and @RISK performs the risk analysis by applying Monte Carlo simulation, listing numerous possible outcomes and indicating the probability with which these outcomes might occur. The PrecisionTree and @RISK tools can be combined to analyze events in which probabilities are uncertain. This improves the accuracy of decision tree models through the consideration of wider ranges of values for uncertain events instead of limited values and discrete options [8].
IDENTIFICATION OF HAZARDS
ANALYSIS OF THE CONSEQUENCES
FREQUENCY ANALYSIS
RISK
PLANNING THE SYSTEM´S DEFINITION
RISK ASSESSMENT
RISK MITIGATION MEASURES
ACCEPTANCE OF RISK
CRITERIA
ACCEPTABLE
UNACCEPTABLE
RISK MANAGEMENT
Computers in Railways XIII 677
www.witpress.com, ISSN 1743-3509 (on-line) WIT Transactions on The Built Environment, Vol 127, © 2012 WIT Press
8 Methodology for risk analysis in railway tunnels using Monte Carlo simulation
The main steps in the Railway Tunnel Risk Analysis Methodology are described below:
8.1 Operational characterization of the tunnel
The operational characterization of the tunnel under study is fundamental for an estimation of each type of tunnel on the basis of the statistics on the probability of occurrence, the expectations of fatalities that might ensue over a given period of time. For example, let us consider an underground railway system with a double track with the following characteristics:
Length: 18 Km. Operating hours/day: 17 Hours Frequency between trains: 120 seconds No. of Trains/day: 510 Trains Train-Km/day: 18,360 Train-Km/day Train-Km/year: 6,701,400 Train-Km/year MM Train-Km in 30 years: 201 Millions of Train-Km
As can be seen in the preceding figures, a Metro-type system with these characteristics can reach over 200 million Train-Km over 30 years’ operation; on the basis of these figures and the probabilities of occurrence per million Train-Km in each type of tunnel, the expectations of fatalities that might occur can be obtained.
8.2 Statistical analyses: analysis of the frequency of occurrence and expectations of fatalities
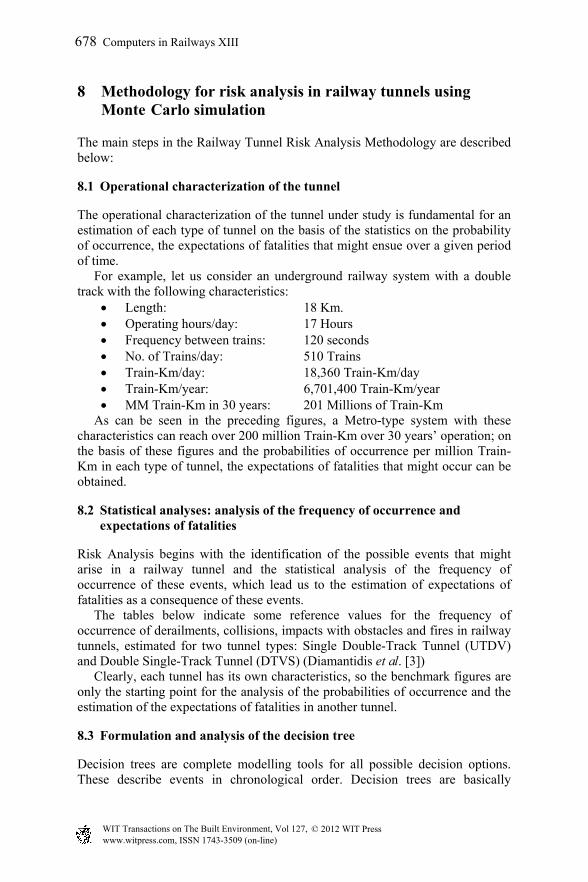
Risk Analysis begins with the identification of the possible events that might arise in a railway tunnel and the statistical analysis of the frequency of occurrence of these events, which lead us to the estimation of expectations of fatalities as a consequence of these events. The tables below indicate some reference values for the frequency of occurrence of derailments, collisions, impacts with obstacles and fires in railway tunnels, estimated for two tunnel types: Single Double-Track Tunnel (UTDV) and Double Single-Track Tunnel (DTVS) (Diamantidis et al. [3]) Clearly, each tunnel has its own characteristics, so the benchmark figures are only the starting point for the analysis of the probabilities of occurrence and the estimation of the expectations of fatalities in another tunnel.
8.3 Formulation and analysis of the decision tree
Decision trees are complete modelling tools for all possible decision options. These describe events in chronological order. Decision trees are basically
678 Computers in Railways XIII
www.witpress.com, ISSN 1743-3509 (on-line) WIT Transactions on The Built Environment, Vol 127, © 2012 WIT Press
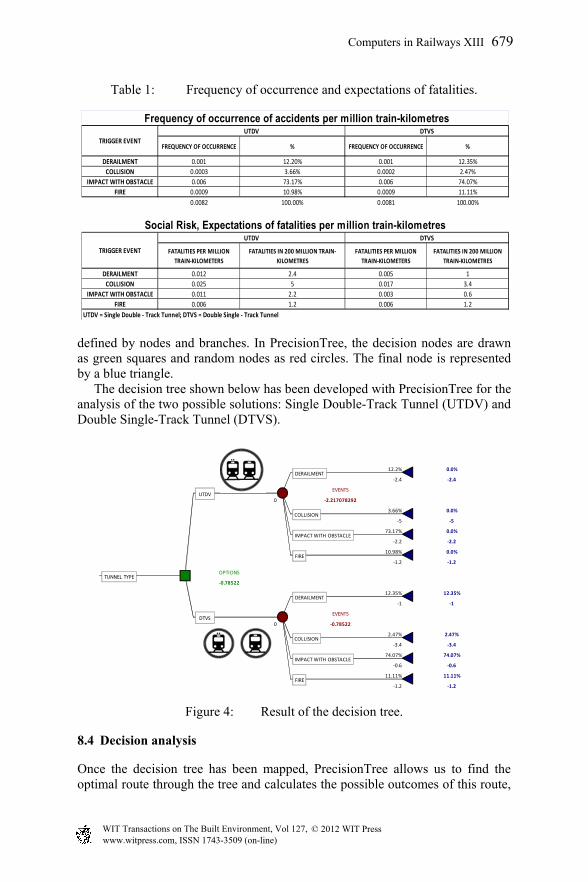
Table 1: Frequency of occurrence and expectations of fatalities.
defined by nodes and branches. In PrecisionTree, the decision nodes are drawn as green squares and random nodes as red circles. The final node is represented by a blue triangle. The decision tree shown below has been developed with PrecisionTree for the analysis of the two possible solutions: Single Double-Track Tunnel (UTDV) and Double Single-Track Tunnel (DTVS).
Figure 4: Result of the decision tree.
8.4 Decision analysis
Once the decision tree has been mapped, PrecisionTree allows us to find the optimal route through the tree and calculates the possible outcomes of this route,
FREQUENCY OF OCCURRENCE % FREQUENCY OF OCCURRENCE %
DERAILMENT 0.001 12.20% 0.001 12.35%
COLLISION 0.0003 3.66% 0.0002 2.47%
IMPACT WITH OBSTACLE 0.006 73.17% 0.006 74.07%
FIRE 0.0009 10.98% 0.0009 11.11%
0.0082 100.00% 0.0081 100.00%
FATALITIES PER MILLION
TRAIN‐KILOMETERS
FATALITIES IN 200 MILLION TRAIN‐
KILOMETRES
FATALITIES PER MILLION
TRAIN‐KILOMETERS
FATALITIES IN 200 MILLION
TRAIN‐KILOMETRES
DERAILMENT 0.012 2.4 0.005 1
COLLISION 0.025 5 0.017 3.4
IMPACT WITH OBSTACLE 0.011 2.2 0.003 0.6
FIRE 0.006 1.2 0.006 1.2
UTDV = Single Double ‐ Track Tunnel; DTVS = Double Single ‐ Track Tunnel
Frequency of occurrence of accidents per million train-kilometres
TRIGGER EVENT
UTDV DTVS
TRIGGER EVENT
Social Risk, Expectations of fatalities per million train-kilometres
UTDV DTVS
12.2% 0.0%
‐2.4 ‐2.4
EVENTS
0 ‐2.217078292
3.66% 0.0%
‐5 ‐5
73.17% 0.0%
‐2.2 ‐2.2
10.98% 0.0%
‐1.2 ‐1.2
OPTIONS
‐0.78522
12.35% 12.35%
‐1 ‐1
EVENTS
0 ‐0.78522
2.47% 2.47%
‐3.4 ‐3.4
74.07% 74.07%
‐0.6 ‐0.6
11.11% 11.11%
‐1.2 ‐1.2
TUNNEL TYPE
UTDV
DERAILMENT
COLLISION
IMPACT WITH OBSTACLE
DTVS
DERAILMENT
COLLISION
IMPACT WITH OBSTACLE
FIRE
FIRE
Computers in Railways XIII 679
www.witpress.com, ISSN 1743-3509 (on-line) WIT Transactions on The Built Environment, Vol 127, © 2012 WIT Press
known in PrecisionTree as “Policy Suggestion”. The policy suggestion report is a shortened version of the decision tree showing only the optimal decisions of the model. As can be seen, the Double Single-Track Tunnel (DTVS) option is the most suitable alternative for the tunnel solution in terms of safety.
Figure 5: Optimal route for the decision tree.
8.5 Risk profile
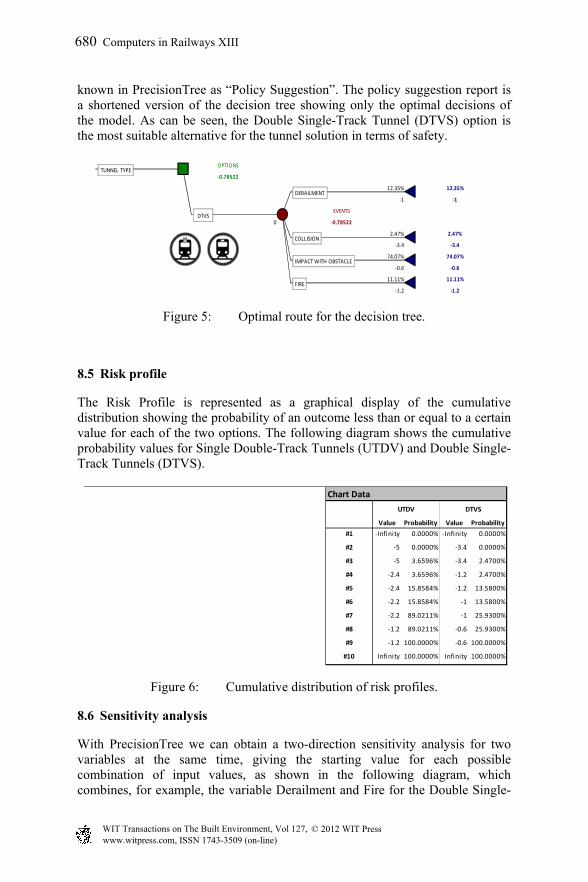
The Risk Profile is represented as a graphical display of the cumulative distribution showing the probability of an outcome less than or equal to a certain value for each of the two options. The following diagram shows the cumulative probability values for Single Double-Track Tunnels (UTDV) and Double Single-Track Tunnels (DTVS).
Figure 6: Cumulative distribution of risk profiles.
8.6 Sensitivity analysis
With PrecisionTree we can obtain a two-direction sensitivity analysis for two variables at the same time, giving the starting value for each possible combination of input values, as shown in the following diagram, which combines, for example, the variable Derailment and Fire for the Double Single-
OPTIONS
‐0.78522
12.35% 12.35%
‐1 ‐1
EVENTS
0 ‐0.78522
2.47% 2.47%
‐3.4 ‐3.4
74.07% 74.07%
‐0.6 ‐0.6
11.11% 11.11%
‐1.2 ‐1.2
TUNNEL TYPE
DTVS
DERAILMENT
COLLISION
IMPACT WITH OBSTACLE
FIRE
Value Probability Value Probability
#1 ‐Infinity 0.0000% ‐Infinity 0.0000%
#2 ‐5 0.0000% ‐3.4 0.0000%
#3 ‐5 3.6596% ‐3.4 2.4700%
#4 ‐2.4 3.6596% ‐1.2 2.4700%
#5 ‐2.4 15.8584% ‐1.2 13.5800%
#6 ‐2.2 15.8584% ‐1 13.5800%
#7 ‐2.2 89.0211% ‐1 25.9300%
#8 ‐1.2 89.0211% ‐0.6 25.9300%
#9 ‐1.2 100.0000% ‐0.6 100.0000%
#10 Infinity 100.0000% Infinity 100.0000%
Chart Data
UTDV DTVS
680 Computers in Railways XIII
www.witpress.com, ISSN 1743-3509 (on-line) WIT Transactions on The Built Environment, Vol 127, © 2012 WIT Press
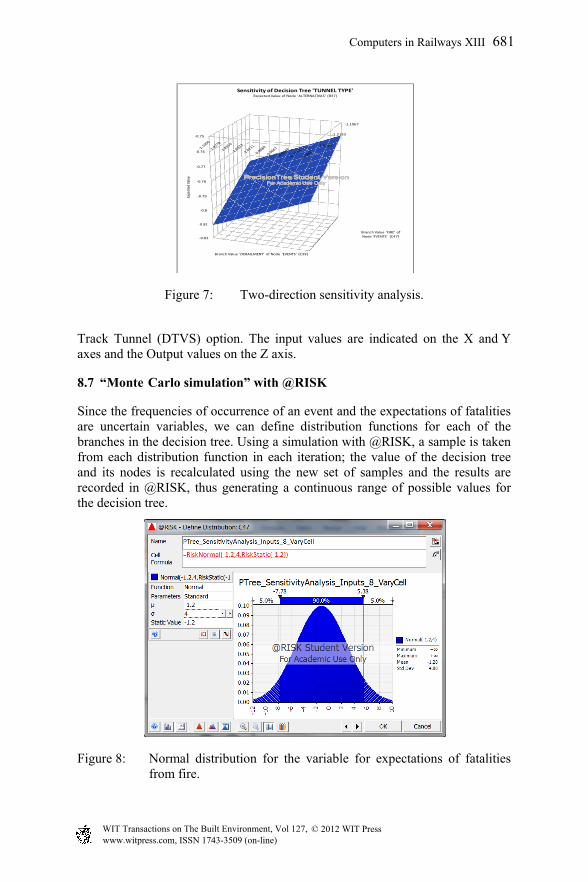
Figure 7: Two-direction sensitivity analysis.
Track Tunnel (DTVS) option. The input values are indicated on the X and Y axes and the Output values on the Z axis.
8.7 “Monte Carlo simulation” with @RISK
Since the frequencies of occurrence of an event and the expectations of fatalities are uncertain variables, we can define distribution functions for each of the branches in the decision tree. Using a simulation with @RISK, a sample is taken from each distribution function in each iteration; the value of the decision tree and its nodes is recalculated using the new set of samples and the results are recorded in @RISK, thus generating a continuous range of possible values for the decision tree.
Figure 8: Normal distribution for the variable for expectations of fatalities from fire.
‐1.3200
‐1.2133
‐1.1067
‐0.82
‐0.81
‐0.8
‐0.79
‐0.78
‐0.77
‐0.76
‐0.75
Branch Value 'FIRE' of Node 'EVENTS' (C47)
Expe
cted
Val
ue
Branch Value 'DERAILMENT' of Node 'EVENTS' (C39)
Sensitivity of Decision Tree 'TUNNEL TYPE'Expected Value of Node 'ALTERNATIVAS' (B37)
PrecisionTree Student VersionFor Academic Use Only
PrecisionTree Student VersionFor Academic Use Only
PrecisionTree Student VersionFor Academic Use Only
PrecisionTree Student VersionFor Academic Use Only
PrecisionTree Student VersionFor Academic Use Only
Computers in Railways XIII 681
www.witpress.com, ISSN 1743-3509 (on-line) WIT Transactions on The Built Environment, Vol 127, © 2012 WIT Press
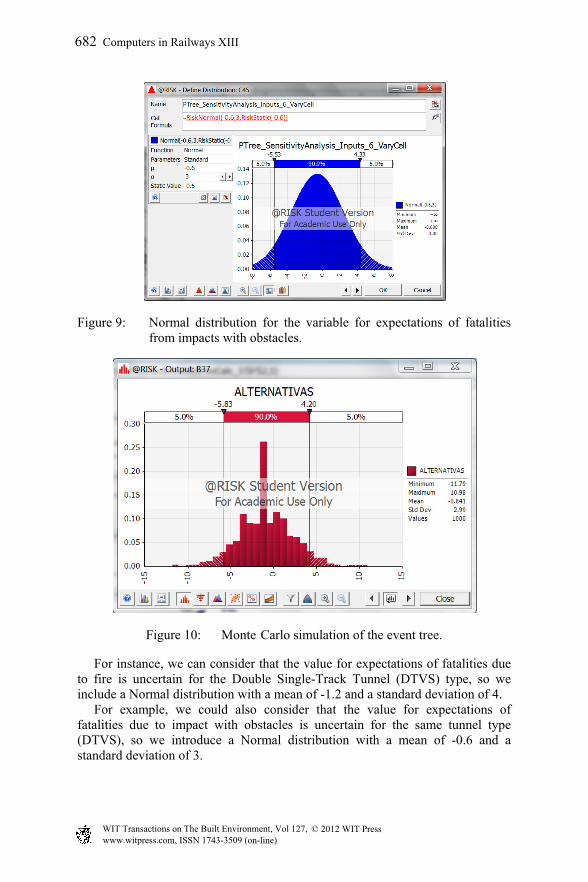
Figure 9: Normal distribution for the variable for expectations of fatalities from impacts with obstacles.
Figure 10: Monte Carlo simulation of the event tree.
For instance, we can consider that the value for expectations of fatalities due to fire is uncertain for the Double Single-Track Tunnel (DTVS) type, so we include a Normal distribution with a mean of -1.2 and a standard deviation of 4. For example, we could also consider that the value for expectations of fatalities due to impact with obstacles is uncertain for the same tunnel type (DTVS), so we introduce a Normal distribution with a mean of -0.6 and a standard deviation of 3.
682 Computers in Railways XIII
www.witpress.com, ISSN 1743-3509 (on-line) WIT Transactions on The Built Environment, Vol 127, © 2012 WIT Press
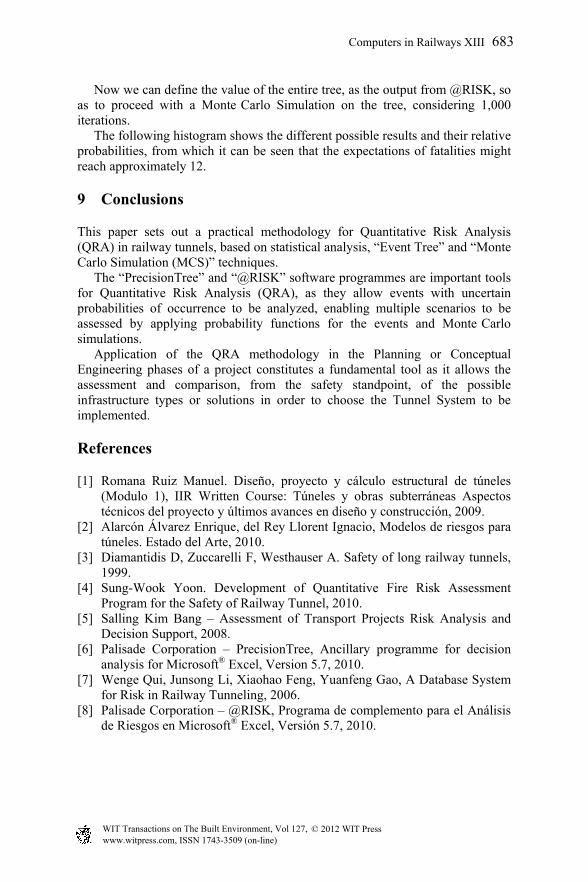
Now we can define the value of the entire tree, as the output from @RISK, so as to proceed with a Monte Carlo Simulation on the tree, considering 1,000 iterations. The following histogram shows the different possible results and their relative probabilities, from which it can be seen that the expectations of fatalities might reach approximately 12.
9 Conclusions
This paper sets out a practical methodology for Quantitative Risk Analysis (QRA) in railway tunnels, based on statistical analysis, “Event Tree” and “Monte Carlo Simulation (MCS)” techniques. The “PrecisionTree” and “@RISK” software programmes are important tools for Quantitative Risk Analysis (QRA), as they allow events with uncertain probabilities of occurrence to be analyzed, enabling multiple scenarios to be assessed by applying probability functions for the events and Monte Carlo simulations. Application of the QRA methodology in the Planning or Conceptual Engineering phases of a project constitutes a fundamental tool as it allows the assessment and comparison, from the safety standpoint, of the possible infrastructure types or solutions in order to choose the Tunnel System to be implemented.
References
[1] Romana Ruiz Manuel. Diseño, proyecto y cálculo estructural de túneles (Modulo 1), IIR Written Course: Túneles y obras subterráneas Aspectos técnicos del proyecto y últimos avances en diseño y construcción, 2009.
[2] Alarcón Álvarez Enrique, del Rey Llorent Ignacio, Modelos de riesgos para túneles. Estado del Arte, 2010.
[3] Diamantidis D, Zuccarelli F, Westhauser A. Safety of long railway tunnels, 1999.
[4] Sung-Wook Yoon. Development of Quantitative Fire Risk Assessment Program for the Safety of Railway Tunnel, 2010.
[5] Salling Kim Bang – Assessment of Transport Projects Risk Analysis and Decision Support, 2008.
[6] Palisade Corporation – PrecisionTree, Ancillary programme for decision analysis for Microsoft® Excel, Version 5.7, 2010.
[7] Wenge Qui, Junsong Li, Xiaohao Feng, Yuanfeng Gao, A Database System for Risk in Railway Tunneling, 2006.
[8] Palisade Corporation – @RISK, Programa de complemento para el Análisis de Riesgos en Microsoft® Excel, Versión 5.7, 2010.
Computers in Railways XIII 683
www.witpress.com, ISSN 1743-3509 (on-line) WIT Transactions on The Built Environment, Vol 127, © 2012 WIT Press

![METHODOLOGY FOR CLASSIFICATION SECTIONS OF RAILWAY … · 2019-05-22 · Northeast China railway network. The railway passenger stations have been classified in [3], using the method](https://img.pdfslide.us/doc/110x75/5f55671e6b977a412e6b9bef/methodology-for-classification-sections-of-railway-2019-05-22-northeast-china.jpg)