Embed Size (px)
Citation preview
METHODOLOGY ARTICLE Open Access
A fitness assay for comparing RNAi effects acrossmultiple C. elegans genotypesMark Elvin1†, Laurens B Snoek2†, Martin Frejno1, Ulrike Klemstein1, Jan E Kammenga2* and Gino B Poulin1*
Abstract
Background: RNAi technology by feeding of E. coli containing dsRNA in C. elegans has significantly contributed tofurther our understanding of many different fields, including genetics, molecular biology, developmental biologyand functional genomics. Most of this research has been carried out in a single genotype or genetic background.However, RNAi effects in one genotype do not reveal the allelic effects that segregate in natural populations andcontribute to phenotypic variation.
Results: Here we present a method that allows for rapidly comparing RNAi effects among diverse genotypes at animproved high throughput rate. It is based on assessing the fitness of a population of worms by measuring therate at which E. coli is consumed. Critically, we demonstrate the analytical power of this method by QTL mappingthe loss of RNAi sensitivity (in the germline) in a recombinant inbred population derived from a cross betweenBristol and a natural isolate from Hawaii. Hawaii has lost RNAi sensitivity in the germline. We found thatpolymorphisms in ppw-1 contribute to this loss of RNAi sensitivity, but that other loci are also likely to beimportant.
Conclusions: In summary, we have established a fast method that improves the throughput of RNAi in liquid, thatgenerates quantitative data, that is easy to implement in most laboratories, and importantly that enables QTLmapping using RNAi.
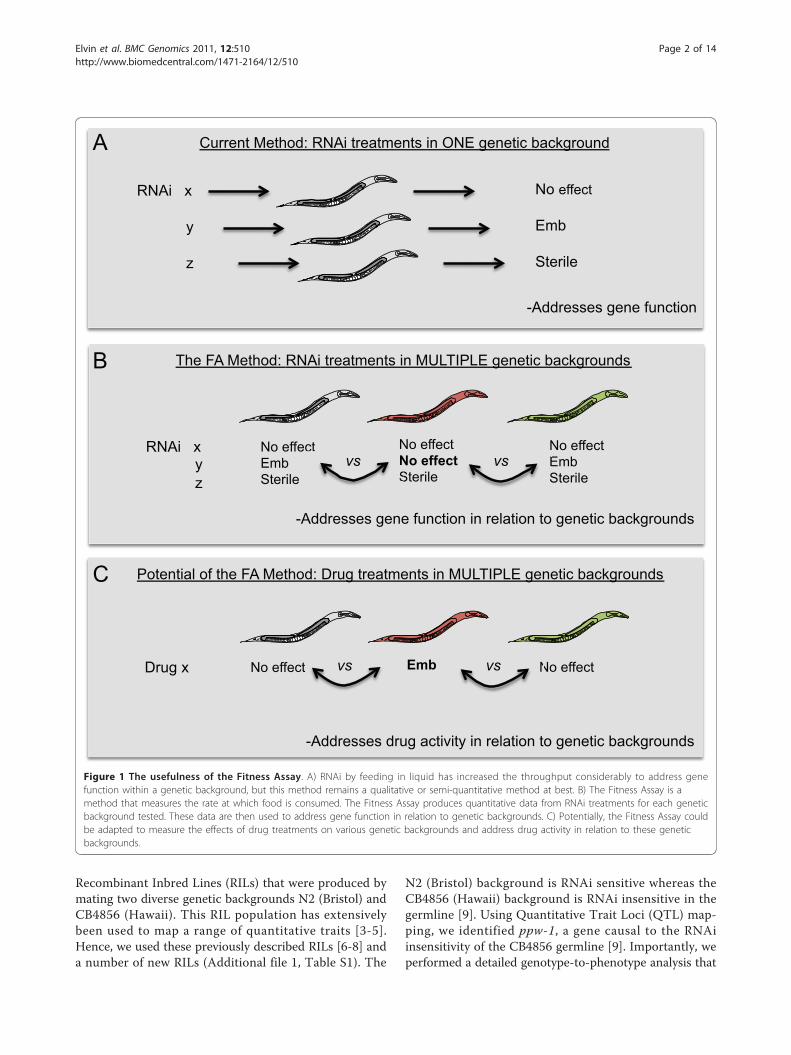
BackgroundThe first genome-wide RNAi screen performed inC. elegans proved to be a milestone, for the first timeeach predicted gene of a metazoan could be inactivatedand the observed effects characterized in a systematicway [1]. Since then, steady improvements have beenmade to the RNAi feeding method, in particular the pos-sibility to perform RNAi screens in liquid in a 96-wellformat [2]. The current methodology is appropriate toaddress gene function in either a wild type backgroundor a mutated background. However, the current methodbecomes very difficult to apply when the question to beaddressed is to determine the role of a particular gene inrelation to multiple genetic backgrounds or genotypes(Figure 1). This problem mainly occurs because RNAi
effects were not quantifiable when performed at a highthroughput rate. We sought to solve this problem bydeveloping a high throughput method that generatesquantitative data fully amenable to statistical analyzesthat allows us to tease apart the contribution of indivi-dual genetic backgrounds to a specific process.The basic principle of the method is to assess the fit-
ness of a population of animals by measuring the rate atwhich E. coli is consumed. Typically, an experimentassesses the fitness over a period of 8 days. This generatesFitness Curves (FCs), which are amenable to statistics.Various analyzes can be performed on the curves usingparameters such as the slope, the mean, the timerequired to consume 50% of the food, the differencebetween first and last readings, or even the surface abovethe area of the curve. Here, we mainly used variation onthe slope, since this parameter can capture most of theeffects observed on the FCs.We demonstrate that our approach is robust by map-
ping the C. elegans loss of RNAi sensitivity trait usingdiverse genetic backgrounds. We took advantage of
* Correspondence: [email protected]; [email protected]† Contributed equally1Faculty of Life Sciences, Michael Smith Building, The University ofManchester, Oxford Road, Manchester, M13 9PT, UK2Laboratory of Nematology, Wageningen Universiteit, Droevendaalsesteeg 1,6708 PB, Wageningen, The NetherlandsFull list of author information is available at the end of the article
Elvin et al. BMC Genomics 2011, 12:510http://www.biomedcentral.com/1471-2164/12/510
© 2011 Elvin et al; licensee BioMed Central Ltd. This is an Open Access article distributed under the terms of the Creative CommonsAttribution License (http://creativecommons.org/licenses/by/2.0), which permits unrestricted use, distribution, and reproduction inany medium, provided the original work is properly cited.
Recombinant Inbred Lines (RILs) that were produced bymating two diverse genetic backgrounds N2 (Bristol) andCB4856 (Hawaii). This RIL population has extensivelybeen used to map a range of quantitative traits [3-5].Hence, we used these previously described RILs [6-8] anda number of new RILs (Additional file 1, Table S1). The
N2 (Bristol) background is RNAi sensitive whereas theCB4856 (Hawaii) background is RNAi insensitive in thegermline [9]. Using Quantitative Trait Loci (QTL) map-ping, we identified ppw-1, a gene causal to the RNAiinsensitivity of the CB4856 germline [9]. Importantly, weperformed a detailed genotype-to-phenotype analysis that
RNAi x
y
z
No effect
Emb
Sterile
Current Method: RNAi treatments in ONE genetic background
The FA Method: RNAi treatments in MULTIPLE genetic backgrounds
RNAi x y z
No effect Emb Sterile
No effect No effect Sterile
No effect Emb Sterile
ct NS
Potential of the FA Method: Drug treatments in MULTIPLE genetic backgrounds
-Addresses gene function
-Addresses gene function in relation to genetic backgrounds
t ES
vs vs
-Addresses drug activity in relation to genetic backgrounds
Drug x No effect Emb No effect ct Nvs vs
A
B
C
Figure 1 The usefulness of the Fitness Assay. A) RNAi by feeding in liquid has increased the throughput considerably to address genefunction within a genetic background, but this method remains a qualitative or semi-quantitative method at best. B) The Fitness Assay is amethod that measures the rate at which food is consumed. The Fitness Assay produces quantitative data from RNAi treatments for each geneticbackground tested. These data are then used to address gene function in relation to genetic backgrounds. C) Potentially, the Fitness Assay couldbe adapted to measure the effects of drug treatments on various genetic backgrounds and address drug activity in relation to these geneticbackgrounds.
Elvin et al. BMC Genomics 2011, 12:510http://www.biomedcentral.com/1471-2164/12/510
Page 2 of 14
provides evidence that loss of RNAi sensitivity is a com-plex trait, in which ppw-1 is one of probably severalRNAi sensitivity modifiers. In total, 56 genetic back-grounds were tested using 12 RNAi treatments. Analyz-ing such a number of genetic backgrounds has neverbeen performed before, but critically this is the first timethat quantitative data have been produced for RNAitreatments in C. elegans.
ResultsBristol (N2) and Hawaii (CB4856) respond differently toRNAi treatmentsBristol and Hawaii react very differently when exposed toRNAi. RNAi in Bristol is highly effective, but in HawaiiRNAi sensitivity for germline expressed genes has beenlost [9]. Therefore, we reasoned that our fitness assayshould be ideal to differentiate between these two RNAisensitivity behaviors. For example, if we target an essen-tial gene that functions in the germline, Bristol will die,but not Hawaii. We performed RNAi in both strains on apanel of 12 RNAi clones: four clones (targeting par-1,par-6, pos-1, and mel-26) are known to be more effectivein Bristol than in Hawaii [9]; two clones (targeting rab-5and tag-214) are known to be effective in both naturalisolates [9]; one clone (targeting lin-31) is used as a nega-tive control since it affects vulval development, a non-essential organ for viability [10]; four clones (targetingsmo-1, mpk-1, gld-1, and let-502) have never been testedbefore for comparison between Bristol and Hawaii; andthe empty vector clone is used as a control or a reference.We have analyzed the data generated from the fitnessassay in two ways: i) by comparing each RNAi conditionto the empty vector for each strain and ii) by analyzingwhether Bristol responds differently from Hawaii to spe-cific RNAi treatments.In the first part of the analysis, we found that eight out
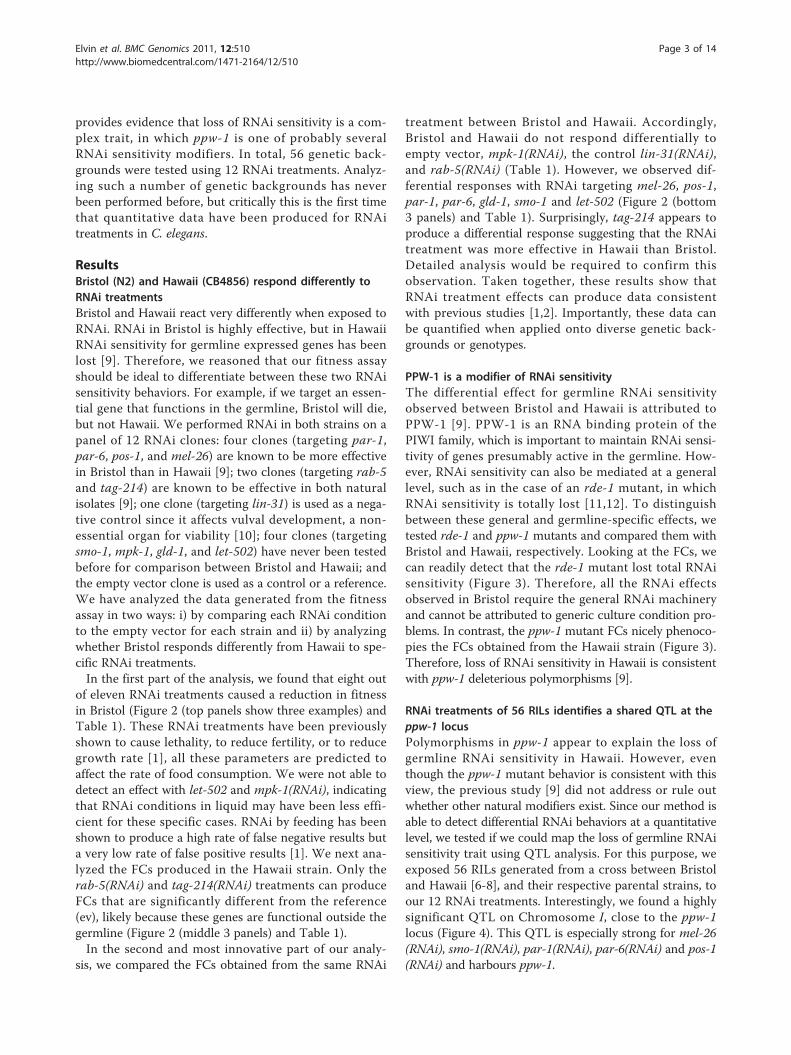
of eleven RNAi treatments caused a reduction in fitnessin Bristol (Figure 2 (top panels show three examples) andTable 1). These RNAi treatments have been previouslyshown to cause lethality, to reduce fertility, or to reducegrowth rate [1], all these parameters are predicted toaffect the rate of food consumption. We were not able todetect an effect with let-502 and mpk-1(RNAi), indicatingthat RNAi conditions in liquid may have been less effi-cient for these specific cases. RNAi by feeding has beenshown to produce a high rate of false negative results buta very low rate of false positive results [1]. We next ana-lyzed the FCs produced in the Hawaii strain. Only therab-5(RNAi) and tag-214(RNAi) treatments can produceFCs that are significantly different from the reference(ev), likely because these genes are functional outside thegermline (Figure 2 (middle 3 panels) and Table 1).In the second and most innovative part of our analy-
sis, we compared the FCs obtained from the same RNAi
treatment between Bristol and Hawaii. Accordingly,Bristol and Hawaii do not respond differentially toempty vector, mpk-1(RNAi), the control lin-31(RNAi),and rab-5(RNAi) (Table 1). However, we observed dif-ferential responses with RNAi targeting mel-26, pos-1,par-1, par-6, gld-1, smo-1 and let-502 (Figure 2 (bottom3 panels) and Table 1). Surprisingly, tag-214 appears toproduce a differential response suggesting that the RNAitreatment was more effective in Hawaii than Bristol.Detailed analysis would be required to confirm thisobservation. Taken together, these results show thatRNAi treatment effects can produce data consistentwith previous studies [1,2]. Importantly, these data canbe quantified when applied onto diverse genetic back-grounds or genotypes.
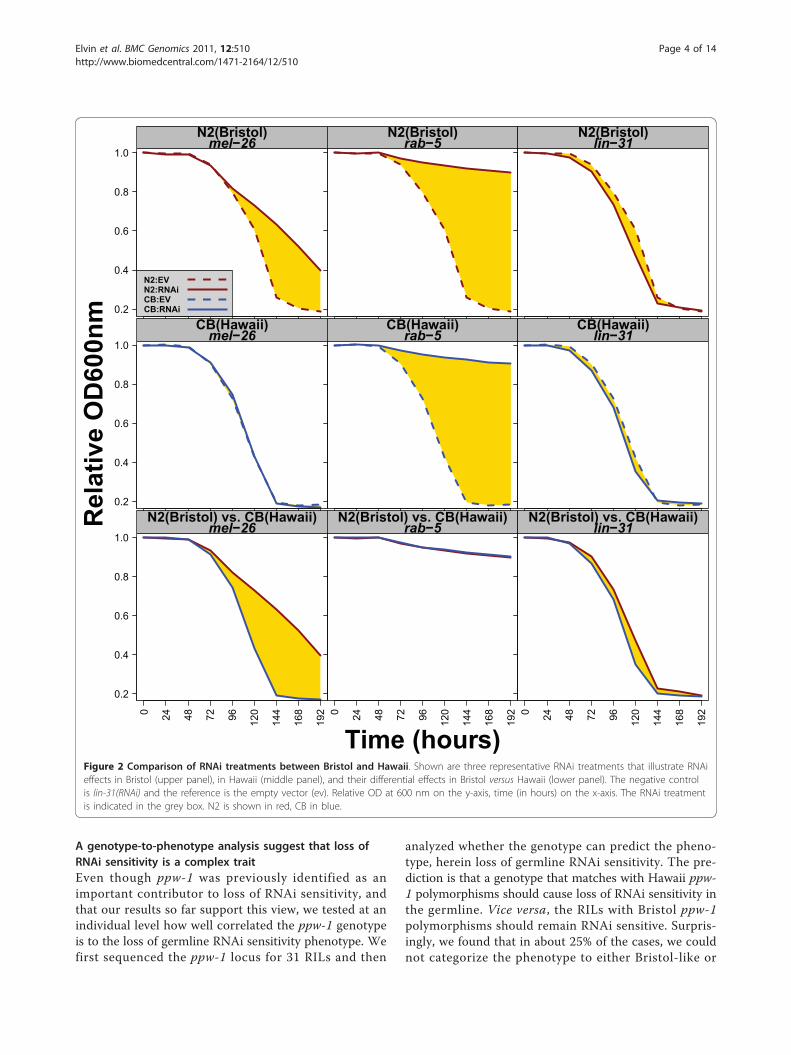
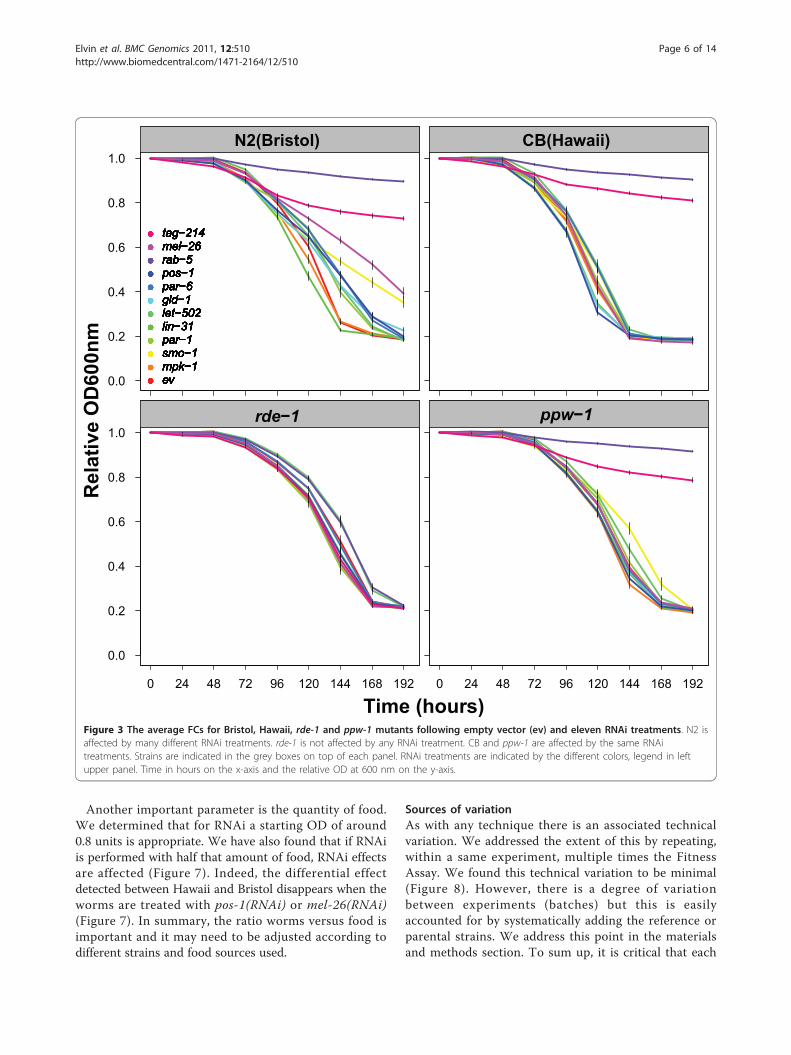
PPW-1 is a modifier of RNAi sensitivityThe differential effect for germline RNAi sensitivityobserved between Bristol and Hawaii is attributed toPPW-1 [9]. PPW-1 is an RNA binding protein of thePIWI family, which is important to maintain RNAi sensi-tivity of genes presumably active in the germline. How-ever, RNAi sensitivity can also be mediated at a generallevel, such as in the case of an rde-1 mutant, in whichRNAi sensitivity is totally lost [11,12]. To distinguishbetween these general and germline-specific effects, wetested rde-1 and ppw-1 mutants and compared them withBristol and Hawaii, respectively. Looking at the FCs, wecan readily detect that the rde-1 mutant lost total RNAisensitivity (Figure 3). Therefore, all the RNAi effectsobserved in Bristol require the general RNAi machineryand cannot be attributed to generic culture condition pro-blems. In contrast, the ppw-1 mutant FCs nicely phenoco-pies the FCs obtained from the Hawaii strain (Figure 3).Therefore, loss of RNAi sensitivity in Hawaii is consistentwith ppw-1 deleterious polymorphisms [9].
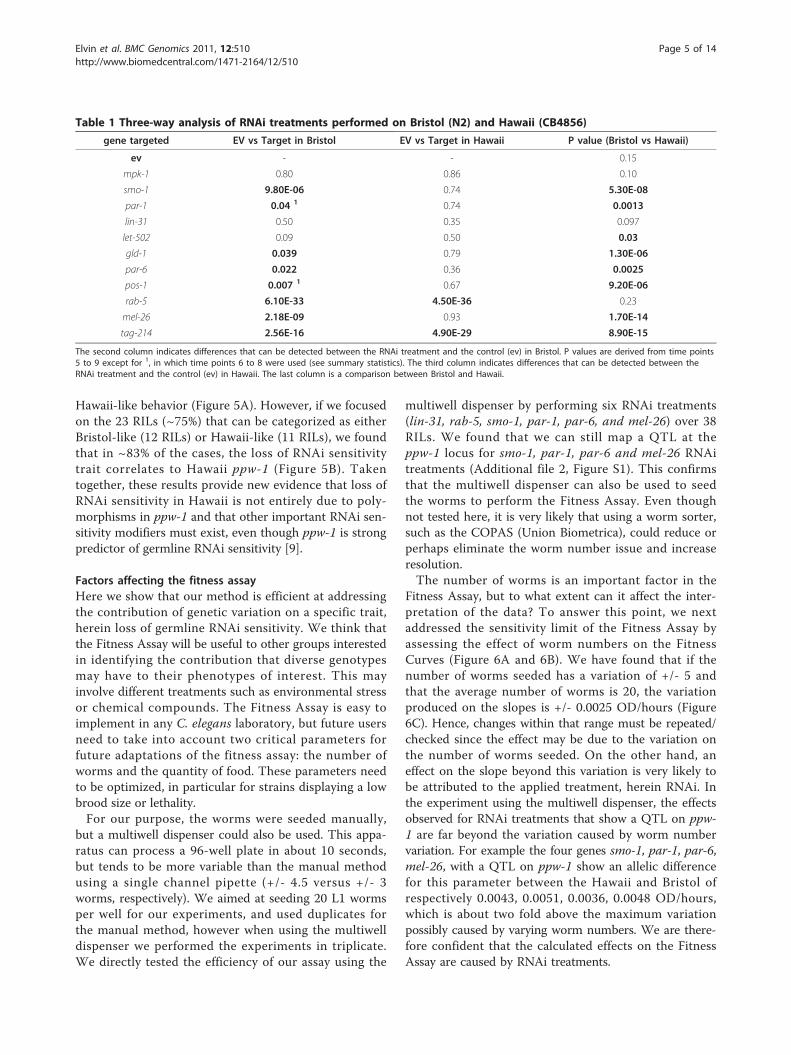
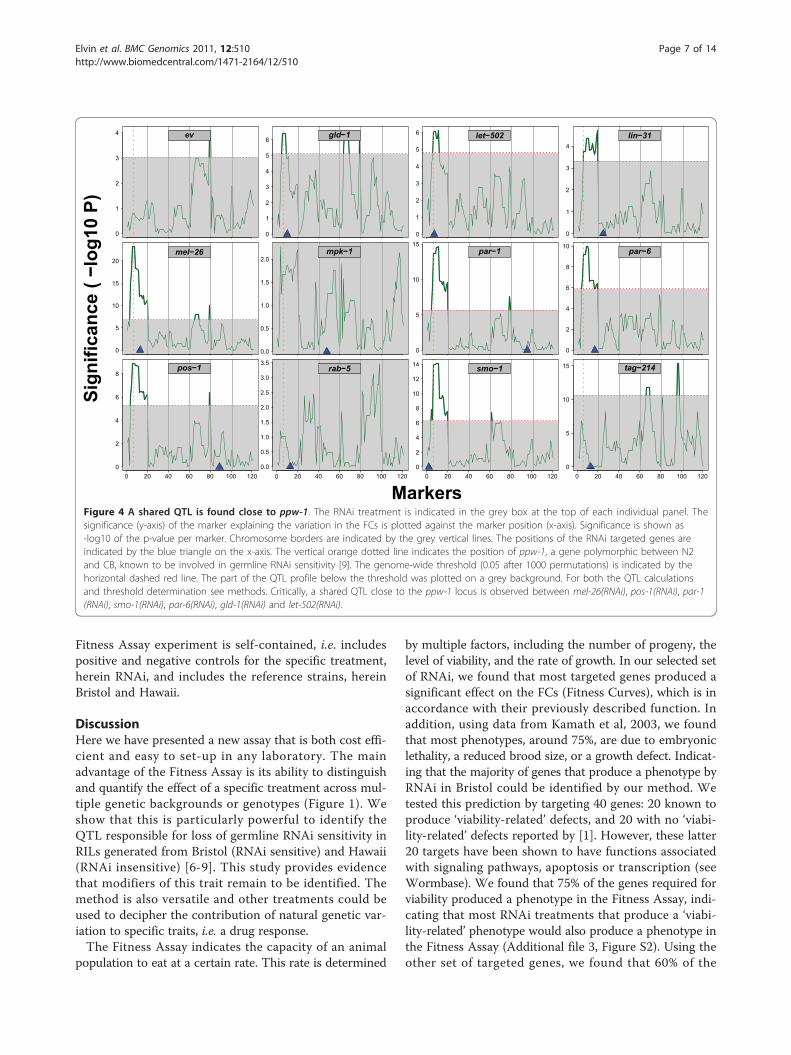
RNAi treatments of 56 RILs identifies a shared QTL at theppw-1 locusPolymorphisms in ppw-1 appear to explain the loss ofgermline RNAi sensitivity in Hawaii. However, eventhough the ppw-1 mutant behavior is consistent with thisview, the previous study [9] did not address or rule outwhether other natural modifiers exist. Since our method isable to detect differential RNAi behaviors at a quantitativelevel, we tested if we could map the loss of germline RNAisensitivity trait using QTL analysis. For this purpose, weexposed 56 RILs generated from a cross between Bristoland Hawaii [6-8], and their respective parental strains, toour 12 RNAi treatments. Interestingly, we found a highlysignificant QTL on Chromosome I, close to the ppw-1locus (Figure 4). This QTL is especially strong for mel-26(RNAi), smo-1(RNAi), par-1(RNAi), par-6(RNAi) and pos-1(RNAi) and harbours ppw-1.
Elvin et al. BMC Genomics 2011, 12:510http://www.biomedcentral.com/1471-2164/12/510
Page 3 of 14
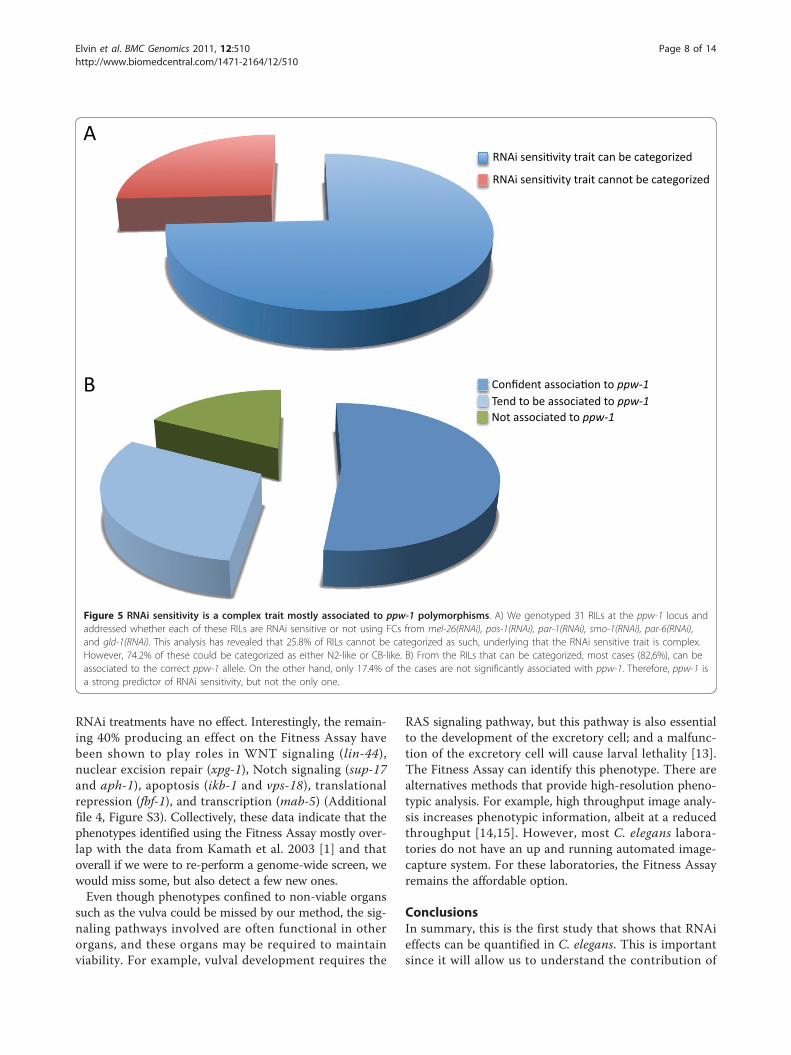
A genotype-to-phenotype analysis suggest that loss ofRNAi sensitivity is a complex traitEven though ppw-1 was previously identified as animportant contributor to loss of RNAi sensitivity, andthat our results so far support this view, we tested at anindividual level how well correlated the ppw-1 genotypeis to the loss of germline RNAi sensitivity phenotype. Wefirst sequenced the ppw-1 locus for 31 RILs and then
analyzed whether the genotype can predict the pheno-type, herein loss of germline RNAi sensitivity. The pre-diction is that a genotype that matches with Hawaii ppw-1 polymorphisms should cause loss of RNAi sensitivity inthe germline. Vice versa, the RILs with Bristol ppw-1polymorphisms should remain RNAi sensitive. Surpris-ingly, we found that in about 25% of the cases, we couldnot categorize the phenotype to either Bristol-like or
0.2
0.4
0.6
0.8
1.0
N2(Bristol)mel 26
N2:EVN2:RNAiCB:EVCB:RNAi
N2(Bristol)rab 5
N2(Bristol)lin 31
0.2
0.4
0.6
0.8
1.0
CB(Hawaii)mel 26
Rel
ativ
e O
D60
0nm CB(Hawaii)
rab 5CB(Hawaii)
lin 31
0 24 48 72 96 120
144
168
192
0.2
0.4
0.6
0.8
1.0
N2(Bristol) vs. CB(Hawaii)mel 26
0 24 48 72 96 120
144
168
192N2(Bristol) vs. CB(Hawaii)
rab 5
Time (hours)
0 24 48 72 96 120
144
168
192
N2(Bristol) vs. CB(Hawaii)lin 31
Figure 2 Comparison of RNAi treatments between Bristol and Hawaii. Shown are three representative RNAi treatments that illustrate RNAieffects in Bristol (upper panel), in Hawaii (middle panel), and their differential effects in Bristol versus Hawaii (lower panel). The negative controlis lin-31(RNAi) and the reference is the empty vector (ev). Relative OD at 600 nm on the y-axis, time (in hours) on the x-axis. The RNAi treatmentis indicated in the grey box. N2 is shown in red, CB in blue.
Elvin et al. BMC Genomics 2011, 12:510http://www.biomedcentral.com/1471-2164/12/510
Page 4 of 14
Hawaii-like behavior (Figure 5A). However, if we focusedon the 23 RILs (~75%) that can be categorized as eitherBristol-like (12 RILs) or Hawaii-like (11 RILs), we foundthat in ~83% of the cases, the loss of RNAi sensitivitytrait correlates to Hawaii ppw-1 (Figure 5B). Takentogether, these results provide new evidence that loss ofRNAi sensitivity in Hawaii is not entirely due to poly-morphisms in ppw-1 and that other important RNAi sen-sitivity modifiers must exist, even though ppw-1 is strongpredictor of germline RNAi sensitivity [9].
Factors affecting the fitness assayHere we show that our method is efficient at addressingthe contribution of genetic variation on a specific trait,herein loss of germline RNAi sensitivity. We think thatthe Fitness Assay will be useful to other groups interestedin identifying the contribution that diverse genotypesmay have to their phenotypes of interest. This mayinvolve different treatments such as environmental stressor chemical compounds. The Fitness Assay is easy toimplement in any C. elegans laboratory, but future usersneed to take into account two critical parameters forfuture adaptations of the fitness assay: the number ofworms and the quantity of food. These parameters needto be optimized, in particular for strains displaying a lowbrood size or lethality.For our purpose, the worms were seeded manually,
but a multiwell dispenser could also be used. This appa-ratus can process a 96-well plate in about 10 seconds,but tends to be more variable than the manual methodusing a single channel pipette (+/- 4.5 versus +/- 3worms, respectively). We aimed at seeding 20 L1 wormsper well for our experiments, and used duplicates forthe manual method, however when using the multiwelldispenser we performed the experiments in triplicate.We directly tested the efficiency of our assay using the
multiwell dispenser by performing six RNAi treatments(lin-31, rab-5, smo-1, par-1, par-6, and mel-26) over 38RILs. We found that we can still map a QTL at theppw-1 locus for smo-1, par-1, par-6 and mel-26 RNAitreatments (Additional file 2, Figure S1). This confirmsthat the multiwell dispenser can also be used to seedthe worms to perform the Fitness Assay. Even thoughnot tested here, it is very likely that using a worm sorter,such as the COPAS (Union Biometrica), could reduce orperhaps eliminate the worm number issue and increaseresolution.The number of worms is an important factor in the
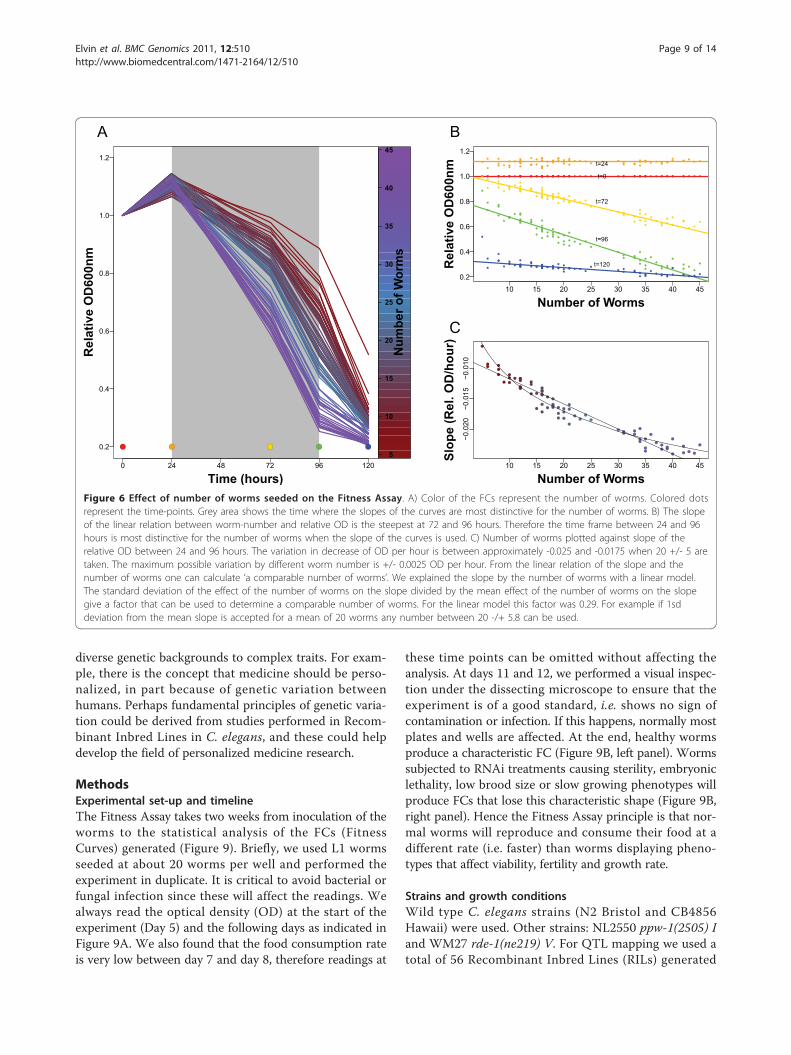
Fitness Assay, but to what extent can it affect the inter-pretation of the data? To answer this point, we nextaddressed the sensitivity limit of the Fitness Assay byassessing the effect of worm numbers on the FitnessCurves (Figure 6A and 6B). We have found that if thenumber of worms seeded has a variation of +/- 5 andthat the average number of worms is 20, the variationproduced on the slopes is +/- 0.0025 OD/hours (Figure6C). Hence, changes within that range must be repeated/checked since the effect may be due to the variation onthe number of worms seeded. On the other hand, aneffect on the slope beyond this variation is very likely tobe attributed to the applied treatment, herein RNAi. Inthe experiment using the multiwell dispenser, the effectsobserved for RNAi treatments that show a QTL on ppw-1 are far beyond the variation caused by worm numbervariation. For example the four genes smo-1, par-1, par-6,mel-26, with a QTL on ppw-1 show an allelic differencefor this parameter between the Hawaii and Bristol ofrespectively 0.0043, 0.0051, 0.0036, 0.0048 OD/hours,which is about two fold above the maximum variationpossibly caused by varying worm numbers. We are there-fore confident that the calculated effects on the FitnessAssay are caused by RNAi treatments.
Table 1 Three-way analysis of RNAi treatments performed on Bristol (N2) and Hawaii (CB4856)
gene targeted EV vs Target in Bristol EV vs Target in Hawaii P value (Bristol vs Hawaii)
ev - - 0.15
mpk-1 0.80 0.86 0.10
smo-1 9.80E-06 0.74 5.30E-08
par-1 0.04 1 0.74 0.0013
lin-31 0.50 0.35 0.097
let-502 0.09 0.50 0.03
gld-1 0.039 0.79 1.30E-06
par-6 0.022 0.36 0.0025
pos-1 0.007 1 0.67 9.20E-06
rab-5 6.10E-33 4.50E-36 0.23
mel-26 2.18E-09 0.93 1.70E-14
tag-214 2.56E-16 4.90E-29 8.90E-15
The second column indicates differences that can be detected between the RNAi treatment and the control (ev) in Bristol. P values are derived from time points5 to 9 except for 1, in which time points 6 to 8 were used (see summary statistics). The third column indicates differences that can be detected between theRNAi treatment and the control (ev) in Hawaii. The last column is a comparison between Bristol and Hawaii.
Elvin et al. BMC Genomics 2011, 12:510http://www.biomedcentral.com/1471-2164/12/510
Page 5 of 14
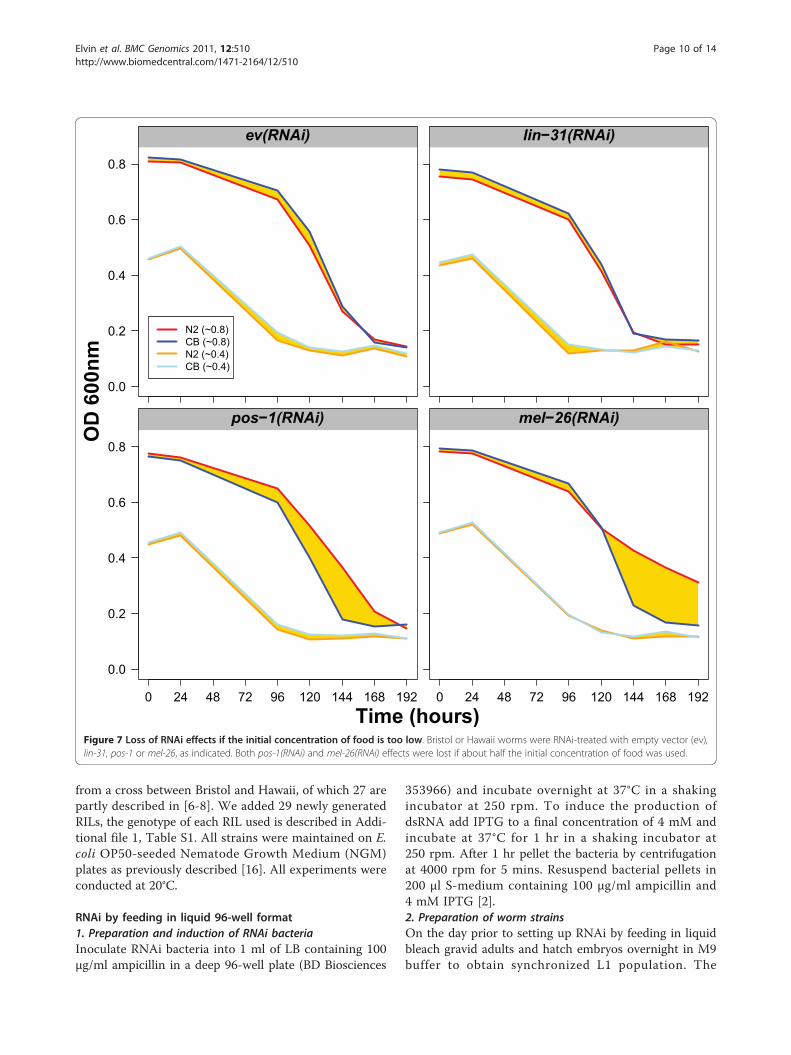
Another important parameter is the quantity of food.We determined that for RNAi a starting OD of around0.8 units is appropriate. We have also found that if RNAiis performed with half that amount of food, RNAi effectsare affected (Figure 7). Indeed, the differential effectdetected between Hawaii and Bristol disappears when theworms are treated with pos-1(RNAi) or mel-26(RNAi)(Figure 7). In summary, the ratio worms versus food isimportant and it may need to be adjusted according todifferent strains and food sources used.
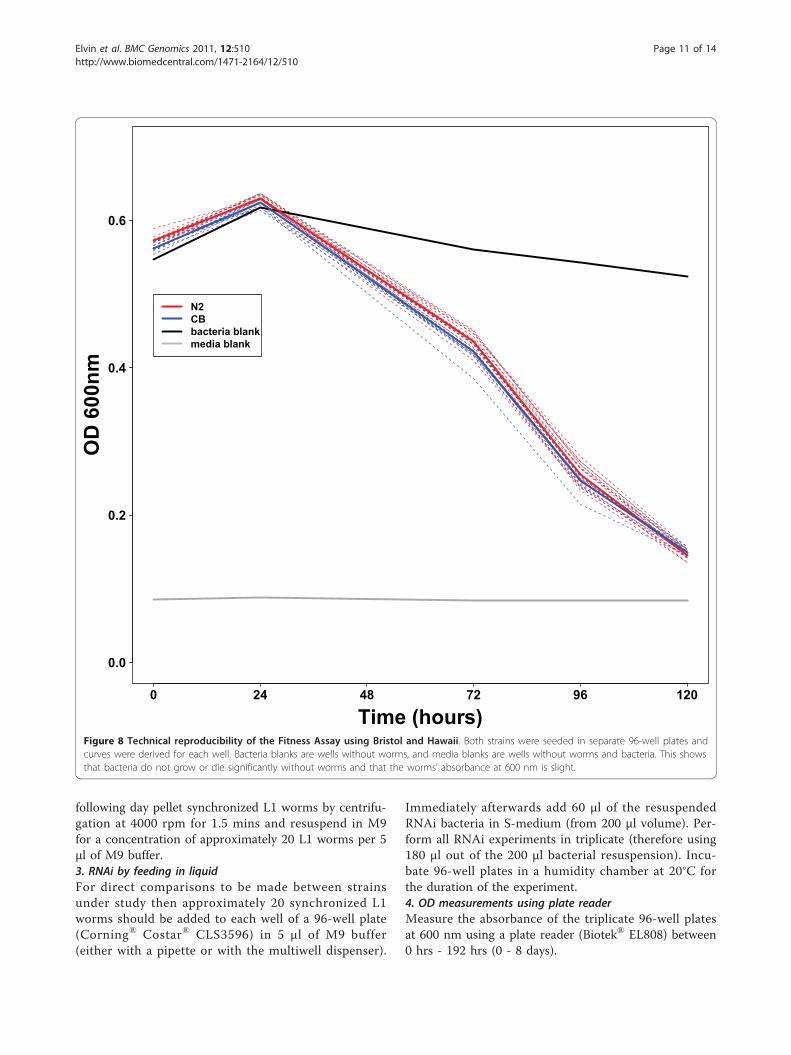
Sources of variationAs with any technique there is an associated technicalvariation. We addressed the extent of this by repeating,within a same experiment, multiple times the FitnessAssay. We found this technical variation to be minimal(Figure 8). However, there is a degree of variationbetween experiments (batches) but this is easilyaccounted for by systematically adding the reference orparental strains. We address this point in the materialsand methods section. To sum up, it is critical that each
0.0
0.2
0.4
0.6
0.8
1.0N2(Bristol)
●
●
●
●
●
●
●
●
●
●
●
●
evmpk 1smo 1par 1lin 31let 502gld 1par 6pos 1rab 5mel 26tag 214
●
●
●
●
●
●
●
●
●
●
●
●
evmpk 1smo 1par 1lin 31let 502gld 1par 6pos 1rab 5mel 26tag 214
●
●
●
●
●
●
●
●
●
●
●
●
evmpk 1smo 1par 1lin 31let 502gld 1par 6pos 1rab 5mel 26tag 214
●
●
●
●
●
●
●
●
●
●
●
●
evmpk 1smo 1par 1lin 31let 502gld 1par 6pos 1rab 5mel 26tag 214
●
●
●
●
●
●
●
●
●
●
●
●
evmpk 1smo 1par 1lin 31let 502gld 1par 6pos 1rab 5mel 26tag 214
●
●
●
●
●
●
●
●
●
●
●
●
evmpk 1smo 1par 1lin 31let 502gld 1par 6pos 1rab 5mel 26tag 214
●
●
●
●
●
●
●
●
●
●
●
●
evmpk 1smo 1par 1lin 31let 502gld 1par 6pos 1rab 5mel 26tag 214
●
●
●
●
●
●
●
●
●
●
●
●
evmpk 1smo 1par 1lin 31let 502gld 1par 6pos 1rab 5mel 26tag 214
●
●
●
●
●
●
●
●
●
●
●
●
evmpk 1smo 1par 1lin 31let 502gld 1par 6pos 1rab 5mel 26tag 214
●
●
●
●
●
●
●
●
●
●
●
●
evmpk 1smo 1par 1lin 31let 502gld 1par 6pos 1rab 5mel 26tag 214
●
●
●
●
●
●
●
●
●
●
●
●
evmpk 1smo 1par 1lin 31let 502gld 1par 6pos 1rab 5mel 26tag 214
●
●
●
●
●
●
●
●
●
●
●
●
evmpk 1smo 1par 1lin 31let 502gld 1par 6pos 1rab 5mel 26tag 214
CB(Hawaii)
0 24 48 72 96 120 144 168 192
0.0
0.2
0.4
0.6
0.8
1.0
Rel
ativ
e O
D60
0nm
rde 1
0 24 48 72 96 120 144 168 192
Time (hours)
ppw 1
Figure 3 The average FCs for Bristol, Hawaii, rde-1 and ppw-1 mutants following empty vector (ev) and eleven RNAi treatments. N2 isaffected by many different RNAi treatments. rde-1 is not affected by any RNAi treatment. CB and ppw-1 are affected by the same RNAitreatments. Strains are indicated in the grey boxes on top of each panel. RNAi treatments are indicated by the different colors, legend in leftupper panel. Time in hours on the x-axis and the relative OD at 600 nm on the y-axis.
Elvin et al. BMC Genomics 2011, 12:510http://www.biomedcentral.com/1471-2164/12/510
Page 6 of 14
Fitness Assay experiment is self-contained, i.e. includespositive and negative controls for the specific treatment,herein RNAi, and includes the reference strains, hereinBristol and Hawaii.
DiscussionHere we have presented a new assay that is both cost effi-cient and easy to set-up in any laboratory. The mainadvantage of the Fitness Assay is its ability to distinguishand quantify the effect of a specific treatment across mul-tiple genetic backgrounds or genotypes (Figure 1). Weshow that this is particularly powerful to identify theQTL responsible for loss of germline RNAi sensitivity inRILs generated from Bristol (RNAi sensitive) and Hawaii(RNAi insensitive) [6-9]. This study provides evidencethat modifiers of this trait remain to be identified. Themethod is also versatile and other treatments could beused to decipher the contribution of natural genetic var-iation to specific traits, i.e. a drug response.The Fitness Assay indicates the capacity of an animal
population to eat at a certain rate. This rate is determined
by multiple factors, including the number of progeny, thelevel of viability, and the rate of growth. In our selected setof RNAi, we found that most targeted genes produced asignificant effect on the FCs (Fitness Curves), which is inaccordance with their previously described function. Inaddition, using data from Kamath et al, 2003, we foundthat most phenotypes, around 75%, are due to embryoniclethality, a reduced brood size, or a growth defect. Indicat-ing that the majority of genes that produce a phenotype byRNAi in Bristol could be identified by our method. Wetested this prediction by targeting 40 genes: 20 known toproduce ‘viability-related’ defects, and 20 with no ‘viabi-lity-related’ defects reported by [1]. However, these latter20 targets have been shown to have functions associatedwith signaling pathways, apoptosis or transcription (seeWormbase). We found that 75% of the genes required forviability produced a phenotype in the Fitness Assay, indi-cating that most RNAi treatments that produce a ‘viabi-lity-related’ phenotype would also produce a phenotype inthe Fitness Assay (Additional file 3, Figure S2). Using theother set of targeted genes, we found that 60% of the
ev
0
1
2
3
4 gld 1
0
1
2
3
4
5
6 let 502
0
1
2
3
4
5
6 lin 31
0
1
2
3
4
mel 26
Sign
ifica
nce
( lo
g10
P)
0
5
10
15
20mpk 1
0.0
0.5
1.0
1.5
2.0par 1
0
5
10
15par 6
0
2
4
6
8
10
pos 1
0 20 40 60 80 100 1200
2
4
6
8rab 5
0 20 40 60 80 100 1200.0
0.5
1.0
1.5
2.0
2.5
3.0
3.5smo 1
0 20 40 60 80 100 1200
2
4
6
8
10
12
14
Markers
tag 214
0 20 40 60 80 100 1200
5
10
15
Figure 4 A shared QTL is found close to ppw-1. The RNAi treatment is indicated in the grey box at the top of each individual panel. Thesignificance (y-axis) of the marker explaining the variation in the FCs is plotted against the marker position (x-axis). Significance is shown as-log10 of the p-value per marker. Chromosome borders are indicated by the grey vertical lines. The positions of the RNAi targeted genes areindicated by the blue triangle on the x-axis. The vertical orange dotted line indicates the position of ppw-1, a gene polymorphic between N2and CB, known to be involved in germline RNAi sensitivity [9]. The genome-wide threshold (0.05 after 1000 permutations) is indicated by thehorizontal dashed red line. The part of the QTL profile below the threshold was plotted on a grey background. For both the QTL calculationsand threshold determination see methods. Critically, a shared QTL close to the ppw-1 locus is observed between mel-26(RNAi), pos-1(RNAi), par-1(RNAi), smo-1(RNAi), par-6(RNAi), gld-1(RNAi) and let-502(RNAi).
Elvin et al. BMC Genomics 2011, 12:510http://www.biomedcentral.com/1471-2164/12/510
Page 7 of 14
RNAi treatments have no effect. Interestingly, the remain-ing 40% producing an effect on the Fitness Assay havebeen shown to play roles in WNT signaling (lin-44),nuclear excision repair (xpg-1), Notch signaling (sup-17and aph-1), apoptosis (ikb-1 and vps-18), translationalrepression (fbf-1), and transcription (mab-5) (Additionalfile 4, Figure S3). Collectively, these data indicate that thephenotypes identified using the Fitness Assay mostly over-lap with the data from Kamath et al. 2003 [1] and thatoverall if we were to re-perform a genome-wide screen, wewould miss some, but also detect a few new ones.Even though phenotypes confined to non-viable organs
such as the vulva could be missed by our method, the sig-naling pathways involved are often functional in otherorgans, and these organs may be required to maintainviability. For example, vulval development requires the
RAS signaling pathway, but this pathway is also essentialto the development of the excretory cell; and a malfunc-tion of the excretory cell will cause larval lethality [13].The Fitness Assay can identify this phenotype. There arealternatives methods that provide high-resolution pheno-typic analysis. For example, high throughput image analy-sis increases phenotypic information, albeit at a reducedthroughput [14,15]. However, most C. elegans labora-tories do not have an up and running automated image-capture system. For these laboratories, the Fitness Assayremains the affordable option.
ConclusionsIn summary, this is the first study that shows that RNAieffects can be quantified in C. elegans. This is importantsince it will allow us to understand the contribution of
Figure 5 RNAi sensitivity is a complex trait mostly associated to ppw-1 polymorphisms. A) We genotyped 31 RILs at the ppw-1 locus andaddressed whether each of these RILs are RNAi sensitive or not using FCs from mel-26(RNAi), pos-1(RNAi), par-1(RNAi), smo-1(RNAi), par-6(RNAi),and gld-1(RNAi). This analysis has revealed that 25.8% of RILs cannot be categorized as such, underlying that the RNAi sensitive trait is complex.However, 74.2% of these could be categorized as either N2-like or CB-like. B) From the RILs that can be categorized, most cases (82,6%), can beassociated to the correct ppw-1 allele. On the other hand, only 17.4% of the cases are not significantly associated with ppw-1. Therefore, ppw-1 isa strong predictor of RNAi sensitivity, but not the only one.
Elvin et al. BMC Genomics 2011, 12:510http://www.biomedcentral.com/1471-2164/12/510
Page 8 of 14
diverse genetic backgrounds to complex traits. For exam-ple, there is the concept that medicine should be perso-nalized, in part because of genetic variation betweenhumans. Perhaps fundamental principles of genetic varia-tion could be derived from studies performed in Recom-binant Inbred Lines in C. elegans, and these could helpdevelop the field of personalized medicine research.
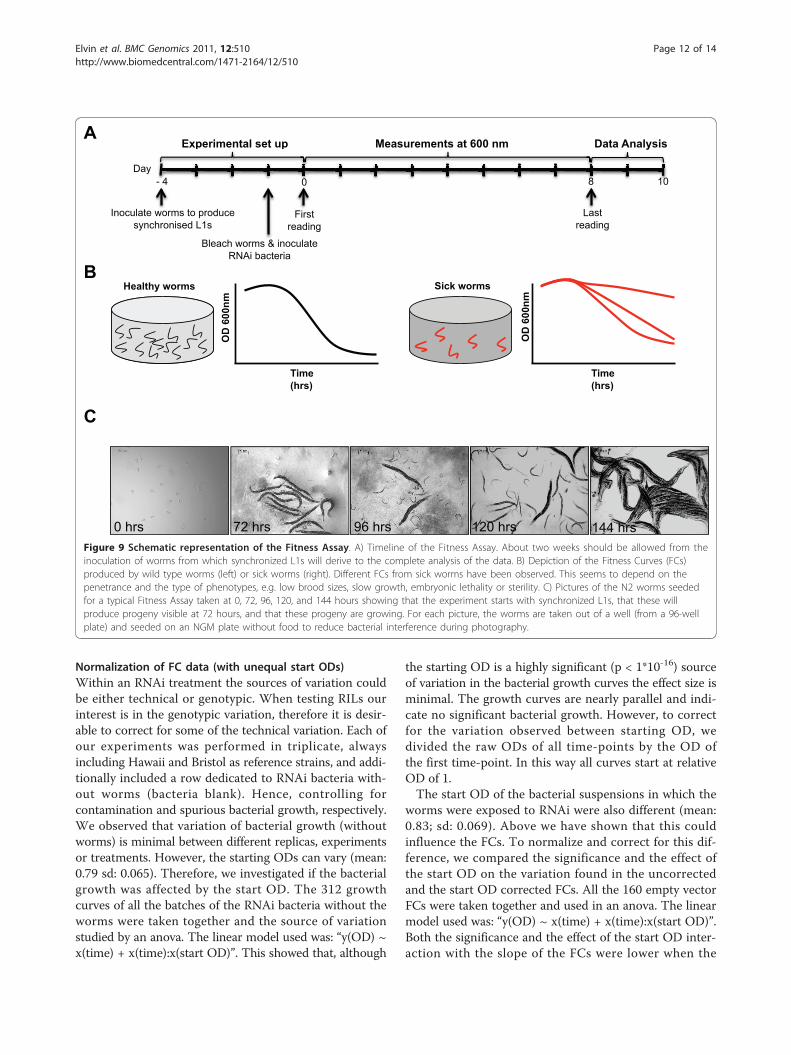
MethodsExperimental set-up and timelineThe Fitness Assay takes two weeks from inoculation of theworms to the statistical analysis of the FCs (FitnessCurves) generated (Figure 9). Briefly, we used L1 wormsseeded at about 20 worms per well and performed theexperiment in duplicate. It is critical to avoid bacterial orfungal infection since these will affect the readings. Wealways read the optical density (OD) at the start of theexperiment (Day 5) and the following days as indicated inFigure 9A. We also found that the food consumption rateis very low between day 7 and day 8, therefore readings at
these time points can be omitted without affecting theanalysis. At days 11 and 12, we performed a visual inspec-tion under the dissecting microscope to ensure that theexperiment is of a good standard, i.e. shows no sign ofcontamination or infection. If this happens, normally mostplates and wells are affected. At the end, healthy wormsproduce a characteristic FC (Figure 9B, left panel). Wormssubjected to RNAi treatments causing sterility, embryoniclethality, low brood size or slow growing phenotypes willproduce FCs that lose this characteristic shape (Figure 9B,right panel). Hence the Fitness Assay principle is that nor-mal worms will reproduce and consume their food at adifferent rate (i.e. faster) than worms displaying pheno-types that affect viability, fertility and growth rate.
Strains and growth conditionsWild type C. elegans strains (N2 Bristol and CB4856Hawaii) were used. Other strains: NL2550 ppw-1(2505) Iand WM27 rde-1(ne219) V. For QTL mapping we used atotal of 56 Recombinant Inbred Lines (RILs) generated
Time (hours)
Rel
ativ
e O
D60
0nm
0 24 48 72 96 120
0.2
0.4
0.6
0.8
1.0
1.2
● ● ● ● ●
A
5
10
15
20
25
30
35
40
45
Num
ber o
f Wor
ms
● ●●● ●● ●● ● ●● ●●● ●● ● ● ●● ● ●●● ● ● ●● ●● ●●● ●●●●●● ● ●● ●● ● ●● ● ●●●● ● ●●● ● ● ● ● ● ●●● ● ● ●● ●● ●●
Number of Worms
Rel
ativ
e O
D60
0nm
10 15 20 25 30 35 40 45
0.2
0.4
0.6
0.8
1.0
1.2
●
●●● ●●
●
● ●●●
●●
●●●
● ● ●● ● ●●
●● ●
●●
●● ●
●● ●●
●●●
● ●●● ●● ● ●
●
●●
●●●● ●●
●● ●
●
●●
●●
● ●●
●● ●●●
●
●●
●
●●
●
●●
● ●
●●
●
●
●●
●● ●
●
● ●
●●
● ●
●●
●
●
●
●
●
●
●
●
●●
●
●
●
●
●
●●
●●
●
●
●●
●
●
●
●
●●
● ●
●
●
●●
●
●
●●
●●
●
●
●
●
●●
●●
●
●●
●●
● ●
●
●
●
●
● ● ●
●
● ●
●●
●●
●
●
●
●
●●
●
●●
●
●●
●
●
●
●
●
●
●
●
●
●
●
●●
●
●
●
●
●●
●
●
●
●
●●
●
●●
●●
●
●
●●●
●●
●
●
●
●●
●●●
●●
●
●● ● ●
●●
●●●
●
● ●●
●
●●
●●●
●●●
●●
●
●●
●
●
●
●●● ● ●
●●●● ●●● ● ●
●
● ● ●●●
● ● ●● ●●●●
B
t=0
t=24
t=72
t=96
t=120
●
●●
●●
●
●
●
●
●●
●●
●
●●
●● ●
●
● ●
●
●
●●
●
●
●
●
●●
●
●●
●
●●
●
●
●
●
●
●
●
●
● ●
●
●●
●
●
●
●
●●
●
● ●
●
●●
●
●
●
●● ●
●
●
●
Number of Worms
Slop
e (R
el. O
D/h
our)
10 15 20 25 30 35 40 450.
020
0.01
50.
010
C
Figure 6 Effect of number of worms seeded on the Fitness Assay. A) Color of the FCs represent the number of worms. Colored dotsrepresent the time-points. Grey area shows the time where the slopes of the curves are most distinctive for the number of worms. B) The slopeof the linear relation between worm-number and relative OD is the steepest at 72 and 96 hours. Therefore the time frame between 24 and 96hours is most distinctive for the number of worms when the slope of the curves is used. C) Number of worms plotted against slope of therelative OD between 24 and 96 hours. The variation in decrease of OD per hour is between approximately -0.025 and -0.0175 when 20 +/- 5 aretaken. The maximum possible variation by different worm number is +/- 0.0025 OD per hour. From the linear relation of the slope and thenumber of worms one can calculate ‘a comparable number of worms’. We explained the slope by the number of worms with a linear model.The standard deviation of the effect of the number of worms on the slope divided by the mean effect of the number of worms on the slopegive a factor that can be used to determine a comparable number of worms. For the linear model this factor was 0.29. For example if 1sddeviation from the mean slope is accepted for a mean of 20 worms any number between 20 -/+ 5.8 can be used.
Elvin et al. BMC Genomics 2011, 12:510http://www.biomedcentral.com/1471-2164/12/510
Page 9 of 14
from a cross between Bristol and Hawaii, of which 27 arepartly described in [6-8]. We added 29 newly generatedRILs, the genotype of each RIL used is described in Addi-tional file 1, Table S1. All strains were maintained on E.coli OP50-seeded Nematode Growth Medium (NGM)plates as previously described [16]. All experiments wereconducted at 20°C.
RNAi by feeding in liquid 96-well format1. Preparation and induction of RNAi bacteriaInoculate RNAi bacteria into 1 ml of LB containing 100μg/ml ampicillin in a deep 96-well plate (BD Biosciences
353966) and incubate overnight at 37°C in a shakingincubator at 250 rpm. To induce the production ofdsRNA add IPTG to a final concentration of 4 mM andincubate at 37°C for 1 hr in a shaking incubator at250 rpm. After 1 hr pellet the bacteria by centrifugationat 4000 rpm for 5 mins. Resuspend bacterial pellets in200 μl S-medium containing 100 μg/ml ampicillin and4 mM IPTG [2].2. Preparation of worm strainsOn the day prior to setting up RNAi by feeding in liquidbleach gravid adults and hatch embryos overnight in M9buffer to obtain synchronized L1 population. The
0.0
0.2
0.4
0.6
0.8
N2 (~0.8)CB (~0.8)N2 (~0.4)CB (~0.4)
ev(RNAi) lin 31(RNAi)
0 24 48 72 96 120 144 168 192
0.0
0.2
0.4
0.6
0.8
OD
600
nm
Time (hours)
pos 1(RNAi)
0 24 48 72 96 120 144 168 192
mel 26(RNAi)
Figure 7 Loss of RNAi effects if the initial concentration of food is too low. Bristol or Hawaii worms were RNAi-treated with empty vector (ev),lin-31, pos-1 or mel-26, as indicated. Both pos-1(RNAi) and mel-26(RNAi) effects were lost if about half the initial concentration of food was used.
Elvin et al. BMC Genomics 2011, 12:510http://www.biomedcentral.com/1471-2164/12/510
Page 10 of 14
following day pellet synchronized L1 worms by centrifu-gation at 4000 rpm for 1.5 mins and resuspend in M9for a concentration of approximately 20 L1 worms per 5μl of M9 buffer.3. RNAi by feeding in liquidFor direct comparisons to be made between strainsunder study then approximately 20 synchronized L1worms should be added to each well of a 96-well plate(Corning® Costar® CLS3596) in 5 μl of M9 buffer(either with a pipette or with the multiwell dispenser).
Immediately afterwards add 60 μl of the resuspendedRNAi bacteria in S-medium (from 200 μl volume). Per-form all RNAi experiments in triplicate (therefore using180 μl out of the 200 μl bacterial resuspension). Incu-bate 96-well plates in a humidity chamber at 20°C forthe duration of the experiment.4. OD measurements using plate readerMeasure the absorbance of the triplicate 96-well platesat 600 nm using a plate reader (Biotek® EL808) between0 hrs - 192 hrs (0 - 8 days).
Time (hours)
OD
600
nm
0 24 48 72 96 120
0.0
0.2
0.4
0.6
N2CBbacteria blank media blank
Figure 8 Technical reproducibility of the Fitness Assay using Bristol and Hawaii. Both strains were seeded in separate 96-well plates andcurves were derived for each well. Bacteria blanks are wells without worms, and media blanks are wells without worms and bacteria. This showsthat bacteria do not grow or die significantly without worms and that the worms’ absorbance at 600 nm is slight.
Elvin et al. BMC Genomics 2011, 12:510http://www.biomedcentral.com/1471-2164/12/510
Page 11 of 14
Normalization of FC data (with unequal start ODs)Within an RNAi treatment the sources of variation couldbe either technical or genotypic. When testing RILs ourinterest is in the genotypic variation, therefore it is desir-able to correct for some of the technical variation. Each ofour experiments was performed in triplicate, alwaysincluding Hawaii and Bristol as reference strains, and addi-tionally included a row dedicated to RNAi bacteria with-out worms (bacteria blank). Hence, controlling forcontamination and spurious bacterial growth, respectively.We observed that variation of bacterial growth (withoutworms) is minimal between different replicas, experimentsor treatments. However, the starting ODs can vary (mean:0.79 sd: 0.065). Therefore, we investigated if the bacterialgrowth was affected by the start OD. The 312 growthcurves of all the batches of the RNAi bacteria without theworms were taken together and the source of variationstudied by an anova. The linear model used was: “y(OD) ~x(time) + x(time):x(start OD)”. This showed that, although
the starting OD is a highly significant (p < 1*10-16) sourceof variation in the bacterial growth curves the effect size isminimal. The growth curves are nearly parallel and indi-cate no significant bacterial growth. However, to correctfor the variation observed between starting OD, wedivided the raw ODs of all time-points by the OD ofthe first time-point. In this way all curves start at relativeOD of 1.The start OD of the bacterial suspensions in which the
worms were exposed to RNAi were also different (mean:0.83; sd: 0.069). Above we have shown that this couldinfluence the FCs. To normalize and correct for this dif-ference, we compared the significance and the effect ofthe start OD on the variation found in the uncorrectedand the start OD corrected FCs. All the 160 empty vectorFCs were taken together and used in an anova. The linearmodel used was: “y(OD) ~ x(time) + x(time):x(start OD)”.Both the significance and the effect of the start OD inter-action with the slope of the FCs were lower when the
Measurements at 600 nm Data Analysis Experimental set up
Inoculate worms to produce synchronised L1s
First reading
Last reading
A
Healthy worms
OD
600
nm
Time (hrs)
Sick worms B
OD
600
nm
Time (hrs)
e worm
p p y
Fi t
Bleach worms & inoculate RNAi bacteria
Last
Day - 4 0 8 10 4
C
0 hrs 72 hrs 96 hrs 120 hrs 144 hrs Figure 9 Schematic representation of the Fitness Assay. A) Timeline of the Fitness Assay. About two weeks should be allowed from theinoculation of worms from which synchronized L1s will derive to the complete analysis of the data. B) Depiction of the Fitness Curves (FCs)produced by wild type worms (left) or sick worms (right). Different FCs from sick worms have been observed. This seems to depend on thepenetrance and the type of phenotypes, e.g. low brood sizes, slow growth, embryonic lethality or sterility. C) Pictures of the N2 worms seededfor a typical Fitness Assay taken at 0, 72, 96, 120, and 144 hours showing that the experiment starts with synchronized L1s, that these willproduce progeny visible at 72 hours, and that these progeny are growing. For each picture, the worms are taken out of a well (from a 96-wellplate) and seeded on an NGM plate without food to reduce bacterial interference during photography.
Elvin et al. BMC Genomics 2011, 12:510http://www.biomedcentral.com/1471-2164/12/510
Page 12 of 14
FCs were corrected by dividing by the start OD (sig:1.8*10-28 ® 5.6*10-8 ; eff: 5.4*10-3 ® 3.0*10-3). A similarreduction of the role of the start OD was found after cor-rection for specific RNAi used (data not shown).We further investigated the effect of the correction of
the ODs on genotype as an explanatory factor for thevariation in the feeding curves. All the RNAi data wasanalyzed together in an anova. The model used in theanova was: “y(OD) ~ x(time) + x(genotype) + x(RNAi) +x(time):x(start OD)”. The start OD is far less significantafter correction whereas the genotype as source of thevariation is as significant as when the uncorrected valuesare used. We conclude that it is best to start with equalamounts of food (start OD) but since this is not alwayspossible, it is beneficial to correct for the start OD whenanalyzing the feeding rate dynamics.
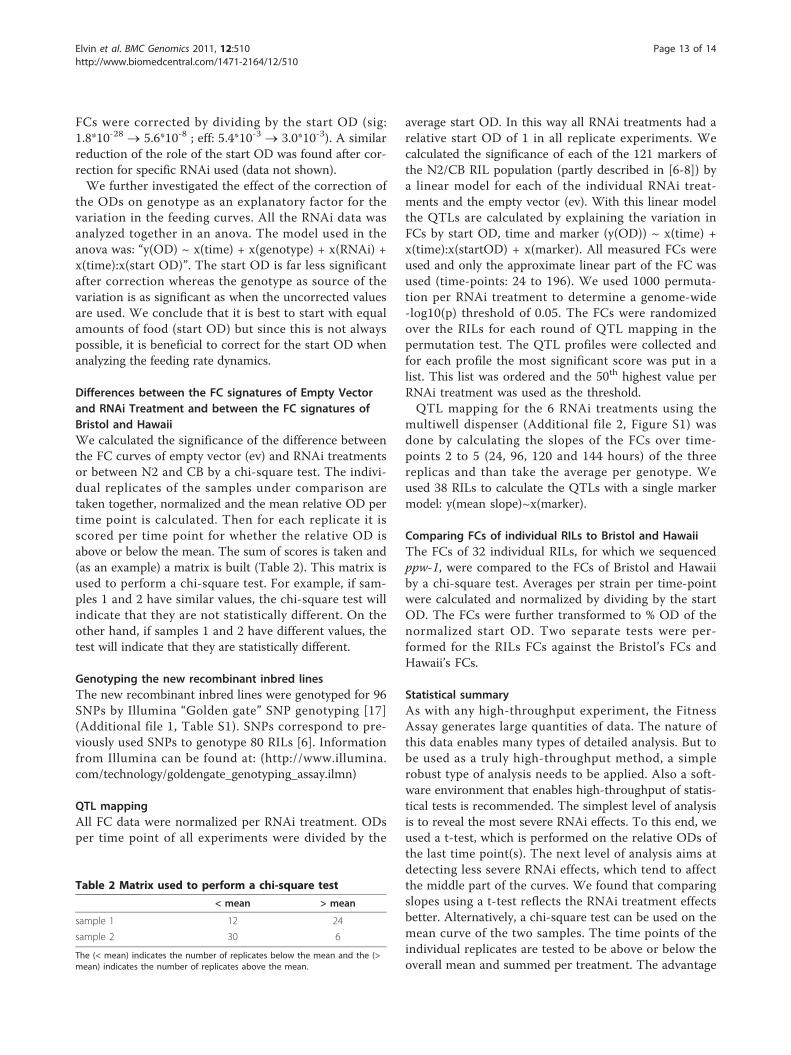
Differences between the FC signatures of Empty Vectorand RNAi Treatment and between the FC signatures ofBristol and HawaiiWe calculated the significance of the difference betweenthe FC curves of empty vector (ev) and RNAi treatmentsor between N2 and CB by a chi-square test. The indivi-dual replicates of the samples under comparison aretaken together, normalized and the mean relative OD pertime point is calculated. Then for each replicate it isscored per time point for whether the relative OD isabove or below the mean. The sum of scores is taken and(as an example) a matrix is built (Table 2). This matrix isused to perform a chi-square test. For example, if sam-ples 1 and 2 have similar values, the chi-square test willindicate that they are not statistically different. On theother hand, if samples 1 and 2 have different values, thetest will indicate that they are statistically different.
Genotyping the new recombinant inbred linesThe new recombinant inbred lines were genotyped for 96SNPs by Illumina “Golden gate” SNP genotyping [17](Additional file 1, Table S1). SNPs correspond to pre-viously used SNPs to genotype 80 RILs [6]. Informationfrom Illumina can be found at: (http://www.illumina.com/technology/goldengate_genotyping_assay.ilmn)
QTL mappingAll FC data were normalized per RNAi treatment. ODsper time point of all experiments were divided by the
average start OD. In this way all RNAi treatments had arelative start OD of 1 in all replicate experiments. Wecalculated the significance of each of the 121 markers ofthe N2/CB RIL population (partly described in [6-8]) bya linear model for each of the individual RNAi treat-ments and the empty vector (ev). With this linear modelthe QTLs are calculated by explaining the variation inFCs by start OD, time and marker (y(OD)) ~ x(time) +x(time):x(startOD) + x(marker). All measured FCs wereused and only the approximate linear part of the FC wasused (time-points: 24 to 196). We used 1000 permuta-tion per RNAi treatment to determine a genome-wide-log10(p) threshold of 0.05. The FCs were randomizedover the RILs for each round of QTL mapping in thepermutation test. The QTL profiles were collected andfor each profile the most significant score was put in alist. This list was ordered and the 50th highest value perRNAi treatment was used as the threshold.QTL mapping for the 6 RNAi treatments using the
multiwell dispenser (Additional file 2, Figure S1) wasdone by calculating the slopes of the FCs over time-points 2 to 5 (24, 96, 120 and 144 hours) of the threereplicas and than take the average per genotype. Weused 38 RILs to calculate the QTLs with a single markermodel: y(mean slope)~x(marker).
Comparing FCs of individual RILs to Bristol and HawaiiThe FCs of 32 individual RILs, for which we sequencedppw-1, were compared to the FCs of Bristol and Hawaiiby a chi-square test. Averages per strain per time-pointwere calculated and normalized by dividing by the startOD. The FCs were further transformed to % OD of thenormalized start OD. Two separate tests were per-formed for the RILs FCs against the Bristol’s FCs andHawaii’s FCs.
Statistical summaryAs with any high-throughput experiment, the FitnessAssay generates large quantities of data. The nature ofthis data enables many types of detailed analysis. But tobe used as a truly high-throughput method, a simplerobust type of analysis needs to be applied. Also a soft-ware environment that enables high-throughput of statis-tical tests is recommended. The simplest level of analysisis to reveal the most severe RNAi effects. To this end, weused a t-test, which is performed on the relative ODs ofthe last time point(s). The next level of analysis aims atdetecting less severe RNAi effects, which tend to affectthe middle part of the curves. We found that comparingslopes using a t-test reflects the RNAi treatment effectsbetter. Alternatively, a chi-square test can be used on themean curve of the two samples. The time points of theindividual replicates are tested to be above or below theoverall mean and summed per treatment. The advantage
Table 2 Matrix used to perform a chi-square test
< mean > mean
sample 1 12 24
sample 2 30 6
The (< mean) indicates the number of replicates below the mean and the (>mean) indicates the number of replicates above the mean.
Elvin et al. BMC Genomics 2011, 12:510http://www.biomedcentral.com/1471-2164/12/510
Page 13 of 14
of this latter method is that it can be used regardless ofthe shape of the curve and that it is easily adjusted to aspecific part of the curve. In summary, many differenttests can be applied to analyze the FCs, but in most casessimple tests are sufficient to detect RNAi treatments orgenotypes effects.
Additional material
Additional file 1: Newly generated recombinant inbred linesbetween Bristol and Hawaii. The new RILs have been genotyped usingthe indicated markers Table S1. Newly generated recombinant inbredlines between Bristol and Hawaii
Additional file 2: QTL profiles of six RNAi treatments performedusing a multiwell dispenser. QTL mapping of ppw-1 using 38 RILsFigure S1. QTL profiles of six RNAi treatments performed using amultiwell dispenser. QTLs were calculated on the slope of the FCs. Theslopes were derived using time-points 2 to 5 and averaged per RIL.Thresholds (0.05) were determined by 300 permutations per treatmentand are shown as a red horizontal line. The physical position of ppw-1 isindicated by a green dot. The RNAi treatment is indicated in the grey box.
Additional file 3: 20 randomly selected RNAi treatments predictedto affect viability. Fitness Curves of RNAi treatments Figure S2. 20randomly selected RNAi treatments predicted to affect viability by RNAiaccording to [1]. Shown are the FCs of RNAi treatments (blue line)compared to empty vector (grey line). The difference between the RNAieffect and the control empty vector (ev) is shown in yellow. The RNAitreatment on N2 is indicated in the grey box. Individual measurementsare shown as dots, blue for RNAi treatments and grey for ev.
Additional file 4: 20 randomly selected RNAi treatments predictedto NOT affect viability. Fitness Curves of RNAi treatments Figure S3. 20randomly selected RNAi treatments predicted to NOT affect viability byRNAi according to [1]. Shown are the FCs of RNAi treatments (blue line)compared to empty vector (grey line). The difference between the RNAieffect and the control empty vector (ev) is shown in yellow. The RNAitreatment on N2 is indicated in the grey box. Individual measurementsare shown as dots, blue for RNAi treatments and grey for ev.
AcknowledgementsME, UK, LBS, JK, and GBP are supported by the FP7 PANACEA project projectnr. 222936. GBP is a research fellow from the MRC (Career DevelopmentAward G0600127). Special thanks to Yang Li (University of Groningen, TheNetherlands) for establishing the core set of RILs.
Author details1Faculty of Life Sciences, Michael Smith Building, The University ofManchester, Oxford Road, Manchester, M13 9PT, UK. 2Laboratory ofNematology, Wageningen Universiteit, Droevendaalsesteeg 1, 6708 PB,Wageningen, The Netherlands.
Authors’ contributionsME and UK performed all the RNAi experiments and strain characterizations.ME analyzed the data and supervised UK. MF initiated the development ofthe Fitness Assay. GP conceptualized the Fitness Assay, supervised and aidedin data analysis. LBS analyzed the data and performed the QTL mapping andJK supervised and aided in the analysis. GP, JK, ME and LBS wrote themanuscript. All authors read and approved the final manuscript.
Received: 11 August 2011 Accepted: 17 October 2011Published: 17 October 2011
References1. Kamath RS, Fraser AG, Dong Y, Poulin G, Durbin R, Gotta M, Kanapin A, Le
Bot N, Moreno S, Sohrmann M, et al: Systematic functional analysis of the
Caenorhabditis elegans genome using RNAi. Nature 2003,421(6920):231-237.
2. Lehner B, Tischler J, Fraser AG: RNAi screens in Caenorhabditis elegans ina 96-well liquid format and their application to the systematicidentification of genetic interactions. Nat Protoc 2006, 1(3):1617-1620.
3. Gutteling EW, Doroszuk A, Riksen JA, Prokop Z, Reszka J, Kammenga JE:Environmental influence on the genetic correlations between life-historytraits in Caenorhabditis elegans. Heredity 2007, 98(4):206-213.
4. Gutteling EW, Riksen JA, Bakker J, Kammenga JE: Mapping phenotypicplasticity and genotype-environment interactions affecting life-historytraits in Caenorhabditis elegans. Heredity 2007, 98(1):28-37.
5. Kammenga JE, Doroszuk A, Riksen JA, Hazendonk E, Spiridon L, Petrescu AJ,Tijsterman M, Plasterk RH, Bakker J: A Caenorhabditis elegans wild typedefies the temperature-size rule owing to a single nucleotidepolymorphism in tra-3. PLoS Genet 2007, 3(3):e34.
6. Li Y, Alvarez OA, Gutteling EW, Tijsterman M, Fu J, Riksen JA, Hazendonk E,Prins P, Plasterk RH, Jansen RC, et al: Mapping determinants of geneexpression plasticity by genetical genomics in C. elegans. PLoS Genet2006, 2(12):e222.
7. Li Y, Breitling R, Snoek LB, van der Velde KJ, Swertz MA, Riksen J, Jansen RC,Kammenga JE: Global genetic robustness of the alternative splicingmachinery in Caenorhabditis elegans. Genetics 2010, 186(1):405-410.
8. Vinuela A, Snoek LB, Riksen JA, Kammenga JE: Genome-wide geneexpression regulation as a function of genotype and age in C. elegans.Genome Res 2010, 20(7):929-937.
9. Tijsterman M, Okihara KL, Thijssen K, Plasterk RH: PPW-1, a PAZ/PIWIprotein required for efficient germline RNAi, is defective in a naturalisolate of C. elegans. Curr Biol 2002, 12(17):1535-1540.
10. Miller LM, Gallegos ME, Morisseau BA, Kim SK: lin-31, a Caenorhabditiselegans HNF-3/fork head transcription factor homolog, specifies threealternative cell fates in vulval development. Genes Dev 1993, 7(6):933-947.
11. Parrish S, Fire A: Distinct roles for RDE-1 and RDE-4 during RNAinterference in Caenorhabditis elegans. Rna 2001, 7(10):1397-1402.
12. Tabara H, Sarkissian M, Kelly WG, Fleenor J, Grishok A, Timmons L, Fire A,Mello CC: The rde-1 gene, RNA interference, and transposon silencing inC. elegans. Cell 1999, 99(2):123-132.
13. Sundaram MV: RTK/Ras/MAPK signaling. WormBook 2006, 1-19.14. Green RA, Kao HL, Audhya A, Arur S, Mayers JR, Fridolfsson HN,
Schulman M, Schloissnig S, Niessen S, Laband K, et al: A high-resolution C.elegans essential gene network based on phenotypic profiling of acomplex tissue. Cell 2011, 145(3):470-482.
15. White AG, Cipriani PG, Kao HL, Lees B, Geiger D, Sontag E, Gunsalus KC,Piano F: Rapid and accurate developmental stage recognition of C.elegans from highthroughput image data. IEEE CVPR 2010, 3089-3096.
16. Brenner S: The genetics of Caenorhabditis elegans. Genetics 1974,77(1):71-94.
17. Fan JB, Oliphant A, Shen R, Kermani BG, Garcia F, Gunderson KL, Hansen M,Steemers F, Butler SL, Deloukas P, et al: Highly parallel SNP genotyping.Cold Spring Harb Symp Quant Biol 2003, 68:69-78.
doi:10.1186/1471-2164-12-510Cite this article as: Elvin et al.: A fitness assay for comparing RNAieffects across multiple C. elegans genotypes. BMC Genomics 2011 12:510.
Submit your next manuscript to BioMed Centraland take full advantage of:
• Convenient online submission
• Thorough peer review
• No space constraints or color figure charges
• Immediate publication on acceptance
• Inclusion in PubMed, CAS, Scopus and Google Scholar
• Research which is freely available for redistribution
Submit your manuscript at www.biomedcentral.com/submit
Elvin et al. BMC Genomics 2011, 12:510http://www.biomedcentral.com/1471-2164/12/510
Page 14 of 14