Embed Size (px)
Citation preview
Rev. Virtual Quim. |Vol 6| |No. 6| |1687-1701| 1687
Artigo
Method for Sediment Texture Characterization Using
Spectroscopy Techniques and Multivariate Analysis
Melquiades, F. L.;* González-Borrero, P. P.; dos Santos, F. R.; de Deus, W.
E. D.; Kalwa, M.; Quináia, S. P.
Rev. Virtual Quim., 2014, 6 (6), 1687-1701. Data de publicação na Web: 11 de dezembro de 2014
http://www.uff.br/rvq
Método para Caracterização de Textura de Sedimentos Usando Técnicas
Espectroscópicas e Análise Multivariada
Resumo: O objetivo deste estudo foi apresentar um método para caracterização da textura de sedimentos
combinando três técnicas espectroscópicas com analise multivariada. Em particular, foram utilizados dados de
medidas de espectroscopia de absorção atômica de chama (FAAS), fluorescência de raios X por dispersão em
energia (EDXRF) e espectroscopia fotoacústica (PAS) em amostras de sedimento superficial de lago, os quais foram
combinados com o método de análise de componentes principais para a analise exploratória de dados e o método
de regressão dos mínimos quadrados parciais (PLS) para a estimativa indireta da textura dos sedimentos. Foi
possível inferir valores quantitativos de tamanho de partícula usando dados das três técnicas aliada a regressão por
PLS, a qual permitiu obter dados implícitos em cada conjunto de dados. A mesma classificação em função da textura
das amostras foi verificada para todas as técnicas espectroscópicas. No entanto, a classificação por EDXRF ou PAS
foi mais simples, rápida, barata e não destrutiva quando comparada com a FAAS. No caso da previsão quantitativa
da granulometria pela regressão por PLS, os resultados foram menos acurados por PAS, porém foram satisfatórios
por EDXRF e FAAS. Em geral, os resultados são promissores indicando a viabilidade do método. Contudo, um maior
numero de amostras precisa ser analisado para implementar a metodologia.
Palavras-chave: Tamanho de partícula; sedimento; análise de componentes principais; regressão por mínimos
quadrados parciais; espectroscopia.
Abstract
The aim of this study was to present a method for sediment texture characterization combining three spectroscopy
techniques with multivariate analysis. Specifically, data were used from flame atomic absorption spectroscopy
(FAAS), energy dispersive X-ray fluorescence (EDXRF) and photoacoustic spectroscopy (PAS) measurements in
superficial lake sediment samples, which were combined with principal component analysis for exploratory data
analysis and with partial least square (PLS) regression for indirect estimative of clay and sand textures . It was
possible to infer quantitative values of grain size using the data from the three techniques allied with PLS
regression, which allowed to obtain implicit information in each data set. The same classifications in accordance
with samples texture were verified for all the applied spectroscopic methods. However, the classification by EDXRF
or PAS was simpler, faster, cheaper and non destructive when compared with FAAS. In the case of granulometry
quantitative prediction by PLS regression, the results for PAS were less accurate, but were satisfactory for EDXRF
and FAAS. In general the results are promising, indicating the method viability, although a larger sampling is
necessary to implement the methodology.
Keywords: Grain size; sediment; principal component analysis; partial least square regression; spectroscopy.
* Universidade Estadual do Centro Oeste, Departamento de Física, Campus CEDETEG, CEP 85040-080, CP 3010,
Guarapuava-PR, Brasil.
DOI: 10.5935/1984-6835.20140109

Volume 6, Número 6
Revista Virtual de Química
ISSN 1984-6835
Novembro-Dezembro 2014
1688 Rev. Virtual Quim. |Vol 6| |No. 6| |1687-1701|
Method for Sediment Texture Characterization Using
Spectroscopy Techniques and Multivariate Analysis
Fábio Luiz Melquiades,a,
* Pedro Pablo González-Borrero,a Felipe R. dos
Santos,a Wycaro E. D. de Deus,
a Miguel Kalwa,
b Sueli P. Quináia
b
a Universidade Estadual do Centro Oeste, Departamento de Física, Campus CEDETEG, CEP
85040-080, CP 3010, Guarapuava-PR, Brasil.
b Universidade Estadual do Centro Oeste, Departamento de Química, Campus CEDETEG, CEP
85040-080, CP 3010, Guarapuava-PR, Brasil.
Recebido em 4 de agosto de 2014. Aceito para publicação em 11 de dezembro de 2014
1. Introduction
2. Experimental
2.1. Study area and collection of sediment samples
2.2. Instrumentation
2.3. Grain Size, pH and OM Determination
2.4. Statistical analysis
3. Results and Discussion
3.1. Characterization of sediment samples
3.2. Multivariate analysis
3.3. PCA with PAS spectral data
3.4. PLS for texture quantification
4. Conclusions
1. Introduction
Soil and sediment studies are very
important due to their relation to agriculture
and the environment. Their physical and
chemical properties will determine the
specific applications. For these reasons, an
interdisciplinary study, considering physics,
chemistry, statistics, mineralogy and biology
areas, is fundamental. One of the soil and
sediment properties of interest is the texture.
It refers to the shape, size and three-
dimensional arrangement of the particles
that make up soil and sediment.
The sediment is a major compartment of
the aquatic ecosystem, forming a variety of
habitats for different organisms.
Furthermore, it acts as a medium of
concentrating nutrients and contaminants
that can contribute as a source for existing
organisms in aquatic environment. The

Melquiades, F. L. et al.
Rev. Virtual Quim. |Vol 6| |No. 6| |1687-1701| 1689
metals are present in a compartment and
may suffer remobilization to the water
column. Some of these metals are essential
nutrients to the biota, whereas other metals,
in higher concentrations, may cause toxic
effects to the environment. Thus, the
sediments are of utmost importance in
environmental impact studies, as a record of
permanent contamination effects.1,2
Because
of the interdisciplinary of soils and
sediments, different technique and
methodology should be applied for their
characterization.
Texture of soil and sediments refers to
clay, silt and sand proportion, which indicate
its consistence characteristics. From these
fractions, clay is the one that has the largest
contact surface and represents the larger
part of the solid phase. Clay also has the
ability to complex or adsorb metals due to its
large surface area. Sandy soils and sediments
have a granular consistence and present high
water permeability. Soil and sediments
classified as silt present an intermediate
granulometry between clay and sand, and are
generally erodible. Silt does not aggregate
particles like clay and has small and light
particles.3
The conventional methodology for texture
determination in soils and sediments is
densitometry.4 In this method the sample is
diluted in NaOH and water and the
measurement with hydrometer is performed.
Unfortunately, it is a slow and laborious
methodology, besides the waste it generates
and the destruction of the original samples.5
Most of the soil and sediment
constituents can be identified and sometimes
quantified by the data from different
spectroscopic techniques.6 The main
constituents that influence its spectral
behavior are the organic matter, iron oxides,
mineralogy, clay content and moisture.
Certainly, soil and sediment analysis
techniques that are faster, cheaper and allow
simultaneous determination of their
physicochemical parameters are more
advantageous. Besides, in the last years
laboratory instrumentation and the feasibility
of multivariate statistical methods have
advanced and new alternatives to traditional
methodologies conducted on soil and
sediment analysis could thus be developed.7-
10
Spectroscopic techniques like flame
atomic absorption spectroscopy (FAAS)11
and
energy dispersive X-ray fluorescence
(EDXRF)12
are commonly employed for the
determination of metallic ions concentration
in soils and sediments, including recent
applications with portable XRF in field.13
Photoacoustic spectroscopy (PAS),14
can be
also applied to study the optical absorption
spectra of soils.15
For FAAS analysis an acid
digestion of the samples is necessary,
otherwise, for EDXRF and PAS, the samples
can be analyzed in powder form after minor
preparation. These techniques are not
conventionally used for texture
determination. However, it is known that
metals use to have a greater affinity for
smaller particles and organic compounds, i.e.
for clay sediments,16
but it depends on
geochemical conditions.
In the case of EDXRF, the grain size and
organic matter (OM) content related to light
elements influence the background and
enhance the scattering peaks in the spectra.17
For example, Rayleigh and Compton
scatterings contain information about the
average atomic number, particle size and
sample density.18
In the case of PAS,
attention should be paid to the effect of
particle size on photoacoustic (PA) signals
when powder samples are measured.
Previous studies have indicated that the PA
band intensities increase with a decrease in
particle diameter and that the band
intensities ratios are not constant for
particles of different diameter.19
Because sediment is a complex mixture
and the spectra obtained are equally
intricate, multivariate analysis techniques
could be applied to extract implicit
information in the spectra data. Therefore,
the magnitude of complex problems that are
solved by spectroscopy could be increased by
the use of multivariate analysis methods.20,21
Multivariate statistical methods are useful for
spectra separation based on non
Melquiades, F. L. et al.
1690 Rev. Virtual Quim. |Vol 6| |No. 6| |1687-1701|
characteristics information (implicit
information). In this case, the application of
unsupervised methods, like principal
component analysis (PCA) and Hierarchical
Cluster Analysis (HCA) are appropriate.
HCA is performed through the
determination of distances among the
sample data, which can be calculated
considering the closest K-neighbor or mean
of the samples. The data can be either the
original (scaled or centered on the mean) or
the scores generated by the PCA. A numeric
routine is applied with the objective of
sample classification, dividing a set of
observations into homogenous groups
according to some criteria. The technique is
based on distance calculations and the
results plotted in a dendogram, which
summarize the information.22
PCA is applied to standards recognition,
explaining the discrepancies between a large
number of correlated variables. PCA is also a
dimension reduction technique, in which
orthogonal transformations in the data are
performed to obtain linear combinations of
the original variables. The new set of
variables, called principal components (PCs),
is smaller than the original one and the PCs
are uncorrelated, retaining most of the
variation in the first few components.7 Its
representation in score plots is very useful as
a display tool for examining the relationships
between objects, looking for groups and
trends, sorting out outliers. The loading plots
display the variables that are responsible for
the samples classification.
Besides the samples classification, it is
possible to quantify the properties of interest
using multivariate regression methods,
starting from the values obtained from the
conventional methodology.23
To do this a
very useful method is Partial Least Square
(PLS) regression.
PLS regression is a well-known factor
analysis applied for parameters prediction,
on which is established a quantitative
relationship between the set of instrumental
responses (for example, spectral data) and
one or more physical or chemical properties
of the samples (in this study, grain size),
developing a mathematical model which
correlates such relationship. This procedure
involves two steps: calibration and validation.
The calibration step establishes a relation
between the data matrix X (instrumental
signals, independent variables) and the
known samples properties from reference
samples (dependent variables) organized in Y
matrix. The validation allows verifying if the
model is capable to predict the properties of
new samples.24
The main aim of this study is to propose
an alternative methodology for texture
characterization of surface sediment
samples, assessing the combination of
spectroscopic analytical techniques with
multivariate analysis. Specifically, PCA and
HCA were employed for classification and PLS
for quantification of clay and sand textures
using FAAS, EDXRF and PAS data.
2. Experimental
2.1. Study area and collection of
sediment samples
The study area is located at the Itaipu
Lake, at the border of Brazil and Paraguay.
This lake is one of the largest dams in the
world and its primary objective is to generate
electric energy. In addition, the flooded area
has multiple uses: navigation, recreation and
tourism, fisheries, industrial water
abstraction, and urban and agricultural
irrigation.
The samples were collected from nine
points along the Itaipu Lake (Figure 1). These
points are touristic places, known as artificial
beaches. Surface sediments (depth 0–5 cm)
were collected using plastic bottles. On
return to the laboratory, the sediments were
stored in the dark at 4 °C before being air-
dried at room temperature (25 ± 1 ºC) for 2
weeks and sieved through a 70-μm mesh.25

Melquiades, F. L. et al.
Rev. Virtual Quim. |Vol 6| |No. 6| |1687-1701| 1691
Figure 1. Map from the selected sampling sites (http://maps.google.com)
2.2. Instrumentation
The quantification of metallic ions was
carried out using FAAS equipment from
Varian, model SpectraAA-220, equipped with
hollow cathode lamps and deuterium lamp
for background correction.
The samples were prepared for pseudo-
total ions extraction. Metals can be bound to
various phases of the sediment: either
weakly adsorbed to surface particles like clay
and humic acid or strongly bound to the
matrix, commonly formed by aluminum
silicates. Still exist the intermediate phases
bound to carbon, to iron and manganese oxy-
hydroxy, connected to the OM and also with
sulfides. Metals in these phases are weakly
bound and could be easily displaced to the
water column generating contamination
risks. However, metal bound to oxide and
refractory materials, which make up the
mineral crystalline structure, are imprisoned
by extremely strong binding force which
cannot be broken by biota metabolic
activities. So, metals occluded in this phase
are in minor quantity, do not contributing
significantly to the sand fraction in which
they are bound.26, 27
Metal interactions with
sediment, in the biogeochemical cycle, is
strongly affected by particle size. Elements
from anthropogenic and natural origin are
concentrated in silt and clay fractions, whose
granulometry is below 63 µm. Therefore, a
drastic digestion of the sediment is not
necessary to establish its metal content, since
the metal portion present in the crystalline
lattice of the silica particles does not
contribute significantly to the total content of
metallic elements in the sediments.28
All samples were prepared in triplicates.
Analytical grade reagents were used in the
study. The analysis was accomplished
employing analytical curves by means of
analytical standards. The solutions of metal
ions (Al, Cd, Cr, Cu, Fe, Mn, Ni, Pb and Zn)
were made by diluting a stock standard
solution of 1000 mg L-1
(J. T. Baker Instra
Analysed, Mexico City, Mexico) in ultrapure
water (TKA Genpure UV, model nº 08.2205).
The methodology used in the extraction of
pseudo-total ions was realized with
concentrated analytical-grade HNO3 and H2O2
(30 % v/v).
Approximate 0.5 g dry sediment sample
was put into a glass vessel, and 15 mL
concentrated HNO3 was added. The glass
vessel was heated at 60 °C for 4 h. Another 8
mL H2O2 (30 % v/v) was added to the glass

Melquiades, F. L. et al.
1692 Rev. Virtual Quim. |Vol 6| |No. 6| |1687-1701|
vessel and maintained at 60 °C for 2 h. After
cooling, the digested sample was decanted
into a glass tube and diluted to 50 mL with
deionized water.29
Energy Dispersive X-ray Fluorescence
spectrometer (Shimadzu EDX 700), with Rh
tube and Si(Li) detector, was used.
Measurements were performed in vacuum
with Zr filter at 50 kV, 500 µA and 3g of
samples in powder form were placed in XRF
cups covered with 2.5 µm Mylar film for 100 s
irradiation time.
The PAS experiments were performed
using a spectrometer consisting of a 1000 W
xenon arc lamp (Oriel Corporation, model
6269), the radiation of which was modulated
by a variable speed chopper (Stanford
Research Systems, model SR540). A
monochromator (Oriel, model 77250), in
combination with the appropriate absorption
filters, was used for wavelength selection and
to eliminate higher order diffraction. The
beam leaving the monochromator was
directed into a home-made PA cell, a small
gas-tight enclosure with a condenser
microphone (Bruel and Kjaer, model 4392)
mounted in one wall. Changes in sample
temperature cause alterations of the
pressure in the enclosed gas, which are
subsequently converted to an electrical signal
by the microphone. The signal was pre-
amplified and fed to a lock-in amplifier (SRS,
model SR830), which synchronizes the
photoacoustic signal with the reference pulse
from the chopper. All the photoacoustic
spectra were obtained at a modulation
frequency of 16 Hz. The lock-in is connected
to a microcomputer that controls all the
instrumentation. The PA signal was rationed
by the signal of carbon black, to eliminate the
spectral variation of the illumination source.
To improve accuracy, we have repeated all
measurements three times.
2.3. Grain Size, pH and OM
Determination
Texture determination of sediment
samples (e.g. silt, sand, clay) was performed
using densitometry.4,24
In the specific case of
these samples, the fraction of silt was small
and any sample was classified in this
category. So, in this study, were explored clay
and sand fractions. OM content was
determined gravimetrically.25,30
One gram of
each sediment sample was combusted in a
furnace at 500 ºC for 4 h to determinate
weight loss on ignition. Total organic carbon
(TOC) content was calculated by the
empirical formula Van Bemmelen factor: TOC
= OM/ 1.724. The pH of samples was
determined by estimating the activity of H+
ions in the suspension of the sediment. So, 8
cm3 of sediment were transferred to a beaker
(50 mL) with 20 mL of CaCl2 10-2
mol L-1
to
maintain the ionic equilibrium of the
solution. The solution was stirred for 15
minutes with the aid of a magnetic stirrer and
reading was done by using a pH meter
previously calibrated with buffer solutions pH
7.0 and 4.0. 25
2.4. Statistical analysis
In this study three different data sets for
PCA and PLS evaluation, were used: (a)
metallic ion concentration, with pH and OM
results previously obtained25
; (b) EDXRF
spectral data and (c) PAS spectral data.
For the physicochemical parameters were
constructed a 9 x 11 matrix of collected
samples versus concentration values of Al,
Cd, Cr, Cu, Fe, Mn, Ni, Pb, Zn, pH and OM.
Auto-scale pre-processing was used in this
case, and the results were displayed in bi-
plots. The representation of the scores and
loadings in the same graphic is called bi-plot.
Several PCA and HCA models were
performed with EDXRF spectra, in different
energy ranges(0 - 40 keV, 0 – 7.5 keV, 7.5 - 20
keV and 20 - 40 keV). However, the most
significant results were obtained with the
complete spectra, consisting of a matrix of 27
rows (9 samples measured 3 times) and 2048
Melquiades, F. L. et al.
Rev. Virtual Quim. |Vol 6| |No. 6| |1687-1701| 1693
columns (corresponding to the energy values
from 0 to 40 keV).
PAS spectra were evaluated in the
wavelength range of 300 to 1100 nm and a 9
x 800 matrix was used. Both PAS and EDXRF
spectra were preprocessed using mean
center. The PLS regression were performed
with the best PCA models. The calibration set
was composed by seven samples and the
external validation by two samples, numbers
4 and 5.
All statistical analysis and calculations
were performed with software Matlab with
PLS ToolBox version 5.8.
3. Results and Discussion
3.1. PCA with metallic ion concentration,
pH and OM
Metallic ion concentration, granulometry,
pH and OM values were determined in a
previous study25
. Results of the analysis of
physicochemical parameters of sediment
samples are listed in Table 1.
Table 1. Physicochemical parameters of superficial sediment in Itaipu Lake (adapted from
reference 25)
Points
Granulometric Fraction (g kg-1
) pH OM (%)
Sand Clay Silt
1 704 248 48 6.63 3.07
2 358 477 165 5.91 12.19
3 910 89 1 7.20 1.41
4 174 670 156 6.98 7.36
5 765 211 24 5.31 3.80
6 156 819 25 6.06 11.16
7 72 782 146 6.46 13.92
8 838 144 18 5.79 2.65
9 294 596 109 6.88 10.48
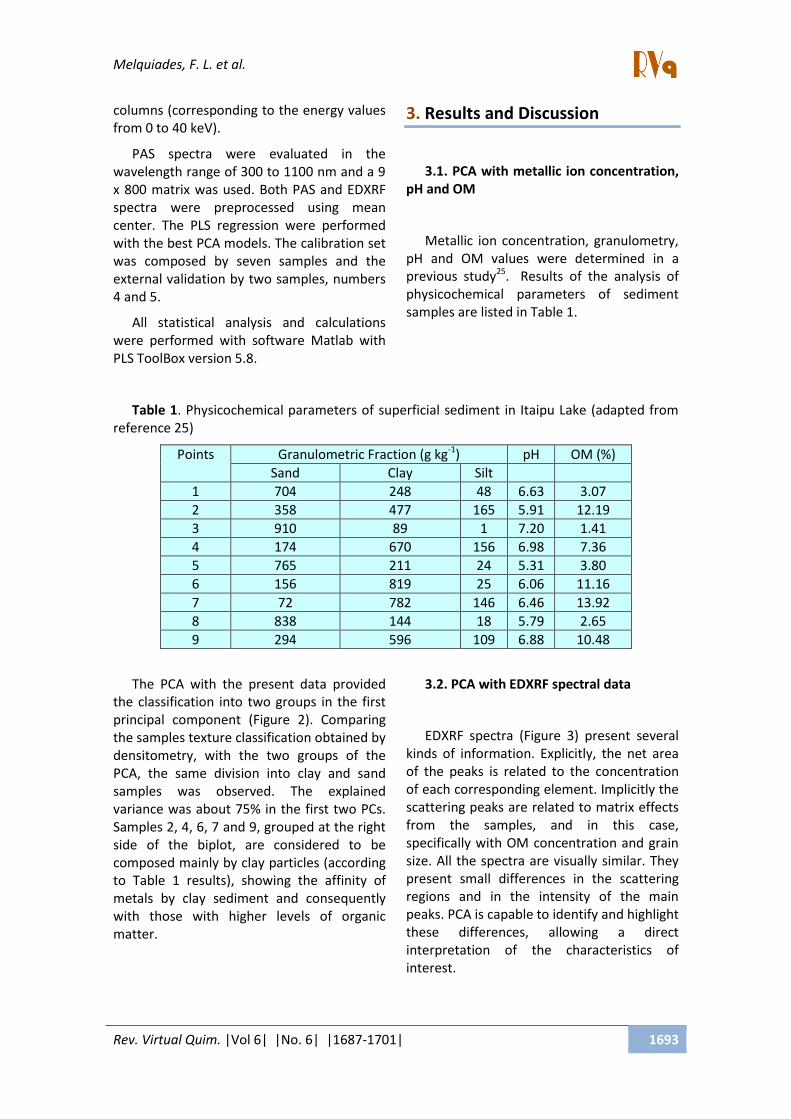
The PCA with the present data provided
the classification into two groups in the first
principal component (Figure 2). Comparing
the samples texture classification obtained by
densitometry, with the two groups of the
PCA, the same division into clay and sand
samples was observed. The explained
variance was about 75% in the first two PCs.
Samples 2, 4, 6, 7 and 9, grouped at the right
side of the biplot, are considered to be
composed mainly by clay particles (according
to Table 1 results), showing the affinity of
metals by clay sediment and consequently
with those with higher levels of organic
matter.
3.2. PCA with EDXRF spectral data
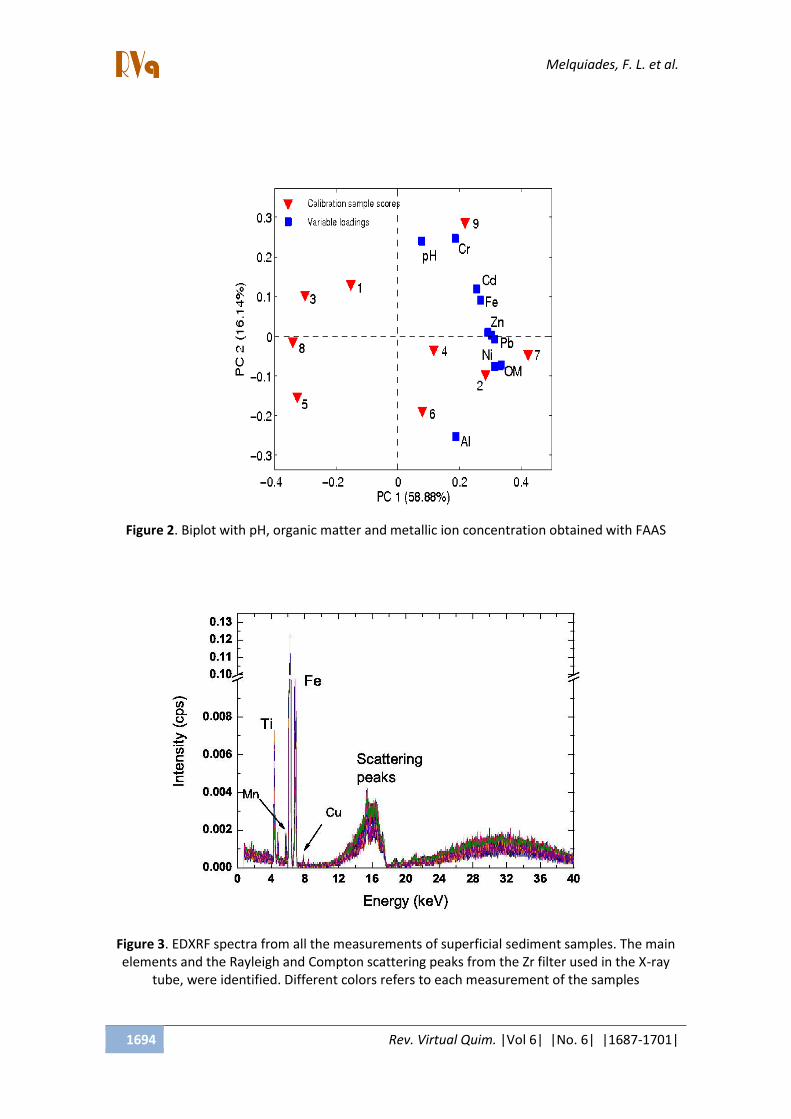
EDXRF spectra (Figure 3) present several
kinds of information. Explicitly, the net area
of the peaks is related to the concentration
of each corresponding element. Implicitly the
scattering peaks are related to matrix effects
from the samples, and in this case,
specifically with OM concentration and grain
size. All the spectra are visually similar. They
present small differences in the scattering
regions and in the intensity of the main
peaks. PCA is capable to identify and highlight
these differences, allowing a direct
interpretation of the characteristics of
interest.
Melquiades, F. L. et al.
1694 Rev. Virtual Quim. |Vol 6| |No. 6| |1687-1701|
Figure 2. Biplot with pH, organic matter and metallic ion concentration obtained with FAAS
Figure 3. EDXRF spectra from all the measurements of superficial sediment samples. The main
elements and the Rayleigh and Compton scattering peaks from the Zr filter used in the X-ray
tube, were identified. Different colors refers to each measurement of the samples

Melquiades, F. L. et al.
Rev. Virtual Quim. |Vol 6| |No. 6| |1687-1701| 1695
PCA was achieved with the complete
EDXRF spectra. The score plot is illustrated in
Figure 4a. PC1 explains ~99.3% of data
variance, while PC2 explains ~0.1%. The
loadings plot analysis (not presented) shows
that the Fe peak was responsible for the
classification, where the samples at right, in
the positive direction of PC1, have a higher Fe
concentration. In the PC2, the Ti peak was
the one that influenced the separation. This
score plot also exhibits the samples
classification by grain size and OM content,
i.e. samples in the positive side of PC1 are
clayey and have a higher OM content. The
samples in the negative side of this axis are
sandy. This result is comparable to that
reported by Förstner and Wittmann, (1981),31
in which metallic ions have affinity to
sediments with small grain size and high OM
content. The HCA for the same data set used
in the PCA is presented in Figure 4b. The
separation into clay and sand samples is in
accordance with the PCA, corroborating the
results.
(b)
Figure 4. (a) Score plot from PCA analysis and (b) Hierarchical Cluster Analysis plot, both with
EDXRF spectral data. The codes a, b and c refers to three measurements performed in each
sample

Melquiades, F. L. et al.
1696 Rev. Virtual Quim. |Vol 6| |No. 6| |1687-1701|
3.3. PCA with PAS spectral data
PA spectra were obtained in the region
from 300 to 1100 nm. Figure 5a depicts the
spectrum for each sample. Here can be
observed that there is saturation tendency of
PA signal in spectra range of about 550 nm to
300 nm. This is an indication of the presence
of high OM concentration and iron-based
compounds. Samples 1, 3 and 8 show a lower
absorption in the wavelength range 300-700
nm, indicating that they have a higher sand
composition. The sand particles reflect the
incident light, thus giving rise to a lower
absorption and consequently a decrease of
the photoacoustic signal. For the same
reason those samples exhibit smaller baseline
values. In the case of sample 5, in spite of
being classified as sand by the conventional
method (see Table 1), a different behavior is
shown when compare to samples 1, 3 and 8.
We believe that this behavior is due to its
higher OM content and higher iron
concentration (Table 1). The baseline value is
related to the capacity of light absorption and
heat retention by the samples. In order to
eliminate this effect, this value was
subtracted from each PA spectrum (see Fig.
5b). The observed bands, in the near infrared
(NIR) region (800-110 nm), are attributed to
presence of iron-based compounds. It can be
noted that samples 2, 9 and 5 show more
defined peaks in the NIR region due to the
higher content of iron.31 In the case of
sample 7, despite its higher iron content,
those peaks are not well defined, probably,
because of its high OM content in relation to
the Fe content (Table 1). These reasons may
also explain the spectrum behavior of sample
4 and 6 in the NIR region. In order to obtain
additional information from the PA spectra, a
multivariate analysis was performed.
(a)
(b)

Melquiades, F. L. et al.
Rev. Virtual Quim. |Vol 6| |No. 6| |1687-1701| 1697
Figure 5. Typical photoacoustic spectrum of sediment samples from Itaipu Lake: (a) measured
and (b) without baseline
PCA was performed on the matrix data
from the PA spectra, using mean center
preprocessing. The PCA score plot (Figure 6)
(with 99.90% of the total variance in the first
two principal components) presents the
sample separation. Two natural groups were
formed in this two-dimensional space: the
first group consisted of the sand sample on
the negative side of the first principal
component. The second group was formed
with the clay samples on the more positive
side of the first principal component. The
second principal component plays a major
influence on clay samples, as they are more
disperse vertically.
The examination of the loadings from the
first two principal components suggested
that the clay samples have a higher intensity
in the PA spectra, what is confirmed in Figure
6.

Melquiades, F. L. et al.
1698 Rev. Virtual Quim. |Vol 6| |No. 6| |1687-1701|
Figure 6. Score plot of the first two principal components using PAS spectral data
3.4. PLS for texture quantification
The quantification of sand and clay
content in the samples were predicted by PLS
regression with the three set of spectroscopic
data for X matrix: physicochemical
parameters (pH, OM and FAAS metal
concentration); EDXRF spectra and PAS
spectra. For Y matrix were used the texture
values obtained by the conventional
methodology (Table 1). The regression curves
and the predicted values (samples 4 and 5)
are presented in Figure 7. In this figure the
error bars were generated by the PLS model
based on the residues in the regression
calculation. In the case of the calibration set,
the residues were calculated by the leave one
out process. For the validation set, the error
bar is due to the residues in the regression
calculation for the two points of external
validation. The correlation coefficients for
calibration of the regressions ranged from
0.990 to 0.804. The relative deviation (RD) for
prediction was calculated with respect to the
measured values. Its RD values varied from
3% to 7% for FAAS, except for the value 174 g
kg-1
whose deviation was 73%. The RD ranged
from 6% to 52% for EDXRF prediction and
from 23% to 110% for PAS. We believe that
the high RD values are because of the low
predictability of the PLS regression models,
due to the fact that, the restrict number of
samples do not make possible the
satisfactory choice of calibration and
prediction sets. The prediction was less
accurate for PAS data, whereas the results
were most satisfactory for FAAS and EDXRF
evaluation. However, the results
demonstrate the potential of the
spectroscopic techniques for granulometry
quantification.

Melquiades, F. L. et al.
Rev. Virtual Quim. |Vol 6| |No. 6| |1687-1701| 1699
Figure 7. PLS regression curves for sand and clay texture quantification obtained from FAAS
concentration values, PAS spectra and EDXRF spectra. The error bars are generated by each
PLS model
4. Conclusions
The texture of superficial sediments was
classified indirectly using FAAS, EDXRF and
PAS techniques in combination with PCA and
HCA. The same classification into samples
with major contents of clay and sand
particles were obtained for all the applied
spectroscopic methods. Scores plot indicates
that the multivariate analysis can be used for
qualitative classification of sediment texture
either with spectral data of EDXRF or PAS, or
with metallic ion concentration determined
by FAAS.
In addition, a quantitative prediction was
performed with PLS regression and the
results were satisfactory, especially for FAAS
and EDXRF data. In the case of PAS, it was not
possible to predict accurately the particle size
values. The obtained PLS models, at this
point, due to the limited number of collection
points (only nine), could be considered as a
regional modeling, i.e., the prediction models
generated are limited and valid for the
studied environment. However, a larger
number of samples is necessary to
implement the methodology and change the
robust model statistically.
Our results indicate that the combination
of these tools (spectroscopy and multivariate
analysis) allows to assess implicit information
of the spectral data and to conclude that the
presented methodology is feasible.
Moreover, the texture classification and
quantification could be implemented in soil
analysis when these techniques are applied.
However, the possibility of texture analysis
by EDXRF or PAS, indirectly and combined
with multivariate analysis, is simpler, faster,
cheaper and non destructive, without
residues generation compared with FAAS and
other conventional methods. This opens up
the possibility of performing fast
characterization in soil and sediment
properties with an environmentally friendly
methodology and could be applied in several
areas such as agriculture, geophysics and
mineralogy.

Melquiades, F. L. et al.
1700 Rev. Virtual Quim. |Vol 6| |No. 6| |1687-1701|
Acknowledgment
This work was supported by the Brazilian
Agencies CNPq and Fundação Araucária. One
of the authors (FLM) gratefully acknowledges
Dra. Maria Izabel Maretti Silveira Bueno for
her collaboration in EDXRF measurements
and multivariate analysis.
References
1 Schnitzler, D. C.; Grassi, M. T.; Quinaia, S. P.
Aplicação de planejamento fatorial a
protocolo de extração e fixação de sulfetos
volatilizáveis por acidificação (SVA) em
amostras de sedimento. Quimica Nova 2009,
32, 1315. [CrossRef] 2 Belo, A.; Quináia, S. P.; Pletsch, A. L.
Avaliação da contaminação de metais em
sedimentos superficiais das praias do lago de
Itaipu. Quimica Nova 2010, 33, 613.
[CrossRef] 3 Sly P. G. Sediment dispersion: part 1, fine
sediments and significance of the silt/clay
ratio. Sediment/Water Interactions 1989, 50,
99. 4 Gee, G. W.; Bauder, J. W. Methods of soil
analysis: part I, 2nd ed. American Society of
Agronomy: Madison, 1986.
5 Morón, A.; García, A.; Sawchik, J.; Cozzolino,
D. Preliminary study on the use of near-
infrared reflectance spectroscopy to assess
nitrogen content of undried wheat plants.
Journal of the Science of Food and Agriculture
2007, 87, 147. [CrossRef]
6 Viscarra Rossel, R. A.; Walvoort, D. J. J.;
McBratney, A. B.; Janik, L. J.; Skjemstad, J. O.
Visible, near infrared, mid infrared or
combined diffuse reflectance spectroscopy
for simultaneous assessment of various soil
properties. Geoderma 2006, 131, 59.
[CrossRef]
7 Singh, V.; Agrawal, H. M.; Joshi, G. C.;
Sudershan, M.; Sinha, A. K. Elemental profile
of agricultural soil by the EDXRF technique
and use of the Principal Component Analysis
(PCA) method to interpret the complex data.
Applied Radiation and Isotopes 2011, 69, 969.
[CrossRef]
8 Comero S.; Locoro G.; Free G.; Vaccaro S.;
Capitani L.; Gawlik B. M. Characterisation of
Alpine lake sediments using multivariate
statistical techniques. Chemometrics and
Intelligent Laboratory Systems 2011, 107, 24.
[CrossRef]
9 Mouazen, A. M.; Kuang, B.; De
Baerdemaeker, J.; Ramon, H. Comparison
among principal component, partial least
squares and back propagation neural
network analyses for accuracy of
measurement of selected soil properties with
visible and near infrared spectroscopy.
Geoderma 2011, 158, 23. [CrossRef]
10 Du, C.; Linker, R.; Shaviv, A. Identification
of agricultural Mediterranean soils using mid-
infrared photoacoustic spectroscopy.
Geoderma 2008, 143, 85. [CrossRef]
11 Welz, B.; Sperling, M.; Resano, M. Atomic
absorption spectrometry. Willey-VCH:
Wienheim, 1999.
12 Van Grieken, R. E.; Markowicz, A. A.
Handbook of X-Ray Spectrometry, 2th ed.
Marcel Dekker Inc: New York, 2002.
13 McLaren T. I.; Guppy C. N.; Tighe M. K.;
Foster N.; Grave, P.; Lisle L. M.; Bennett J. W.
A Rapid and Nondestructive Plant Nutrient
Analysis using Portable X-Ray Fluorescence.
Soil Science Society of America Journal 2012,
76, 1436. [CrossRef]
14 Rosencwaig, A. Photoacoustics and
photoacoustic spectroscopy chemical
analysis. R. E. Krieger Publishing Company:
Malabar, 1990.
15 Santos, D. R.; Toledo, R.; Massunga, M. S.
O.; Carrió, J. G.; Auler, L. T.; Silva, E. C.;
Garcia-Quiroz, A.; Vagas, H. Photoacoustic
spectroscopy applied to the study of clay
soils. Review of Scientific Instruments 2003,
74, 355. [CrossRef]
16 Tremblay, L.; Gagné, J. P.; Distribution and
biogeochemistry of sedimentary humic
substances in the St. Lawrence Estuary and
the Saguenay Fjord, Québec. Organic
Geochemistry 2007, 38, 682. [CrossRef]
17 Bueno, M. I. M. S.; Castro, M. T. P. O.;
Souza, A. M.; Oliveira, E. B. S.; Teixeira, A. P.
X-ray scattering processes and chemometrics

Melquiades, F. L. et al.
Rev. Virtual Quim. |Vol 6| |No. 6| |1687-1701| 1701
for differentiating complex samples using
conventional EDXRF equipment.
Chemometrics and Intelligent Laboratory
Systems 2005, 78, 96. [CrossRef]
18 Kessler, T.; Hoffmann, P.; Greve, T.; Ortner,
H. M. Optimization of the identification of
chemical compounds by energy-dispersive x-
ray fluorescence spectrometry and
subsequent multivariate analysis. X-Ray
Spectrometry 2002, 31, 383. [CrossRef]
19 Yang C. Q.; Fately W. G. Optimization of
the identification of chemical compounds by
energy-dispersive x-ray fluorescence
spectrometry and subsequent multivariate
analysis. Journal of Molecular Structure 1986,
141, 279. [CrossRef]
20 Kaniu, I. M.; Angeyo, H. K.; Mangala, J. M.;
Mwala, K. A.; Bartilol S. K. Feasibility for
chemometric energy dispersive X-ray
fluorescence and scattering (EDXRFS)
spectroscopy method for rapid soil quality
assessment. X- Ray Spectrometry 2011, 40,
432. [CrossRef]
21 Ben-Dor, E.; Heller, D.; Chudnovsky, A. A
Novel Method of Classifying Soil Profiles in
the Field using Optical Means. Soil Science
Society of America Journal 2008, 72, 1113.
[CrossRef] 22
Matthias, O.; Chemometrics: Statistics and
computer application in analytical chemistry,
Wiley-VHC: Weinheim, 1999.
23 Zhu, Y.; Weindorf, D. C.; Zhang, W.
Characterizing soils using a portable X-ray
fluorescence spectrometer: 1. Soil texture.
Geoderma 2011, 167-168, 167. [CrossRef] 24
Massart, D. L., Vandeginste, B. G. M.,
Buydens, S. J.; Lewi, P. J.; Smeyers-Verbeke,
J.; Handbook of Chemometrics and
Qualimetrics: Parte B., Elsevier: Amsterdam,
1997.
25 Kalwa, M.; Quináia, S. P.; Pletsch, A. L.;
Techy, L.; Felsner, M. L. Fractionation and
Potential Toxic Risk of Metals From
Superficial Sediment in Itaipu Lake—Boundary Between Brazil and Paraguay.
Archives of Environmental Contamination and
Toxicology 2013, 64, 12. [CrossRef] 26
Clemente, E. P.; Schaefer C. E. R. G.;
Oliveira, F. S.; Marciano, L. C.; Clemente, A. D.
Geoquímica dos solos da Ilha da Trindade,
Atlântico Sul, Brasil. Geociência. 2012, 31, 31. 27
Quinaia, S. P., Cavagnoli, A. R.; Martins, V.
J. Avaliação da distribuição de Cr, Pb e Cu em
sedimentos superficiais. Revista Ciências
Exatas e Naturais 2009, 11, 49. 28
Fadigas, F. S.; Amaral-Sobrinho, N. M. B;
Mazur, N.; Anjos, L. H. C.; Freixo, A. A.
Concentrações naturais de metais pesados
em algumas classes de solos brasileiros.
Bragantia 2002, 61, 151. [CrossRef] 29
Cotta, J.; Rezende, M.; Piovani, M. R.
Avaliação do teor de metais em sedimento
do Rio Betari no Parque Estadual Turístico do
Alto Ribeira–PETAR. Química Nova 2006, 29,
40. [CrossRef] 30
American Public Health Association;
Standard methods for the examination of
water and wastewater, 21st ed.
APHA:Washington, DC, 2001. 31
Förstner, U.; Wittmann, G. T. W.; Metal
pollution in the aquatic environment, 2th ed.
Springer-Verlag: New York, 1981. [CrossRef]