Embed Size (px)
Citation preview
William M. J. GreenSenior Manager, Photonic and Nanoscale Systems
Methane Trace-Gas Sensing Enabled by Silicon Photonic Integration
Princeton University
Laser Sensing LaboratoryChi Xiong, Marwan Khater, Yves Martin, Eric J. Zhang, Chu C.
Teng, Jason S. Orcutt, Laurent Schares, Tymon Barwicz, Nathan Marchack, Steven J. Holmes, Swetha Kamlapurkar, Sebastian Engelmann, and Gerard Wysocki
©2017 IBM Corporation2 12 August 2017
Acknowledgement
Partial funding provided by ARPA-E MONITOR Program
The information, data, or work presented hereinwas funded in part by the Advanced ResearchProjects Agency-Energy (ARPA-E), U.S. Departmentof Energy, under Award Number DE-AR0000540.The views and opinions of authors expressed hereindo not necessarily state or reflect those of theUnited States Government or any agency thereof.
©2017 IBM Corporation3 12 August 2017
Oil and Gas Industry use case for innovative trace gas sensors and sensor networks
Evanescent field waveguide sensor design
Spectral extraction, noise analysis, and long-term stability
Integration of an on-chip reference cell and III-V / Si hybrid laser
Summary
Outline

©2017 IBM Corporation4 12 August 2017
Why Manage Methane Emissions? Natural gas is considered as a source of clean energy:
Compared with coal, burning natural gas produces ½ as much CO2 per unit of energy generated
“Bridge fuel” for lowering emissions while transitioning from fossil fuels to renewable energy sources
But….
Leaking more than ~2-3% of natural gas produced, processed, stored, and delivered would negate its global warming advantage:
Various estimates place leakage rate at 1.6%-10% of total production! (depending upon location/study)
– D.T. Allen et al., PNAS 2013; A. R. Brandt et al., Science 2014; Inventory of U.S. Greenhouse Gas Emissions and Sinks, U.S. EPA.
N. Phillips et al., Env. Pol. 2013
Production: > 0.5M US wells
Distribution: ~ 3M miles of pipeline
Delivery: Leaky aging urban infrastructure
Fugitive emissions can eliminate advantage
over burning coal
Boston, NYC, DC… http://www.huffingtonpost.com/2015/03/26/east-village-explosion_n_6950116.htmlhttp://edition.cnn.com/2014/03/15/us/aging-gas-infrastructure/
East Harlem 2014East Village 2015
Urban safety implications
©2017 IBM Corporation5 12 August 2017
Wellhead
Combustor
Condensate tanks
Separation unit
US Energy Information Administration
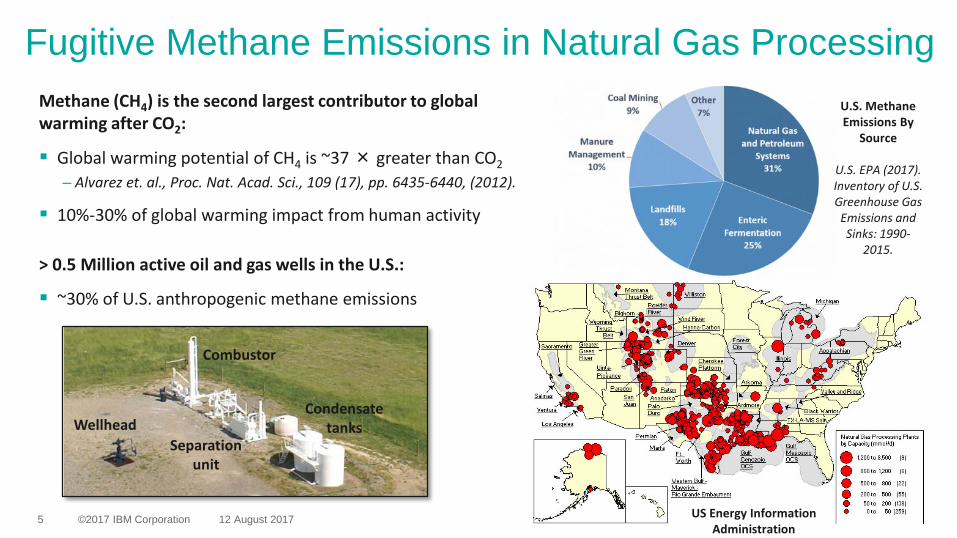
Methane (CH4) is the second largest contributor to global warming after CO2:
Global warming potential of CH4 is ~37 × greater than CO2– Alvarez et. al., Proc. Nat. Acad. Sci., 109 (17), pp. 6435-6440, (2012).
10%-30% of global warming impact from human activity
> 0.5 Million active oil and gas wells in the U.S.:
~30% of U.S. anthropogenic methane emissions
Fugitive Methane Emissions in Natural Gas ProcessingU.S. Methane Emissions By
Source
U.S. EPA (2017). Inventory of U.S. Greenhouse Gas Emissions and Sinks: 1990-
2015.

©2017 IBM Corporation6 12 August 2017
An Intelligent Multi-Modal Methane Measurement System (AIMS)
Opportunity – Apply Physical Analytics / IoT Solutions to:
Significantly reduce fugitive CH4 emissions across the oil and gas industry
Improve production efficiency and safety, reduce cost
Comply with emissions regulations
Harness the full potential of natural gas as a clean fuel
Technological driver: ARPA-E MONITOR Program
Cost-effective sensor network enabling continuous monitoring for CH4 leak detection, localization, and repair
No viable technology today: Alignment of performance with required cost point is very challenging with today’s technology
Use Case for Innovative Sensor Networks
©2017 IBM Corporation7 12 August 2017
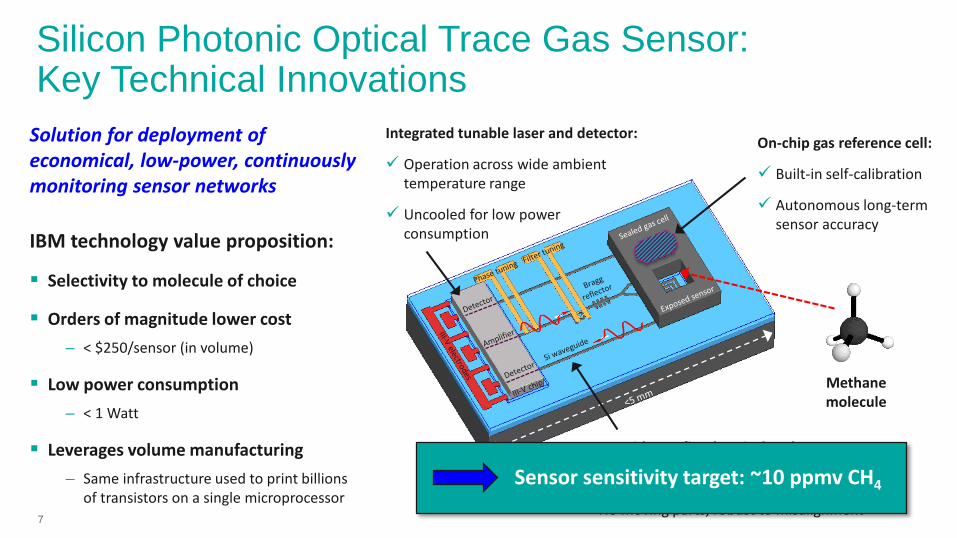
Integrated tunable laser and detector:
Operation across wide ambient temperature range
Uncooled for low power consumption
On-chip gas reference cell:
Built-in self-calibration
Autonomous long-term sensor accuracy
Waveguide-confined optical path:
Low-cost volume manufacturing and packaging
No moving parts, robust to misalignment
Methane molecule
Solution for deployment of economical, low-power, continuously monitoring sensor networks
IBM technology value proposition:
Selectivity to molecule of choice
Orders of magnitude lower cost – < $250/sensor (in volume)
Low power consumption– < 1 Watt
Leverages volume manufacturing– Same infrastructure used to print billions
of transistors on a single microprocessor
Silicon Photonic Optical Trace Gas Sensor: Key Technical Innovations
Sensor sensitivity target: ~10 ppmv CH4
©2017 IBM Corporation8 12 August 2017
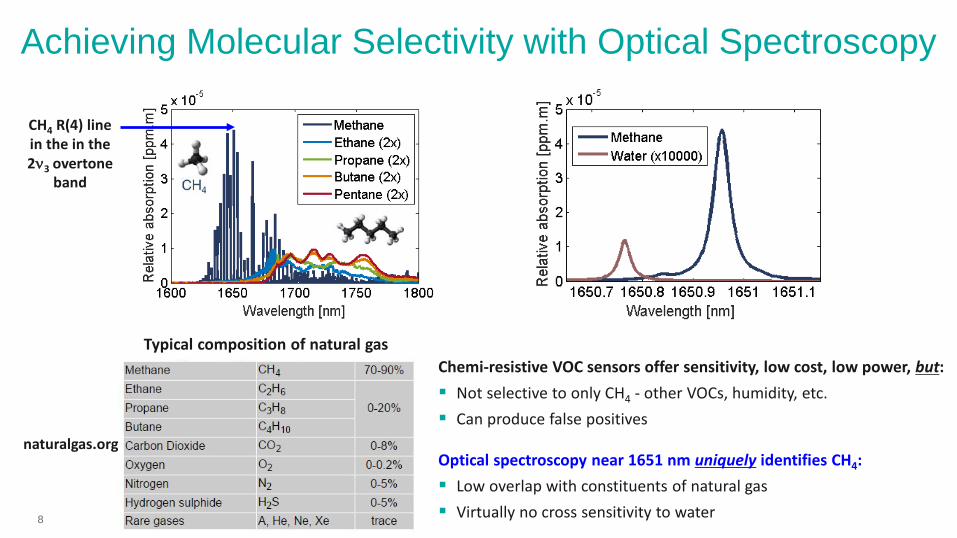
CH4 R(4) line in the in the 2ν3 overtone
band
naturalgas.org
Chemi-resistive VOC sensors offer sensitivity, low cost, low power, but: Not selective to only CH4 - other VOCs, humidity, etc. Can produce false positives
Optical spectroscopy near 1651 nm uniquely identifies CH4: Low overlap with constituents of natural gas Virtually no cross sensitivity to water
Typical composition of natural gas
Achieving Molecular Selectivity with Optical Spectroscopy
©2017 IBM Corporation9 12 August 2017
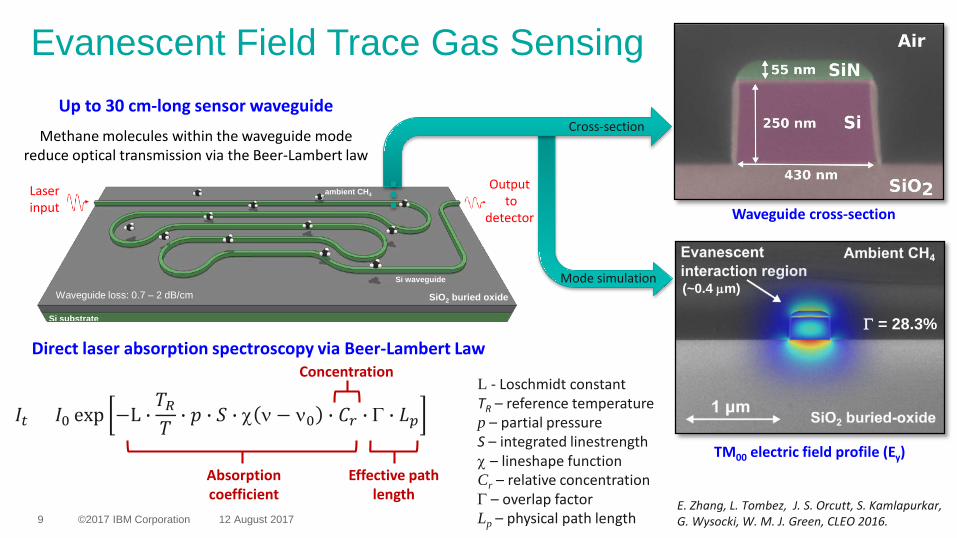
SiO2 buried oxide
Si substrate
Si waveguide
ambient CH4laser input
output to detector
(~0.4 µm)
Evanescent Field Trace Gas Sensing
E. Zhang, L. Tombez, J. S. Orcutt, S. Kamlapurkar, G. Wysocki, W. M. J. Green, CLEO 2016.
Waveguide loss: 0.7 – 2 dB/cm
Up to 30 cm-long sensor waveguide
Methane molecules within the waveguide mode reduce optical transmission via the Beer-Lambert law
TM00 electric field profile (Ey)
Waveguide cross-section
Absorption coefficient
Direct laser absorption spectroscopy via Beer-Lambert Law
L - Loschmidt constantTR – reference temperaturep – partial pressureS – integrated linestrengthχ – lineshape functionCr – relative concentrationΓ – overlap factorLp – physical path length
Effective path length
𝐼𝐼𝑡𝑡 = 𝐼𝐼0 exp −L �𝑇𝑇𝑅𝑅𝑇𝑇� 𝑝𝑝 � 𝑆𝑆 � χ ν− ν0 � 𝐶𝐶𝑟𝑟 � Γ � 𝐿𝐿𝑝𝑝
Laser input
Outputto
detector
Mode simulation
Cross-section
Concentration
Γ = 28.3%
©2017 IBM Corporation10 12 August 2017
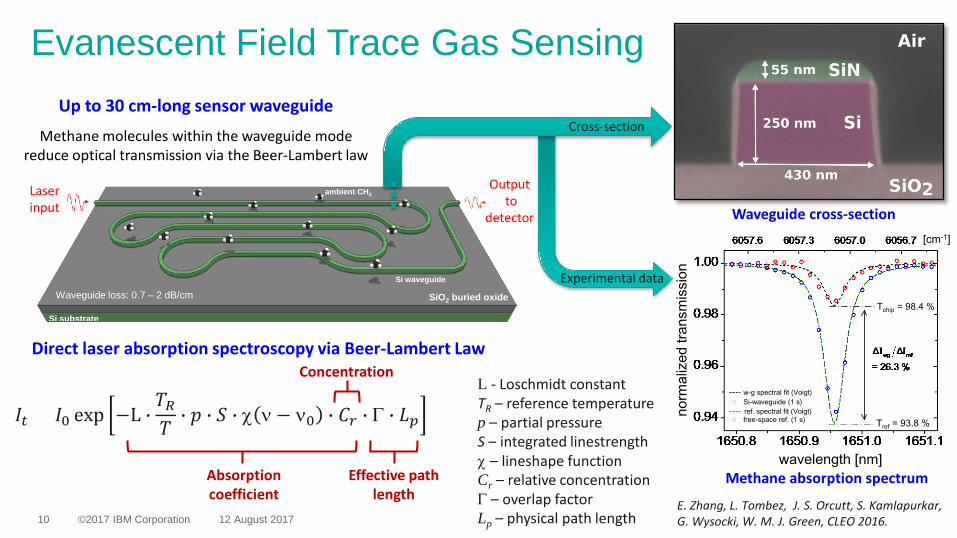
SiO2 buried oxide
Si substrate
Si waveguide
ambient CH4laser input
output to detector
Evanescent Field Trace Gas Sensing
E. Zhang, L. Tombez, J. S. Orcutt, S. Kamlapurkar, G. Wysocki, W. M. J. Green, CLEO 2016.
Waveguide loss: 0.7 – 2 dB/cm
Up to 30 cm-long sensor waveguide
Methane molecules within the waveguide mode reduce optical transmission via the Beer-Lambert law
Methane absorption spectrum
Waveguide cross-section
Absorption coefficient
Direct laser absorption spectroscopy via Beer-Lambert Law
L - Loschmidt constantTR – reference temperaturep – partial pressureS – integrated linestrengthχ – lineshape functionCr – relative concentrationΓ – overlap factorLp – physical path length
Effective path length
𝐼𝐼𝑡𝑡 = 𝐼𝐼0 exp −L �𝑇𝑇𝑅𝑅𝑇𝑇� 𝑝𝑝 � 𝑆𝑆 � χ ν− ν0 � 𝐶𝐶𝑟𝑟 � Γ � 𝐿𝐿𝑝𝑝
Laser input
Experimental data
Cross-section
Concentration
wavelength [nm]
norm
aliz
ed tr
ansm
issi
on
Tref = 93.8 %
Tchip = 98.4 %
ref. spectral fit (Voigt)Si-waveguide (1 s)w-g spectral fit (Voigt)
free-space ref. (1 s)
[cm-1]
Outputto
detector
©2017 IBM Corporation11 12 August 2017
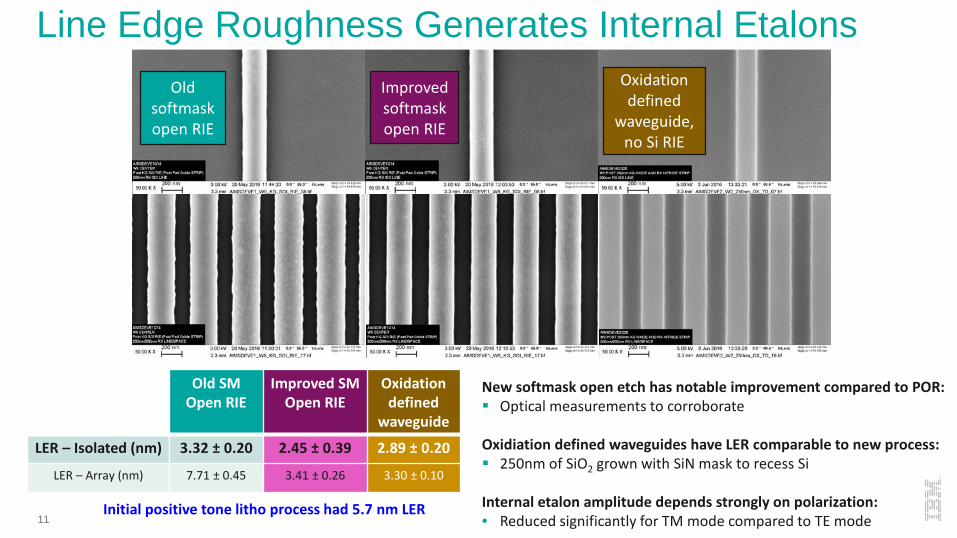
New softmask open etch has notable improvement compared to POR: Optical measurements to corroborate
Oxidiation defined waveguides have LER comparable to new process: 250nm of SiO2 grown with SiN mask to recess Si
Internal etalon amplitude depends strongly on polarization: • Reduced significantly for TM mode compared to TE mode
Old SM Open RIE
Improved SM Open RIE
Oxidation defined
waveguide
LER – Isolated (nm) 3.32 ± 0.20 2.45 ± 0.39 2.89 ± 0.20
LER – Array (nm) 7.71 ± 0.45 3.41 ± 0.26 3.30 ± 0.10
Line Edge Roughness Generates Internal Etalons
Initial positive tone litho process had 5.7 nm LER
Old softmask open RIE
Improved softmask open RIE
Oxidation defined
waveguide, no Si RIE
©2017 IBM Corporation12 12 August 2017
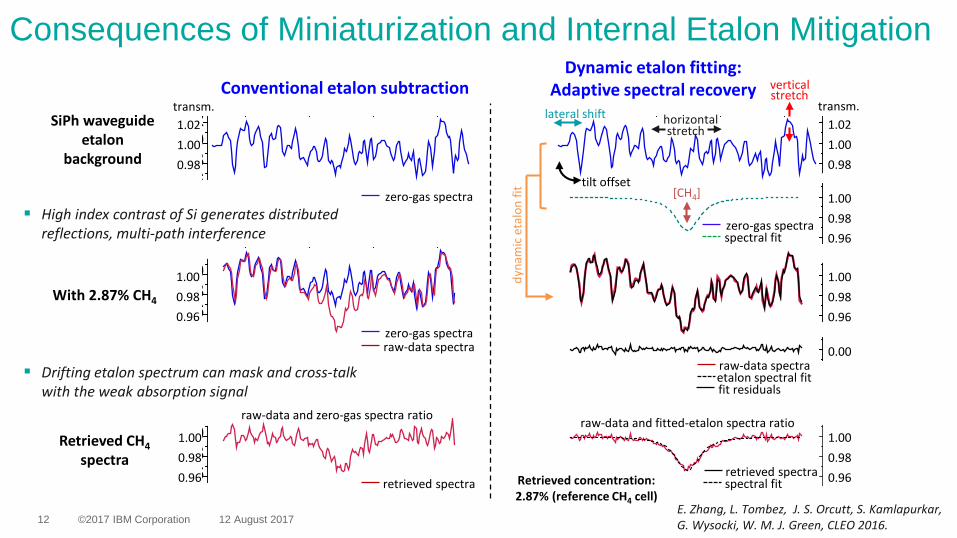
Consequences of Miniaturization and Internal Etalon Mitigation
1.000.980.96
0.00raw-data spectraetalon spectral fitfit residuals
dyna
mic
eta
lon
fit
1.021.000.98
transm.horizontalstretch
vertical stretch
lateral shift
tilt offset
Dynamic etalon fitting: Adaptive spectral recovery
1.000.980.96
zero-gas spectraspectral fit
[CH4]
1.000.980.96retrieved spectra
spectral fit
raw-data and fitted-etalon spectra ratio
Retrieved concentration:2.87% (reference CH4 cell)
46802
1.000.980.96
zero-gas spectraraw-data spectra
With 2.87% CH4
6802
1.021.000.98
zero-gas spectra
transm.Conventional etalon subtraction
SiPh waveguide etalon
background
6802
1.000.980.96 retrieved spectra
raw-data and zero-gas spectra ratio
Retrieved CH4spectra
E. Zhang, L. Tombez, J. S. Orcutt, S. Kamlapurkar, G. Wysocki, W. M. J. Green, CLEO 2016.
High index contrast of Si generates distributed reflections, multi-path interference
Drifting etalon spectrum can mask and cross-talk with the weak absorption signal
©2017 IBM Corporation13 12 August 2017
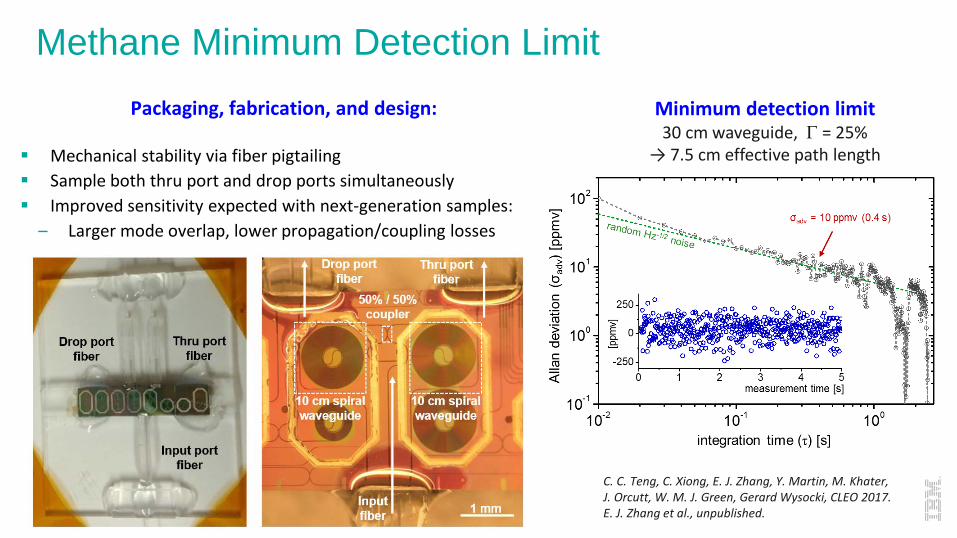
Packaging, fabrication, and design:
Mechanical stability via fiber pigtailing Sample both thru port and drop ports simultaneously Improved sensitivity expected with next-generation samples:
– Larger mode overlap, lower propagation/coupling losses
Methane Minimum Detection Limit
C. C. Teng, C. Xiong, E. J. Zhang, Y. Martin, M. Khater, J. Orcutt, W. M. J. Green, Gerard Wysocki, CLEO 2017. E. J. Zhang et al., unpublished.
Minimum detection limit30 cm waveguide, Γ = 25%
→ 7.5 cm effective path length
©2017 IBM Corporation14 12 August 2017
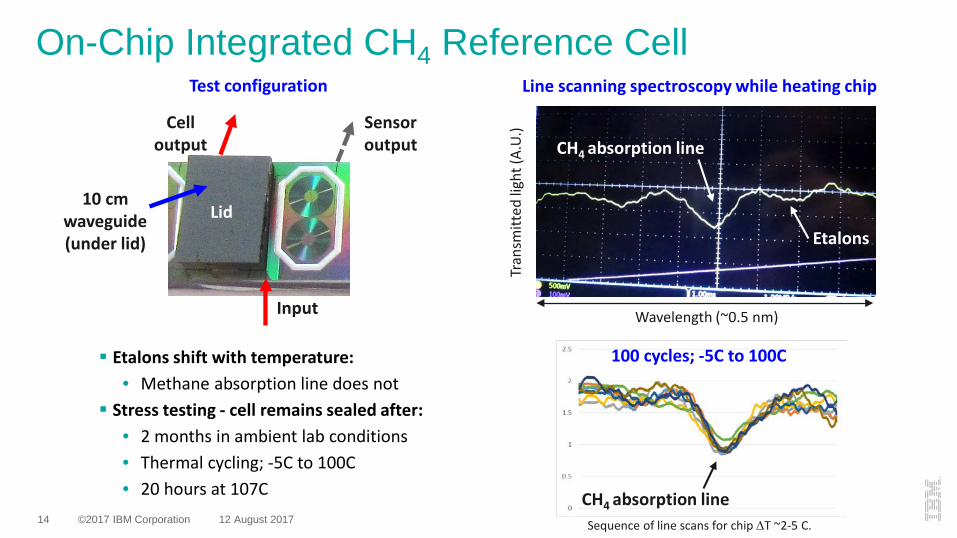
Sensor output
Etalons shift with temperature:• Methane absorption line does not
Stress testing - cell remains sealed after: • 2 months in ambient lab conditions• Thermal cycling; -5C to 100C• 20 hours at 107C
Line scanning spectroscopy while heating chip
Etalons
CH4 absorption line
Wavelength (~0.5 nm)
Tran
smitt
ed li
ght (
A.U.
)
On-Chip Integrated CH4 Reference Cell
Input
Cell output
Test configuration
100 cycles; -5C to 100C
Sequence of line scans for chip ∆T ~2-5 C.
CH4 absorption line
10 cm waveguide(under lid)
Lid
©2017 IBM Corporation15 12 August 2017
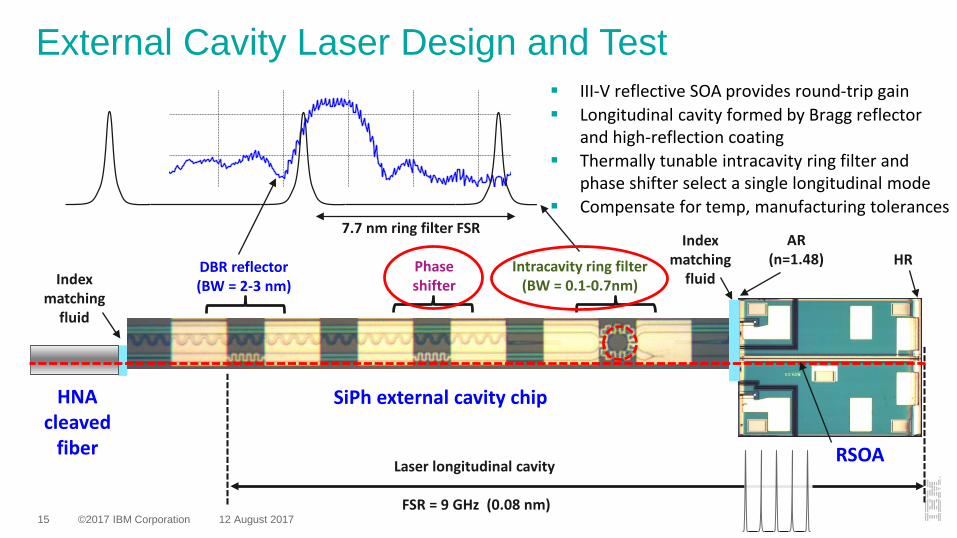
RSOA
HR
SiPh external cavity chip
Intracavity ring filter(BW = 0.1-0.7nm)
DBR reflector(BW = 2-3 nm)
HNA cleaved
fiberLaser longitudinal cavity
FSR = 9 GHz (0.08 nm)
Phase shifter
External Cavity Laser Design and Test
Index matching
fluid
7.7 nm ring filter FSR
III-V reflective SOA provides round-trip gain Longitudinal cavity formed by Bragg reflector
and high-reflection coating Thermally tunable intracavity ring filter and
phase shifter select a single longitudinal mode Compensate for temp, manufacturing tolerances
AR(n=1.48)
Index matching
fluid
©2017 IBM Corporation16 12 August 2017
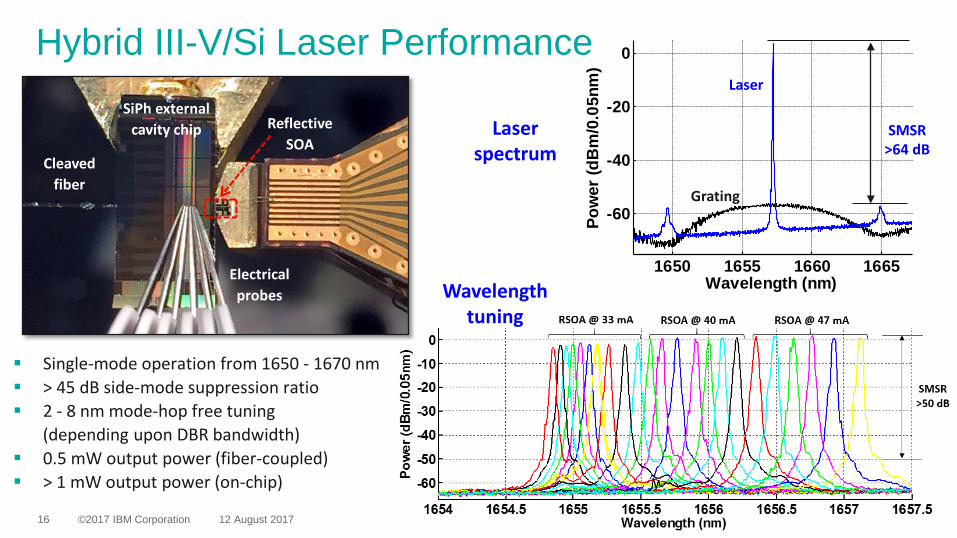
SiPh external cavity chip Reflective
SOACleaved
fiber
Electrical probes
Single-mode operation from 1650 - 1670 nm > 45 dB side-mode suppression ratio 2 - 8 nm mode-hop free tuning
(depending upon DBR bandwidth) 0.5 mW output power (fiber-coupled) > 1 mW output power (on-chip)
Hybrid III-V/Si Laser Performance
Wavelength tuning
Laser spectrum
1650 1655 1660 1665
-60
-40
-20
0
Wavelength (nm)
Pow
er (d
Bm
/0.0
5nm
)
SMSR >64 dB
Grating
Laser
©2017 IBM Corporation17 12 August 2017
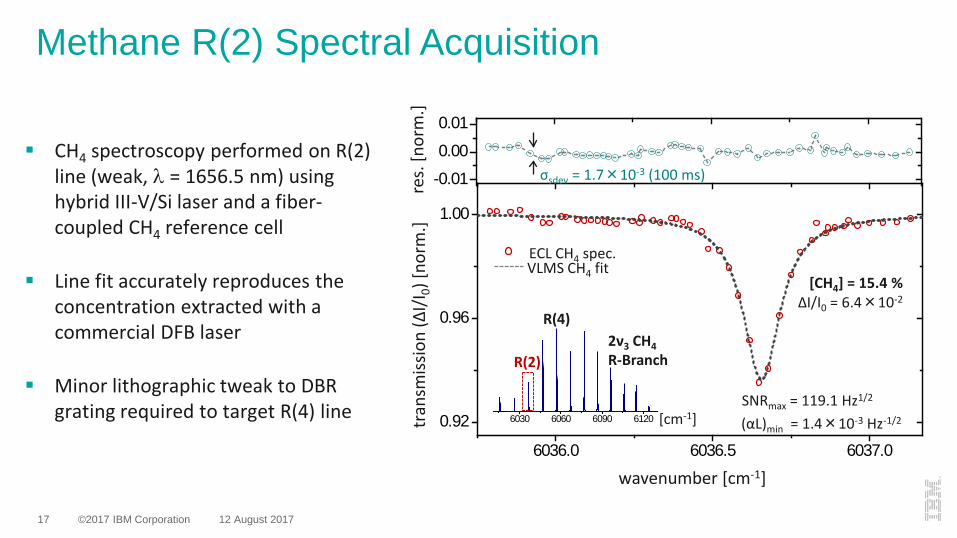
CH4 spectroscopy performed on R(2) line (weak, λ = 1656.5 nm) using hybrid III-V/Si laser and a fiber-coupled CH4 reference cell
Line fit accurately reproduces the concentration extracted with a commercial DFB laser
Minor lithographic tweak to DBR grating required to target R(4) line
Methane R(2) Spectral Acquisition
-0.01
0.00
0.01
6036.0 6036.5 6037.0
0.92
0.96
1.00
6030 6060 6090 6120
σsdev = 1.7×10⁻³ (100 ms)
[CH4] = 15.4 %ΔI/I0 = 6.4×10⁻²
wavenumber [cm-1]
tran
smiss
ion
(ΔI/
I 0) [n
orm
.]re
s. [n
orm
.]SNRmax = 119.1 Hz1/2
2ν3 CH4R-Branch R(2)
R(4)
[cm-1] (αL)min = 1.4×10⁻³ Hz-1/2
ECL CH4 spec.VLMS CH4 fit
©2017 IBM Corporation18 12 August 2017
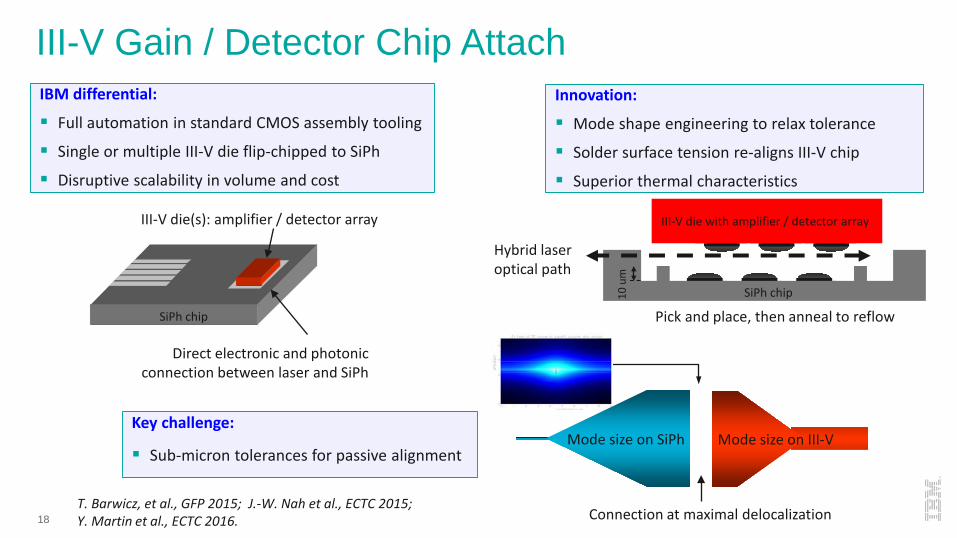
Pick and place, then anneal to reflow
III-V Gain / Detector Chip Attach
III-V die with amplifier / detector array
SiPh chip
III-V die(s): amplifier / detector array
Direct electronic and photonicconnection between laser and SiPh
10 u
m
Mode size on SiPh Mode size on III-V
Connection at maximal delocalization
SiPh chip
Hybrid laser optical path
IBM differential:
Full automation in standard CMOS assembly tooling
Single or multiple III-V die flip-chipped to SiPh
Disruptive scalability in volume and cost
Key challenge:
Sub-micron tolerances for passive alignment
Innovation:
Mode shape engineering to relax tolerance
Solder surface tension re-aligns III-V chip
Superior thermal characteristics
T. Barwicz, et al., GFP 2015; J.-W. Nah et al., ECTC 2015; Y. Martin et al., ECTC 2016.
©2017 IBM Corporation19 12 August 2017
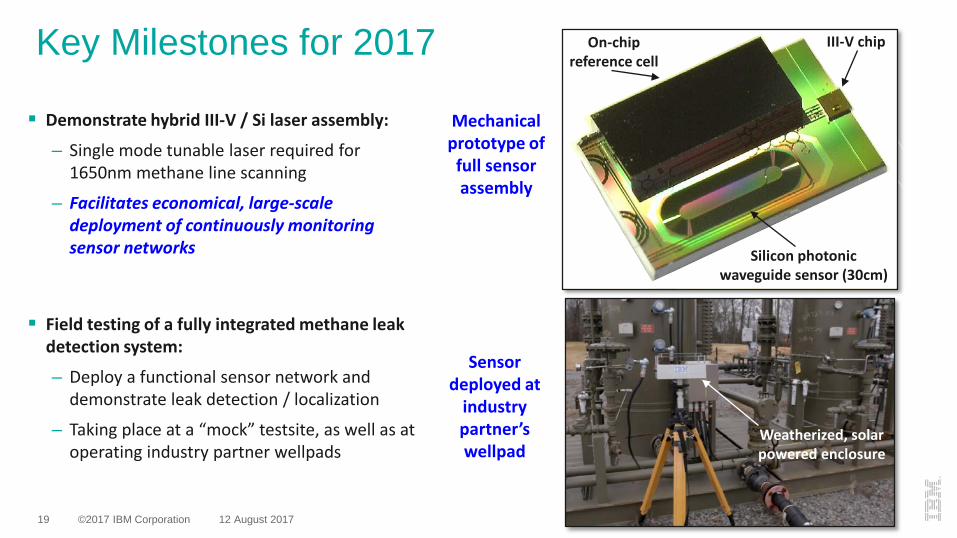
Key Milestones for 2017
Mechanical prototype of
full sensor assembly
Demonstrate hybrid III-V / Si laser assembly:
– Single mode tunable laser required for 1650nm methane line scanning
– Facilitates economical, large-scale deployment of continuously monitoring sensor networks
Field testing of a fully integrated methane leak detection system:
– Deploy a functional sensor network and demonstrate leak detection / localization
– Taking place at a “mock” testsite, as well as at operating industry partner wellpads
On-chip reference cell
III-V chip
Silicon photonic waveguide sensor (30cm)
Sensor deployed at
industry partner’s wellpad
Weatherized, solar powered enclosure
©2017 IBM Corporation20 12 August 2017
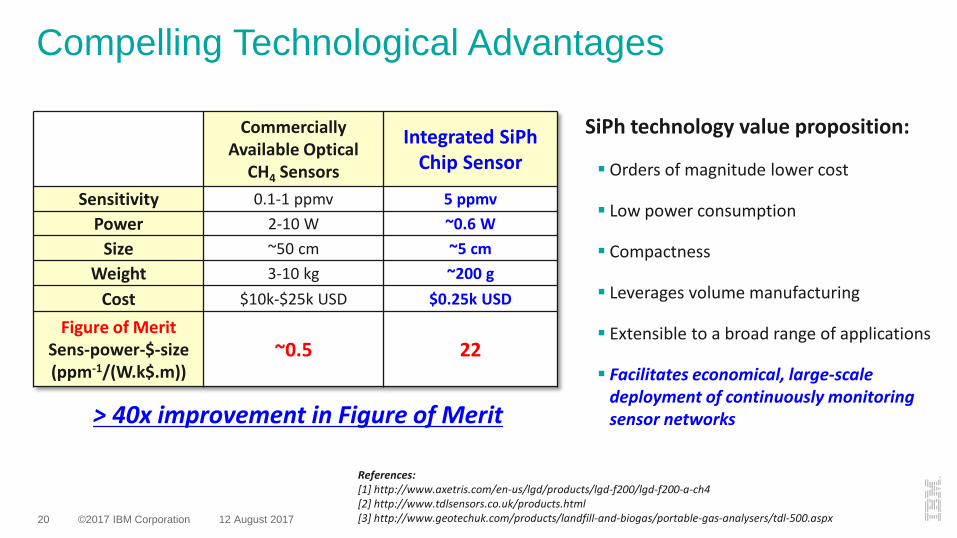
Commercially Available Optical
CH4 Sensors
Integrated SiPh Chip Sensor
Sensitivity 0.1-1 ppmv 5 ppmvPower 2-10 W ~0.6 W
Size ~50 cm ~5 cmWeight 3-10 kg ~200 g
Cost $10k-$25k USD $0.25k USD
Figure of MeritSens-power-$-size (ppm-1/(W.k$.m))
~0.5 22
References: [1] http://www.axetris.com/en-us/lgd/products/lgd-f200/lgd-f200-a-ch4[2] http://www.tdlsensors.co.uk/products.html[3] http://www.geotechuk.com/products/landfill-and-biogas/portable-gas-analysers/tdl-500.aspx
SiPh technology value proposition:
Orders of magnitude lower cost
Low power consumption
Compactness
Leverages volume manufacturing
Extensible to a broad range of applications
Facilitates economical, large-scale deployment of continuously monitoring sensor networks> 40x improvement in Figure of Merit
Compelling Technological Advantages

©2017 IBM Corporation21 12 August 2017
Thank You!
IBM T.J. Watson Research Center