Embed Size (px)
Citation preview
Appl Phys B (2012) 107:459–467DOI 10.1007/s00340-012-4908-x
Compact QEPAS sensor for trace methane and ammoniadetection in impure hydrogen
L. Dong · J. Wright · B. Peters · B.A. Ferguson ·F.K. Tittel · S. McWhorter
Received: 5 December 2011 / Published online: 12 May 2012© Springer-Verlag 2012
Abstract A compact two-gas sensor based on quartz-enhanced photoacoustic spectroscopy (QEPAS) was de-veloped for trace methane and ammonia quantification inimpure hydrogen. The sensor is equipped with a micro-resonator to confine the sound wave and enhance QEPASsignal. The normalized noise-equivalent absorption coef-ficients (1σ) of 2.45 × 10⁻⁸ cm−1 W/√Hz and 9.1 ×10⁻⁹ cm−1 W/√Hz for CH4 detection at 200 Torr and NH3
detection at 50 Torr were demonstrated with the QEPAS sen-sor configuration, respectively. The influence of water vaporon the CH4 channel was also investigated.
1 Introduction
The development of robust and compact optical sensorsfor muti-gas detection is of considerable interest in diverseapplications, such as gas purity measurements, industrialprocessing control, environmental monitoring and medicaldiagnostics. Quartz-enhanced photoacoustic spectroscopy(QEPAS) is a rapidly developing, sensitive, selective spec-troscopic technique for laser-based trace gas detection with afast response time [1, 2]. QEPAS combines the main charac-teristics of photoacoustic spectroscopy (PAS) with the ben-efits of using a quartz tuning fork (QTF), thus providingan ultra-compact, cost-effective, robust acoustic detection
L. Dong · F.K. Tittel (�)Department of Electrical and Computer Engineering, RiceUniversity, 6100 Main Street, Houston TX 77005, USAe-mail: [email protected]
J. Wright · B. Peters · B.A. Ferguson · S. McWhorterHydrogen Technology Research Laboratory, Savannah RiverNational Laboratory, Aiken, SC 29808, USA
module (ADM). Moreover, QEPAS can achieve sensitivitiescomparable to conventional PAS, but with reduced ambientacoustic noise due to the acoustic quadrupole nature of theQTF [3].
The micro-resonator (mR) plays a crucial role in QEPASsensors and acts similarly to the acoustic resonator in con-ventional PAS [4]. In the QEPAS sensor architecture, themR consists of two rigid hypodermic tubes that surround theQTF. The energy of the acoustic wave induced by radiationexcitation is accumulated in the mR by means of the reso-nant effect and subsequently transferred to the QTF as theresult of coupling between the mR and QTF. Recent studiesreported that the optimal length of each mR tube is betweenλs/4 and λs/2 where λs is the wavelength of sound [3, 5].The results reported in Ref. [3] showed that an optimizedmR configuration can further improve the QEPAS signal-to-noise ratio (SNR) by up to 30 times, as compared to using abare QTF.
To date, the QEPAS sensor technique has been em-ployed to detect, monitor and quantify several moleculeswith well resolved rotational-vibrational lines in the near-infrared spectral range (e.g., NH3, CO2, CO, HCN, HCl,H2O, H2S, CH4, C2H2, C2H4) [6–10] as well as in the mid-infrared spectral region (e.g., NO, N2O, CO, NH3, C2H6,and CH2O) [11–16]. QEPAS has also been demonstratedwith larger molecules with broad, unresolved absorptionspectra, such as ethanol, acetone and Freon [17]. However,QEPAS-based sensors reported above were primarily devel-oped for monitoring target gas concentrations for N2 or airas the carrier gas. In this work we report the design, devel-opment and optimization of a compact trace methane (CH4)and ammonia (NH3) QEPAS-based sensor platform if im-pure H2 is the carrier gas. Detection and quantitative mea-surement of trace impurities including CH4 and NH3 in hy-drogen gas process streams is of critical importance to re-
460 L. Dong et al.
finement and purification of hydrogen isotopologues at theSavannah River National Laboratory (SRNL), Aiken, SC.The QEPAS technique presents a unique, new methodologyfor impurity analysis within impure hydrogen gas streams.The reported speed of sound in hydrogen is 1330 m/s atroom temperature [18] which is ∼4 times faster than in air,since the density of H2 is only 1/14 of the density of air.The parameters and the performance of mR are strongly de-pendent on the properties of the carrier gas, in particular thegas density, speed of sound within the gas. Thus, the mRused in N2 or air is no longer optimized when H2 is the car-rier gas. The mR parameters must be reoptimized in orderto meet the requirement of the H2 carrier gas environment.Furthermore, the QEPAS sensor detection sensitivity can beaffected by the conversion efficiency of the absorbed opticalradiation power into the sound energy, which is determinedby the vibrational-to-translational (V-T) energy transfer rateof the target gas. This rate usually changes with differentcarrier gases and in the presence of H2O vapor, which isan efficient catalyst for the vibrational energy transfer re-actions in the gas phase. We also performed a side-by-sideinter-comparison between the new QEPAS sensor and thepreviously reported QEPAS sensor designed for detectingtrace CH4 and NH3 in H2 and in N2 carriers, respectively.
2 Sensor design
The diode laser based QEPAS sensors employ commerciallyavailable QTFs that are designed for use as the frequencyreference at a resonant frequency of ∼32.8 kHz. The speedof sound at room temperature in air is ∼340 m/s [18]. Basedon Ref. [3, 5], the empirically determined optimal mR tubelength was 4.4 mm in N2, which is between λs/4 and λs/2,as mentioned above. The optimal mR tube inner diameterwas ∼0.5 mm. However, with hydrogen as the carrier gas,the estimated optimal mR tube length was ∼20 mm due tothe fast speed of sound. Thus, the total length of the twomR tubes employed in one ADM for the sensor platformsincreased to ∼40 mm. This increased mR length representsa challenge to focus the excitation diode laser beam passingthrough the 40-mm-long mR and the 300-µm gap betweenthe prongs of the QTF without optical contact. In fact, anyoptical contact between the diode laser excitation radiationand the mR or QTF results in an undesirable, non-zero back-ground, which can be more than ten times larger than thethermal noise level of QEPAS [12]. As a result, the ∼20-mm optimized mR tube length (which must be matched tothe acoustic wavelength so that the acoustic energy can beefficiently accumulated in the mR tube) is no longer suitablefor QEPAS-based trace gas detection in H2.
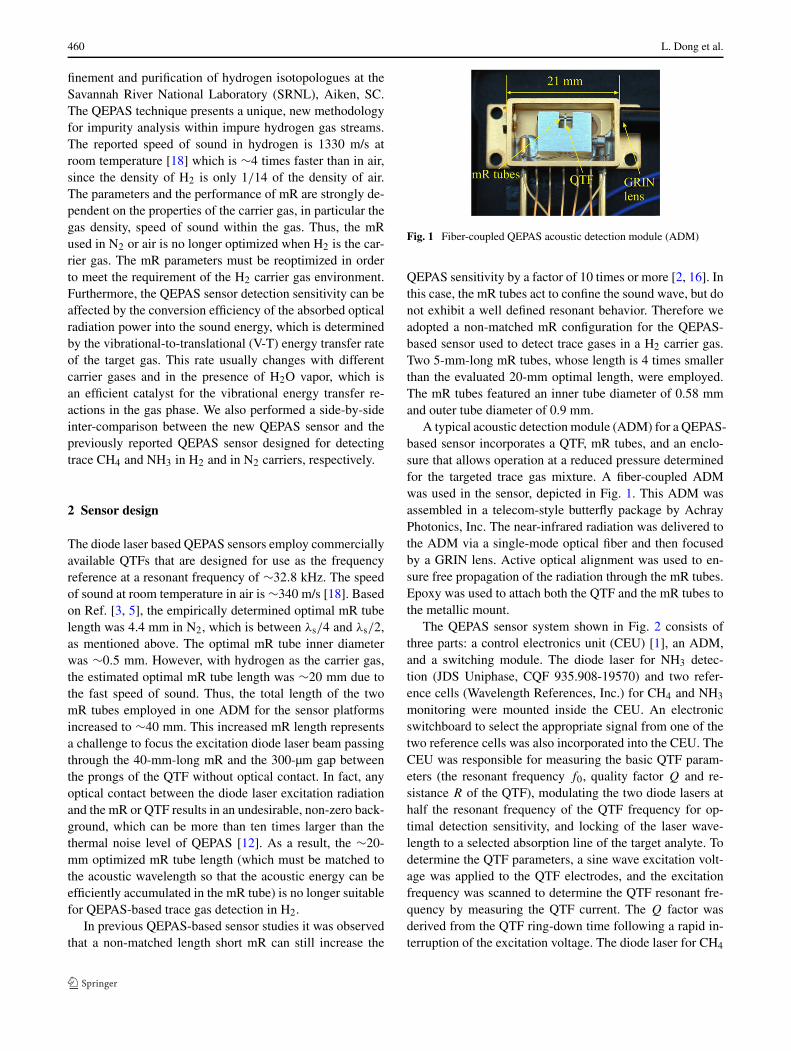
In previous QEPAS-based sensor studies it was observedthat a non-matched length short mR can still increase the
Fig. 1 Fiber-coupled QEPAS acoustic detection module (ADM)
QEPAS sensitivity by a factor of 10 times or more [2, 16]. Inthis case, the mR tubes act to confine the sound wave, but donot exhibit a well defined resonant behavior. Therefore weadopted a non-matched mR configuration for the QEPAS-based sensor used to detect trace gases in a H2 carrier gas.Two 5-mm-long mR tubes, whose length is 4 times smallerthan the evaluated 20-mm optimal length, were employed.The mR tubes featured an inner tube diameter of 0.58 mmand outer tube diameter of 0.9 mm.
A typical acoustic detection module (ADM) for a QEPAS-based sensor incorporates a QTF, mR tubes, and an enclo-sure that allows operation at a reduced pressure determinedfor the targeted trace gas mixture. A fiber-coupled ADMwas used in the sensor, depicted in Fig. 1. This ADM wasassembled in a telecom-style butterfly package by AchrayPhotonics, Inc. The near-infrared radiation was delivered tothe ADM via a single-mode optical fiber and then focusedby a GRIN lens. Active optical alignment was used to en-sure free propagation of the radiation through the mR tubes.Epoxy was used to attach both the QTF and the mR tubes tothe metallic mount.
The QEPAS sensor system shown in Fig. 2 consists ofthree parts: a control electronics unit (CEU) [1], an ADM,and a switching module. The diode laser for NH3 detec-tion (JDS Uniphase, CQF 935.908-19570) and two refer-ence cells (Wavelength References, Inc.) for CH4 and NH3
monitoring were mounted inside the CEU. An electronicswitchboard to select the appropriate signal from one of thetwo reference cells was also incorporated into the CEU. TheCEU was responsible for measuring the basic QTF param-eters (the resonant frequency f0, quality factor Q and re-sistance R of the QTF), modulating the two diode lasers athalf the resonant frequency of the QTF frequency for op-timal detection sensitivity, and locking of the laser wave-length to a selected absorption line of the target analyte. Todetermine the QTF parameters, a sine wave excitation volt-age was applied to the QTF electrodes, and the excitationfrequency was scanned to determine the QTF resonant fre-quency by measuring the QTF current. The Q factor wasderived from the QTF ring-down time following a rapid in-terruption of the excitation voltage. The diode laser for CH4

Compact QEPAS sensor for trace methane and ammonia detection in impure hydrogen 461
Fig. 2 Schematic of a compacttwo-gas QEPAS sensor. TS, PS,HS—temperature, pressure, andhumidity sensors,ADM—acoustic detectionmodule, TA—transimpedanceamplifier, DL1, DL2—diodelasers, CEU—controlelectronics unit
detection (NEL, NLK1U5FAAA) and a 4 × 4 MEMs op-tical switch were mounted in the switching module. The4 × 4 MEMS switch was realized by combining two 1 × 4switches (LightBand Mini 1×4, Agiltron, Inc.). The MEMsswitch was controlled to direct either of the two diode lasersto the ADM via a parallel 4-bit binary code provided bythe CEU. The QEPAS-based sensor head consisted of theADM and a compact enclosure in which ultra small temper-ature, pressure and humidity sensors were mounted. Finally,a notebook PC computer communicated with the CEU viaa RS232 serial port for collection of 2f harmonic data andgas temperature, humidity, pressure parameters.
3 Signal amplitude and noise sources of QEPAS
The QEPAS signal SQEPAS can be expressed as [19]
SQEPAS = CADMP0CQ(p)α(p)ε(p), (1)
where CADM is the ADM constant, P0 is the incident opti-cal power, C the detected gas concentration, Q the qualityfactor of the QTF, α the peak intensity of the 2f absorp-tion spectrum, and ε is the conversion efficiency of the ab-sorbed optical radiation power into acoustic energy. Q,α,and ε are pressure dependent. In addition, the peak inten-sity α depends on the laser wavelength modulation (WM)depth. When the modulation width is close to the absorptionlinewidth, the maximum 2f signal is achieved. Therefore inorder to optimize the sensor performance, both the gas pres-sure and the WM depth must be appropriately selected.
Assuming only collision deexcitation between moleculesis taken into account, it is known that the conversion effi-ciency is related to the relaxation time τ of a target gas as
follows [20, 21]:
ε(p) = 1√1 + tan2 θ
, (2)
tan θ = 2πf τ(p), (3)
τ(p) = P0τ0
p, (4)
where θ is the QEPAS signal phase, f is the modulation fre-quency of the optical excitation, and P0τ0 is the relaxationtime constant. These equations imply that increasing pres-sure leads to a corresponding increased rate of molecularcollisions and produces a faster V-T relaxation of the targetanalyte.
A background noise analysis of a QEPAS-equivalent cir-cuit shows that two primary noise sources are the thermalnoise associated with mechanical dissipation in the QTF,as represented by the R in the series RLC-equivalent cir-cuit [1]:
√⟨V 2
N−R
⟩ = Rg
√4kBT
R
√f , (5)
R = 1
Q
√L
C, (6)
and the thermal noise of the feedback resistor:√⟨
V 2N−Rg
⟩ =√
4kBT Rg√
f , (7)
where Rg = 10 M is the feedback resistor of tran-simpedance preamplifier, kB is the Boltzmann constant, T
is QTF temperature, and f is the detection bandwidth. Asthe noise caused by feedback resistor Rg is (Rg/R)1/2 timeslower than the QTF noise, Rg is usually neglected over typ-ical values of R (10 to 200 k). Additionally, it has been

462 L. Dong et al.
Fig. 3 (a) QEPAS spectra of the CH4 lines acquired at a100-ppmv CH4 concentration and 200-Torr H2. (Modulation ampli-tude: A = 5 mA, detection bandwidth: f = 0.785 Hz). (b) QEPASspectra of the NH3 lines for a 50-ppmv NH3 concentration acquiredat 50 Torr and 760 Torr H2, respectively. (A = 7 mA for 50 Torr,A = 33 mA for 760 Torr, f = 0.785 Hz)
verified in previous QEPAS performance tests that the ob-served QEPAS noise is equal to the theoretical noise of theQTF [4, 11, 19].
4 Optimization and sensitivity of the CH4 detectionchannel
The R(4) manifold of the CH4 2ν3 band near 6057.1 cm−1
was employed as the selected CH4 detection line. The R(4)manifold consists of four discrete absorption lines. An ex-ample of the QEPAS spectra acquired for using 100 ppmCH4 at 200 Torr H2 mixture is shown in Fig. 3(a). The fourdiscrete absorption lines are closely spaced so that only onemerged line was observed resulting in slight asymmetry at200 Torr. Due to the absence of the CH4 broadening coeffi-cient in H2, it is difficult to obtain the optimal laser WM am-plitude for different pressures by numerically simulating the2f line shapes based on the approach described in Ref. [19].Optimization of the gas pressure and the WM depth was car-ried out experimentally with a 100 ppm (by volume) CH4 inH2 mixture. The flow rate was set to 150 sccm.
Fig. 4 (a) QEPAS signal corresponding to the peak CH4 absorptionnear 6057.1 cm−1 as functions of WM depth and current modula-tion amplitude acquired at different pressures. (b) QEPAS signal corre-sponding to the peak NH3 absorption near 6528.76 cm−1 as functionsof WM depth and current modulation amplitude acquired at differentpressures
The CH4 QEPAS 2f signal corresponding to the peak ab-sorption was plotted as a function of gas pressure and lasercurrent modulation depth as shown in Fig. 4(a). Maximumsignal was observed at 200 Torr. The measured Q factorsand the R values of the QTF are shown in Fig. 5 (dashedlines). The Q factor of a QTF is dependent on the QTFtemperature, the surrounding gas pressure, and the prop-erty of the major chemical composition of the target analyte.Due to the smaller vibrational damping in H2 (as comparedto N2), the QTF has a high Q factor (>30,000). The highQTF Q factor enhances the QEPAS signal amplitude sincethe QEPAS signal is proportional to the Q factor (1). How-ever, based on (6), the product of Q and R of the QTF isa constant because the equivalent QTF L and C parametersare constant. As a result, the higher Q factor decreases R,resulting in higher noise contribution. For comparison, at200 Torr, the noise level (1σ) is 4.8 µV in hydrogen, whileit is only 2.7 µV in nitrogen. So in order to appropriatelyoptimize and assess the CH4 channel performance, both sig-

Compact QEPAS sensor for trace methane and ammonia detection in impure hydrogen 463
Fig. 5 Dashed lines: measured Q factor and R values in dry H2 as afunction of pressures. Solid lines: measured Q factor and R values inH2 with 2.29% H2O vapor at different gas pressures
Fig. 6 (a) Plot of the QEPAS maximum signal amplitude and signal–to-noise ratio of CH4 as a function of pressure. Each curve is normal-ized to its maximum value. (b) SNR with optimal laser current modu-lation amplitude for a 50-ppmv NH3 in H2 mixture and a 1-s averagingtime
nal and noise should be considered. In Fig. 6(a), the nor-malized maximum signal amplitude and signal-to-noise ra-tio (SNR) are plotted as a function of pressure, based on thedata in Fig. 4(a) and (5). The optimal detection pressure forboth the CH4 QEPAS signal amplitude and the SNR occurat ∼200 Torr. Unlike CH4 trace detection in nitrogen [19],
Fig. 7 (a) QEPAS signal repetitively recorded while the CH4 concen-tration was varied by changing gas cylinders with different calibratedCH4 concentrations. (b) Same data averaged and plotted as a functionof certified concentration of CH4 gas cylinders
the pressure shift for the two optimal detection pressures isnot observed. This pressure behavior is due to insensitiv-ity of R to pressure changes in hydrogen. Between 100 to760 Torr, the R values range from 100 to 230 k in nitro-gen, while the R values range from 53 to 86 k in hydrogen.Using (5), smaller values of R result in a smaller variation ofnoise level in hydrogen than in N2. Consequently, the signalamplitude as a function of pressure has the same shape andposition as the SNR curve.
Measurements of the CH4 channel response to differentCH4 concentrations at the optimal pressure of 200 Torr ver-ified the CH4 channel linearity. The laser wavelength waslocked to the center of the 6057.1 cm−1 absorption line.Four gas cylinders containing different calibrated CH4 con-centration levels were used to supply the sample gas. Theresults of measurements performed every 1 s are shownin Fig. 7(a). Same data averaged and plotted as a func-tion of concentration from four certified CH4 gas cylindersare shown in Fig. 7(b). These measurements were madefor a dynamic range of only 100 because of the limitedavailability of calibrated gas samples. Previous CO2 andNO experiments indicated that the linear dynamic rangeof a QEPAS-based sensor can cover at least 4 orders of

464 L. Dong et al.
Fig. 8 Measured QEPAS signals for 100 ppm CH4 in dry H2 and H2with 2.29% H2O vapor as a function of total gas pressure
magnitude [11] as the QTF is known to be a linear re-sponse transducer with a dynamic range of >107. The ab-solute detection sensitivity of the QEPAS sensor to CH4
in dry H2 was also evaluated. The scatter of consecutivemeasurements at a certain concentration level did not de-pend on the concentration. The noise level based on scat-ter data was 4.6 µV with f = 0.785 Hz. The calculatednoise level was 4.8 µV based on (5) (R = 56.4 k). Thisagreement confirms that no excess noise is introduced. Thisnoise level results in a noise-equivalent (1σ) concentrationof 3.2 ppm with a 1-s averaging time (0.785 Hz). Normal-ized to a 15.8-mW optical power and a 0.785-Hz detec-tion bandwidth, the noise-equivalent absorption coefficientis 2.45 × 10⁻⁸ cm−1 W/√Hz. This coefficient is slightlylower when compared with the CH4 detection sensitivity indry N2 (2.9 × 10⁻⁸ cm−1 W/√Hz).
5 CH4 conversion efficiency in the presence of H2Ovapor
For trace methane in a nitrogen mixture, the observedQEPAS signal generated at a certain CH4 concentration ismuch stronger in the presence of H2O vapor as the wateris an efficient catalyst for the vibrational energy transfer re-actions in the gas phase. Hence, the influence of H2O onoverall QEPAS signal when using hydrogen as the carriergas was investigated. First, 2.29% H2O vapor was addedto the 100-ppm dry CH4 by means of a Nafion tube. The2f peak values were recorded at different pressures and areshown in Fig. 8. For comparison, the QEPAS signals of the100-ppm dry CH4 are also plotted. The signal enhancementis not as high as in the case of using a nitrogen carrier [19].At low pressures (<300 Torr), the enhancement factor isonly ∼15%. With increasing pressure, the QEPAS signalsfrom the dry and wet gases gradually overlap. However, theaddition of water vapor strongly impacts the Q factor and R
values of the QTF, as shown in Fig. 5 (solid lines). The Q
Fig. 9 Efficiency of the optical radiation-to-sound conversion ε(p) asa function of total pressures for CH4 in dry H2 and H2 with 2.29%H2O vapor
factor decreases from an initial range of 30,000–50,000 toa final range of 27,500–37,500 and as a result, the R valuesincrease from 53–86 k to 70–95 k, respectively.
Equation (1) was used to obtain the conversion efficiencyε(p) as a function of pressure that is shown in Fig. 9. Atpressures between 100 and 760 Torr, a higher total gaspressure does not help promote the V-T relaxation rate ofCH4. Instead, the conversion efficiency decreased towardshigher pressures. The behavior of both ε(p) values can beexplained by the diffusion of the excited molecules to theQTF’s prongs or the mR tube wall with subsequent V-T re-laxation collisions. The mean diffusion path traveled by anexcited CH4 molecule was calculated in order to check ifthey are able to reach the tubes’ wall within a modulationperiod t = 1/f0 = 30.5 µs. The diffusion coefficient in theCH4/H2 mixture at T = 297 K and atmospheric pressure(Patm) is D12 = 0.721 cm2/s [22]. Using the 2D diffusion
formula (√〈l2〉 =
√4D12
P atmP
t) [19], the diffusion path is260 µm at 100 Torr, which is comparable with the mR ra-dius of 290 µm. At 760 Torr, a diffusion path of ∼100 µmis obtained. Taking into account the ∼100-µm diameter ofthe laser beam and the 300-µm gap between two prongsof QTF, excited CH4 molecules are still able to reach theQTF’s prongs and release their vibrational energy. Hence,we can conclude that the observed higher conversion effi-ciency at low-pressure CH4/H2 is most likely the result ofdiffusion. With increasing pressure, the diffusion effect de-creases and the collision deexcitation process between CH4
and H2 molecules becomes gradually dominant. When con-sidering H2O influence, it was determined that the conver-sion efficiency ε(p) induced by H2O vapor is not a constantfor different pressures but rather has a larger value at lowergas pressures. This can be explained by increased collisionsbetween excited H2O molecules and the mR tubes with thelonger diffusion path, which further enhances the QEPASsignal.
Compact QEPAS sensor for trace methane and ammonia detection in impure hydrogen 465
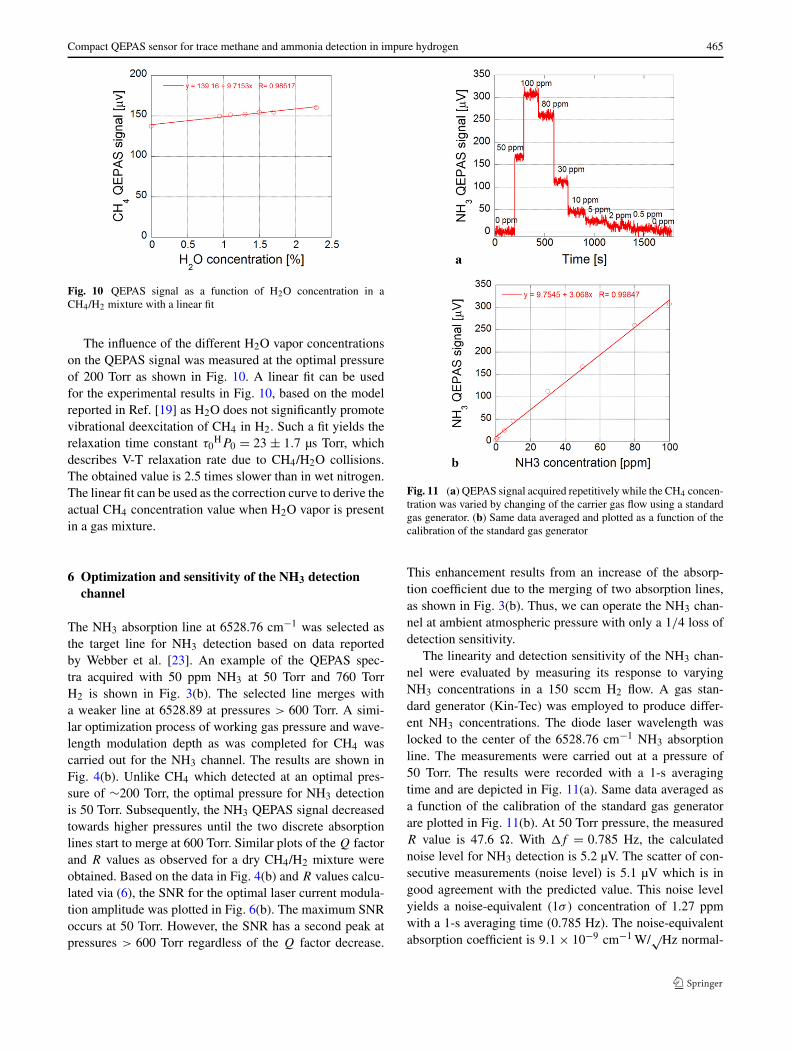
Fig. 10 QEPAS signal as a function of H2O concentration in aCH4/H2 mixture with a linear fit
The influence of the different H2O vapor concentrationson the QEPAS signal was measured at the optimal pressureof 200 Torr as shown in Fig. 10. A linear fit can be usedfor the experimental results in Fig. 10, based on the modelreported in Ref. [19] as H2O does not significantly promotevibrational deexcitation of CH4 in H2. Such a fit yields therelaxation time constant τ0
HP0 = 23 ± 1.7 µs Torr, whichdescribes V-T relaxation rate due to CH4/H2O collisions.The obtained value is 2.5 times slower than in wet nitrogen.The linear fit can be used as the correction curve to derive theactual CH4 concentration value when H2O vapor is presentin a gas mixture.
6 Optimization and sensitivity of the NH3 detectionchannel
The NH3 absorption line at 6528.76 cm−1 was selected asthe target line for NH3 detection based on data reportedby Webber et al. [23]. An example of the QEPAS spec-tra acquired with 50 ppm NH3 at 50 Torr and 760 TorrH2 is shown in Fig. 3(b). The selected line merges witha weaker line at 6528.89 at pressures > 600 Torr. A simi-lar optimization process of working gas pressure and wave-length modulation depth as was completed for CH4 wascarried out for the NH3 channel. The results are shown inFig. 4(b). Unlike CH4 which detected at an optimal pres-sure of ∼200 Torr, the optimal pressure for NH3 detectionis 50 Torr. Subsequently, the NH3 QEPAS signal decreasedtowards higher pressures until the two discrete absorptionlines start to merge at 600 Torr. Similar plots of the Q factorand R values as observed for a dry CH4/H2 mixture wereobtained. Based on the data in Fig. 4(b) and R values calcu-lated via (6), the SNR for the optimal laser current modula-tion amplitude was plotted in Fig. 6(b). The maximum SNRoccurs at 50 Torr. However, the SNR has a second peak atpressures > 600 Torr regardless of the Q factor decrease.
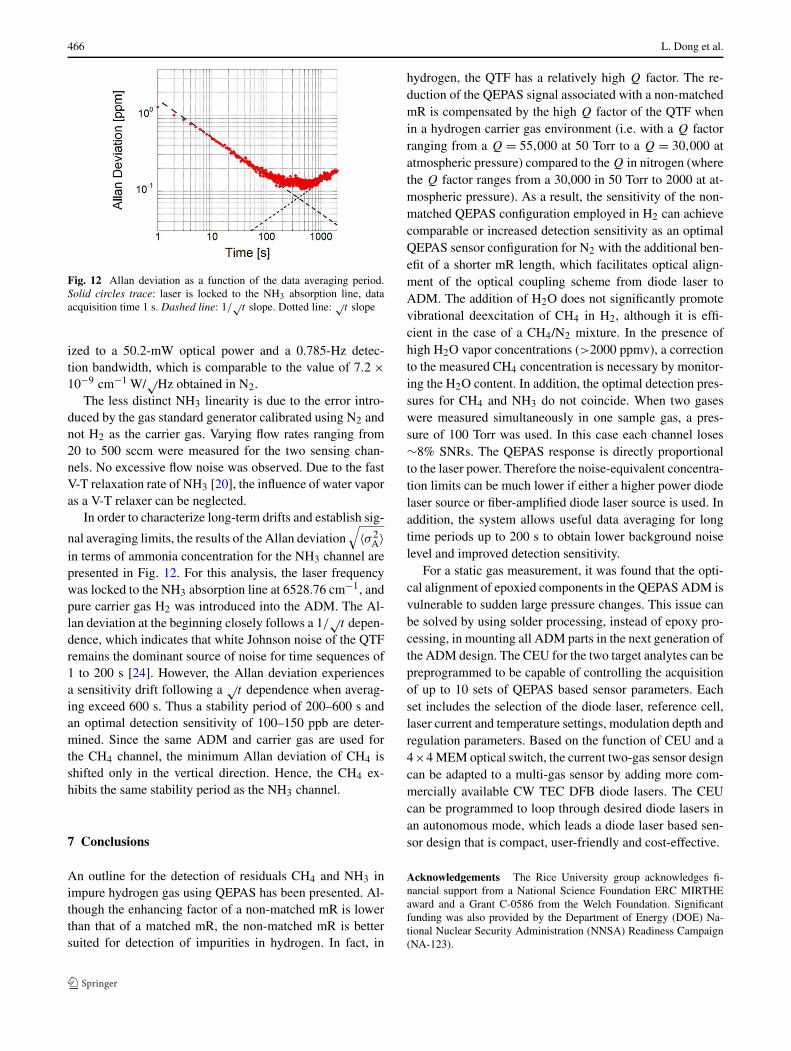
Fig. 11 (a) QEPAS signal acquired repetitively while the CH4 concen-tration was varied by changing of the carrier gas flow using a standardgas generator. (b) Same data averaged and plotted as a function of thecalibration of the standard gas generator
This enhancement results from an increase of the absorp-tion coefficient due to the merging of two absorption lines,as shown in Fig. 3(b). Thus, we can operate the NH3 chan-nel at ambient atmospheric pressure with only a 1/4 loss ofdetection sensitivity.
The linearity and detection sensitivity of the NH3 chan-nel were evaluated by measuring its response to varyingNH3 concentrations in a 150 sccm H2 flow. A gas stan-dard generator (Kin-Tec) was employed to produce differ-ent NH3 concentrations. The diode laser wavelength waslocked to the center of the 6528.76 cm−1 NH3 absorptionline. The measurements were carried out at a pressure of50 Torr. The results were recorded with a 1-s averagingtime and are depicted in Fig. 11(a). Same data averaged asa function of the calibration of the standard gas generatorare plotted in Fig. 11(b). At 50 Torr pressure, the measuredR value is 47.6 . With f = 0.785 Hz, the calculatednoise level for NH3 detection is 5.2 µV. The scatter of con-secutive measurements (noise level) is 5.1 µV which is ingood agreement with the predicted value. This noise levelyields a noise-equivalent (1σ) concentration of 1.27 ppmwith a 1-s averaging time (0.785 Hz). The noise-equivalentabsorption coefficient is 9.1 × 10⁻⁹ cm−1 W/√Hz normal-
466 L. Dong et al.
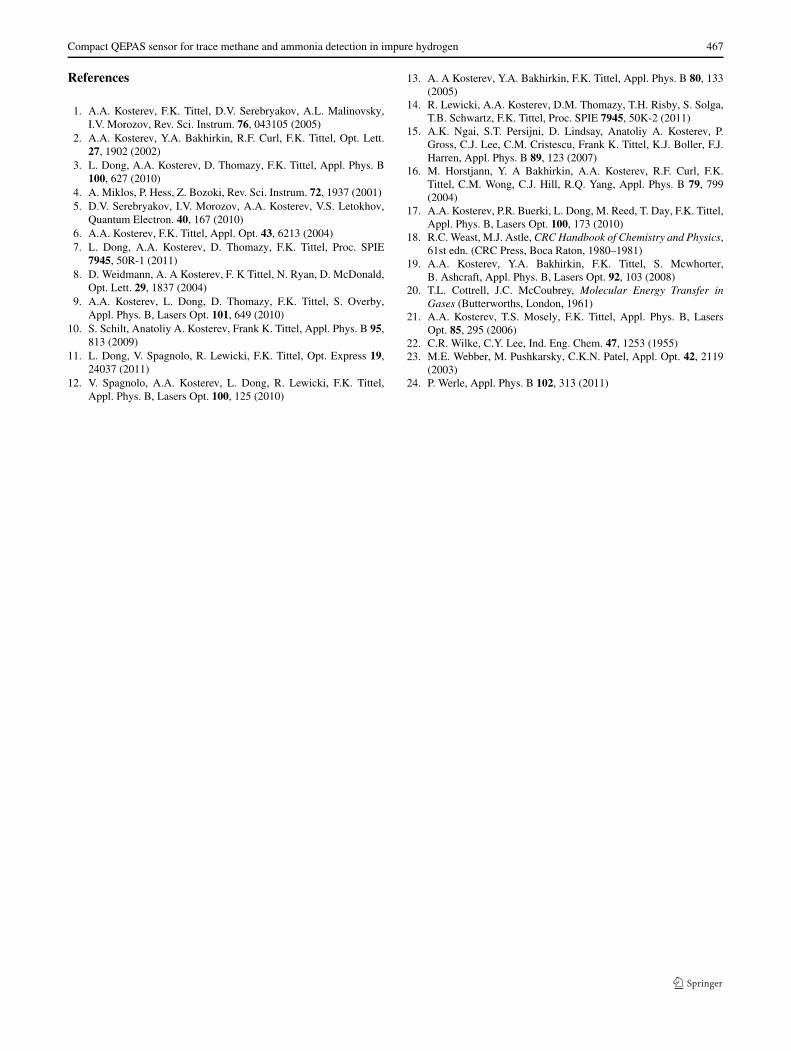
Fig. 12 Allan deviation as a function of the data averaging period.Solid circles trace: laser is locked to the NH3 absorption line, dataacquisition time 1 s. Dashed line: 1/
√t slope. Dotted line: √
t slope
ized to a 50.2-mW optical power and a 0.785-Hz detec-tion bandwidth, which is comparable to the value of 7.2 ×10⁻⁹ cm−1 W/√Hz obtained in N2.
The less distinct NH3 linearity is due to the error intro-duced by the gas standard generator calibrated using N2 andnot H2 as the carrier gas. Varying flow rates ranging from20 to 500 sccm were measured for the two sensing chan-nels. No excessive flow noise was observed. Due to the fastV-T relaxation rate of NH3 [20], the influence of water vaporas a V-T relaxer can be neglected.
In order to characterize long-term drifts and establish sig-
nal averaging limits, the results of the Allan deviation√
〈σ 2A〉
in terms of ammonia concentration for the NH3 channel arepresented in Fig. 12. For this analysis, the laser frequencywas locked to the NH3 absorption line at 6528.76 cm−1, andpure carrier gas H2 was introduced into the ADM. The Al-lan deviation at the beginning closely follows a 1/
√t depen-
dence, which indicates that white Johnson noise of the QTFremains the dominant source of noise for time sequences of1 to 200 s [24]. However, the Allan deviation experiencesa sensitivity drift following a √
t dependence when averag-ing exceed 600 s. Thus a stability period of 200–600 s andan optimal detection sensitivity of 100–150 ppb are deter-mined. Since the same ADM and carrier gas are used forthe CH4 channel, the minimum Allan deviation of CH4 isshifted only in the vertical direction. Hence, the CH4 ex-hibits the same stability period as the NH3 channel.
7 Conclusions
An outline for the detection of residuals CH4 and NH3 inimpure hydrogen gas using QEPAS has been presented. Al-though the enhancing factor of a non-matched mR is lowerthan that of a matched mR, the non-matched mR is bettersuited for detection of impurities in hydrogen. In fact, in
hydrogen, the QTF has a relatively high Q factor. The re-duction of the QEPAS signal associated with a non-matchedmR is compensated by the high Q factor of the QTF whenin a hydrogen carrier gas environment (i.e. with a Q factorranging from a Q = 55,000 at 50 Torr to a Q = 30,000 atatmospheric pressure) compared to the Q in nitrogen (wherethe Q factor ranges from a 30,000 in 50 Torr to 2000 at at-mospheric pressure). As a result, the sensitivity of the non-matched QEPAS configuration employed in H2 can achievecomparable or increased detection sensitivity as an optimalQEPAS sensor configuration for N2 with the additional ben-efit of a shorter mR length, which facilitates optical align-ment of the optical coupling scheme from diode laser toADM. The addition of H2O does not significantly promotevibrational deexcitation of CH4 in H2, although it is effi-cient in the case of a CH4/N2 mixture. In the presence ofhigh H2O vapor concentrations (>2000 ppmv), a correctionto the measured CH4 concentration is necessary by monitor-ing the H2O content. In addition, the optimal detection pres-sures for CH4 and NH3 do not coincide. When two gaseswere measured simultaneously in one sample gas, a pres-sure of 100 Torr was used. In this case each channel loses∼8% SNRs. The QEPAS response is directly proportionalto the laser power. Therefore the noise-equivalent concentra-tion limits can be much lower if either a higher power diodelaser source or fiber-amplified diode laser source is used. Inaddition, the system allows useful data averaging for longtime periods up to 200 s to obtain lower background noiselevel and improved detection sensitivity.
For a static gas measurement, it was found that the opti-cal alignment of epoxied components in the QEPAS ADM isvulnerable to sudden large pressure changes. This issue canbe solved by using solder processing, instead of epoxy pro-cessing, in mounting all ADM parts in the next generation ofthe ADM design. The CEU for the two target analytes can bepreprogrammed to be capable of controlling the acquisitionof up to 10 sets of QEPAS based sensor parameters. Eachset includes the selection of the diode laser, reference cell,laser current and temperature settings, modulation depth andregulation parameters. Based on the function of CEU and a4×4 MEM optical switch, the current two-gas sensor designcan be adapted to a multi-gas sensor by adding more com-mercially available CW TEC DFB diode lasers. The CEUcan be programmed to loop through desired diode lasers inan autonomous mode, which leads a diode laser based sen-sor design that is compact, user-friendly and cost-effective.
Acknowledgements The Rice University group acknowledges fi-nancial support from a National Science Foundation ERC MIRTHEaward and a Grant C-0586 from the Welch Foundation. Significantfunding was also provided by the Department of Energy (DOE) Na-tional Nuclear Security Administration (NNSA) Readiness Campaign(NA-123).
Compact QEPAS sensor for trace methane and ammonia detection in impure hydrogen 467
References
1. A.A. Kosterev, F.K. Tittel, D.V. Serebryakov, A.L. Malinovsky,I.V. Morozov, Rev. Sci. Instrum. 76, 043105 (2005)
2. A.A. Kosterev, Y.A. Bakhirkin, R.F. Curl, F.K. Tittel, Opt. Lett.27, 1902 (2002)
3. L. Dong, A.A. Kosterev, D. Thomazy, F.K. Tittel, Appl. Phys. B100, 627 (2010)
4. A. Miklos, P. Hess, Z. Bozoki, Rev. Sci. Instrum. 72, 1937 (2001)5. D.V. Serebryakov, I.V. Morozov, A.A. Kosterev, V.S. Letokhov,
Quantum Electron. 40, 167 (2010)6. A.A. Kosterev, F.K. Tittel, Appl. Opt. 43, 6213 (2004)7. L. Dong, A.A. Kosterev, D. Thomazy, F.K. Tittel, Proc. SPIE
7945, 50R-1 (2011)8. D. Weidmann, A. A Kosterev, F. K Tittel, N. Ryan, D. McDonald,
Opt. Lett. 29, 1837 (2004)9. A.A. Kosterev, L. Dong, D. Thomazy, F.K. Tittel, S. Overby,
Appl. Phys. B, Lasers Opt. 101, 649 (2010)10. S. Schilt, Anatoliy A. Kosterev, Frank K. Tittel, Appl. Phys. B 95,
813 (2009)11. L. Dong, V. Spagnolo, R. Lewicki, F.K. Tittel, Opt. Express 19,
24037 (2011)12. V. Spagnolo, A.A. Kosterev, L. Dong, R. Lewicki, F.K. Tittel,
Appl. Phys. B, Lasers Opt. 100, 125 (2010)
13. A. A Kosterev, Y.A. Bakhirkin, F.K. Tittel, Appl. Phys. B 80, 133(2005)
14. R. Lewicki, A.A. Kosterev, D.M. Thomazy, T.H. Risby, S. Solga,T.B. Schwartz, F.K. Tittel, Proc. SPIE 7945, 50K-2 (2011)
15. A.K. Ngai, S.T. Persijni, D. Lindsay, Anatoliy A. Kosterev, P.Gross, C.J. Lee, C.M. Cristescu, Frank K. Tittel, K.J. Boller, F.J.Harren, Appl. Phys. B 89, 123 (2007)
16. M. Horstjann, Y. A Bakhirkin, A.A. Kosterev, R.F. Curl, F.K.Tittel, C.M. Wong, C.J. Hill, R.Q. Yang, Appl. Phys. B 79, 799(2004)
17. A.A. Kosterev, P.R. Buerki, L. Dong, M. Reed, T. Day, F.K. Tittel,Appl. Phys. B, Lasers Opt. 100, 173 (2010)
18. R.C. Weast, M.J. Astle, CRC Handbook of Chemistry and Physics,61st edn. (CRC Press, Boca Raton, 1980–1981)
19. A.A. Kosterev, Y.A. Bakhirkin, F.K. Tittel, S. Mcwhorter,B. Ashcraft, Appl. Phys. B, Lasers Opt. 92, 103 (2008)
20. T.L. Cottrell, J.C. McCoubrey, Molecular Energy Transfer inGases (Butterworths, London, 1961)
21. A.A. Kosterev, T.S. Mosely, F.K. Tittel, Appl. Phys. B, LasersOpt. 85, 295 (2006)
22. C.R. Wilke, C.Y. Lee, Ind. Eng. Chem. 47, 1253 (1955)23. M.E. Webber, M. Pushkarsky, C.K.N. Patel, Appl. Opt. 42, 2119
(2003)24. P. Werle, Appl. Phys. B 102, 313 (2011)