Embed Size (px)
Citation preview
Metformin has adenosine-monophosphate
activated protein kinase (AMPK)-independent
effects on LPS-stimulated rat primary microglial
cultures
Krzysztof £abuzek1, Sebastian Liber1, Bo¿ena Gabryel2,
Bogus³aw Okopieñ1
�Department of Internal Medicine and Clinical Pharmacology,
�Department of Pharmacology, Medical University
of Silesia, Medyków 18, PL 40-752 Katowice, Poland
Correspondence: Krzysztof £abuzek, e-mail: [email protected]
Abstract:
The results of recent studies suggest that metformin, in addition to its efficacy in treating type 2 diabetes, may also have therapeutic
potential for the treatment of neuroinflammatory diseases in which reactive microglia play an essential role. However, the molecular
mechanisms by which metformin exerts its anti-inflammatory effects remain largely unknown. Adenosine-monophosphate-
activated protein kinase (AMPK) activation is the most well-known mechanism of metformin action; however, some of the biologi-
cal responses to metformin are not limited to AMPK activation but are mediated by AMPK-independent mechanisms. In this paper,
we attempted to evaluate the effects of metformin on unstimulated and LPS-activated rat primary microglial cell cultures. The pre-
sented evidence supports the conclusion that metformin-activated AMPK participates in regulating the release of TNF-�. Further-
more, the effects of metformin on the release of IL-1�, IL-6, IL-10, TGF-�, NO, and ROS as well as on the expression of arginase I,
iNOS, NF-�B p65 and PGC-1� were not AMPK-dependent, because pretreatment of LPS-activated microglia with compound C, a
pharmacological inhibitor of AMPK, did not reverse the effect of metformin. Based on the present findings, we propose that the shift
of microglia toward alternative activation may underlie the beneficial effects of metformin observed in animal models of neurologi-
cal disorders.
Key words:
metformin, AMPK, microglia, inflammation
Abbreviations: AD – Alzheimer’s disease, AICAR – 5-ami-
noimidazole-4-carboxamide 1-�-D-ribofuranoside, AMPK –
adenosine-monophosphate activated protein kinase, DMEM –
Dulbecco’s Modified Eagle’s Medium, DNA – deoxyribonucleic
acid, ELISA – enzyme-linked immunosorbent assay, FBS – fetal
bovine serum, GFAP – glial fibrillary acetic protein, HUVEC – hu-
man umbilical vein endothelial cell, IL – interleukin, iNOS –
inducible nitric oxide synthase, IOD – integrated optical den-
sity, LPS – bacterial lipopolysaccharide, MAP-2 – microtu-
bule-associated protein 2, MTT – 3-(4,5-dimethylthiazol-2-yl)-
2,5-diphenyltetrazolium bromide, NBT – nitroblue tetrazolium
chloride, NO – nitric oxide, NOS – nitric oxide synthase, PGC –
peroxisome proliferator-activated receptor-� coactivator, PKC –
protein kinase C, ROS – reactive oxygen species, RPMI –
Roswell Park Memorial Institute, SD – standard deviation,
TBST – Tris-buffered saline, TFA – transcription factor A, TGF
– transforming growth factor, TNF – tumor necrosis factor
Introduction
Metformin is the only drug of the biguanide class cur-
rently used for the treatment of type 2 diabetes. The
results of recent clinical and experimental studies sug-
�������������� ���� �� ����� ��� ������� 827
�������������� ���� �
����� ��� �������
� ���� ����
��������� � ����
�� �������� �� ���� �!�"���
��"��� #!�$� � �� !���!��

gest that metformin, apart from its hypoglycemic ac-
tion, may attenuate both peripheral and central in-
flammation. The anti-inflammatory potential of met-
formin has been reported in particular in many
experimental models of peripheral inflammation. It
has been shown that metformin attenuates pro-
inflammatory responses in endothelial cells [22], di-
minishes human aortic smooth muscle cell prolifera-
tion [30] and ameliorates macrophage activation [34].
The activation of AMP-activated protein kinase
(AMPK) constitutes the best-known mechanism of
metformin action [61]. AMPK is a highly conserved
heterotrimeric serine/threonine kinase that is involved
in the regulation of cellular metabolism and energy
distribution. Phosphorylation of the specific threonine
residue (Thr172) is crucial for AMPK activity [53].
AMPK is an intracellular metabolic sensor that through
the reduction of ATP-consuming processes and the
stimulation of ATP-generating pathways, maintains cel-
lular energy homeostasis. The latter effect relies on the
up-regulation of the peroxisome proliferator-activated re-
ceptor-� coactivator 1� (PGC-1�), which induces mito-
chondrial biogenesis [25].
It seems reasonable to consider that activation of
AMPK by metformin may affect the above-mentioned
processes not only in peripheral tissues but also in the
brain, in particular because the drug has been shown
to cross the blood-brain barrier and accumulate in the
rodent brain [55]. Consequently, metformin is in-
creasingly recognized as a drug that acts directly on
the central nervous system and is curently being
tested in various experimental models of neurodegen-
eration and neuroinflammation. To date, metformin
has been shown to prolong survival time in the trans-
genic mouse model of Huntington’s disease [33], at-
tenuate the induction of experimental autoimmune
encephalomyelitis [37], diminish the migration and in-
vasion of U87 and LN229 glioma cells [3], and exhibit
neuroprotective effects against etoposide-induced apop-
tosis in primary cortical neurons [13]. It is also known
that some of the biological responses to metformin are
not limited to the activation of AMPK but are medi-
ated by AMPK-independent mechanisms, including
the inhibition of different intracellular targets such as
p70S6K1 kinase [53], p38 mitogen-activated protein
kinase (p38 MAPK), and protein kinase C (PKC)
[43].
AMPK activation has been shown to affect the
pro-inflammatory responses of microglia, which are
currently recognized as the primary components of
the intrinsic brain immune system [17]. Microglia
constantly control the content and evaluate the safety
of the neuronal microenvironment, which reciprocally
regulates these cells [20]. However, the sustained acti-
vation of microglia has been implicated in the patho-
genesis of a number of neurological disorders includ-
ing ischemia/reperfusion brain injury, Alzheimer’s
disease, Parkinson’s disease, HIV-associated demen-
tia and multiple sclerosis [4].
Based on the described properties of metformin,
because it can cross into the brain [8, 55] and taking
into account that AMPK is expressed in microglial
cells [17, 26], we hypothesized that metformin may
modulate the LPS-induced proinflammatory response
in rat primary microglia. In the present study, the re-
sponse of microglia was parameterized with the pro-
duction of nitric oxide (NO), reactive oxygen species
(ROS) and the release of the major classes of both
pro- and anti-inflammatory cytokines. To elucidate
our findings, we determined the expression of nuclear
factor �B (NF-�B) p65, PGC-1�, inducible nitric ox-
ide synthase (iNOS) and arginase I. Additionally, to
assess whether the mechanism of metformin action
was AMPK-dependent, we measured AMPK activity
and, in parallel experiments, applied 5-aminoimi-
dazole-4-carboxamide-1-�-D-ribofuranoside (AICAR)
as an activator of AMPK and compound C as a con-
firmed pharmacological inhibitor of AMPK.
Materials and Methods
Reagents
Metformin (1,1-dimethylbiguanide hydrochloride),
AICAR (5-aminoimidazole-4-carboxamide 1-�-D-ribo-
furanoside), compound C (6-[4-(2-piperidin-1-yl-etoxy)-
phenyl)]-3-pyridin-4-yl-pyrazolo[1,5-a] pyrimidine), LPS
(lipopolysaccharide, Escherichia coli serotype 0111:
B4), trypan blue, MTT (3-(4,5-dimethylthiazol-2-yl)-
2,5-diphenyltetrazolium bromide), NBT (nitroblue te-
trazolium chloride), DMSO (dimethyl sulfoxide),
ATP (adenosine-5’-triphosphate), AMP (adenosine
monophosphate), digitonin, poly-D-lysine, propentofyl-
line (3-methyl-1-(5-oxohexyl)-7-propyl-3,7-dihydro-
1H-purine-2,6-dione) and the recombinant rat granu-
locyte/monocyte colony-stimulating factor (GM-CSF)
were purchased from Sigma-Aldrich (St. Louis, MO,
828 �������������� ���� �� ����� ��� �������

USA). Fetal bovine serum (FBS), bovine serum albu-
min (BSA), DMEM (Dulbecco’s Modified Eagle’s
Medium), phosphate buffer solution (PBS), RPMI-
1640, antibiotic-antimycotic solution (penicillin,
streptomycin and fungizone) and trypsin were ob-
tained from Invitrogen (Carlsbad, CA, USA). SAMS
peptide was from Millipore (Billerica, MA, USA).
Methyl-[�H]thymidine, (specific activity: 70–90 Ci
(2.59–3.33TBq)/mmol), 250 µCi (9.25 MBq) and [�-��P]
ATP (6000 Ci/mmol, EasyTides) were purchased from
PerkinElmer Life Sciences (Boston, USA).
Antibodies against PGC-1� (peroxisome prolifera-
tor-activated receptor-� coactivator-1 �), NF�B (nuclear
factor � B, p65), iNOS (inducible nitric oxide syn-
thase) and laminin �-1 were obtained from Santa Cruz
Biotechnology (Santa Cruz, CA, USA). Antibody
against arginase I was obtained from BD Biosciences
(San Jose, CA, USA). Antibody against GFAP (glial
fibrillary acidic protein), MAP-2 (microtubule associ-
ating protein-2) and �-actin were from ABCAM Inc.
(Cambridge, MA, USA). Lectin Ricinus Communis
agglutinin-1 (RCA-1) was from Vector Laboratories
(Burlingame, CA, USA). The QuantiFluoTM DNA
Assay Kit was purchased from BioAssay Systems
(USA). ELISA kits for IL-1�, IL-6, TNF-�, TGF-�
and IL-10 were from R&D Systems Inc. (Minneapo-
lis, MN, USA). The nitrite kit was from Cayman
Chemicals (Ann Arbor, MI, USA).
Cell cultures and drug treatment
Primary mixed glial cultures were prepared from 2-
day-old postnatal Wistar rat pups as described previ-
ously [32]. Briefly, the brains were excised aseptically
and separated from the blood vessels and meninges on
ice. Cerebral cortical tissue was dissociated by tritura-
tion in ice-cold medium containing DMEM (4.5 g
glucose/l) with 10% heat-inactivated FBS, 2 mM glu-
tamine, 100 UI/ml penicillin, 100 µg/ml streptomycin
and 5 µg/ml fungizone. The suspension was filtered
sequentially through two cell strainers with 70 and
40 µm meshes (Becton Dickinson, NJ, USA). Disso-
ciated cells were plated (20 × 10� cells per dish) on
poly-D-lysine-coated 100-mm Petri dishes (Becton
Dickinson, NJ, USA) and incubated at 37°C in hu-
midified 5% CO�/95% air (CO� incubator, Heraeus,
Germany). The medium was replenished 1 day after
plating and changed every 3 days thereafter. After
plating, the cells were cultured for 13–15 days until
confluence. To identify astrocytes, the cultures were
stained immunocytochemically with GFAP, which is a
specific marker for astrocytes. Analysis of the cultures
showed that 70–75% of the cells were GFAP-positive.
Approximately 20% of the cultured cells reacted with
RCA-1. No neurons were detected, as confirmed by
immunostaining using a monoclonal antibody against
MAP-2.
Rat microglial cultures were obtained by shaking
the primary mixed glial cultures (200 r/min, 5 h,
37°C), with maximum yields between days 12 and 14.
The suspension of floating cells was filtered through
a 40-mM nylon mesh, centrifuged at 200 × g for 10
min, suspended in 200 �l culture medium, plated in
96-well tissue culture plates (5 × 10⁴ cells/well) and
incubated at 37°C for 15 min in humidified 5%
CO2/95% air. Next, the wells were vigorously washed
thrice with 200 �l of culture medium to remove non-
adherent cells. Microglial cells, which firmly adhered
to the bottom of the well, were incubated overnight
before the experiment. Compound C at an initial con-
centration of 20 mM was dissolved in DMSO. Further
dilutions were performed in the appropriate medium.
The corresponding amounts of DMSO were added to
the control cultures. The final concentration of
DMSO in the medium did not exceed 0.05% and, as
previously confirmed, did not have any effects on the
microglial cell cultures. After application of the com-
pounds, the media were harvested, centrifuged (500 × g
for 5 min) and assayed. Each group of experiments
comprised 9 wells, and 4 independent experiments
were performed.
The microglial cells used for western blot analysis
were seeded onto 100-mm plastic dishes at a density
of 15 × 106/dish. Viability was determined using try-
pan blue exclusion and the MTT test. More than 95%
of the cultured cells reacted with RCA-1 (microglial
cells), and 2–3% were GFAP-positive (astrocytes).
Each group of culture plates was assayed in three in-
dependent experiments. On the day of the experiment,
the culture medium was replaced with fresh medium
containing metformin, AICAR, compound C and
LPS.
Microglial counts and cell viability assay
Cells in 96-well tissue culture plates treated with met-
formin, AICAR, compound C and LPS at various
concentrations were identified based on reactivity to
RCA-1, a lectin that binds to surface glycoproteins
present on microglial cells [44]. Under 20× magnifi-
�������������� ���� �� ����� ��� ������� 829
Metformin and inflammation in microglia��������� ��� � � ��
cation, 9 fields of 0.135 mm� were photographed, and
the lectin-positive cells per well were counted. Cyto-
toxic effects of the treatments were determined by as-
sessing membrane integrity in the microglial cultures
using the 0.1% trypan blue exclusion test. The results
are expressed as a percentage of the control (100%)
and represent four independent experiments.
MTT conversion
The viability of microglia treated with the studied
compounds was evaluated using the MTT conversion
method [36]. The capacity of cells to convert MTT is
indicative of mitochondrial integrity and activity,
which might in turn denote cell viability. Cleavage of
the tetrazoline ring in MTT takes place mainly via the
participation of the mitochondrial succinate dehydro-
genase and depends on the activity of the respiratory
chain and the redox state of the mitochondria [36].
MTT (final concentration 2.5 µg/ml) was added to the
medium 3 h before the scheduled end of the experi-
ment, and then the cultures were incubated at 37°C
with 5% CO�/95% air. At the end of the experiment,
after two washes with PBS, the cells were lysed in
100 µl of DMSO to release the blue reaction product
– formazan (RT, 10 min in the dark). Two hundred mi-
croliters of the lysate was transferred to a 96-well
plate. The absorbance at a wavelength of 570 nm was
determined using a microplate reader (Dynex Tech-
nologies), and four independent experiments were
performed. The results are expressed as a percentage
of the control (100%).
[3H]Thymidine incorporation assays
The proliferation of microglial cells was measured
based on the incorporation of methyl-[�H]thymidine
into cellular DNA according to Si et al. [47] and
Gebicke-Haerter et al. [16]. The formation of [�H]5-
hydroxymethyl-2’-deoxyuridine through transmuta-
tion of methyl-[�H]thymidine occurred at the rate of
B-decay, which was detected using scintillator.
Rat microglial cultures were placed in 24-well tis-
sue culture plates (3 × 10⁵ cells/well) and incubated at
37°C in humidified 5% CO2/95% air in the presence of
0.5 ml/well culture medium enriched with 4.5 g glu-
cose/l, 1% heat-inactivated FBS, 0.66 mg/ml BSA,
100 µg/ml D-biotin, 5 ng/ml insulin, 1 ng/ml sele-
nium, 40 µg/ml transferrin, 2 mM glutamine, 15 mM
HEPES buffer, 100 UI/ml penicillin, 100 µg/ml strep-
tomycin and 5 µg/ml fungizone. After 24 h, this me-
dium was replaced with 0.5 ml/well of the culture me-
dium containing 2.5 µCi methyl-[3H]thymidine
(5 µCi/ml; diluted 1:1000 from a stock solution),
10 µM propentofylline (this concentration is known to
directly inhibit microglial proliferation, according to
Si et al.) [47], compound C, AICAR and LPS. The
cultures were incubated at 37°C in humidified 5%
CO2/95% air (CO2 incubator, Heraeus, Germany). Af-
ter 24 h, the medium was removed, the microglial
cells were washed thrice with PBS and 300 µl/well of
0.25% trypsin was added to the cultures. After 15 min
of shaking (250 r/min, room temperature), the suspen-
sion of microglial cells was solubilized by repeated
pipetting, harvested, centrifuged, washed with 1 ml of
PBS, recentrifuged for 20 min at 15,000 × g, and the
incorporated radioactivity of the resultant pellets was
counted using an automatic scintillation reader (Beck-
man LS6000, USA). Three independent experiments
were performed.
Aliquots of trypsinized material were obtained to
assess the DNA using the QuantiFluoTM DNA Assay
Kit (BioAssay Systems, USA). The samples were as-
sayed according to the manufacturer’s protocol, and
fluorescence emission was analyzed using a micro-
plate reader (ex/em 350/450 nm). The radioactivity
was adjusted to the DNA content. Nonspecific
[3H]thymidine uptake was characterized as uptake in
the presence of 1 mM thymidine (Sigma-Aldrich),
which was added 2 min before the addition of
[3H]thymidine. Quenching was corrected by the chan-
nels ratio method and by internal standardization. Ra-
dioactivity was estimated as disintegrations per
minute (dpm)/mg DNA and is expressed as a percent-
age of the control proliferation (100%). The results
represent three independent experiments.
In parallel experiments, we applied the compounds
at the concentrations mentioned above and enriched
the culture medium with recombinant rat granulo-
cyte/monocyte colony-stimulating factor (GM-CSF)
from Sigma-Aldrich at 10 ng/ml at the beginning of
the experiment to stimulate microglial cell growth,
according to Re et al. [41] and Lin and Levison [31].
After a 24-h incubation at 37°C in humidified 5%
CO2/95% air, as described previously, the medium
was removed, and the microglial cells were analyzed
using an automatic scintillation reader.
The viability of the cells, as assessed by the trypan
blue exclusion test and MTT, was greater than 96%
830 �������������� ���� �� ����� ��� �������

even after incubation with 10 mM propentofylline for
24 h. Thus, we rejected the possibility that the ability
of propentofylline to inhibit GM-CSF stimulation of
microglial cultures was caused by its cytotoxicity.
Isolation of cytosolic and nuclear extracts
Cytosolic and nuclear extracts were prepared using
standard protocol previously described by Towbin et
al. [52] and Medeiros et al. [35]. Microglial cell cul-
tures were washed with ice-cold PBS, and the proteins
were extracted with 100 µl lysis buffer per 100-mm
dish, containing 50 mM Tris-HCl (pH 7.4), 150 mM
NaCl, 0.5% Igepal, 0.1% sodium dodecyl sulfate,
10 µg/ml phenylmethylsulfonyl fluoride, 10 µg/ml
aprotinin, 10 µg/ml leupeptin, 10 µg/ml pepstatin and
10 µg/ml of heat activated sodium orthovanadate (all
from Sigma-Aldrich). After a 20-min incubation on
ice, the cell lysates were scraped off the plate using
a cold plastic cell scraper, gently transferred into pre-
cooled tubes and shaken vigorously for 20 min on ice.
The nuclear fraction was precipitated by centrifuga-
tion at 10,000 × g for 30 min at 4°C. The supernatant
containing the cytosolic fraction was gently aspirated.
Samples containing equal amounts of total protein
(50 µg) were boiled in 2× sample buffer supple-
mented with 25% glycerol, 2% SDS, 0.02% bromo-
phenol blue) for 6 min and separated in a 10% SDS-
polyacrylamide gel [52]. The pellets consisting of nu-
clear components were resuspended in 400 µl of
high-salt extraction buffer [20 mM HEPES (pH 7.4),
430 mM NaCl, 1.5 mM MgCl�, 0.2 mM EDTA, 25%
glycerol, 10 µg/ml phenylmethylsulfonyl fluoride,
10 µg/ml aprotinin, 5 µg/ml leupeptin, 5 µg/ml pep-
statin, 0.5 mM dithiothreitol] and incubated for
30 min at 4°C with gentle shaking. After centrifuga-
tion (10,000 × g for 30 min), the supernatant contain-
ing the nuclear extracts was gently aspirated and
placed in a fresh tube. The samples containing equal
amounts of total protein (50 µg) were separated in
a 10% SDS-polyacrylamide gel [35]. The protein con-
centrations in all of the above-mentioned samples
were determined according to Bradford using serum
albumin as a standard [6].
Western blot analysis
After separation in polyacrylamide gels, the aliquots
were transferred to polyvinylidene fluoride mem-
branes (Pall Poland Ltd. Warszawa, Poland) [52].
Nonspecific antibody binding was inhibited by incu-
bation in TBST [20 mM Tris-buffered saline (pH 7.5)
with 0.1% Tween 20] containing 5% non-fat dried
milk for 1 h at RT. Polyclonal antibodies against
PGC-1� (1:500) and monoclonal antibodies against
iNOS (C-terminus, 1:500) and NF�B (p65 subunit,
1:1000) were obtained from Santa Cruz Biotechnol-
ogy (Santa Cruz, CA, USA). The antibodies were di-
luted in TBST containing 5% skim milk. The anti-
arginase I antibody (1:1000) was obtained from BD
Biosciences (San Jose, CA, USA) and diluted in the
same solutions. The membranes were incubated with
the antibodies overnight at 4°C, washed with TBST,
incubated at RT for 60 min with the appropriate alka-
line phosphatase-conjugated secondary antibodies di-
luted 1:1000 (Bio-Rad Laboratories Inc. Hercules, CA,
USA) and washed twice with TBST for 5 min and
once with TBS for 5 min [20 mM Tris-buffered saline
(pH 7.8)]. In each assay, the colored precipitates were
developed directly on the membrane using AP-
chromogenic substrates (Bio-Rad Laboratories) [50].
All of the membranes were photocopied and sub-
jected to further analysis. The molecular weights of
PGC-1�, arginase I, iNOS and NF�B p65 were con-
firmed according to their protein markers (PageRuler
Unstained Protein Ladder, Fermentas, Lithuania). To
control for the amounts of cytosolic proteins loaded in
each lane, �-actin was detected in parallel using
a 1:5000 dilution of anti �-actin antibodies (ABCAM
Inc. Cambridge, MA, USA). The amounts of nuclear
proteins were determined in parallel using the same di-
lution of anti-laminin �-1 antibodies (Santa Cruz, CA,
USA). Anti-�-actin and laminin �-1 antibodies were
added directly to the primary antibody-containing so-
lutions. An additional assay proved that anti-�-actin
and anti-laminin �-1 antibodies did not interfere with
the signal strengths of any of the specific primary an-
tibodies used in the present study. The integrated opti-
cal density (IOD) of the signals was semi-quantified
using Image-Pro Plus software and is expressed as the
ratio of the IOD for the tested proteins to the IOD for
�-actin or laminin �-1. The experiment was repeated
three times, and the relative density values were sub-
jected to statistical analysis.
Nitrite concentration
NO synthesis was determined by assaying the micro-
glial supernatants for nitrite, a stable reaction product
of NO with molecular oxygen, using rat colorimetric
�������������� ���� �� ����� ��� ������� 831
Metformin and inflammation in microglia��������� ��� � � ��

assay kits (Cayman Chemicals, Ann Arbor, MI, USA)
according to manufacturer’s recommendation. The ni-
trite concentrations were determined based on a stan-
dard curve of sodium nitrite [17]. Fresh culture media
served as the blank in all experiments. The optical
density was measured at 540 nm using a microplate
reader, in four independent experiments. The detec-
tion limit of this assay was determined to be 2 µM.
ROS measurement
Microglia incubated into 96-well tissue culture plates
(5 × 10� cells/well) were treated with the studied com-
pounds. After 24 h, the cells were removed from the
wells with trypsin, collected and resuspended in
DMEM containing NBT (1 mg/ml). LPS (1 µg/ml)
was added to the cell solution, which was then incu-
bated for 45 min at 37°C with 5% CO�/95% air. Cells
were collected and lysed with distilled water and brief
sonication (10 s). Aliquots of the samples were added to
96-well plates, and NBT reduction was measured by the
absorbance at 550 nm in triplicate using a microplate
reader, in four independent experiments. The results are
expressed as a percentage of the control (100%).
Cytokine assays
IL-1�, IL-6, TNF-�, TGF-� and IL-10 levels were as-
sayed using rat ELISA kits according to manufactur-
ers recommendations. The optical density of each
well was measured at 450 nm using a microplate
reader in four independent experiments. The detection
limit of the assay was determined to be 1.5 pg/ml for
IL-10, 48 pg/ml for TGF-�, 19 pg/ml for IL-6,
4.4 pg/ml for IL-1� and 15 pg/ml for TNF-�. The
intra-assay CVs for all of the cytokines were < 10%.
AMPK activity assay
AMPK activity was assayed as described previously
[10, 17, 24]. First, we assessed the time-dependent
AMPK activation after metformin administration. Mi-
croglial cells were treated with metformin (2 mM) for
10, 20, 40, 60 and 120 min. Next, we evaluated
AMPK activity with respect to the compounds ap-
plied and their doses. Microglial cells were treated
with metformin (0.02, 0.2 and 2 mM) with or without
1 µg/ml of LPS), AICAR (2 mM) and compound C
(20 µM) for 40 min at 37°C in humidified 5%
CO�/95% air (CO� incubator, Heraeus, Germany). To
inhibit AMPK, the microglia were pre-incubated with
compound C (20 µM) for 1 h, and then metformin
(2 mM) or LPS (1 µg/ml) was added for 40 min. The
microglial cells were then washed with cold PBS and
lysed on ice for 3 min in a mixture containing non-
ionic detergent (0.5 mg/ml digitonin), 50 mM Tris-
HCl, 50 mM NaF, 30 mM glycerol phosphate,
250 mM sucrose and 1 mM sodium metavanadate (pH
7.4). AMPK was partially purified from the cell
lysates by the addition of ammonium sulfate to a final
concentration of 30% (v/v) on ice for 10 min. To
evaluate AMPK activity, the specific synthetic SAMS
peptide (Millipore, Billerica, MA, USA) was used ac-
cording to Kim and colleagues [24]. The cell lysates
were incubated with SAMS peptide (HMRSAMSGL-
HLVKRR), and the catalytic activity of AMPK was
determined by [�-��P] incorporation into SAMS pep-
tide as the substrate. Briefly, the lysates were added to
kinase assay buffer (containing 62.5 mM HEPES, 62.5
mM NaCl, 62.5 mM NaF, 6.25 mM sodium pyrophos-
phate, 1.25 mM EDTA, 150 mM AMP, 150 mM ATP
and 1.5 mCi of [�-��P]ATP) and 200 mM SAMS pep-
tide. The entire mixture was incubated at 37°C in hu-
midified 5% CO�/95% air for 50 min under three assay
conditions: a) AMPK plus [�-��P]ATP (enzyme back-
ground), b) AMPK plus SAMS peptide plus [�-��P]
ATP (enzyme and substrate background) and c) AMPK
plus SAMS peptide plus AMP plus [�-��P]ATP (en-
zyme activity and background). The reactions were
stopped by the addition of SDS buffer, and the radio-
activity from [�-��P]ATP was measured using an auto-
matic scintillation reader (Beckman LS6000IC, USA).
Three independent experiments were performed, and
the results are expressed as a percentage of the radio-
activity measured in control cells.
Statistical analysis
The results are expressed as the mean ± standard devia-
tion (SD). The normality of the distribution was evaluated
using Shapiro-Wilk’s test. The data were statistically ana-
lyzed using one-way ANOVA followed by Tukey’s HSD
post-hoc test. The Bonferroni adjustment was applied for
multiple comparisons. For data that were not normally
distributed, the Kruskal-Wallis test followed by the
Mann-Whitney U-test as performed. Differences were
considered significant at p < 0.05. All statistical analyses
were performed using the SPSS statistical software pack-
age (SPSS 16.0 for Windows, Chicago, Illinois, USA).
832 �������������� ���� �� ����� ��� �������

Results
Evaluation of compound toxicity and selection
of concentrations
To ensure that the effects of the compounds employed
herein were not due to toxicity but only to their regu-
latory activity, we determined the cell viability using
the trypan blue exclusion test, MTT conversion test
and RCA-1 staining. These tests measure cell mem-
brane permeability and mitochondrial activity, whereas
the RCA-1 staining method enables precise measure-
ment of the microglial quantity [32, 36].
Because metformin may accumulate in various tis-
sues at values up to 100 times higher than those pres-
ent in the plasma after a single oral administration, we
examined the drug at concentrations ranging from
those used in the rodent brain to up to ten-fold and
one hundred-fold greater [55]. The choice of the AI-
CAR and compound C concentrations was based on
data reported in the literature [17, 61].
The results from the trypan blue exclusion test
were consistent with those obtained for RCA-1 (data
not shown). Concerning these two tests, the cell vi-
ability was impaired by metformin at 8 mM and
10 mM, by AICAR at 4 mM and by LPS at 2 µg/ml
(data not shown). Each of the treatments observed not
to impair cell viability assayed with the trypan blue
exclusion test and RCA-1 showed no decrease in cell
viability using MTT. Interestingly, most of the com-
pounds and their combinations increased the values
obtained using MTT Fig. 1).
�������������� ���� �� ����� ��� ������� 833
Metformin and inflammation in microglia��������� ��� � � ��
100 105 123 149 129 105
100 121 123 115 118 118 139 117 103
Fig. 1. Effects of metformin (MET),5-aminoimidazole-4-carboxamide 1-�-D-ribofuranoside (AICAR), compoundC (C-C), and lipopolysaccharide (LPS)on 3-(4,5-dimethylthiazol-2-yl)-2,5-diph-enyltetrazolium bromide (MTT) con-version in microglial cell cultures.Microglia were treated with MET(0.02–2 mM), AICAR (2 mM), C-C(20 µM), and LPS (1 µg/ml) for 24 h. Toactivate AMPK, microglia were pre-incubated with MET (0.02–2 mM) or AI-CAR (2 mM) for 2 h, and then LPS(1 µg/ml) was added for 24 h. To inhibitAMPK, microglia were pre-incubatedwith C-C (20 µM) for 1 h, and then MET(2 mM) or AICAR (2 mM) was added.After an additional 2 h, LPS was ad-ministered for 24 h. MTT conversion inuntreated cells (control) was set to100%. The results represent the mean± SD of four independent experiments.Asterisks (*) indicate significant differ-ences between control (100%) andtreated groups (p < 0.05)

Based on the results obtained in the initial experi-
ments, we selected concentrations of metformin rang-
ing from 0.02 mM to 2 mM, AICAR at 2 mM, com-
pound C at 20 µM, and LPS at 1 µg/ml. The intervals
used in our study were within the limits used in in vi-
tro experiments considering microglia, metformin,
AICAR, compound C, and LPS [17, 61].
Influence of metformin on [3H]thymidine incor-
poration in microglial cultures
The MTT assay results depend on the activation state
of the mitochondria, the total number of mitochon-
dria, the cell cycle phase and the number of cells in
culture [36]. An increase in the number of microglial
cells in the culture was excluded previously by
RCA-1 staining. To exclude the possibility that the
examined drugs activated cell cycle progression, we
evaluated DNA synthesis in the culture using the
[�H]thymidine incorporation assay. Neither the com-
pounds nor their combinations influenced [�H]thy-
midine incorporation in microglia (Fig. 2). Therefore,
the enhanced metabolic activity of the cells (previ-
ously assayed using MTT) appeared to be due to ei-
ther increased mitochondrial activity or a greater
number of mitochondria in the microglia. To further
evaluate the effects of the compounds on [�H]thymid-
ine incorporation, we supplemented the culture me-
dium with GM-CSF, which is a potent microglial mi-
togen. Propentofylline, which inhibits microglial pro-
liferation, was used as a negative control. As expected,
LPS caused a decrease in [�H]thymidine incorpora-
tion in microglia, whereas the remaining compounds
showed no effect.
834 �������������� ���� �� ����� ��� �������
Fig. 2. Effects of metformin (MET), 5-aminoimidazole-4-carboxamide 1-�-D-ribofuranoside (AICAR), compound C (C-C), lipopolysaccharide(LPS), propentofylline (P-P) and granulocyte/monocyte colony-stimulating factor (GM-CSF) on methyl-[�H]thymidine incorporation in microglialcell cultures. Microglia were treated for 24 h with medium containing 2.5 µCi methyl-[�H]thymidine with a) medium (control), b) P-P (10 µM), c)MET (0.02, 0.2 and 2 mM), d) AICAR (2 mM), e) C-C (20 µM), f) LPS (1 µg/ml), g) MET (0.02, 0.2 and 2 mM) and LPS 1 µg/ml), h) C-C (20 µM),MET (2 mM) and LPS (1 µg/ml), i) AICAR (2 mM) and LPS (1 µg/ml), j) C-C (20 µM), AICAR (2 mM) and LPS (1 µg/ml), or C-C (20 µM) and LPS (1µg/ml) (black columns). In parallel experiments (white columns), the microglia were treated with medium containing GM-CSF (10 ng/ml),2.5 µCi methyl-[�H]thymidine and the same concentrations of the compounds mentioned above. After a 24-h incubation at 37�C, the mediumwas removed, and the microglial cells were subjected to an automatic scintillation reader. Nonspecific uptake of [�H], which was determined inthe presence of 1 mM thymidine, was subtracted from each data point. The results represent the mean ± SD and are expressed as a percent-age of the control proliferation (100%) in three independent experiments. Asterisks (*) indicate significant differences between control (100%)and treated groups (p < 0.001)

�������������� ���� �� ����� ��� ������� 835
Metformin and inflammation in microglia��������� ��� � � ��
3.271.371.2 3.51 1.19 1.36 1.22 1.231.413.263.343.09
Fig. 3. Effects of lipopolysaccharide (LPS), metformin (MET), 5-aminoimidazole-4-carboxamide 1-�-D-ribofuranoside (AICAR), and compoundC (C-C) on AMPK activity in microglial cell cultures. Microglial cells were incubated with MET (2 mM) for 10, 20, 40, 60 and 120 min (uppergraph). Next, the microglia were treated with medium a) alone (control), b) containing LPS (1 µg/ml), c) MET (0.02, 0.2 and 2 mM), d) AICAR(2 mM), e) C-C (20 µM), f) C-C (20 µM, one-hour preincubation) and MET (2 mM), g) C-C (20 µM, one-hour preincubation) and AICAR (2 mM), h)MET (0.02, 0.2 and 2 mM, one-hour preincubation) and LPS (1 µg/ml), i) C-C (20 µM, one-hour preincubation), MET (2 mM) and LPS (1 µg/ml),or j) C-C (20 µM, one-hour preincubation) and LPS (1 µg/ml) (lower graph). AMPK activity was assessed using SAMS peptide and (�-��P)ATP assubstrates. The results represent the mean ± SD of three independent experiments. Asterisks (*) indicate significant differences between con-trol and treated groups (p < 0.05)

836 �������������� ���� �� ����� ��� �������
4.9
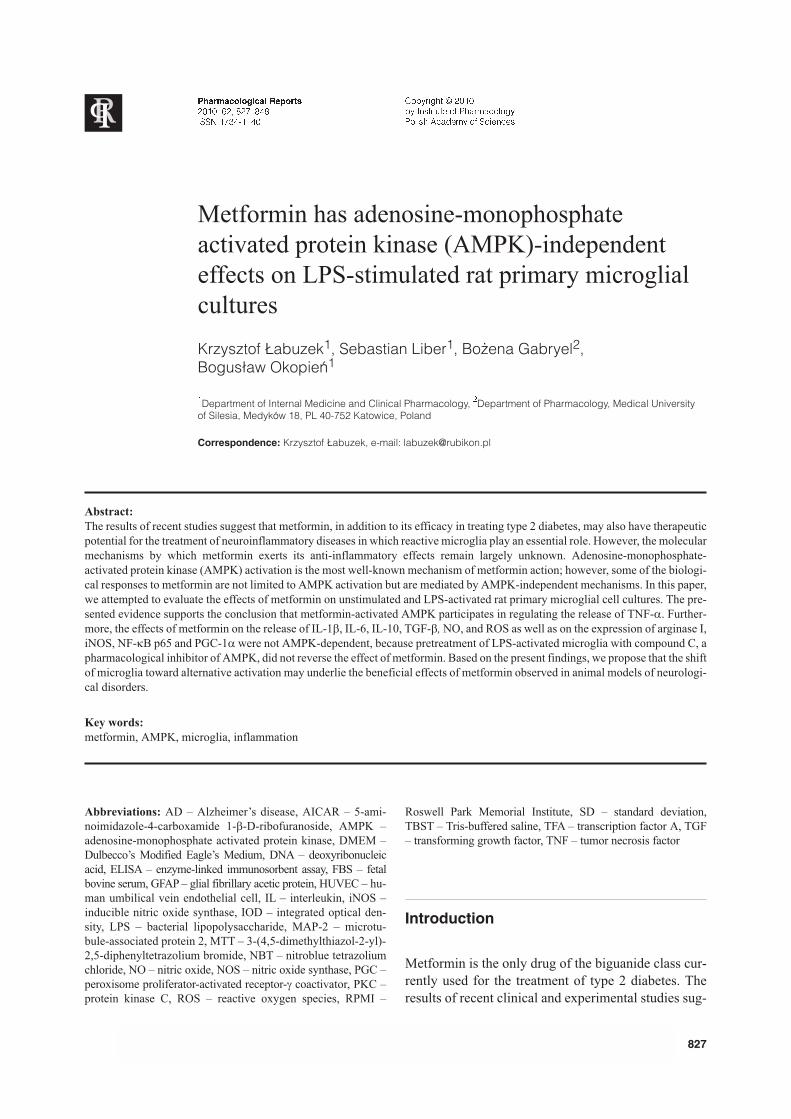
6.0 7.4 9.5 26.0 24.2 19.2 18.00 17.5 26.1 24.00 21.24.9
0.022 0.028 0.055 0.034 0.093 0.086 0.085 0.071 0.061 0.11 0.086 0.079
Fig. 4. Effects of metformin (MET), 5-aminoimidazole-4-carboxamide 1-�-D-ribofuranoside (AICAR), compound C (C-C) and lipopolysaccharide(LPS) on nitrite and ROS release in microglial cell cultures. Microglia were treated with MET (2 mM), AICAR (2 mM), C-C (20 µM), and LPS(1 µg/ml) for 24 h. To activate AMPK, microglia were pre-incubated with MET (0.02–2 mM) or AICAR (2 mM) for 2 h, and then LPS (1 mg/ml) wasadded for 24 h. To inhibit AMPK, microglia were pre-incubated with C-C (20 µM) for 1 h, and then MET (2 mM) and AICAR (2 mM) were added.After an additional 2 h, LPS (1 µg/ml) was administered for 24 h. Nitrite concentrations were evaluated using an ELISA kit. ROS was assessedby the absorbance at 550 nm using a microplate reader. The results represent the mean ± SD of four independent experiments. Asterisks (*) in-dicate significant differences between treated and control groups (p < 0.01). Symbols (#) indicate significant differences between treatedgroups and LPS alone (p < 0.05)
Influence of metformin on AMPK activity in
LPS-stimulated microglia
AMPK activity, which reflects the phosphorylation of
SAMS peptide (engineered and specific substrate for
AMPK), was determined using the radioisotope
method, as described in the Materials and Methods
section. First, we determined the incubation time that
resulted in the maximum AMPK activity after the ad-
dition of 2 mM AICAR. Peak AMPK activity was ob-
served at 40 min of incubation using the conditions
described above (Fig. 3). Therefore, this period was
chosen for further evaluation of AMPK activity. Second,
AMPK was activated with metformin (0.02–2 mM),
AICAR, LPS, and different combinations of these
compounds. Metformin (2 mM), AICAR (2 mM) and
LPS (1 µg/ml) activated AMPK to comparable ex-
tents. During the selected period, no additive effects
were observed between the combinations of pharma-
cological activators of AMPK and LPS. Third, we as-
sessed the influence of compound C on AMPK acti-
vation mediated by metformin, AICAR, and LPS.
Compound C at a concentration of 20 µM effectively
inhibited AMPK activation by all of the evaluated
compounds in microglia.
Influence of metformin on NO and ROS
production
NO synthesis was determined by assaying the culture
supernatants for nitrite, which is a stable product of
the reaction between NO and molecular oxygen. Met-
formin and AICAR did not significantly influence NO
production in unstimulated microglia. However, com-
pound C alone increased NO release in microglia that
were not treated with LPS (Fig. 4).
As expected, LPS-activated microglia released the
vast amount of NO. Treatment of the cells with LPS
in combination with metformin (at 0.2 mM and 2 mM,
metformin (2 mM) with compound C or compound C
alone attenuated NO release in comparison with the
LPS alone group. On the other hand, treatment with
LPS in combination with AICAR or AICAR and com-
pound C did not significantly affect nitrite production
in comparison with cells treated with LPS alone.
Because activated microglia also produce ROS,
which are implicated in neuroinflammation, we inves-
tigated whether metformin affects ROS production in
microglia. Metformin (in contrast to AICAR) did not
alter ROS production (Fig. 4) in unactivated micro-
glia. As expected, LPS-activated microglia generated
abundant amounts of ROS in comparison with the
control. Increasing the metformin concentration to
2 mM resulted in diminished ROS production,
whereas pretreatment with compound C enhanced this
effect in LPS-stimulated microglia. However, when
microglial cells were treated with both 2 mM AICAR
and LPS, increased ROS production was observed. In
this case, pretreatment with compound C reversed the
effect of AICAR on ROS production in activated mi-
croglia (Fig. 4).
Influence of metformin on pro- and anti-
inflammatory cytokine production
As expected, microglia stimulated with LPS released
the vast amount of pro-inflammatory cytokines (IL-1�,
IL-6, TNF-�) (Figs. 5 and 6) and relatively few anti-
inflammatory cytokines (IL-10, TGF-�) (Fig. 7). Be-
cause these cytokines are synthesized and secreted by
microglia, we evaluated whether cytokine release was
amenable to modulation with metformin. In unstimu-
lated cells, the drug alone at a concentration of 2 mM
had no effect on the production of pro-inflammatory
cytokines except IL-1� (Figs. 5 and 6); however, it
caused an increase in IL-10 and TGF-� release (Fig.
7). Metformin at concentrations of 0.2 mM and 2 mM
increased the LPS-induced production of IL-6, IL-10
and TGF-�in the supernatants of microglia cell cul-
tures (Figs. 5 and 7). Furthermore, at 2 mM only, met-
formin stimulated IL-1� release by activated micro-
glia as compared with the LPS group (Fig. 5). As indi-
cated in Figure 6, none of the evaluated con-
centrations of metformin affected the peak TNF-�
value achieved after 6 h of LPS stimulation. Moreo-
ver, all evaluated concentrations of the drug increased
TNF-� release at 12 and 24 h after LPS stimulation.
It should also be noted that AICAR (2 mM) did not
affect the release of any cytokines than TGF-� in rest-
ing microglia (Fig. 7). In activated cells, AICAR
(2 mM) caused an increase in the production of
TNF-� at 6 h and a decrease in this cytokine release at
12 h and 24 h. In addition, AICAR significantly de-
creased IL-10 levels in the media of the above LPS-
stimulated microglia (Fig. 7). With respect to TGF-�
production, 2 mM AICAR increased in the release of
this anti-inflammatory cytokine (Fig. 7).
To determine whether metformin or AICAR func-
tions in an AMPK-dependent manner, we performed
parallel experiments using compound C as a pharma-
cological inhibitor of AMPK. Pretreatment with com-
�������������� ���� �� ����� ��� ������� 837
Metformin and inflammation in microglia��������� ��� � � ��

838 �������������� ���� �� ����� ��� �������
Fig. 5. Effects of metformin (MET), 5-aminoimidazole-4-carboxamide 1-�-D-ribofuranoside (AICAR), compound C (C-C) and lipopolysaccha-ride (LPS) on IL-1� and IL-6 release in microglial cell cultures. Microglia were treated with MET (2 mM), AICAR (2 mM), C-C (20 µM) and LPS(1 µg/ml) for 24 h. To activate AMPK, microglia were pre-incubated with MET (0.02–2 mM) and AICAR (2 mM) for 2 h, and then LPS (1 µg/ml)was added for 24 h. To inhibit AMPK, microglia were pre-incubated with C-C (20 µM) for 1 h, and then MET (2 mM) and AICAR (2 mM) wereadded. After an additional 2 h, LPS (1 µg/ml) was administered for 24 h. The concentrations of IL-1� and IL-6 were evaluated using ELISA kits.The results represent the mean ± SD of four independent experiments. Asterisks (*) indicate significant differences between treated and con-trol groups (p < 0.01). Symbols (#) indicate significant differences between treated groups and LPS alone (p < 0.05)

�������������� ���� �� ����� ��� ������� 839
Metformin and inflammation in microglia��������� ��� � � ��
--
-
Fig. 6. Effects of metformin (MET), 5-aminoimidazole-4-carboxamide 1-�-D-ribofuranoside (AICAR), compound C (C-C), and lipopolysaccha-ride (LPS) on TNF-� release in microglial cell cultures. Microglia were treated with MET (2 mM), AICAR (2 mM), C-C (20 µM), and LPS (1 µg/ml)for 6, 12 and 24 h. To activate AMPK, microglia were pre-incubated with MET (0.02–2 mM) or AICAR (2 mM) for 2 h, and then LPS (1 µg/ml) wasadded for 6, 12 and 24 h. To inhibit AMPK, microglia were pre-incubated with C-C (20 µM) for 1 h, and then MET (2 mM) or AICAR (2 mM) wasadded. After an additional 2 h, LPS (1 µg/ml) was administered for 6, 12 and 24 h. TNF-� concentrations were evaluated using an ELISA kit. Theresults represent the mean ± SD of four independent experiments. Asterisks (*) indicate significant differences between treated and controlgroups (p < 0.01). Symbols (#) indicate significant differences between treated groups and LPS (1 µg/ml) alone (p < 0.05)

840 �������������� ���� �� ����� ��� �������
44.5 88 55 44.3 111 113 119 130.4 138 68.8 108.6 113
72 95 80 79 77 83 91 118 111 101 78 79
-
Fig. 7. Effects of metformin (MET), 5-aminoimidazole-4-carboxamide 1-�-D-ribofuranoside (AICAR), compound C (C-C), and lipopolysaccha-ride (LPS) on IL-10 and TGF-� release in microglial cell cultures. Microglia were treated with MET (2 mM), AICAR (2 mM), C-C (20 µM), and LPS(1 µg/ml) for 24 h. To activate AMPK, microglia were pre-incubated with MET (0.02–2 mM) or AICAR (2 mM) for 2 h, and then LPS (1 mg/ml) wasadded for 24 h. To inhibit AMPK, microglia were pre-incubated with C-C (20 µM) for 1 h, and then MET (2 mM) or AICAR (2 mM) was added. Af-ter an additional 2 h, LPS (1 µg/ml) was administered for 24 h. IL-10 and TGF-� concentrations were evaluated using ELISA kits. The results rep-resent the mean ± SD of four independent experiments. Asterisks (*) indicate significant differences between treated and control groups (p <0.01). Symbols (#) indicate significant differences between treated groups and LPS (1 µg/ml) alone (p < 0.05)

pound C reversed the effect of metformin on TNF-�.
Although the release of other cytokines (excluding
IL-10) was affected by this treatment, metformin
overcame this inhibition significantly, which sug-
gested an AMPK-independent mechanism of action.
The pretreatment with compound C reversed the
effects of AICAR on the production of IL-1� (Fig. 5),
TNF-� (Fig. 6), IL-10 and TGF-� (Fig. 7). However,
compound C did not alter the effect of AICAR on
IL-6 release in the media from the LPS-stimulated mi-
croglial cell cultures described above (Fig. 5). Thus,
we showed that the release of all cytokines, with the
exception of IL-6, was modulated by AMPK. On the
other hand, pretreatment of the microglia with com-
pound C alone inhibited the effect of LPS on IL-1�,
IL-6 and TNF-� release (Figs. 5 and 6) but did not alter
IL-10 and TGF-� release (Fig. 7) by activated microglia.
Influence of metformin on iNOS and arginase I
expression
NO production results from the competition between
arginase I and iNOS. These two enzymes are induced
in response to inflammatory stimuli. Whereas iNOS
up-regulates NO production, arginase I has a limiting
effect [49].
Both metformin and AICAR increased arginase I
expression in unstimulated microglia to an extent
similar to that achieved in LPS-activated cells (Fig.
8). Pre-incubation of the microglia with both AMPK
activators also augmented arginase I expression in
LPS-stimulated microglia. However, the addition of
a pharmacological inhibitor of AMPK (compound C)
differently modified the influence of metformin and
AICAR on arginase I expression in the presence of
LPS. Whereas compound C further increased arginase
I expression in the presence of metformin, it attenu-
ated arginase I expression to control values in the
presence of AICAR in LPS-stimulated microglia. It
should be noted that compound C alone increased ar-
ginase I expression in both unstimulated and stimu-
lated microglia in comparison to the control (Fig. 8).
Metformin, AICAR and compound C did not alter
iNOS expression in unstimulated microglia as com-
pared to the control. In accordance with the produc-
tion of nitrite, LPS increased iNOS expression in
comparison with the control. Both metformin and AI-
CAR decreased iNOS expression in LPS-stimulated
microglia. In addition, cultures pretreated with both
AMPK activators and compound C demonstrated no
significant changes in this parameter. Furthermore,
compound C alone did not affect iNOS expression in
comparison to LPS-stimulated microglia (Fig. 8).
Influence of metformin on NF-�B expression
NF-�B is a well-known regulator of IL-1�, IL-6,
TNF-� and iNOS transcription. Metformin, AICAR,
and compound C did not alter NF-�B p65 expression
in unstimulated microglia compared to the control
(Fig. 9). As expected, stimulation of the microglia
with LPS resulted in increased NF-�B p65 expression
in nuclear extracts. Metformin alone did not alter
NF-�B p65 expression in LPS-stimulated microglia,
whereas in the cultures treated with metformin and
compound C, NF�B p65 expression was attenuated.
Furthermore, AICAR alone as well as AICAR added
after pretreatment with compound C resulted in de-
creased NF-�B p65 expression in LPS-stimulated mi-
croglia (Fig. 9).
Influence of metformin on PGC-1� expression
PGC-1� is a transcriptional co-activator that is essen-
tial for mitochondrial biogenesis [25]. Mitochondrial
biogenesis can amplify and repopulate functional mi-
tochondria, and it is expected to increase both the mi-
tochondrial mass and the overall mitochondrial mem-
brane potential [38]. Mitochondrial biogenesis may
ambivalently affect ROS production depending on the
activating event [48, 54]. To test whether metformin af-
fected mitochondrial biogenesis in microglia, changes in
the PGC-1� protein levels were monitored by im-
munoblotting.
Both pharmacological activators of AMPK in-
creased PGC-1� expression as compared to the con-
trol (Fig. 9). Stimulation of the microglia with LPS
also caused a rise in PGC-1� expression. Further-
more, pre-treatment with metformin and AICAR in-
creased PGC-1� expression in LPS-stimulated micro-
glia. The addition of a pharmacological inhibitor of
AMPK (compound C) differently modified the influ-
ence of metformin and AICAR on PGC-1� expres-
sion in the presence of LPS. Whereas compound C
further increased PGC-1� expression in the presence
of metformin, it attenuated this parameter to control
values in the presence of AICAR in LPS-stimulated
microglia. Moreover, compound C both alone and to-
gether with LPS increased the expression of PGC-1�
(Fig. 9).
�������������� ���� �� ����� ��� ������� 841
Metformin and inflammation in microglia��������� ��� � � ��

842 �������������� ���� �� ����� ��� �������
Fig. 8. Effects of lipopolysaccharide (LPS), metformin (MET), 5-aminoimidazole-4-carboxamide 1-�-D-ribofuranoside (AICAR), and compoundC (C-C) on arginase I and iNOS expression in microglial cell cultures. Microglia were treated with MET (2 mM), AICAR (2 mM), C-C (20 µM), andLPS (1 µg/ml) for 24 h. To activate AMPK, microglia were pre-incubated with MET (2 mM) and AICAR (2 mM) for 2 h, and then LPS (1 µg/ml) wasadded for 24 h. To inhibit AMPK, microglia were pre-incubated with C-C (20 µM) for 1 h, and then MET (2 mM) or AICAR (2 mM) was added. Af-ter an additional 2 h, LPS (1 µg/ml) was administered for 24 h. The expression of arginase I and iNOS was evaluated by western blot analysisusing antibodies specific for arginase I, iNOS and �-actin. The results were subjected to densitometric analysis, and the results represent themean ± SD of three independent experiments. Asterisks (*) indicate significant differences between treated and control groups (p < 0.05).Symbols (#) indicate significant differences between treated groups and LPS (1 mg/ml) alone (p < 0.05)

�������������� ���� �� ����� ��� ������� 843
Metformin and inflammation in microglia��������� ��� � � ��
Fig. 9. Effects of lipopolysaccharide (LPS), metformin (MET), 5-aminoimidazole-4-carboxamide 1-�-D-ribofuranoside (AICAR), and compoundC (C-C) on NF-�B and PGC-1� expression in microglial cell cultures. Microglia were treated with MET (2 mM), AICAR (2 mM), C-C (20 µM), andLPS (1 µg/ml) for 24 h. To activate AMPK, microglia were pre-incubated with MET (2 mM) and AICAR (2 mM) for 2 h, and then LPS (1 µg/ml) wasadded for 24 h. To inhibit AMPK, microglia were pre-incubated with C-C (20 µM) for 1 h, and then MET (2 mM) or AICAR (2 mM) was added. Af-ter an additional 2 h, LPS (1 µg/ml) was administered for 24 h. The expression of NF-�B and PGC-1� was evaluated by western blot analysis us-ing antibodies specific for NF-�B, PGC-1�, laminin 1� and �-actin. The results were subjected to densitometric analysis, and the results repre-sent the mean ± SD of three independent experiments. Asterisks (*) indicate significant differences between treated and control groups (p <0.05). Symbols (#) indicate significant differences between treated groups and LPS (1 mg/ml) alone (p < 0.05)

Discussion
The results of recent studies suggest that metformin,
in addition to its efficacy in treating type 2 diabetes,
may have therapeutic potential for the treatment of
neuroinflammatory diseases in which reactive micro-
glia play an etiological role [8, 37]. However, the mo-
lecular mechanisms by which metformin exerts its
anti-inflammatory effects remain largely unknown.
In the present study, we attempted to evaluate the
effects of metformin on LPS-stimulated rat primary
microglial cell cultures. To ensure that the observed
effects of metformin were not due to its previously
described cytotoxicity in certain cell types [19], cell
viability was assessed using the trypan blue exclusion
test and the MTT assay. Treatment of the microglia
with metformin alone or in combination with LPS
(1 µg/ml) at concentrations ranging from 0.02 mM to
2 mM did not impair cell viability. Interestingly, met-
formin at concentrations ranging from 0.2 mM to
2 mM increased the values obtained using the MTT
assay (Fig. 1). Because the results of the MTT assay
depend on the activation state of mitochondria, their
total number, and the cell cycle phase of the cultured
cells [36], we evaluated whether metformin affected
DNA synthesis using the [3H]thymidine incorporation
assay. Metformin did not affect DNA synthesis in mi-
croglia. Therefore, we could exclude the possibility
that metformin affected DNA synthesis in our experi-
mental conditions, thus favoring the hypothesis that
metformin induces mitochondrial biogenesis.
The evidence presented herein supports the conclu-
sion that AMPK activated by metformin is involved
in regulating the release of TNF-�] (12 and 24 h)
(Fig. 6). Furthermore, we found that the effects of
metformin on the release of IL-1�, IL-6, IL-10, and
TGF-� (Figs. 5 and 7), NO, and ROS (Fig. 4), the
MTT values (Fig. 1), and on the expression of argi-
nase I, iNOS, NF-�B p65 and PGC-1� (Figs. 8 and 9)
were not AMPK-dependent. AMPK-independency
was defined as either the lack of reversal or overcom-
ing the influence of pharmacological inhibitor of
AMPK on a given parameter. The interpretation of
data obtained from the use of another pharmacologi-
cal activator of AMPK showed that the enzyme may
also regulate the release of TNF-� (6 h), IL-1�, IL-10,
TGF-� (Fig. 5–7), and ROS (Fig. 4), the values of
MTT (Fig. 1), as well as the expression of arginase I
and PGC-1� (Fig. 8 and Fig. 9). The discrepancy in
the AMPK-dependency of analyzed parameters may
lay in the different non-specific effects of metformin
and AICAR, the different mode of AMPK activation,
and the different activity of cytosolic to nuclear
AMPK alpha subunits achieved with these sub-
stances. It is known that both in vitro and in vivo mi-
croglia can be activated by LPS, which leads to dras-
tic changes in their cellular functions and to the pro-
duction of various types of inflammatory mediators
such as NO, ROS and pro-inflammatory cytokines
[4].
Activated microglial cells are capable of generating
substantial amounts of NO through oxidation of the
substrate L-arginine by iNOS. In addition to NOS, L-
arginine is metabolized by arginase, which hydrolyzes
L-arginine to urea and ornithine and plays a funda-
mental role in nitrogen metabolism [49]. It has been
shown that microglia produce both arginase I and
iNOS in vitro [60]. Numerous studies have elucidated
a competitive balance in the regulation of both argi-
nase and iNOS and demonstrated that arginase can af-
fect the function of NOS by depleting the bioavail-
ability of L-arginine [60]. In fact, we showed that
metformin attenuated iNOS but raised arginase I pro-
tein expression, which coincided with the downregu-
lation of NO synthesis (Figs. 4 and 8). A similar effect
was observed by Nath et al. [37], who found that met-
formin inhibits LPS-induced NO production and
iNOS expression in RAW267.4 cells.
There are several potential sources of ROS in mi-
croglia, including the nicotinamide adenine dinucleo-
tide phosphate (NADPH) oxidase, mitochondrial res-
piratory chain, xanthine oxidase, microsomal en-
zymes, cyclooxygenase and lipoxygenase [57]. In
response to LPS, however, it is believed that the pri-
mary source of ROS or related reactive nitric species
is NADPH oxidase. ROS generation by mitochondria
is also particularly important, given that either dam-
aged or activated mitochondria are a well-known
source of a significant amount of oxidative stress [2,
48]. In the present study, we observed an attenuation
of ROS production in LPS-stimulated microglia
treated with 2 mM metformin, and this effect was not
only AMPK-independent but also antagonistic to
AMPK activation (Fig. 4). Metformin is essentially
a mitochondrial respiratory complex I inhibitor [39],
and metformin accumulates mainly in the mitochon-
drial compartment of the cell [56]. Moreover, the
highly active and versatile microglia possess numer-
ous mitochondria in their cytoplasm [1]. Therefore,
844 �������������� ���� �� ����� ��� �������

the observed decrease in ROS production may be due
to the inhibition of mitochondrial respiratory complex
I, which should result in a relative decrease in mito-
chondrial oxydoreductive potential assayed using
MTT. However, no differences were detected between
MTT values obtained for LPS-stimulated cultures
treated with the drug, suggesting that metformin regu-
lates ROS production in a more sophisticated manner.
In the present study, metformin mounted an immu-
nological response in initially resting microglia. This
response consisted only of an increase in cytokine re-
lease, with the exception of TNF-�. However, this re-
sult was obtained with concentrations of metformin
that far exceeded those encountered in the brain after
a single oral dose of metformin, and one must bear in
mind that microglia are rich in mitochondria [1] and
that metformin accumulates up to 100-fold in cells
rich in mitochondria [55, 56]. Therefore, metformin
not only modulates events initiated by LPS but also
can induce the immunological response on its own.
Unexpectedly, the increased concentrations of pro-
inflammatory cytokines harvested from the media did
not follow the increased nuclear translocation of
NF-�B. Because NF-�B controls the transcription of
pro-inflammatory cytokines, metformin appears to af-
fect either the post-transcriptional processing or the
secretion of these proteins.
However, our results concerning the influence of
metformin on pro-inflammatory release are somewhat
different from those reported by Nath et al. [37], who
used RAW267.4 cells and splenic macrophages.
These authors have found that metformin (5–10 mM)
strongly inhibits LPS-induced production of TNF-�,
IL-6 and INF-� in the culture supernatants, which
were collected at 48 h after LPS stimulation. There-
fore, the inconsistent results may be due to differences
between macrophages and microglia as well as to the
experimental conditions used in the two studies.
Mitochondrial biogenesis involves the replication
of mitochondrial DNA (mtDNA) and an increase in
mitochondrial mass; it requires complex coordination
between the nuclear and mitochondrial genomes [15,
42]. This is largely achieved through the up-
regulation of PGC-1� [58]. PGC-1� up-regulates two
nuclear transcription factors known as NRF-1 and -2
(nuclear respiratory factors 1 and 2), which activate
the transcription of nuclear-encoded mitochondrial
genes [18]. PGC-1� also up-regulates mitochondrial
transcription factor A (TFAM), which stimulates the
transcription of mitochondrial genes [58]. Mitochon-
drial biogenesis has been shown to affect ROS pro-
duction paradoxically (either up- or down-regulation),
depending on the inducer used, which suggests that
our understanding of the process is quite incomplete
[48, 54]. It appears that some constituents of mito-
chondria responsible for ROS metabolism may be
up-regulated selectively. Consequently, PGC-1� has
been shown to up-regulate both Mn-SOD (ROS scav-
enger) and mitochondrial respiratory chain constitu-
ents (ROS generator) [25]. In the present study, it
seems likely that metformin up-regulated mainly the
first whereas AICAR mostly influenced the last, at
least from a functional perspective. This difference
may result from the different effects of these com-
pounds on NF-�B expression. The promoter of Mn-
SOD (ROS scavenger detected in microglia) contains
an NF-�B consensus sequence, and Mn-SOD expres-
sion is enhanced by the increased expression of
NF-�B [11, 14].
AMPK directly activates PGC-1� by phosphoryla-
tion at Thr177 and Ser538 and is also known to up-
regulate the DNA binding activity of NRF-1 [5].
However, our results for PGC-1� protein expression
suggested that metformin might regulate mitochon-
drial biogenesis in LPS-stimulated microglia via the
induction of an AMPK-independent pathway, because
the effect of metformin was not reversed by com-
pound C (Fig. 9). Moreover, PGC-1� and arginase I
levels demonstrated a concomitant difference, which
suggests that the expression of these proteins is caus-
ally connected. PGC-1, the other member of the PGC
family of transcription factors, has been shown to up-
regulate arginase I expression [54]. Members of the
PGC family are considered to have redundant func-
tions [27], and it appeared that PGC-1 might regulate
arginase I expression in our experimental settings. Re-
cently, p38 MAPK emerged as an AMPK-independent
molecular target of metformin, and p38 MAPK acti-
vation has been shown to increase the expression of
PGC-1� [40, 43]. Because p38 MAPK is a key en-
zyme involved in TNF-� release, the regulation of
PGC-1 expression by metformin through activation of
p38 MAPK should result in concomitant changes in
PGC-1 expression and TNF-� release.
Based on the above-described observations of the
changes in arginase I and iNOS along with the in-
creased PGC-1� expression (Figs. 8 and 9) as indica-
tors of mitochondrial biogenesis and the profile of
released cytokines, we suggest that metformin may
induce the alternative activation of unstimulated mi-
�������������� ���� �� ����� ��� ������� 845
Metformin and inflammation in microglia��������� ��� � � ��

croglia and cause a shift in LPS-stimulated microglia
from classical toward alternative activation [54]. The
increased ratio of arginase I to iNOS expression, ele-
vated expression of PGC-1�, and enhanced release of
anti-inflammatory cytokines such as TGF-� are com-
mon indicators of alternative activation in microglia
[12].
Recently, alternative activation markers were
shown to be increased in BV2 microglia, a transgenic
mouse model of Alzheimer’s disease (AD) and in the
brains of AD patients [9], and the number of alterna-
tively activated microglia correlates inversely with
the severity of AD [23]. Moreover, physiological
stimuli seem to elicit alternative activation, whereas
pathologic ones appear to evoke classical activation in
microglia. Therefore, alternative and classical activa-
tion appear to correspond to neuroprotective and neu-
rotoxic states, respectively. Thus, metformin may pro-
mote neuroprotective properties in microglia.
However, metformin up-regulated the release of
pro-inflammatory cytokines, which are considered to
play negative roles in inflammatory processes within
the CNS [51]. However, this opinion is questioned by
recent studies describing the neuroprotective roles of
IL-1�, IL-6 and TNF-� secreted from activated mi-
croglia [7, 29, 45, 46]. Recent studies have shown that
peroxynitrite (a byproduct of NO and ROS) produced
secondarily to elevated levels of pro-inflammatory
cytokines is responsible for their detrimental effects
[59], and metformin causes a dissociation between the
release of pro-inflammatory cytokines and the pro-
duction of NO and ROS in unstimulated microglia
and diminishes the production of NO and ROS in the
presence of elevated levels of pro-inflammatory cyto-
kines in LPS-stimulated microglia. Moreover, met-
formin up-regulates the release of anti-inflammatory
cytokines in both unstimulated and LPS-stimulated
microglia. These anti-inflammatory cytokines allevi-
ate the detrimental effects of pro-inflammatory cyto-
kines and attenuate the neurotoxic properties of mi-
croglia [21, 28]. Therefore, metformin appears to
have a beneficial effect on the equilibrium among the
factors released from microglia in vitro [29].
In summary, we demonstrated that metformin af-
fected the release of both pro-inflammatory and anti-
inflammatory cytokines and reduced the production
of toxic molecules. Our results provide additional
data about AMPK-dependent and -independent
mechanisms by which metformin may modulate the
inflammatory response in microglia. Considering the
described properties of metformin, we propose that
the shift of microglia toward alternative activation
may underlie the beneficial effects of metformin ob-
served in animal models of neurological disorders.
Acknowledgments:
The authors are thankful to Mrs. Jaros³awa Sprada, Mrs. Halina
Klimas and Mrs. Anna Bielecka for their excellent technical
support. This work was supported by research grant
KNW-2-092/09 from the Medical University of Silesia, Katowice,
Poland. None of the authors has any conflict of interest. The study
was approved by the Ethical Committee of the Medical University of
Silesia, and the experiments complied with the current laws in
Poland.
References:
1. Banati RB, Egensperger R, Maassen A, Hager G,
Kreutzberg GW, Graeber MB: Mitochondria in activated
microglia in vitro. J Neurocytol, 2004, 33, 535–541.
2. Beal MF: Energetics in the pathogenesis of neurodegen-
erative diseases. Trends Neurosci, 2000, 23, 298–304.
3. Beckner ME, Gobbel GT, Abounader R, Burovic F,
Agostino N R, Laterra J, Pollack IF: Glycolytic glioma
cells with active glycogen synthase are sensitive to
PTEN and inhibitors of PI3K and gluconeogenesis. Lab
Invest, 2005, 85, 1457–1470.
4. Benveniste EN: Role of macrophages/microglia in multi-
ple sclerosis and experimental allergic encephalomyeli-
tis. J Mol Med, 1997, 75, 165–173.
5. Bergeron R, Ren JM, Cadman KS, Moore IK, Perret P,
Pypaert M, Young LH et al.: Chronic activation of AMP
kinase results in NRF-1 activation and mitochondrial
biogenesis. Am J Physiol Endocrinol Metab, 2001, 281,
1340–1346.
6. Bradford MM: A rapid and sensitive method for the
quantification of microgram quantities of protein utiliz-
ing the principle of protein dye-binding. Anal Biochem,
1976, 72, 248–251.
7. Carlson NG, Wieggel WA, Chen J, Bacchi A, Rogers
SW, Gahring LC: Inflammatory cytokines IL-1�, IL-1�,
IL-6, and TNF-� impart neuroprotection to an excitotoxin
through distinct pathways. J Immunol, 1999, 163, 3963–3968.
8. Chen Y, Zhou K, Wang R, Liu Y, Kwak YD, Ma T,
Thompson RC et al.: Antidiabetic drug metformin (Glu-
cophageR) increases biogenesis of Alzheimer’s amyloid
peptides via up-regulating BACE1 transcription. Proc
Natl Acad Sci USA, 2009, 106, 3907–3912.
9. Colton CA, Mott RT, Sharpe H, Xu Q, Van Nostrand
WE, Vitek MP: Expression profiles for macrophage al-
ternative activation genes in AD and in mouse models of
AD. J Neuroinflammation, 2006, 3, 27.
10. Davies SP, Carling DG, Hardie DG: Tissue distribution
of the AMP-activated protein kinase and lack of activa-
tion by cyclic-AMP-dependent protein kinase studied us-
846 �������������� ���� �� ����� ��� �������

ing a specific and sensitive peptide assay. Eur J Bio-
chem, 1989, 186, 123–128.
11. Dopp JM, Sarafian TA, Spinella FM, Kahn MA, Shau H,
de Vellis J: Expression of the p75 TNF receptor is linked
to TNF-induced NF�B translocation and oxyradical neutrali-
zation in glial cells. Neurochem Res, 2002, 27, 1535–1542.
12. Edwards JP, Zhang X, Frauwirth KA, Mosser DM: Bio-
chemical and functional characterization of three acti-
vated macrophage populations. J Leukoc Biol, 2006, 80,
1298–1307.
13. El-Mir MY, Detaille D, R-Villanueva G, Delgado-
Esteban M, Guigas B, Attia S, Fontaine E et al.: Neuro-
protective role of antidiabetic drug metformin against
apoptotic cell death in primary cortical neurons. J Mol
Neurosci, 2008, 34, 77–87.
14. Figiel I: Pro-inflammatory cytokine TNF-� as a neuro-
protective agent in the brain. Acta Neurobiol Exp (Wars),
2008, 68, 526–534.
15. Fu X, Wan S, Lyu YL, Liu LF, Qi H: Etoposide induces
ATM-dependent mitochondrial biogenesis through
AMPK activation. PLoS One, 2008,
http://www.plosone.org/article/info%3A-
doi%2F10.1371%2Fjournal.pone.0002009.
16. Gebicke-Haerter PJ, Bauer J, Schobert A, Northoff H:
Lipopolysaccharide-free conditions in primary astrocyte
cultures allow growth and isolation of microglial cells.
J Neurosci, 1989, 9, 183–194.
17. Giri S, Nath N, Smith B, Viollet B, Singh AK, Singh I:
5-Aminoimidazole-4-carboxamide-1-�-4-ribofuranoside
inhibits proinflammatory response in glial cells: a possi-
ble role of AMP-activated protein kinase. J Neurosci,
2004, 24, 479–487.
18. Gleyzer N, Vercauteren K, Scarpulla RC: Control of mi-
tochondrial transcription specificity factors (TFB1M and
TFB2M) by nuclear respiratory factors (NRF-1 and
NRF-2) and PGC-1 family coactivators. Mol Cell Biol,
2005, 25, 1354–1366.
19. Gotlieb WH, Saumet J, Beauchamp MC, Gu J, Lau S,
Pollak MN, Bruchim I: In vitro metformin anti-neoplastic
activity in epithelial ovarian cancer. Gynecol Oncol,
2008, 110, 246–250.
20. Hanisch UK, Kettenmann H: Microglia: active sensor
and versatile effectors cells in the normal and pathologic
brain. Nat Neurosci, 2007, 10, 1387–1394.
21. Hu S, Chao CC, Ehrlich LC, Sheng WS, Sutton RL,
Rockswold GL, Peterson PK: Inhibition of microglial
cell RANTES production by IL-10 and TGF-beta. J Leu-
koc Biol, 1999, 65, 815–821.
22. Isoda K, Young JL, Zirlik A, MacFarlane LA, Tsuboi N,
Gerdes N, Schönbeck U, Libby P: Metformin inhibits
proinflammatory responses and nuclear factor-�B in hu-
man vascular wall cells. Arterioscler Thromb Vasc Biol,
2006, 26, 611–617.
23. Jimenez S, Baglietto-Vargas D, Caballero C, Moreno-
Gonzalez I, Torres M, Sanchez-Varo R, Ruano D et al.: In-
flammatory response in the hippocampus of
PS1M146L/APP751SL mouse model of Alzheimer’s dis-
ease: age-dependent switch in the microglial phenotype from
alternative to classic. J Neurosci, 2008, 28, 11650–11661.
24. Kim J, Yoon MY, Choi SL, Kang I, Kim SS, Kim YS,
Choi YK, Ha J: Effects of stimulation of AMP-activated
protein kinase on insulin-like growth factor 1- and epi-
dermal growth factor-dependent extracellular signal-
regulated kinase pathway. J Biol Chem, 2001, 276,
19102–19110.
25. Kukidome D, Nishikawa T, Sonoda K, Imoto K, Fuji-
sawa K, Yano M, Motoshima H et al.: Activation of
AMP-activated protein kinase reduces hyperglycemia-
induced mitochondrial reactive oxygen species produc-
tion and promotes mitochondrial biogenesis in human
umbilical vein endothelial cells. Diabetes, 2006, 55,
120–127.
26. Kuo CL, Ho FM, Chang MY, Prakash E, Lin WW: Inhi-
bition of lipopolysaccharide-induced inducible nitric ox-
ide synthase and cyclooxygenase-2 gene expression by
5-aminoimidazole-4-carboxamide riboside is independ-
ent of AMP-activated protein kinase. J Cell Biochem,
2008, 103, 931–940.
27. Lai L, Leone TC, Zechner C, Schaeffer PJ, Kelly SM,
Flanagan DP, Medeiros DM et al.: Transcriptional coacti-
vators PGC-1� and PGC-l� control overlapping pro-
grams required for perinatal maturation of the heart.
Genes Dev, 2008, 22, 1948–1961.
28. Ledeboer A, Brevé JJ, Poole S, Tilders FJ, Van Dam
AM: Interleukin-10, interleukin-4, and transforming
growth factor-� differentially regulate
lipopolysaccharide-induced production of pro-
inflammatory cytokines and nitric oxide in co-cultures of rat
astroglial and microglial cells. Glia, 2000, 30, 134–142.
29. Li L, Lu J, Tay SS, Moochhala SM, He BP: The function
of microglia, either neuroprotection or neurotoxicity, is
determined by the equilibrium among factors released
from activated microglia in vitro. Brain Res, 2007, 1159,
8–17.
30. Li L, Mamputu JC, Wiernsperger N, Renier G: Signaling
pathways involved in human vascular smooth muscle
cell proliferation and matrix metalloproteinase-2 expres-
sion induced by leptin: inhibitory effect of metformin.
Diabetes, 2005, 54, 2227–2234.
31. Lin HW, Levison SW: Context-dependent IL-6 potentia-
tion of interferon-gamma-induced IL-12 secretion and
CD40 expression in murine microglia. J Neurochem,
2009, 111, 808–818.
32. Labuzek K, Kowalski J, Gabryel B, Herman ZS: Chlor-
promazine and loxapine reduce interleukin-1� and
interleukin-2 release by rat mixed glial and microglial cell
cultures. Eur Neuropsychopharmacol, 2005, 15, 23–30.
33. Ma TC, Buescher JL, Oatis B, Funk JA, Nash AJ, Car-
rier RL, Hoyt KR: Metformin therapy in a transgenic
mouse model of Huntington’s disease. Neurosci Lett,
2007, 411, 98–103.
34. Mamputu JC, Wiernsperger NF, Renier G: Antiathero-
genic properties of metformin: the experimental evi-
dence. Diabetes Metab, 2003, 29, 6S71–6S76.
35. Medeiros R, Prediger RD, Passos GF, Pandolfo P, Duarte
FS, Franco JL, Dafre AL et al.: Connecting TNF-� sig-
naling pathways to iNOS expression in a mouse model
of Alzheimer’s disease: relevance for the behavioral and
synaptic deficits induced by amyloid beta protein. J Neu-
rosci, 2007, 27, 5394–5404.
�������������� ���� �� ����� ��� ������� 847
Metformin and inflammation in microglia��������� ��� � � ��

36. Mosmann T: Rapid colorimetric assay for cellular
growth and survival: application to proliferation and cy-
totoxicity assays. J Immunol Methods, 1983, 65, 55–63.
37. Nath N, Khan M, Paintlia MK, Hoda MN, Giri S: Met-
formin attenuated the autoimmune disease of the central
nervous system in animal models of multiple sclerosis.
J Immunol, 2009, 182, 8005–8014.
38. Nisoli E, Falcone S, Tonello C, Cozzi V, Palomba L, Fio-
rani M, Pisconti A et al.: Mitochondrial biogenesis by
NO yields functionally active mitochondria in mammals.
Proc Natl Acad Sci USA, 2004, 101, 16507–16512.
39. Owen MR, Doran E, Halestrap AP: Evidence that met-
formin exerts its anti-diabetic effects through inhibition
of complex 1 of the mitochondrial respiratory chain. Bio-
chem J, 2000, 348, 607–614.
40. Puigserver P, Rhee J, Lin J, Wu Z, Yoon JC, Zhang CY,
Krauss S et al.: Cytokine stimulation of energy expendi-
ture through p38 MAP kinase activation of PPARgamma
coactivator-1. Mol Cell, 2001, 8, 971–982.
41. Re F, Belyanskaya SL, Riese RJ, Cipriani B, Fischer FR,
Granucci F, Ricciardi-Castagnoli P et al.: Granulocyte-
macrophage colony-stimulating factor induces an expres-
sion program in neonatal microglia that primes them for
antigen presentation. J Immunol, 2002, 169, 2264–2273.
42. Reznick RM, Shulman GI: The role of AMP-activated
protein kinase in mitochondrial biogenesis. J Physiol,
2006, 574, 33–39.
43. Saeedi R, Parsons HL, Wambolt RB, Paulson K, Sharma
V, Dyck JR, Brownsey RW, Allard MF: Metabolic ac-
tions of metformin in the heart can occur by AMPK-
independent mechanisms. Am J Physiol Heart Circ
Physiol, 2008, 294, 2497–2506.
44. Satoh J, Kim SU: Ganglioside markers GD3, GD2, and
A2B5 in fetal human neurons and glial cells in culture.
Dev Neurosci, 1995, 17, 137–148.
45. Sawada H, Hishida R, Hirata Y, Ono K, Suzuki H, Mura-
matsu S, Nakano I et al.: Activated microglia affect the
nigro-striatal dopamine neurons differently in neonatal
and aged mice treated with 1-methyl-4-phenyl-1,2,3,6-
tetrahydropyridine. J Neurosci Res, 2007, 85, 1752–1761.
46. Shaftel SS, Kyrkanides S, Olschowka JA, Miller JN,
Johnson RE, O’Banion MK: Sustained hippocampal
IL-1� overexpression mediates chronic neuroinflamma-
tion and ameliorates Alzheimer plaque pathology. J Clin
Invest, 2007, 117, 1595–1604.
47. Si QS, Nakamura Y, Schubert P, Rudolphi K, Kataoka K:
Adenosine and propentofylline inhibit the proliferation
of cultured microglial cells. Exp Neurol, 1996, 137,
345–349.
48. Sonoda J, Laganière J, Mehl IR, Barish GD, Chong LW,
Li X, Scheffler IE et al.: Nuclear receptor ERR� and co-
activator PGC-1� are effectors of IFN-�-induced host de-
fense. Genes Dev, 2007, 21, 1909–1920.
49. Sonoki T, Nagasaki A, Gotoh T, Takiguchi M, Takeya
M, Matsuzaki H, Mori M: Coinduction of nitric-oxide
synthase and arginase I in cultured rat peritoneal macro-
phages and rat tissues in vivo by lipopolysaccharide.
J Biol Chem, 1997, 272, 3689–3693.
50. Stott DI: Immunoblotting and dot blotting. J Immunol
Methods, 1989, 119, 153–187.
51. Streit WJ, Miller KR, Lopes KO, Njie E: Microglial de-
generation in the aging brain – bad news for neurons?
Front Biosci, 2008, 13, 3423–3438.
52. Towbin H, Staehelin T, Gordon J: Electrophoretic trans-
fer of proteins from polyacrylamide gels to nitrocellulose
sheets: procedure and some applications. Proc Natl Acad
Sci USA, 1979, 76, 4350–4354.
53. Towler MC, Hardie DG: AMP-activated protein kinase
in metabolic control and insulin signaling. Circ Res,
2007, 100, 328–341.
54. Vats D, Mukundan L, Odegaard JI, Zhang L, Smith KL,
Morel CR, Wagner RA et al.: Oxidative metabolism and
PGC-1� attenuate macrophage-mediated inflammation.
Cell Metab, 2006, 4, 13–24.
55. Wilcock C, Bailey CJ: Accumulation of metformin by
tissues of the normal and diabetic mouse. Xenobiotica,
24, 1994, 49–57.
56. Wilcock C, Wyre ND, Bailey CJ: Subcellular distribution
of metformin in rat liver. J Pharm Pharmacol, 1991, 43,
442–444.
57. Wilkinson BL, Landreth GE: The microglial NADPH
oxidase complex as a source of oxidative stress in Alz-
heimer’s disease. J Neuroinflammation, 2006, 3, 30.
58. Wu Z, Puigserver P, Andersson U, Zhang C, Adelmant
G, Mootha V, Troy A et al.: Mechanisms controlling mi-
tochondrial biogenesis and respiration through the ther-
mogenic coactivator PGC-1. Cell, 1999, 98, 115–124.
59. Xie Z, Wei M, Morgan TE, Fabrizio P, Han D, Finch CE,
Longo VD: Peroxynitrite mediates neurotoxicity of amy-
loid �-peptide����- and lipopolysaccharide-activated mi-
croglia. J Neurosci, 2002, 22, 3484–3492.
60. Xu L, Hilliard B, Carmody RJ, Tsabary G, Shin H,
Christianson DW, Chen YH: Arginase and autoimmune
inflammation in the central nervous system. Immunol-
ogy, 2003, 110, 141–148.
61. Zhou G, Myers R, Li Y, Chen Y, Shen X, Fenyk-Melody
J, Wu M et al.: Role of AMP-activated protein kinase in
mechanism of metformin action. J Clin Invest, 2001,
108, 1167–1174.
Received:
January 10, 2010; in revised form: May 7, 2010.
848 �������������� ���� �� ����� ��� �������

![KB Id - UNT Digital Library/67531/metadc332161/... · 1-[bis(hydroxymethyl)amino]-3-tris(hydroxymethyl)propane adenosine 3',5'-monophosphate adenosine 31,5'-monophosphate dependent](https://img.pdfslide.us/doc/110x75/60bf6195247f5a484a422257/kb-id-unt-digital-library-67531metadc332161-1-bishydroxymethylamino-3-trishydroxymethylpropane.jpg)