Embed Size (px)
Citation preview

Nephrogenous Cyclic Adenosine Monophosphateas a Parathyroid Function Test
ARTHURE. BROADUS,JANE E. MAHAFFEY, FREDERIC C. BARTTER, and ROBERTM.NEER, Hypertension-Endocrine Branch, National Heart and Lung Institute,Bethesda, Maryland 20014 and Endocrine Division, Massachusetts GeneralHospital, Boston, Massachusetts 02114
A B S T RA C T Nephrogenous cyclic AMP(NcAMP),total cyclic AMPexcretion (UcAMP), and plasma im-munoreactive parathyroid hormone (iPTH), deter-mined with a multivalent antiserum, were prospec-tively measured in 55 control subjects, 57 patients withprimary hyperparathyroidism (10 HPT), and 10 patientswith chronic hypoparathyroidism.
In the group with 1° HPT, NcAMPwas elevated in52 patients (91%), and similar elevations were noted insubgroups of 26 patients with mild (serum calciumc 10.7 mg/dl) or intermittent hypercalcemia, 19 patientswith mild renal insufficiency (mean glomerular filtra-tion rate, 64 mllmin), and 10 patients with moderaterenal insufficiency (mean glomerular filtration rate,43 ml/min). Plasma iPTH was increased in 41 patients(73%).
The development of a parametric expression forUcAMPwas found to be critically important in the clin-ical interpretation of results for total cAMPexcretion.Because of renal impairment in a large number of pa-tients, the absolute excretion rate of cAMPcorrelatedpoorly with the hyperparathyroid state. Expressed as afunction of creatinine excretion, UcAMPwas elevatedin 81%of patients with 10 HPT, but the nonparametricnature of the expression led to a number of interpretivedifficulties. The expression of cAMP excretion as afunction of glomerular filtration rate was developed onthe basis of the unique features of cAMPclearance inman, and this expression, which provided elevatedvalues in 51 (89%) of the patients with 10 HPT, avoidedentirely the inadequacies of alternative expressions.
Results for NcAMPand UcAMPin nonazotemic andazotemic patients with hypoparathyroidism confirmed
An abstract of this work appeared in 1976. Clin. Res. 24: 456A.(Abstr.)
Dr. Broadus' present address is Division of Endocrinology,Department of Internal Medicine, Yale University, NewHaven, Conn. 06510.
Received for publication 20 April 1976 and in revised form13 June 1977.
the validity of the measurements and the expressionsemployed.
INTRODUCTION
The development of the immunoassay for parathyroidhormone (PTH)l in the mid-1960's (1) represented adistinct methodologic advance in the study of para-thyroid physiology and pathophysiology. However, anumber of technical and biologic difficulties, includingthe heterologous nature of the assays in current use(1, 2) and the heterogeneity of circulating forms ofhuman PTH (3-6), have combined to restrict the avail-ability and applicability of the technique. Although apartial resolution of these problems has been providedby the use of defined antisera, which recognize specificregions of the circulating peptides (2, 3, 5, 6), thereremains a need for a simple and readily standardizableparathyroid function test.
In the late 1960's, the actions of PTHwere shown tobe mediated by cyclic AMP(cAMP), and the effects ofthe hormone on the renal cortex were found to be asso-ciated with dramatic increases in the excretion of thenucleotide (7-10). Based on these findings, a number oflaboratories have attempted to use measurements ofcAMP excretion (UcAMP) diagnostically in patientswith parathyroid disease, with varying success (11-18).The fact that this analysis has not gained widespreadacceptance as a valid index of parathyroid function canbe attributed principally to three aspects of the database currently available: (a) the lack of a demonstrablyparametric expression for total cAMPexcretion, (b) thedescription of several clinical and (or) experimental cir-cumstances, including renal impairment (11, 12, 19)and high extracellular calcium concentrations (20),
1Abbreviations used in this paper: cAMP, cyclic AMP;NcAMP, nephrogenous cyclic AMP; UcAMP, cylic AMPex-cretion; GF, glomerular filtrate; GFR, glomerular filtrationrate; 10 HPT, primary hyperparathyroidism; PTH, parathyroidhormone; iPTH, immunoreactive parathyroid hormone.
The Journal of Clinical Investigation Volume 60 October 1977- 771-783 771
which might interfere with the cAMPanalyses or theirinterpretation, and (c) the alterations in plasma and (or)urinary cAMPwhich have been reported after pharma-cologic doses of a number of agents (11, 21-24) and theapparent increases in UcAMPwhich have been notedin several disorders other than primary hyperpara-thyroidism (1° HPT) (13, 25-27). Thus, there has beenreasonable doubt concerning the clinical specificity of invivo measurements of cAMP.
That these potential problems in the performanceand interpretation of clinical cAMP studies may bemore apparent than real derives from the unique as-pects of cAMP clearance and excretion in man (28).Plasma cAMPis excreted by a process of simple glomer-ular filtration, and to this filtered load of the nucleo-tide is added a quantity of cAMPformed de novo in thekidney (nephrogenous cAMP). Nephrogenous cAMP(NcAMP): (a) is the only "pool" of the nucleotide easilyquantified in vivo (28), (b) reflects almost exclusivelythe effects of circulating PTH (9, 29), and (c) appears tobe added directly to the tubular urine (9, 10), thus ac-counting for the magnitude, rapidity, and sensitivity ofthe PTH-induced changes in cAMP excretion. Al-though vasopressin also acts directly on a renal ade-nylate cyclase system (8, 30), at physiologic concen-trations it has little, if any, effect on cAMP excretion(13, 29, 31, 32). Thus, the determination of NcAMPshould provide a sensitive and specific assessment ofparathyroid function, and several recent reports sug-gest that this measurement is extremely useful in thediagnosis of 10 HPT (33-35).
This report presents the results of cAMP measure-ments and plasma immunoreactive PTH (iPTH), em-ploying a multivalent antiserum, in a prospective seriesof control subjects and patients with 10 HPT andchronic hypoparathyroidism. The general findingsindicate that NcAMPvalidly reflects parathyroid func-tion in a variety of clinical situations. In addition, ex-pressed parametrically as a function of glomerularfiltration rate (GFR), total cAMP excretion provides areadily interpretable index of parathyroid function,which should allow this simple determination to be-come a widely available, and functionally quite spe-cific, diagnostic test for 10 HPT.
METHODS
PatientsControl group. The control group included 55 individuals
with normal serum calcium and phosphorus and 24-h calciumexcretion. The group contained 30 normal volunteers and 25patients with a variety of disorders (6 patients with hyper-tension, 6 patients with osteoporosis, and 13 patients withmiscellaneous diseases). The patients were taking a wideassortment of medications. The normal subjects and patientsdid not differ significantly from each other in any of the pa-rameters measured and were considered together. The group
consisted of 32 women (age range 19-66 yr, mean 39 yr) and23 men (age range 19-63 yr, mean 35 yr).
Patients with hypoparathyroidism. 10 patients withchronic hypoparathyroidism (2 idiopathic and 8 postopera-tive) were studied. Nine of the patients were receiving long-term vitamin D and calcium supplements and were deliber-ately being maintained with a relatively low serum calcium(mean-+SD, 7.9±0.8 mg/dl). There were four women and sixmen, and the mean age was 44 yr. 9 of the 10 patients had sig-nificant medical illness other than hypoparathyroidism forwhich they were taking a variety of medications.
Patients with hyperparathyroidism. 57 patients with1° HPTwere studied. There were 35 women(age range 9-78yr, mean 51 yr) and 22 men (age range 16-74 yr, mean 46 yr).23 were patients at the National Institutes of Health, and theremaining 34 patients were at the Massachusetts GeneralHospital.
For purposes of discussion, the patients have been dividedinto two groups. 40 patients were considered to have a "defi-nite" diagnosis of 1° HPT based on one of the following cri-teria: (a) neck exploration with tissue confirmation (adenomasin 18 patients and hyperplasia in 11 patients), (b) familial hy-perparathyroidism with tissue confirmation in at least onefamily member (7 patients), or (c) significant step-up in iPTHduring neck vein catheterization (36) in a hypercalcemicpatient (4 patients). An additional 17 patients were consideredto have "clinical" diagnoses of 10 HPTbased on documentedhypercalcemia on a minimum of two determinations of serumcalcium and exclusion of other causes of hypercalcemia bythorough clinical and biochemical evaluation. 14 of these 17patients had clinical and (or) chemical histories suggestive of10 HPT of greater than 1-yr duration. Approximately one-halfof these 57 patients had significant additional medical illnessfor which they were receiving a variety of medications.
Five patients included in the "definite" subgroup of pa-tients were members of two generations of a single kindredregarded as having "familial hypocalciuric hypercalcemia"(patients 36-40, Table II). This kindred had quite severe, butrelatively asymptomatic, hypercalcemia, and a histologicallyhyperplastic gland had been removed from one of the patients.However, determinations of iPTH and NcAMP were re-peatedly normal in these 5 patients, in contrast to the frankelevations in one or both of these analyses which were notedin each of the remaining 52 patients. This kindred was in-cluded in this series because of the prospective nature of thestudy, and its members are referred to as "biochemically nor-mal" in the text below. Several patients from other kindredswith familial hyperparathyroidism were also studied (TableII) and demonstrated clearcut biochemical evidence ofdisease.
Study protocolAll patients and control subjects underwent an identical
study protocol. Urine specimens were collected over a 2-, 3-,or 4-h period between 6 a.m. and 12 noon. Midpoint bloodsamples were drawn for the analysis of plasma cAMP andiPTH and serum calcium and creatinine. Approximately 1-mlaliquots of the urine specimens were taken, and the remainingurine was pooled into an ongoing 24-h collection.
During the morning collection periods, fluid intake wasencouraged to ensure adequacy of the collections (urine flowaveraged 1.5-2 ml/min), beverages containing methyl xan-thines were excluded, and activity was limited to bed, chair,and bathroom privileges. Although the state of hydration (13,29, 31, 32) or the consumption of methyl xanthines (29, 37)do not appear to influence cAMPexcretion, physical activityhas been reported to increase plasma cAMP (25) and to have
772 A. E. Broadus, J. E. Mahaffey, F. C. Bartter, and R. M. Neer
variable effects on UcAMP (29). We examined the effectsof physical activity in six of the control subjects and foundthat mean plasma cAMPlevels rose from 16.39±0.85 nM (SEM)under basal conditions to 20.26±1.19 (SEM) after 30 min ofcasual walking (a mean increase of 24%), with a coincidentmean rise of 8% in cAMP excretion. In this series, all bloodsamples were drawn after the patients had been supine andrelaxed for a minimum of 30 min. Activity, hydration, and theconsumption of xanthine-containing beverages were notcontrolled during the 24-h collections.
Both plasma iPTH (3,38,39) and plasma and urinary cAMP(18, 29, 37) have been reported to exhibit a diurnal variation,although in each case there is disagreement as to the exactpattern and extent of variation. In 52 patients, plasma cAMPwas determined between 8 and 9 a.m. and again between11 a.m. and 12 noon. The results±SEM for these 104 plasmasamples were 15.91±0.51 and 15.55±0.47 nM, respectively.Serial clearance determinations (two or three clearance per-iods) were performed in 15 control subjects and 8 patientswith 1° HPTbetween 6 a.m. and 12 noon and the results werewithin the variability of the methodology. Finally, in a seriesof five normal subjects and two patients with 1° HPT in whomno attempt was made to control diet or activity, cAMPexcre-tion, expressed as nanomoles per 100 glomerular filtrate(GF), varied by only 10-24% from mean values in 12 sequen-tial 4-h collections.
The iPTH and cAMPdata represent the mean of multiplemeasurements in almost every patient and control subject.The control group had an average of 2.2 determinations ofiPTH and cAMPclearance per individual and 1.2 analyses of24-h cAMPexcretion per individual. The group with 10 HPThad an average of 2.3 measurements of iPTH and cAMPclear-ance and 1.8 analyses of 24-h cAMP excretion per patient.The group with hypoparathyroidism had an average of 3.0determinations of iPTH and cAMPclearance and 2.4 samplesfor 24-h cAMP excretion per patient. Blood for iPTH wasunavailable in one patient with 10 HPT, and 24-h collectionswere not obtained from five control subjects and five patientswith 10 HPT.
Collection and preparation of samplesUrinie. Urine samples were collected into 6 N HCl (1 ml/h
of collectioni), aliquoted, and frozen at -200C until analyzed.After the addition of about 1 pmol of [3H]cAMP, aliquots ofthe urine samples (containing approximately 100 pmol cAMP)were applied to 5 x 0.5-cm columns of AG1-X8 (formate form,200-400 mesh) prepared in Pasteur pipettes, washed with10 ml water, and eluted with 1.0 N formic acid. The cAMPeluates (2nd through 11th ml) were collected in glass scintilla-tion vials, lyophilized, dissolved in 1 ml water, and assayed.Recovery averaged approximately 80% (range 65-91%). Wehave retrospectively reassayed 100 nonchromatographed sam-ples from 70 patients after appropriate dilution and have foundexcellent general agreement (within 10- 15%) with the valuesfor cAMPcontent after chromatography.
Plasma. Blood samples were drawn into chilled hepa-rinized tubes for iPTH and into EDTAtubes for cAMP(vacu-tainer tube 3,200 QScontaining 15 mgof tripotassium EDTAin 0.1 ml solution). The samples were centrifuged at 1,600-2,000 g for 20 min at 4°C, and the plasma was aspirated, withparticular care to leave the buffy coat undisturbed in the cAMPsample. Plasma was stored at -20°C until analysis. Approxi-mately 1 pmol [3H]cAMP was added to 3-ml samples ofplasma (containing about 45 pmol cAMP), and the sampleswere deproteinized by the addition of 7 ml of 5.7% TCA. Theextracts were neutralized with potassium hydroxide, withbromthymol blue as an internal indicator, and applied to
7.5 x 0.8-cm columns of AG1-X8 (formate form, 200-400 mesh)prepared in disposable chromaflex columns. The columnswere washed with 10 ml water and eluted with 1.0 N formicacid, cAMPappearing in the 5th through 10th ml (insolublematerial appearing in the first 4 ml was avoided by discardingthis fraction). The eluates were collected in glass scintillationvials, lyophilized, dissolved in 500 ,ul water, and aliquots werecounted for recovery (which averaged about 60%, range53-71%). Earlier attempts to use AG50-X8 chromatographyrevealed that eluates from this resin gave a variable blank inour assay, which could contribute significant error in the assayof plasma samples.
AnalysesPlasma iPTH was measured in previously unthawed sam-
ples at the Nichols Institute for Endocrinology, San Pedro,Calif. This method (40) employs a guinea-pig anti-bovineantiserum (GP-101), bovine 1251-PTH, a standard pool of serumfrom patients with hyperparathyroidism (results expressed inequivalent units), and a second antibody for separating boundand free hormone. Antiserum GP-101 is multivalent and hasapproximately equal affinity for the amino-terminal and car-boxy-terminal sites of the human hormone.2 Samples wereassayed in triplicate, and control tubes (lacking antiserum)were run in duplicate for each unknown for detection of non-specific binding. The limits of detection (approximately25 ,uleq/ml) were reported as 10% displacement of iodinatedligand; the upper limits of normal (90 ,uleq/ml) correspondedto 25-30% displacement. With serum pools of 60, 103, and743 plieq/ml, the interassay coefficients of variation were19% (n = 20), 14% (n = 11), and 9% (n = 15), respectively.
cAMPwas measured by a modification of the protein-bind-ing assay of Gilman (41). The assay was designed to optimizecAMPmeasurement between 0.5 and 10 pmol (approximately20 and 80%displacement, respectively); about 90%saturationwas achieved by the addition of 1-1.5 pmol of [3H]cAMP.Plasma and urine samples from a given patient were alwaysassayed simultaneously. The interassay coefficient of variationfor urine specimens is 10.2% (58 assays) and for plasma sam-ples, 15.4% (24 assays).
Urinary creatinine was measured by the method of Bonsesand Taussky (42). Other routine analyses were determined bystandard techniques in the clinical chemistry laboratories ofthe Clinical Center and the Massachusetts General Hospital.
In the early phases of this study, it became clear that theserum creatinine was the least reliable of the various analysesrequired for the calculation of NcAMP(and cAMPexcretion,expressed as a function of GFR). This potential problem canbe minimized by the use of the mean of several measurementsof serum creatinine in each study.
Expression and calculation of cAMPdataNcAMPwas expressed: (a) as an absolute rate (nanomoles
per minute), (b) in relative terms, provided by the clearanceratio (cAMP:creatinine), and (c) as a function of GFR, as givenby the expression:
(UcA V) - (PcA Ccr) x 100Ccr
where C, P, U, and V represent the conventional symbols forclearance, plasma and urinary concentration, and urine flowrate; cA is cyclic AMPand cr is creatinine. The units of this
2 Nichols, A., and S. Krutzik. Unpublished observations.
Nephrogenous Cyclic AMPas a Parathyroid Function Test 773
160 r-
120k
90
60
25
0
S
>160 UB
I.r0
I
LU
nd ~ 4
HypoPT Normal HyperPT
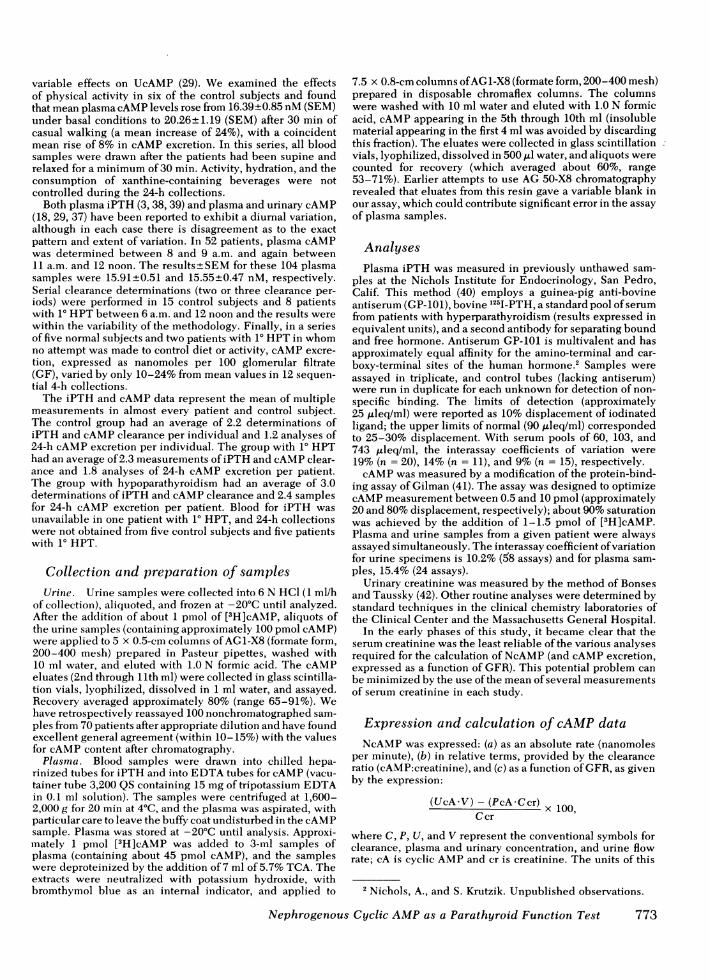
FIGURE 1 Plasma iPTH in the control subjects and in patientswith hypoparathyroidism and 1° HPT. Most points representthe mean of more than one observation (see Methods), and thehorizontal bars are the mean values for the control group andpatients with 1° HPT. The limits shown for this assay (25-90,uleq/ml) were derived from the range of observed values in150 normal subjects (40). 95% of the subjects in the controlgroup (n = 55) of this study had levels of iPTH c 90 ,uleq/ml(mean±+1.645 SD), and two subjects had undetectable (nd)levels.
expression are nmol/min per 100 ml GFR, or more correctly,nmol/100 ml GF (where GF is glomerular filtrate).
UcAMPwas expressed: (a) as a rate (nanomoles per minute,micromoles per 24 h), (b) as a function of urinary creatinine(nanomoles per milligram creatinine, micromoles per gramcreatinine) and, (c) as a function of GFR, as given by:
(UcAV)V OCcr
where the symbols and units correspond to those employedabove.
UcAMP, expressed as a function of GFR(nanomoles per100 ml GF), may be conveniently computed by the productof the serum creatinine and UcAMP(in nanomoles per milli-gram creatinine), and NcAMP(nanomoles per 100 ml GF)may be easily obtained by subtracting the plasma cAMPcon-centration (in nanomoles per deciliter) from this value; thesesimple calculations can be applied to spot sample collections.
Statistical analysisThe cAMPand iPTH analyses in the control group appeared
to be normally distributed, and these data were treated withconventional statistics. In the patients with 1° HPT, however,both parameters were positively skewed; no attempt was madeto normalize these data.
RESULTS
Plasma PTH. The results for plasma iPTH areshown in Fig. 1 and Tables I and II. In the group with10 HPT, iPTH was increased (>90 ,ueq/ml) in 41 (73%)of the 56 patients in whom it was measured. Excludingthe 5 patients who were "biochemically normal" (seeMethods), iPTH was increased in 80%of these patients.
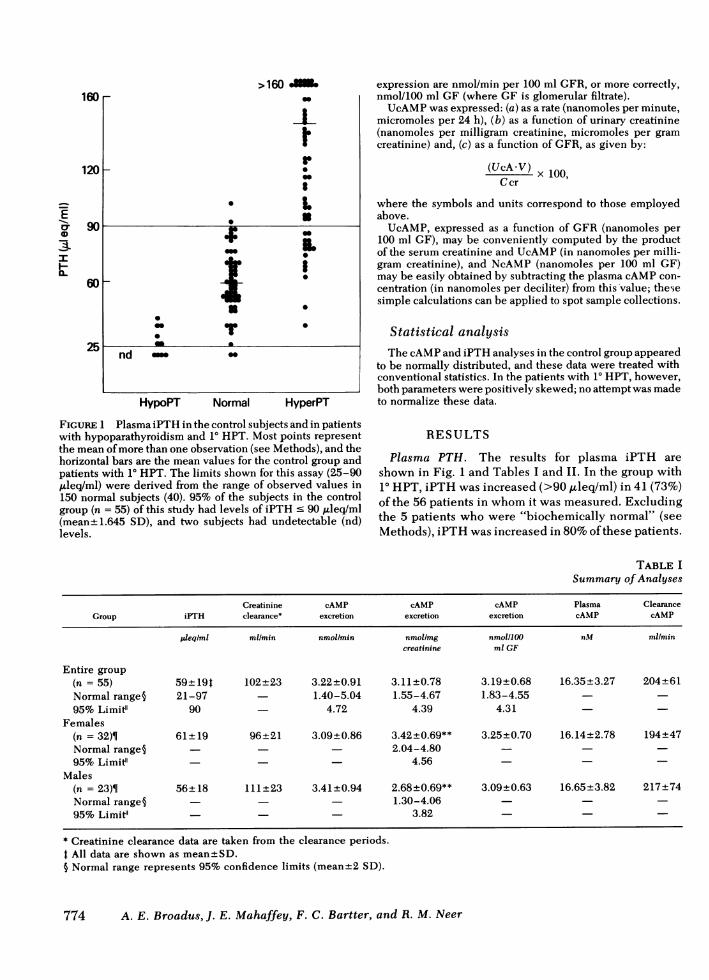
TABLE ISummary of Analyses
Creatinine cAMP cAMP cAMP Plasma ClearanceGroup iPTH clearance* excretion excretion excretion cAMP cAMP
pleqiml mlmin nmollmin nmollmg nmolIlOO nM mlmincreatinine ml GF
Entire group(n = 55) 59+191 102±23 3.22+±0.91 3.11+0.78 3.19+0.68 16.35+3.27 204+61Normal range§ 21-97 1.40-5.04 1.55-4.67 1.83-4.5595% Limit" 90 - 4.72 4.39 4.31
Females(n = 32)¶ 61+ 19 96+21 3.09+0.86 3.42+0.69** 3.25±0.70 16.14±2.78 194±47Normal range§ - 2.04-4.8095% Limifl - 4.56
Males(n = 23)¶ 56±18 111±23 3.41±0.94 2.68±0.69** 3.09±0.63 16.65±3.82 217±74Normal range§ 1.30-4.0695% Limiel 3.82
* Creatinine clearance data are taken from the clearance periods.t All data are shown as mean±SD.5 Normal range represents 95% confidence limits (mean±2 SD).
774 A. E. Broadus, J. E. Mahaffey, F. C. Bartter, and R. M. Neer
-E0r
4-
Fl-
As anticipated, 8 of the 11 patients with 10 HPT andgreater than twofold increases in iPTH also had sig-nificant azotemia (mean GFR 48 ml/min), a circum-stance in which inactive fragments of the hormone areknown to accumulate in plasma (5, 43). Immunoreac-tive PTHwas at or above the limit of detection (10% dis-placement) in six patients with hypoparathyroidism.
Nephrogenous cAMP. NcAMP values are shownin Figs. 2 and 3 and in Tables I and II, expressed: (a) inrelative terms (as the clearance ratio, cAMP:creati-nine), (b) as an absolute rate (nanomoles per minute),and (c) as a function of GFR(nanomoles per 100 ml GF).
In azotemic and nonazotemic patients with chronichypoparathyroidism, values for the clearance ratio clus-tered around unity, with a mean of 1.23±0.09 (±SD)and a range of observed values of 1.08-1.36. In the con-trol group, the mean clearance ratio was 2.01±0.43,with 95% of values falling below 2.72. The clearanceratio was greater than 2.72 in 52 of the patients with10 HPT (91% ).
19 patients with 10 HPT had coincident mild renalinsufficiency (mean GFR 64 ml/min, range 52-80ml/min), and an additional 10 patients had moderaterenal insufficiency (mean GFR43 ml/min, range 30-50ml/min). Although the absolute rate of NcAMPproduc-tion (nanomoles per minute) correlated poorly with thehyperparathyroid state in these patients (Fig. 2 andTable II), the clearance ratio was greater than 2.72 in28 of these 29 patients. Thus, there was a clear parallelbetween the decreases in cAMPclearance and creati-nine clearance in the patients with 10 HPT and renalinsufficiency (Table II) and, therefore, an almost linear
relationship between GFRand the ability to generateNcAMPin these patients (Fig. 2).
These findings indicated that NcAMPmight para-metrically be expressed as a function of GFR, and inFig. 3, NcAMPis represented as nanomoles per 100 mlGF. NcAMPwas low in the patients with chronic hypo-parathyroidism (0.40±0.20 nmol/100 ml GF, mean±SD).In the control group, NcAMPwas 1.55±0.63 nmol/100ml GF (mean±SD), with 95% of values below 2.59nmol/100 ml GF. In the group with 10 HPT, NcAMPwas greater than 2.59 nmol/100 ml GF in 52 patients(91%), and all 29 patients with 10 HPT and renal im-pairment (identified in Fig. 3) displayed abnormallyhigh values. Only the five familial patients classified as"biochemically normal" (patients 36-40, Table II)displayed normal NcAMP. Excluding patients withmoderate azotemia (GFR c 50 ml/min), there was apositive correlation (r = +0.40) between NcAMPandiPTH in the group with 10 HPT. Eight control subjectswith renal impairment (mean GFR65 ml/min, range42-80 ml/min) had slightly higher mean values foriPTH (65 ,uleq/ml) and NcAMP(1.90 nmol/100 ml GF)than the general control population.
In 26 of the 57 patients with 10 HPT, the hypercal-cemia was mild and (or) intermittent, yet the diseasein these patients was not "mild" in terms of biochemi-cal documentation; both iPTH (above 90 ,uleq/ml in84%) and NcAMP(abnormal in 100%) were elevatedin the great majority of these patients, and the biochemi-cal abnormalities in some patients were striking (TableII). There was a positive correlation between the levelof serum calcium and both iPTH (r = +0.49) and
in the Control Group
Clearance Filtered Nephrogenous Nephrogenous Creatinine cAMP cAMPratio cAMP cAMP cAMP excretion excretion excretion
cAMP: nmol/min nmollmin nmolIlOO mg/24 h panol/24 h jmolIgcreatinine ml GF creatinine
2.01±0.43 1.66±0.48 1.56±0.68 1.55±0.63 1,494±398 4.42+1.11 3.09±0.851.15-2.87 0.20-2.92 0.29-2.81 2.20-6.64 1.39-4.79
2.72 - 2.68 2.59 6.24 4.49
2.06±0.42 1.56+0.49 1.53±0.59 1.64±0.62 1,272t212** 4.27+0.94 3.39t0.74**-- - - - 1.91-4.87
4.61
1.94±0.44 1.81 ±0.43 1.59±0.79 1.42±0.62 1,766+404** 4.61±+1.27 2.70±0.82**--- - - 1.06-4.34
4.05
95% limit indicates that 95% of observations are less than this value (mean± 1.645 SD).¶ 24-h collections were obtained from 28 females and 22 males.** Significantly different (P < 0.001).
Nephrogenous Cyclic AMPas a Parathyroid Function Test 775
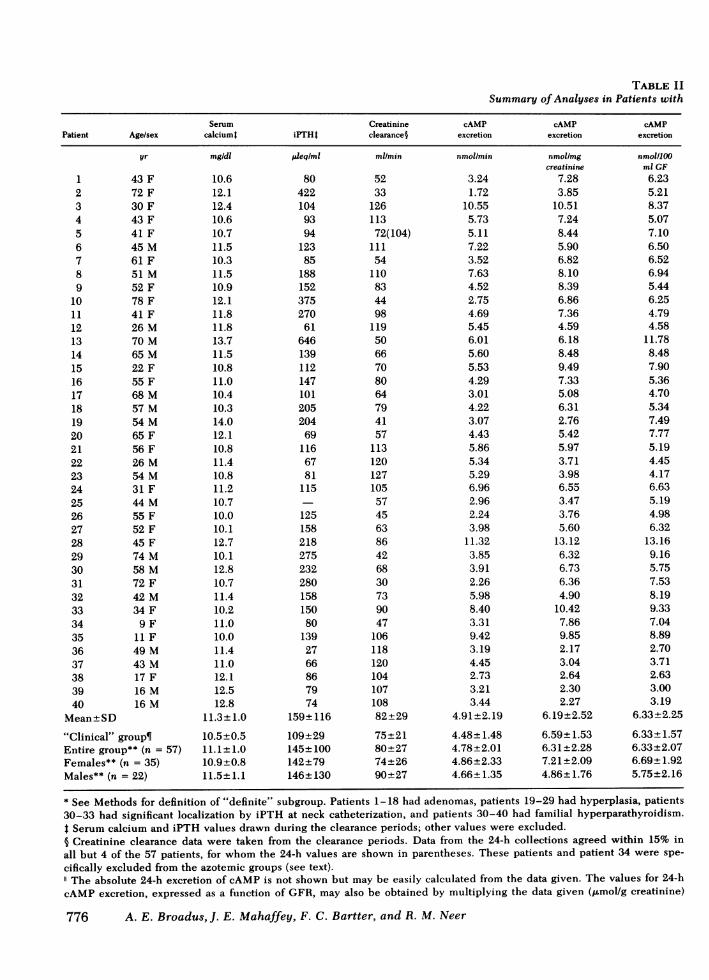
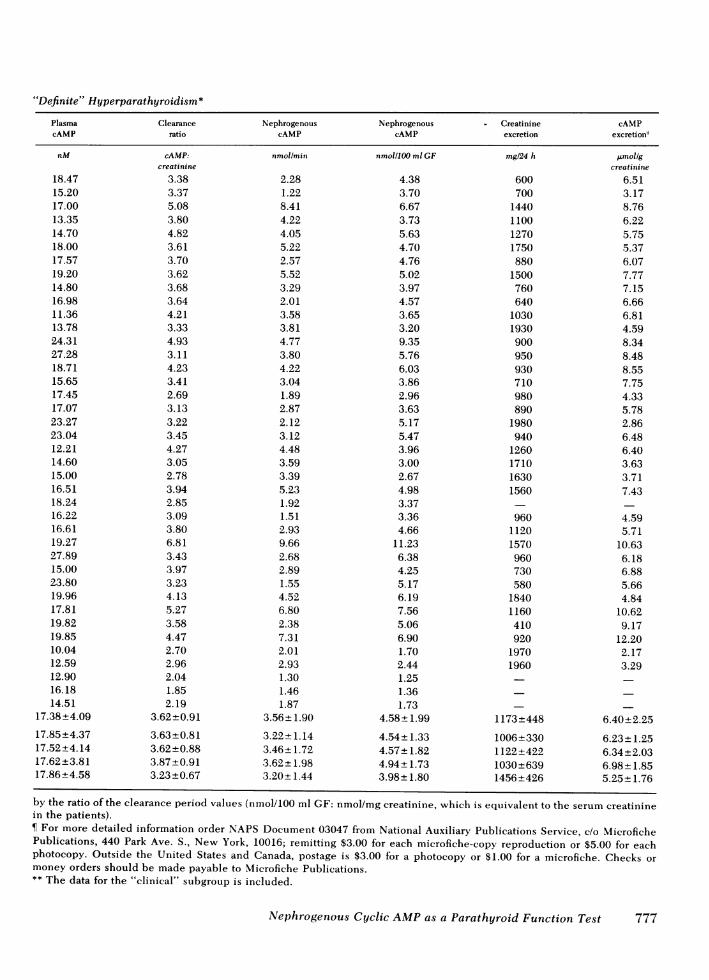
TABLE IISummary of Analyses in Patients with
Serum Creatinine cAMP cAMP cAMPPatient Age/sex calciuml iPTHI clearance§ excretion excretion excretion
1
2345
6789
10111213141516171819202122232425262728293031323334353637383940
Mean±SD
yr
43 F72 F30 F43 F41 F45 M61 F51 M52 F78 F41 F26 M70 M65 M22 F55 F68 M57 M54 M65 F56 F26 M54 M31 F44 M55 F52 F45 F74 M58 M72 F42 M34 F
9 F11 F49 M43 M17 F16 M16 M
"Clinical" group¶Entire group** (n = 57)Females** (n = 35)Males** (n = 22)
* See Methods for definition of "definite" subgroup. Patients 1-18 had adenomas, patients 19-29 had hyperplasia, patients30-33 had significant localization by iPTH at neck catheterization, and patients 30-40 had familial hyperparathyroidism.t Serum calcium and iPTH values drawn during the clearance periods; other values were excluded.§ Creatinine clearance data were taken from the clearance periods. Data from the 24-h collections agreed within 15% in
all but 4 of the 57 patients, for whom the 24-h values are shown in parentheses. These patients and patient 34 were spe-
cifically excluded from the azotemic groups (see text)."The absolute 24-h excretion of cAMP is not shown but may be easily calculated from the data given. The values for 24-h
cAMP excretion, expressed as a function of GFR, may also be obtained by multiplying the data given (jAmol/g creatinine)
776 A. E. Broadus, J. E. Mahaffey, F. C. Bartter, and R. M. Neer
mg/dl
10.612.112.410.610.711.510.311.510.912.111.811.813.711.510.811.010.410.314.012.110.811.410.811.210.710.010.112.710.112.810.711.410.211.010.011.411.012.112.512.8
11.3+ 1.0
10.5+0.511.1+ 1.010.9+0.811.5± 1.1
p/eq/ml
804221049394
12385
188152375270
61646139112147101205204
691166781
115
12515821827523228015815080
1392766867974
159+ 116
109+29145± 100142+79146±+130
ml/min
5233
126113
72(104)111
54110
834498
1195066708064794157
113120127105
57456386426830739047
10611812010410710882+29
75-+±2180±2774+2690+±27
nmollmin
3.241.72
10.555.735.117.223.527.634.522.754.695.456.015.605.534.293.014.223.074.435.865.345.296.962.962.243.98
11.323.853.912.265.988.403.319.423.194.452.733.213.44
4.91+2.194.48+1.484.78+±2.014.86+2.334.66 1.35
nmol/mgcreatinine
7.283.85
10.517.248.445.906.828.108.396.867.364.596.188.489.497.335.086.312.765.425.973.713.986.553.473.765.60
13.126.326.736.364.90
10.427.869.852.173.042.642.302.27
6.19+2.52
6.59±+1.536.31±+2.287.21 +2.094.86±+1.76
nmoi/100ml GF
6.235.218.375.077.106.506.526.945.446.254.794.58
11.788.487.905.364.705.347.497.775.194.454.176.635.194.986.32
13.169.165.757.538.199.337.048.892.703.712.633.003.19
6.33+2.25
6.33±+1.576.33+2.076.69±+1.925.75+2.16
"Definite" Hyperparathyroidism*Plasma Clearance Nephrogenous Nephrogenous - Creatinine cAMPcAMP ratio cAMP cAMP excretion excretion"
nM
18.4715.2017.0013.3514.7018.0017.5719.2014.8016.9811.3613.7824.3127.2818.7115.6517.4517.0723.2723.0412.2114.6015.0016.5118.2416.2216.6119.2727.8915.0023.8019.9617.8119.8219.8510.0412.5912.9016.1814.51
17.38+±4.0917.85±4.3717.52+±4.1417.62+±3.8117.86+4.58
cAMP:creatinine
3.383.375.083.804.823.613.703.623.683.644.213.334.933.114.233.412.693.133.223.454.273.052.783.942.853.093.806.813.433.973.234.135.273.584.472.702.962.041.852.19
3.62+±0.91
3.63+±0.813.62 +0.883.87+0.913.23±+0.67
nmol/min
2.281.228.414.224.055.222.575.523.292.013.583.814.773.804.223.041.892.872.123.124.483.593.395.231.921.512.939.662.682.891.554.526.802.387.312.012.931.301.461.87
3.56±+ 1.90
3.22±+1.143.46±+1.723.62-+ 1.983.20±+ 1.44
nmolIlOO ml GF
4.383.706.673.735.634.704.765.023.974.573.653.209.355.766.033.862.963.635.175.473.963.002.674.983.373.364.66
11.236.384.255.176.197.565.066.901.702.441.251.361.73
4.58±+ 1.99
4.54±1.334.57±+1.824.94±+ 1.733.98±+ 1.80
mgl24 h
600700
1440110012701750880
1500760640
10301930900950930710980890
1980940
1260171016301560
96011201570960730580
18401160410920
19701960
1173+448
1006+3301122±+4221030 +6391456+426
j.mol/gcreatinine
6.513.178.766.225.755.376.077.777.156.666.814.598.348.488.557.754.335.782.866.486.403.633.717.43
4.595.71
10.636.186.885.664.84
10.629.17
12.202.173.29
6.40±2.256.23±1.256.34 +2.036.98± 1.855.25± 1.76
by the ratio of the clearance period values (nmol/100 ml GF: nmol/mg creatinine, which is equivalent to the serum creatininein the patients).¶ For more detailed information order NAPS Document 03047 from National Auxiliary Publications Service, c/o MicrofichePublications, 440 Park Ave. S., New York, 10016; remitting $3.00 for each microfiche-copy reproduction or $5.00 for eachphotocopy. Outside the United States and Canada, postage is $3.00 for a photocopy or $1.00 for a microfiche. Checks ormoney orders should be made payable to Microfiche Publications.** The data for the "clinical" subgroup is included.
Nephrogenous Cyclic AMPas a Parathyroid Function Test 777
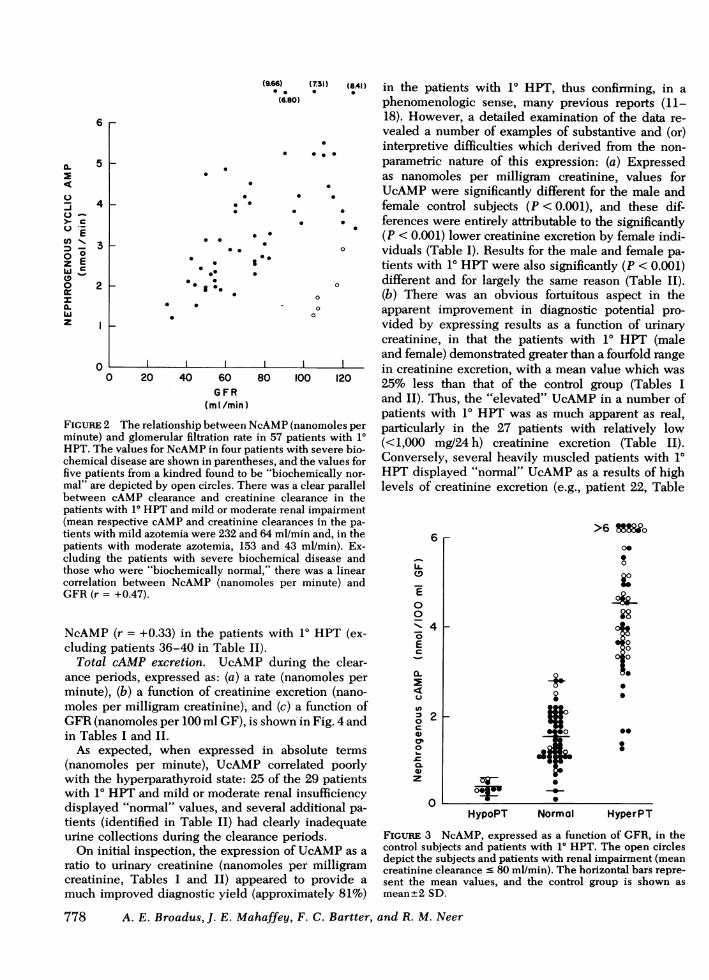
(96). (731) (8Al) in the patients with 10 HPT, thus confirming, in a(6.80) phenomenologic sense, many previous reports (11-
18). However, a detailed examination of the data re-vealed a number of examples of substantive and (or)interpretive difficulties which derived from the non-parametric nature of this expression: (a) Expressedas nanomoles per milligram creatinine, values for
. . *. UcAMPwere significantly different for the male and- * . . female control subjects (P < 0.001), and these dif-
* . ferences were entirely attributable to the significantly. * (P < 0.001) lower creatinine excretion by female indi-
* * 0 viduals (Table I). Results for the male and female pa-0 1 tients with 10 HPTwere also significantly (P < 0.001)
.. * 0 different and for largely the same reason (Table II).0 (b) There was an obvious fortuitous aspect in the
* * o0 apparent improvement in diagnostic potential pro-vided by expressing results as a function of urinarycreatinine, in that the patients with 10 HPT (maleand female) demonstrated greater than a fourfold range
| in creatinine excretion, with a mean value which was20 40 60 80 100 120 25% less than that of the control group (Tables I
(ml/min) and II). Thus, the "elevated" UcAMPin a number ofpatients with 10 HPT was as much apparent as real,
The relationship between NcAMP(nanomoles per particularly in the 27 patients with relatively lowand glomerular filtration rate in 57 patients with 10 (<1,000mg°24 h) creatinine excretion (Table II).te values for NcAMPin four patients with severe bio- (<1X000 mg/24 heavly edpte nts(Th IIdisease are shown in parentheses, and the values for Conversely, several heavily muscled patients with 10
Lnts from a kindred found to be "biochemically nor- HPT displayed "normal" UcAMPas a results of highdepicted by open circles. There was a clear parallel levels of creatinine excretion (e.g., patient 22, Table
between cAMP clearance and creatinine clearance in thepatients with 10 HPTand mild or moderate renal impairment(mean respective cAMPand creatinine clearances in the pa-
tients with mild azotemia were 232 and 64 ml/min and, in thepatients with moderate azotemia, 153 and 43 ml/min). Ex-cluding the patients with severe biochemical disease andthose who were "biochemically normal," there was a linearcorrelation between NcAMP (nanomoles per minute) andGFR(r = +0.47).
NcAMP(r = +0.33) in the patients with 10 HPT (ex-cluding patients 36-40 in Table II).
Total cAMP excretion. UcAMPduring the clear-ance periods, expressed as: (a) a rate (nanomoles perminute), (b) a function of creatinine excretion (nano-moles per milligram creatinine), and (c) a function ofGFR(nanomoles per 100 ml GF), is shown in Fig. 4 andin Tables I and II.
As expected, when expressed in absolute terms(nanomoles per minute), UcAMP correlated poorlywith the hyperparathyroid state: 25 of the 29 patientswith 10 HPTand mild or moderate renal insufficiencydisplayed "normal" values, and several additional pa-tients (identified in Table II) had clearly inadequateurine collections during the clearance periods.
On initial inspection, the expression of UcAMPas a
ratio to urinary creatinine (nanomoles per milligramcreatinine, Tables I and II) appeared to provide a
much improved diagnostic yield (approximately 81%)
778 A. E. Broadus, J. E. Mahaffey, F. C. Bartter,
(9
0
0
475Ec
20
0
0_
w
0
q)z
0
_-0
S
42
La.
>6 t8'o
0000
C
0
0
0
HypoPT Normnal HyperPT
FIGURE 3 NcAMP, expressed as a function of GFR, in thecontrol subjects and patients with 1° HPT. The open circlesdepict the subjects and patients with renal impairment (meancreatinine clearance c 80 ml/min). The horizontal bars repre-sent the mean values, and the control group is shown asmean±2 SD.
, and R. M. Neer
6
5
4
3
2
a.
4
-
> ^C.)
z EgM'o0
0~ir
wz
0
FIGuRE 2minute);HPT. Thchemicalfive patiemal" are
6 r-
8r-
6+
41-
21-
0
4-I
I-
0I
3
HypoPT Normal
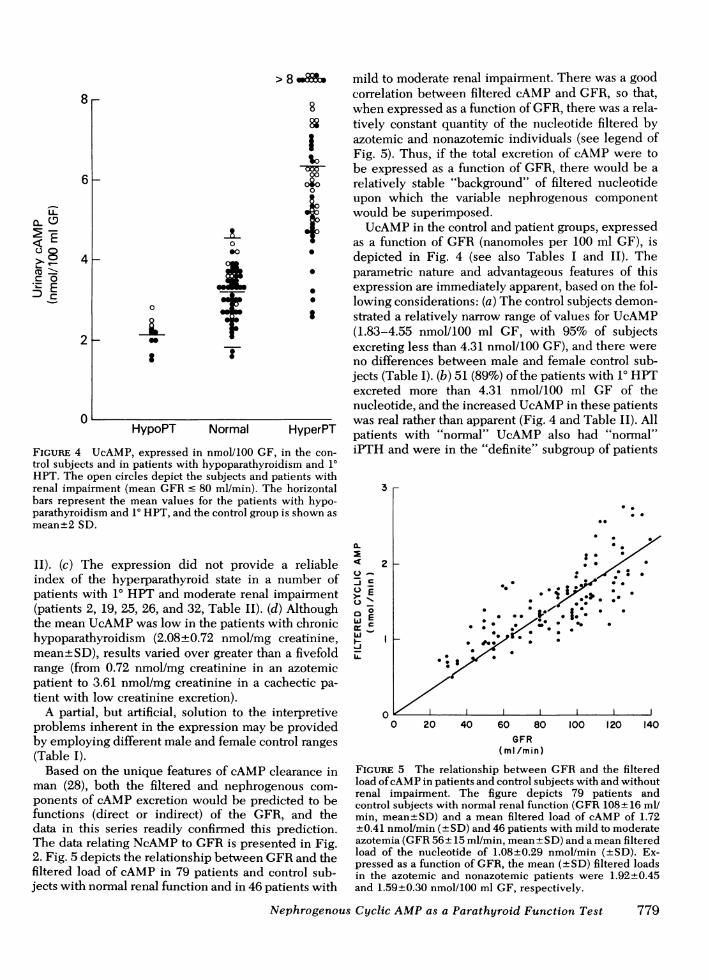
FIGURE 4 UcAMP, expressed in nmol/100 GFtrol subjects and in patients with hypoparathyroHPT. The open circles depict the subjects and Irenal impairment (mean GFRc 80 ml/min). TIbars represent the mean values for the patient,parathyroidism and 10 HPT, and the control groulmean+2 SD.
II). (c) The expression did not provideindex of the hyperparathyroid state in apatients with 10 HPT and moderate renal(patients 2, 19, 25, 26, and 32, Table II). (cthe mean UcAMPwas low in the patients vhypoparathyroidism (2.08±0.72 nmol/mgmean±SD), results varied over greater tharange (from 0.72 nmol/mg creatinine in apatient to 3.61 nmol/mg creatinine in a cotient with low creatinine excretion).
A partial, but artificial, solution to the iproblems inherent in the expression may Iby employing different male and female co](Table I).
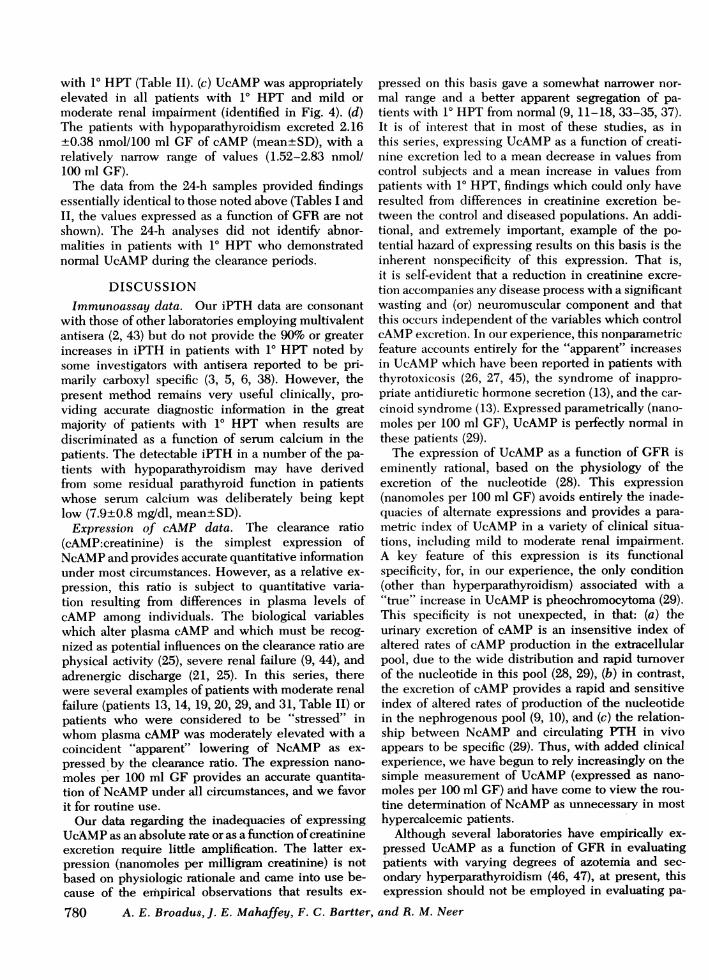
Based on the unique features of cAMPcman (28), both the filtered and nephrogponents of cAMPexcretion would be precfunctions (direct or indirect) of the GF:data in this series readily confirmed thisThe data relating NcAMPto GFRis presei2. Fig. 5 depicts the relationship between Cfiltered load of cAMP in 79 patients and cjects with normal renal function and in 46 p;
> 8 mild to moderate renal impairment. There was a goodcorrelation between filtered cAMPand GFR, so that,
8 when expressed as a function of GFR, there was a rela-88 tively constant quantity of the nucleotide filtered by
azotemic and nonazotemic individuals (see legend of% Fig. 5). Thus, if the total excretion of cAMPwere to
ooo be expressed as a function of GFR, there would be aoro relatively stable "background" of filtered nucleotidet upon which the variable nephrogenous component
would be superimposed.UcAMPin the control and patient groups, expressed
as a function of GFR (nanomoles per 100 ml GF), is* depicted in Fig. 4 (see also Tables I and II). The* parametric nature and advantageous features of this* expression are immediately apparent, based on the fol-* lowing considerations: (a) The control subjects demon-* strated a relatively narrow range of values for UcAMP
(1.83-4.55 nmol/100 ml GF, with 95% of subjectsexcreting less than 4.31 nmol/100 GF), and there wereno differences between male and female control sub-jects (Table I). (b) 51 (89%) of the patients with 1° HPTexcreted more than 4.31 nmol/100 ml GF of thenucleotide, and the increased UcAMPin these patientswas real rather than apparent (Fig. 4 and Table II). All
HyperPT patients with "normal" UcAMP also had "normal",in the con- iPTH and were in the "definite" subgroup of patientsidism and 10patients withie horizontal 3s with hypo-p is shown as . .
*-
a reliable 2 2 Lnumber of 00. . .ct .:.
impairment >.. * . .d) Although 0 * S'l,* *0* .
vith chronic ui _ %
creatinine, . _ ,* .Ln a fivefold .- .in azotemicichectic pa-
interpretive:e providedntrol ranges
dIearance inenous com-licted to beR, and theprediction.
nted in Fig.'FR and theontrol sub-atients with
0 20 40 60 80 100 120 140GFR
(ml/min)
FIGURE 5 The relationship between GFRand the filteredload of cAMPin patients and control subjects with and withoutrenal impairment. The figure depicts 79 patients andcontrol subjects with normal renal function (GFR 108+16 ml/min, mean+SD) and a mean filtered load of cAMP of 1.72+0.41 nmol/min (±SD) and 46 patients with mild to moderateazotemia (GFR 56+15 ml/min, mean+SD) and a mean filteredload of the nucleotide of 1.08+0.29 nmol/min (+SD). Ex-pressed as a function of GFR, the mean (±SD) filtered loadsin the azotemic and nonazotemic patients were 1.92±0.45and 1.59+0.30 nmol/100 ml GF, respectively.
Nephrogenous Cyclic AMPas a Parathyroid Function Test 779
with 10 HPT (Table II). (c) UcAMPwas appropriatelyelevated in all patients with 10 HPT and mild ormoderate renal impairment (identified in Fig. 4). (d)The patients with hypoparathyroidism excreted 2.16+0.38 nmol/100 ml GF of cAMP (mean+SD), with arelatively narrow range of values (1.52-2.83 nmol/100 ml GF).
The data from the 24-h samples provided findingsessentially identical to those noted above (Tables I andII, the values expressed as a function of GFRare notshown). The 24-h analyses did not identify abnor-malities in patients with 1° HPT who demonstratednormal UcAMPduring the clearance periods.
DISCUSSIONImmunoassay data. Our iPTH data are consonant
with those of other laboratories employing multivalentantisera (2, 43) but do not provide the 90% or greaterincreases in iPTH in patients with 10 HPT noted bysome investigators with antisera reported to be pri-marily carboxyl specific (3, 5, 6, 38). However, thepresent method remains very useful clinically, pro-viding accurate diagnostic information in the greatmajority of patients with 10 HPT when results arediscriminated as a function of serum calcium in thepatients. The detectable iPTH in a number of the pa-tients with hypoparathyroidism may have derivedfrom some residual parathyroid function in patientswhose serum calcium was deliberately being keptlow (7.9±0.8 mg/dl, mean±SD).
Expression of cAMP data. The clearance ratio(cAMP:creatinine) is the simplest expression ofNcAMPand provides accurate quantitative informationunder most circumstances. However, as a relative ex-pression, this ratio is subject to quantitative varia-tion resulting from differences in plasma levels ofcAMP among individuals. The biological variableswhich alter plasma cAMP and which must be recog-nized as potential influences on the clearance ratio arephysical activity (25), severe renal failure (9, 44), andadrenergic discharge (21, 25). In this series, therewere several examples of patients with moderate renalfailure (patients 13, 14, 19, 20, 29, and 31, Table II) orpatients who were considered to be "stressed" inwhom plasma cAMPwas moderately elevated with acoincident "apparent" lowering of NcAMP as ex-pressed by the clearance ratio. The expression nano-moles per 100 ml GF provides an accurate quantita-tion of NcAMPunder all circumstances, and we favorit for routine use.
Our data regarding the inadequacies of expressingUcAMPas an absolute rate or as a function of creatinineexcretion require little amplification. The latter ex-pression (nanomoles per milligram creatinine) is notbased on physiologic rationale and came into use be-cause of the empirical observations that results ex-
pressed on this basis gave a somewhat narrower nor-mal range and a better apparent segregation of pa-tients with 1° HPT from normal (9, 11-18, 33-35, 37).It is of interest that in most of these studies, as inthis series, expressing UcAMPas a function of creati-nine excretion led to a mean decrease in values fromcontrol subjects and a mean increase in values frompatients with 10 HPT, findings which could only haveresulted from differences in creatinine excretion be-tween the control and diseased populations. An addi-tional, and extremely important, example of the po-tential hazard of expressing results on this basis is theinherent nonspecificity of this expression. That is,it is self-evident that a reduction in creatinine excre-tion accompanies any disease process with a significantwasting and (or) neuromuscular component and thatthis occurs independent of the variables which controlcAMPexcretion. In our experience, this nonparametricfeature accounts entirely for the "apparent" increasesin UcAMPwhich have been reported in patients withthyrotoxicosis (26, 27, 45), the syndrome of inappro-priate antidiuretic hormone secretion (13), and the car-cinoid syndrome (13). Expressed parametrically (nano-moles per 100 ml GF), UcAMPis perfectly normal inthese patients (29).
The expression of UcAMPas a function of GFR iseminently rational, based on the physiology of theexcretion of the nucleotide (28). This expression(nanomoles per 100 ml GF) avoids entirely the inade-quacies of alternate expressions and provides a para-metric index of UcAMPin a variety of clinical situa-tions, including mild to moderate renal impairment.A key feature of this expression is its functionalspecificity, for, in our experience, the only condition(other than hyperparathyroidism) associated with a"true" increase in UcAMPis pheochromocytoma (29).This specificity is not unexpected, in that: (a) theurinary excretion of cAMP is an insensitive index ofaltered rates of cAMPproduction in the extracellularpool, due to the wide distribution and rapid tumoverof the nucleotide in this pool (28, 29), (b) in contrast,the excretion of cAMPprovides a rapid and sensitiveindex of altered rates of production of the nucleotidein the nephrogenous pool (9, 10), and (c) the relation-ship between NcAMPand circulating PTH in vivoappears to be specific (29). Thus, with added clinicalexperience, we have begun to rely increasingly on thesimple measurement of UcAMP(expressed as nano-moles per 100 ml GF) aiAd have come to view the rou-tine determination of NcAMPas unnecessary in mosthypercalcemic patients.
Although several laboratories have empirically ex-pressed UcAMPas a function of GFR in evaluatingpatients with varying degrees of azotemia and sec-ondary hyperparathyroidism (46, 47), at present, thisexpression should not be employed in evaluating pa-
780 A. E. Broadus, J. E. Mahaffey, F. C. Bartter, and R. M. Neer

tients with a GFRless than approximately 20 ml/min.Plasma cAMPis increased in moderate to severe renalfailure (9, 44), so that, expressed as a function ofGFR, the filtered load of the nucleotide is relativelyincreased in this setting. The influence of this phe-nomenon on results of total cAMPexcretion, expressedon a GFR basis, was quantitatively rather insignifi-cant over the range of renal function encounteredat this series (i.e., a disproportionate increase approxi-mating 10% in the total excretion of the nucleotidewas noted in the azotemic patients in this study, seeTable II and Fig. 5). However, this potential problemclearly becomes significant at levels of GFR in therange of 10 ml/min, and this important area requiresmore detailed investigation.
For the sake of brevity and because the collectionswere less well controlled, the results of the 24-h cAMPanalyses were not emphasized in this series. However,these results were virtually superimposable with thoseobtained during the clearance periods (see Tables Iand II), and the determination of the 24-h excretion ofcAMPmay be preferable for some laboratories and(or)under certain clinical or experimental conditions. Inaddition, although modest physical activity has a slightbut significant influence on plasma cAMP concentra-tions, such activity has a minimal influence in theresults of total UcAMPand does not appear to requirecontrol for routine clinical interpretation of theseresults.
Clinical spectrum of parathyroid disease. Thelarge prospective experience with 10 HPTprovided bythis series encompassed the entire clinical spectrum ofthe disease and was essential in evaluating the sig-nificance of several potential problems which mightinterfere with the cAMPanalyses on their interpreta-tion. First, with regard to the conflicting reports con-cerning posssible direct inhibitory effects of high extra-cellular calcium concentrations on the activity of thePTH-sensitive renal adenylate cyclase system (20, 48,49), it was of interest that there was a positive, ratherthan a negative, correlation between serum calciumand NcAMPin the patients with 10 HPT. Second, ourdata confirmed the previously reported low UcAMPand reduced cAMP response capacity (to endogenousPTH) in patients with renal impair-ment (11. 12, 19); yetthe parametric expression of both NcAMPand UcAMPas a function of GFRprovided an excellent index ofparathyroid status over the range of GFRencounteredin this series. Finally, other clinical variables (e.g.,diurnal changes, medications, etc.) did not appear toexert a discernible influence on the cAMPresults.
The inclusion in this series of the kindred which was"biochemically normal" could be questioned, and theresults in these five patients clearly influenced the ap-parent diagnostic potential of the various parameterswhich were compared. However, these patients ful-
filled one set of criteria in a prospective study andcould not, therefore, be excluded. This kindred hasbeen reported separately as an example of "familialhypocalciuric hypercalcemia" (50) and represents an asyet undefined variant of hypercalcemia and(or) hyper-parathyroidism similar to that of another kindred re-ported in the literature (51). The other patients in thisseries with familial hyperparathyroidism or multipleendocrine neoplasia (types I and II) were clearlybiochemically abnormal (patients 25, 28, 34, and 35,Table II).
In addition to the hyperparathyroid patients in-cluded in this series, we have studied several patientssuspected of having hypoparathyroidism on the basisof modest depressions in serum calcium and elevationsin serum phosphorous. As might be anticipated, meas-urements of NcAMPin these patients overlapped withthe low-normal range (i.e., values up to 1 nmol/100ml GF were seen).
In five patients with nonparathyroid hypercalcemia,NcAMPaveraged 0.26 nmol/100 ml GF (range: non-detectable to 0.40 nmol/100 ml GF), and plasma iPTHaveraged 31 ,uleq/ml (range: nondetectable to 56/Aleq/ml). In three patients with apparent "ectopichyperparathyroidism", NcAMPaveraged 4.57 nmol/100 ml GF (range: 3.97 to 5.32 nmol/100 ml GF), andplasma iPTH averaged 51 ,uleq/ml (range: 49 to 52,uleq/ml).
ACKNOWLEDGMENTSWe are indebted to Mrs. Fredette West and Mrs. BelleRuskin for expert technical assistance, to the nurses andstaff of the metabolic wards at the Clinical Center and Massa-chusetts General Hospital, and to Doctors A. M. Spiegel andG. D. Aurbach for providing samples from several patients.
REFERENCES
1. Berson, S. A., R. S. Yalow, G. D. Aurbach, and J. T. Potts.1963. Immunoassay of bovine and human parathyroid hor-mones. Proc. Natl. Acad. Sci. U. S. A. 49: 613-617.
2. Potts, J. T., Jr., T. M. Murray, M. Peacock, H. D. Niall,G. W. Tregear, H. T. Keutmann, D. Powell, and L. J.Deftos. 1971. Parathyroid hormone: sequence, synthesis,immunoassay studies. Am. J. Med. 50: 639-649.
3. Reiss, E., and J. Canterbury. 1974. Emerging conceptsof the nature of circulating parathyroid hormones:implications for clinical research. Recent Prog. Horm. Res.30: 391-429.
4. Segre, G. V., J. F. Habener, D. Powell, G. W. Tregear, andJ. T. Potts, Jr. 1972. Parathyroid hormone in humanplasma: immunochemical characterization and biologicalimplications. J. Clin. Invest. 51: 3163-3172.
5. Silverman, R., and R. S. Yalow. 1973. Heterogeneity ofparathyroid hormone. J. Clin. Invest. 52: 1958-1971.
6. Arnaud, C. D., R. S. Goldsmith, P. J. Bordier, G. W.Sizemore, J. A. Larsen, and J. Gilkinson. 1974. Influenceof immunoheterogeneity of circulating parathyroid hor-mone on results of radioimmunoassays of serum in man.Am. J. Med. 56: 785-793.
Nephrogenous Cyclic AMPas a Parathyroid Function Test 781
7. Chase, L. R., and G. D. Aurbach. 1967. Parathyroid func-tion and the renal excretion of 3',5'-adenylic acid. Proc.Natl. Acad. Sci. U. S. A. 58: 518-525.
8. Chase, L. R., and G. D. Aurbach. 1968. Renal adenylcyclase: anatomically separate sites for parathyroid hor-mone and vasopressin. Science (Wash. D. C.). 159:545-547.
9. Kaminsky, N. I., A. E. Broadus, J. G. Hardman, D. J.Jones, Jr., J. H. Ball, E. W. Sutherland, and G. W. Liddle.1970. Effects of parathyroid hormone on plasma and uri-nary adenosine 3',5'-monophosphate in man. J. Clin.Invest. 49: 2387-2395.
10. Scurry, M. T., and G. L. Pauk. 1974. Renal tubularlocalization of parathyroid hormone induced urinarycyclic adenosine 3',5'-monophosphate. Acta Endocrinol.77: 282-286.
11. Taylor, A. L., B. B. Davis, L. G. Pawlson, J. B. Josimovich,and H. D. Mintz. 1970. Factors influencing the urinaryexcretion of 3',5'-adenosine monophosphate in humans.
J. Clin. Endocrinol. Metab. 30: 316-324.12. Dohan, P. H., K. Yamashita, P. R. Larsen, B. Davis, L.
Deftos, and J. B. Field. 1972. Evaluation of urinary cyclic3',5'-adenosine monophosphate excretion in the dif-ferential diagnosis of hypercalcemia.J. Clin. Endocrinol.Metab. 35: 775-784.
13. Murad, F. 1973. Clinical studies and applications of cyclicnucleotides. Adv. Cyclic Nucleotide Res. 3: 355-383.
14. Neelon, F. A., M. Drezner, B. M. Birch, and H. E. Lebo-vitz. 1973. Urinary cyclic adenosine monophosphate asan aid in the diagnosis of hyperparathyroidism. Lancet.I: 631-634.
15. Mallette, L. E., J. P. Bilezikian, D. A. Heath, and G. D.Aurbach. 1974. Primary hyperparathyroidism: clinicaland biochemical features. Medicine (Baltimore). 53:127-146.
16. Debacker, M., T. Manderlier, N. Nijs-Dewolf, R. Six, andJ. Corvilain. 1974. Urinary cyclic AMPas an aid in thedifferential diagnosis of hypercalcemia. Biomedicine(Paris). 21: 338-341.
17. Pak, C. Y. C., R. Kaplan, H. Bone, J. Townsend, and 0.Waters. 1975. A simple test for the diagnosis of absorptive,resorptive and renal hypercalciurias. N. Engl. J. Med.292: 497-500.
18. Shaw, J. W., S. B. Oldham, L. Rosoff, J. E. Bethune, andM. P. Fichman. 1977. Urinary cyclic AMPanalyzed as afunction of serum calcium and parathyroid hormone inthe differential diagnosis of hypercalcemia. J. Clin.Invest. 59: 14-21.
19. Lilienfeld-Toal, H. v., R. D. Desch, M. Hufner, and C.McIntosh. 1974. Excretion of cyclic 3'5'-adenosinemonophosphate in renal insufficiency and primary hyper-parathyroidism after stimulation with parathyroid hor-mone. Horm. Metab. Res. 6: 314-318.
20. Beck, N., H. Singh, S. W. Reed, and B. B. Davis. 1974.Direct inhibitory effect of hypercalcemia on renal actionsof parathyroid hormone. J. Clin. Invest. 53: 717-725.
21. Ball, J. H., N. I. Kaminsky, J. G. Hardman, A. E. Broadus,E. W. Sutherland, and G. W. Liddle. 1972. Effects ofcatecholamines and adrenergic-blocking agents onplasma and urinary cyclic nucleotides in man. J. Clin.Invest. 51:2124-2129.
22. Broadus, A. E., N. I. Kaminsky, R. C. Northcutt, J. G. Hard-man, E. W. Sutherland, and G. W. Liddle. 1970. Effectsof glucagon on adenosine 3',5'-monophosphate andguanosine 3',5'-monophosphate in human plasma andurine. J. Clin. Invest. 49: 2237-2245.
23. Fichman, M. P., and G. Brooker. 1972. Deficient renalcyclic adenosine 3',5'-monophosphate production in
nephrogenic diabetes insipidus. J. Clin. Endocrinol.Metab. 35: 35-47.
24. Bell, N. H., C. M. Clark, Jr., S. Avery, T. Sinha, C. W.Trystad, and D. 0. Allen. 1974. Demonstration of a defectin the formation of adenosine 3',5'-monophosphate invasopressin-resistant diabetes insipidus. Pediatr. Res. 8:223-230.
25. Hamet, P., 0. Kuchel, J. Fraysse, and J. Genest. 1974.Plasma adenosine 3',5'-cyclic monophosphate inhuman hypertension. Can. Med. Assoc. J. 111: 323-328.
26. Lin, T., L. E. Koop, and J. R. Tucci. 1973. Urinary excre-tion of cyclic 3',5'-adenosine monophosphate in hyper-thyroidism. J. Clin. Endocrinol. Metab. 36: 1033-1036.
27. Carter, D. J., and D. A. Heath. 1974. Urinary cyclic AMPexcretion in thyroid disease. Clin. Sci. Mol. Med. 47:19-20P.
28. Broadus, A. E., N. I. Kaminsky, J. G. Hardman, E. W.Sutherland, and G. W. Liddle. 1970. Kinetic parametersand renal clearances of plasma adenosine 3',5'-mono-phosphate and guanosine 3',5'-monophosphate in man.
J. Clin. Invest. 49: 2222-2236.29. Broadus, A. E. 1977. Clinical cyclic nucleotide research.
Adv. Cyclic Nucleotide Res. In press.30. Orloff, J., and J. S. Handler. 1964. The cellular mode
of action of antidiuretic hormone. Am. J. Med. 36:686-697.
31. Butlen, D., and S. Jard. 1972. Renal handling of 3',5'-cyclic AMPin the rat. Pflugers Arch. Eur. J. Physiol.331: 172-190.
32. Hardman, J. G., J. W. Davis, and E. W. Sutherland. 1969.Effects of some hormones and other factors on the excre-tion of guanosine 3',5'-monophosphate and adenosine3',5'-monophosphate in rat urine. J. Biol. Chem. 244:6354-6362.
33. Schmidt-Gayk, H., and H. D. Roher. 1973. Urinary excre-tion of cyclic adenosine monophosphate in the detectionand diagnosis of primary hyperparathyroidism. Surg.Gynecol. Obst. 137: 439-444.
34. Babka, J. C., R. H. Bower, and J. Sode. 1976. Nephro-genous cyclic AMP levels in primary hyperparathy-roidism. Arch. Intern. Med. 136: 1140-1144.
35. Drezner, M. K., F. A. Neelon, H. B. Curtis, and H. E.Lebovitz. 1976. Renal cyclic adenosine monophosphate:an accurate index of parathyroid function. Metab. Clin.Exp. 25: 1103-1112.
36. Bilezikian, J. P., J. L. Doppman, P. M. Shimkin, D. Powell,S. A. Wells, D. A. Heath, A. S. Ketcham, J. Monchik, L. E.Mallette, J. T. Potts, Jr., and G. D. Aurbach. 1973. Pre-operative localization of abnormal parathyroid tissue. Am.
J. Med. 55: 505-514.37. Murad, F., and C. Y. C. Pak. 1972. Urinary excretion of
adenosine 3',5'-monophosphate and guanosine 3',5'-monophosphate. N. Engl. J. Med. 286: 1382-1387.
38. Arnaud, C. D., H. S. Tsao, and T. Littledike. 1971. Radio-immunoassay of human parathyroid hormone in serum.
J. Clin. Invest. 50: 21-34.39. Sinha, T. K., S. Miller, J. Fleming, R. Khairi, J. Edmond-
son, C. C. Johnston, Jr., and N, B. Ball. 1975. Demonstra-tion of a diurnal variation in serum parathyroid hormonein primary and secondary hyperparathyroidism. J. Clin.Endocrinol. Metab. 41: 1009-1013.
40. Potts, J. T., Jr., and S. R. Krutzik. 1975. Parathyroid hor-mone radioimmunoassay: clinical applications. InNichols Institute Radioimmunoassay Manual. 3rd edition.1-18.
41. Gilman, A. G. 1970. A protein binding assay for adenosine3':5'-cyclic monophosphate. Proc. Natl. Acad. Sci. U. S. A.67: 305-312.
782 A. E. Broadus, J. E. Mahaffey, F. C. Bartter, and R. M. Neer
42. Bonses, R. W., and H. H. Taussky. 1945. On the colori-metric determination of creatinine by the Jaffe reaction.
J. Biol. Chem. 158: 581-591.43. Berson, S. A., and R. S. Yalow. 1966. Parathyroid hor-
mone in plasma in adenomatous hyperparathyroidism,uremia and bronchiogenic carcinoma. Science (Wash.D. C.). 154: 907-909.
44. Hamet, P., D. A. Stouder, and H. E. Ginn, J. G. Hardman,and G. W. Liddle. 1975. Studies of the elevated extra-cellular concentration of cyclic AMP in uremic man.
J. Clin. Invest. 56: 339-345.45. Guttler, R. B., J. W. Shaw, C. L. Otix, and J. T. Nicoloff.
1975. Epinephrine-induced alterations in urinary cyclicAMPin hyper- and hypothyroidism. J. Clin. Endocrinol.Metab. 41: 707-711.
46. Schmidt- Gayk, H., H. Seitz, R. Stengel, and J. Bommer.1974. Secondary hyperparathyroidism: renal excretion ofcyclic AMP. Verh. Dtsch. Ges. Inn. Med. 30: 1371-1374.
47. Llach, F., S. G. Massry, F. R. Singer, K. Kurokawa, J. H.Kaye, and J. W. Coburn. 1975. Skeletal resistance toendogenous parathyroid hormone in patients with earlyrenal failure. A possible cause for secondary hyperpara-thyroidism. J. Clin. Endocrinol. Metab. 41: 339-345.
48. Streeto, J. M. 1969. Renal cortical adenyl cyclase: effect ofparathyroid hormone and calcium. Metab. Clin. Exp. 18:968-973.
49. Popovtzer, M. M., J. B. Robinette, K. M. McDonald, andC. K. Kuruvila. 1975. Effect of calcium on renal handlingof phosphate: evidence for two reabsorptive mecha-nisms. Am. J. Physiol. 229: 901-906.
50. Marx, S. J., A. M. Spiegel, E. M. Brown, and G. D.Aurbach. 1977. Family studies in patients with primaryparathyroid hyperplasia. Am. J. Med. 62: 698-706.
51. Foley, T. P., Jr., H. C. Harrison, C. D. Arnaud, and H. E.Harrison. 1972. Familial benign hypercalcemia. J.Pediatr. 81: 1060-1067.
Nephrogenous Cyclic AMPas a Parathyroid Function Test 783