Embed Size (px)
Citation preview
Metformin and phenformin deplete tricarboxylic acidcycle and glycolytic intermediates during celltransformation and NTPs in cancer stem cellsAndreas Janzera,1, Natalie J. Germanb,1, Karina N. Gonzalez-Herrerab, John M. Asarac, Marcia C. Haigisb,and Kevin Struhla,2
Departments of aBiological Chemistry and Molecular Pharmacology and bCell Biology, Harvard Medical School, Boston, MA 02115; and cDivision of SignalTransduction, Department of Medicine, Beth Israel Deaconess Medical Center, Boston, MA 02215
Contributed by Kevin Struhl, May 28, 2014 (sent for review March 25, 2014)
Metformin, a first-line diabetes drug linked to cancer prevention inretrospective clinical analyses, inhibits cellular transformation andselectively kills breast cancer stem cells (CSCs). Although a fewmetabolic effects of metformin and the related biguanide phen-formin have been investigated in established cancer cell lines,the global metabolic impact of biguanides during the process ofneoplastic transformation and in CSCs is unknown. Here, we useLC/MS/MS metabolomics (>200 metabolites) to assess metabolicchanges induced by metformin and phenformin in an Src-induciblemodel of cellular transformation and in mammosphere-derivedbreast CSCs. Although phenformin is the more potent biguanidein both systems, the metabolic profiles of these drugs are remark-ably similar, although not identical. During the process of cellulartransformation, biguanide treatment prevents the boost in gly-colytic intermediates at a specific stage of the pathway andcoordinately decreases tricarboxylic acid (TCA) cycle intermedi-ates. In contrast, in breast CSCs, biguanides have a modest effecton glycolytic and TCA cycle intermediates, but they strongly de-plete nucleotide triphosphates and may impede nucleotide syn-thesis. These metabolic profiles are consistent with the idea thatbiguanides inhibit mitochondrial complex 1, but they indicate thattheir metabolic effects differ depending on the stage of cellulartransformation.
glycolysis | metabolism | cancer metabolism | metabolic profiling
Altered metabolism is a hallmark of malignantly transformedcells. Cancer risk is linked to metabolic syndrome, a disease
state that includes obesity, type 2 diabetes, high cholesterol, andatherosclerosis. Retrospective studies of type 2 diabetes patientstreated with metformin, the most widely prescribed antidiabeticdrug, show a strong correlation between drug intake and reducedtumor incidence or reduced cancer-related deaths (1–4).In the breast lineage, metformin inhibits growth of cancer cell
lines (5–7), blocks transformation in a Src-inducible cell system(8, 9), and selectively inhibits the growth of cancer stem cells(CSCs) (8). As a consequence of its selective effects on CSCs,combinatorial therapy of metformin and standard chemothera-peutic drugs (doxorubicin, paclitaxel, and cisplatin) increasestumor regression and prolongs remission in mouse xenografts (8,10). In addition, metformin can decrease the chemotherapeuticdose for prolonging tumor remission in xenografts involvingmultiple cancer types (10).Phenformin, a related biguanide and formerly used diabetes
drug, acts as an anticancer agent in tumors including lung, lym-phoma, and breast cancer with a greater potency than metfor-min. Phenformin mediates antineoplastic effects at a lowerconcentration than metformin in cell lines, a PTEN-deficientmouse model, breast cancer xenografts, and drug-induced mi-tochondrial impairment (11–14). The chemical similarities ofthese biguanides, as well as their similar effects in diabetes andcancer, have led to the untested assumption that phenformin isessentially a stronger version of metformin.
In a Src-inducible model of cellular transformation and CSCformation, multiple lines of evidence suggest that metformininhibits a signal transduction pathway that results in an in-flammatory response (15). In the context of atherosclerosis,metformin inhibits NF-κB activation and the inflammatory re-sponse via a pathway involving AMP kinase (AMPK) and thetumor suppressor PTEN (16, 17). As metformin alters energymetabolism in diabetics, we speculated that metformin mightblock a metabolic stress response that stimulates the inflam-matory pathway (15). However, very little is known about themetabolic changes that inhibit the inflammatory pathway.Previous studies on metformin-induced metabolic effects in
cancer have focused on single metabolic alterations or pathwaysin already established cancer cell lines. Metformin leads to ac-tivation of AMPK, which plays a key role in insulin signaling andenergy sensing (18). Metformin can reduce protein synthesis viamTOR inhibition (19). In addition, metformin may directly im-pair mitochondrial respiration through complex I inhibition andhas been described to boost glycolysis as a compensationmechanism (14, 20). In this regard, lactic acidosis can be a sideeffect of metformin and phenformin treatment of diabeticpatients, presumably because inhibition of complex I preventsNADH oxidation, thereby leading to a requirement for cytosolicNADH to be oxidized by the conversion of pyruvate to lactate.There is some knowledge about the metabolic effects of met-formin (21, 22), but very little is known about the specific met-abolic alterations linking biguanides to inhibition of neoplastictransformation.Here, we perform a metabolomic analysis on the effects of
metformin and phenformin in a Src-inducible model of trans-formation and in CSCs. This inducible model permits an analysis
Significance
The diabetes drugs metformin and phenformin have interestinganticancer properties including the selective inhibition of cancerstem cells (CSCs). We show that these drugs (i) have remarkablysimilar metabolic profiles, (ii) reduce the tricarboxylic acid cycleand selected glyolytic intermediates during transformation,providing physiological evidence that mitochondrial complex Iis a target, and (iii) have very different effects during trans-formation and in CSCs. These observations provide insight intothe metabolic effects of these drugs in cancer contexts andtheir selective effects in CSCs that underlie potential cancertreatments.
Author contributions: A.J., N.J.G., K.N.G.-H., M.C.H., and K.S. designed research; A.J., N.J.G.,K.N.G.-H., and J.M.A. performed research; A.J., N.J.G., K.N.G.-H., M.C.H., and K.S. analyzeddata; and A.J., N.J.G., M.C.H., and K.S. wrote the paper.
The authors declare no conflict of interest.1A.J. and N.J.G. contributed equally to this work.2To whom correspondence should be addressed. Email: [email protected].
This article contains supporting information online at www.pnas.org/lookup/suppl/doi:10.1073/pnas.1409844111/-/DCSupplemental.
10574–10579 | PNAS | July 22, 2014 | vol. 111 | no. 29 www.pnas.org/cgi/doi/10.1073/pnas.1409844111
of the transition from nontransformed to transformed cells in anisogenic cell system and hence differs from analyses of alreadyestablished cancer cell lines. We studied CSCs to address whythis population, which is resistant to standard chemotherapeuticsand hypothesized to be a major reason for tumor recurrence,is selectively inhibited by metformin. Our results indicate themetabolic effects of metformin and phenformin are remarkablysimilar to each other, with only a few differences. Both bigua-nides dramatically decrease tricarboxylic acid (TCA) cycle inter-mediates in the early stages of transformation, and they inhibitthe boost in select glycolytic intermediates that normally occurswith transformation along with increases in glycerol 3-phosphateand lactate, which are metabolites branching from glycolysis.Unexpectedly, in CSCs, biguanides have only marginal effectson glycolytic and TCA cycle metabolites, but they severelydecrease nucleotide triphosphates. These detailed metabolicanalyses provide independent support for the idea that met-formin inhibits mitochondrial complex 1 (14, 20), and they in-dicate that the metabolic effects of biguanides depend on thestage of the cellular transformation.
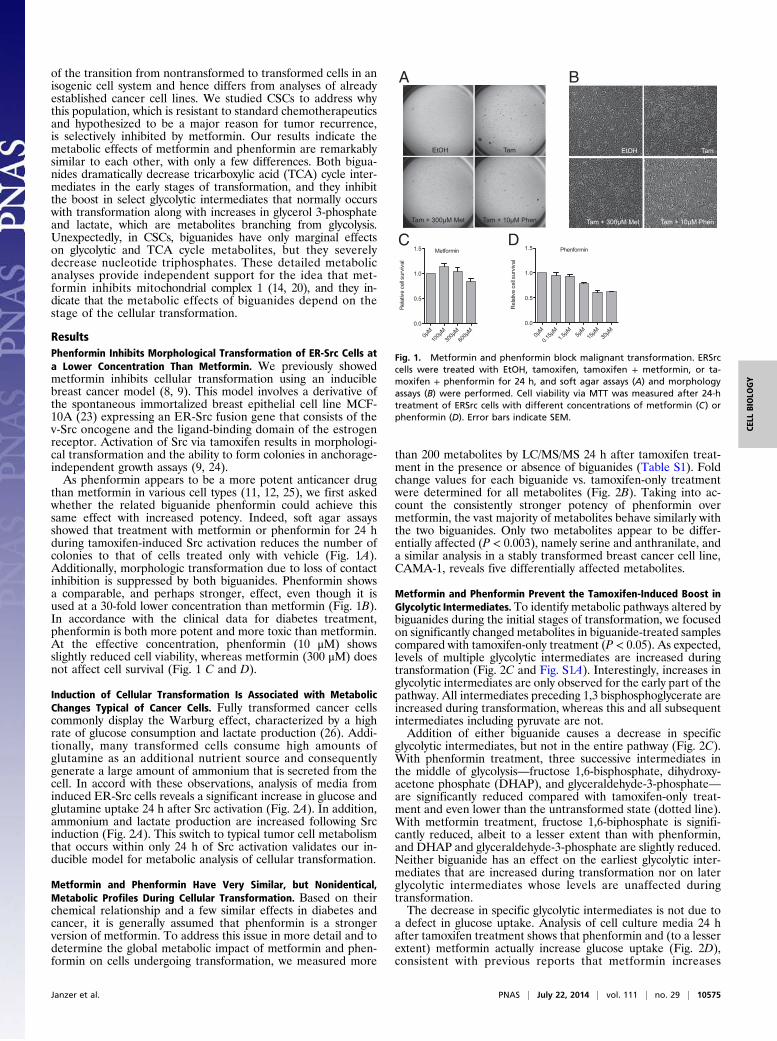
ResultsPhenformin Inhibits Morphological Transformation of ER-Src Cells ata Lower Concentration Than Metformin. We previously showedmetformin inhibits cellular transformation using an induciblebreast cancer model (8, 9). This model involves a derivative ofthe spontaneous immortalized breast epithelial cell line MCF-10A (23) expressing an ER-Src fusion gene that consists of thev-Src oncogene and the ligand-binding domain of the estrogenreceptor. Activation of Src via tamoxifen results in morphologi-cal transformation and the ability to form colonies in anchorage-independent growth assays (9, 24).As phenformin appears to be a more potent anticancer drug
than metformin in various cell types (11, 12, 25), we first askedwhether the related biguanide phenformin could achieve thissame effect with increased potency. Indeed, soft agar assaysshowed that treatment with metformin or phenformin for 24 hduring tamoxifen-induced Src activation reduces the number ofcolonies to that of cells treated only with vehicle (Fig. 1A).Additionally, morphologic transformation due to loss of contactinhibition is suppressed by both biguanides. Phenformin showsa comparable, and perhaps stronger, effect, even though it isused at a 30-fold lower concentration than metformin (Fig. 1B).In accordance with the clinical data for diabetes treatment,phenformin is both more potent and more toxic than metformin.At the effective concentration, phenformin (10 μM) showsslightly reduced cell viability, whereas metformin (300 μM) doesnot affect cell survival (Fig. 1 C and D).
Induction of Cellular Transformation Is Associated with MetabolicChanges Typical of Cancer Cells. Fully transformed cancer cellscommonly display the Warburg effect, characterized by a highrate of glucose consumption and lactate production (26). Addi-tionally, many transformed cells consume high amounts ofglutamine as an additional nutrient source and consequentlygenerate a large amount of ammonium that is secreted from thecell. In accord with these observations, analysis of media frominduced ER-Src cells reveals a significant increase in glucose andglutamine uptake 24 h after Src activation (Fig. 2A). In addition,ammonium and lactate production are increased following Srcinduction (Fig. 2A). This switch to typical tumor cell metabolismthat occurs within only 24 h of Src activation validates our in-ducible model for metabolic analysis of cellular transformation.
Metformin and Phenformin Have Very Similar, but Nonidentical,Metabolic Profiles During Cellular Transformation. Based on theirchemical relationship and a few similar effects in diabetes andcancer, it is generally assumed that phenformin is a strongerversion of metformin. To address this issue in more detail and todetermine the global metabolic impact of metformin and phen-formin on cells undergoing transformation, we measured more
than 200 metabolites by LC/MS/MS 24 h after tamoxifen treat-ment in the presence or absence of biguanides (Table S1). Foldchange values for each biguanide vs. tamoxifen-only treatmentwere determined for all metabolites (Fig. 2B). Taking into ac-count the consistently stronger potency of phenformin overmetformin, the vast majority of metabolites behave similarly withthe two biguanides. Only two metabolites appear to be differ-entially affected (P < 0.003), namely serine and anthranilate, anda similar analysis in a stably transformed breast cancer cell line,CAMA-1, reveals five differentially affected metabolites.
Metformin and Phenformin Prevent the Tamoxifen-Induced Boost inGlycolytic Intermediates.To identify metabolic pathways altered bybiguanides during the initial stages of transformation, we focusedon significantly changed metabolites in biguanide-treated samplescompared with tamoxifen-only treatment (P < 0.05). As expected,levels of multiple glycolytic intermediates are increased duringtransformation (Fig. 2C and Fig. S1A). Interestingly, increases inglycolytic intermediates are only observed for the early part of thepathway. All intermediates preceding 1,3 bisphosphoglycerate areincreased during transformation, whereas this and all subsequentintermediates including pyruvate are not.Addition of either biguanide causes a decrease in specific
glycolytic intermediates, but not in the entire pathway (Fig. 2C).With phenformin treatment, three successive intermediates inthe middle of glycolysis—fructose 1,6-bisphosphate, dihydroxy-acetone phosphate (DHAP), and glyceraldehyde-3-phosphate—are significantly reduced compared with tamoxifen-only treat-ment and even lower than the untransformed state (dotted line).With metformin treatment, fructose 1,6-biphosphate is signifi-cantly reduced, albeit to a lesser extent than with phenformin,and DHAP and glyceraldehyde-3-phosphate are slightly reduced.Neither biguanide has an effect on the earliest glycolytic inter-mediates that are increased during transformation nor on laterglycolytic intermediates whose levels are unaffected duringtransformation.The decrease in specific glycolytic intermediates is not due to
a defect in glucose uptake. Analysis of cell culture media 24 hafter tamoxifen treatment shows that phenformin and (to a lesserextent) metformin actually increase glucose uptake (Fig. 2D),consistent with previous reports that metformin increases
A B
C D
Fig. 1. Metformin and phenformin block malignant transformation. ERSrccells were treated with EtOH, tamoxifen, tamoxifen + metformin, or ta-moxifen + phenformin for 24 h, and soft agar assays (A) and morphologyassays (B) were performed. Cell viability via MTT was measured after 24-htreatment of ERSrc cells with different concentrations of metformin (C) orphenformin (D). Error bars indicate SEM.
Janzer et al. PNAS | July 22, 2014 | vol. 111 | no. 29 | 10575
CELL
BIOLO
GY

the dependency on glycolysis (4). Lactate production is alsoincreased in the presence of biguanides, again with phenforminhaving the stronger effect (Fig. 2D). Thus, despite promotingincreased glucose consumption and lactate production, metfor-min and phenformin ultimately decrease specific glycolytic in-termediates, suggesting rapid glucose processing that depletesintermediates from key junctions in glycolysis.
Biguanide Treatment Increases Glycerol 3-Phosphate and LactateProduction During Transformation. We asked whether decreasedglycolytic intermediates in the presence of biguanides duringtransformation might be due to increased partitioning to meta-bolites branching from glycolysis. Surprisingly, although a num-ber of anabolic precursors of the pentose phosphate pathway,nucleotide sugars, or glycogen synthesis are depleted withbiguanide treatment, glycerol 3-phosphate is increased by bothmetformin and phenformin (Fig. 2 E and F). Glycerol 3-phosphate,which is generated from the glycolytic intermediate DHAP, canserve as an intermediary between glucose and lipid metabolism.However, analysis of 14C-glucose incorporation into the lipidfraction reveals that biguanides instead decrease de novo lipo-genesis (Fig. S1B), indicating that glycerol 3-phosphate levels areincreased for an alternate purpose. As conversion of DHAP toglycerol 3-phosphate regenerates NAD+ from NADH (shown inorange, Fig. 2G), we hypothesize increased glycerol 3-phosphatelevels promote NAD+ regeneration, which is required tomaintain glycolysis.Although glycerol 3-phosphate is increased with both drugs,
UDP-glucose and UDP-glucuronate, branching out of glycolysisat the glucose-6-phosphate step via glucose 1-phosphate, aredecreased. As UDP-glucose is a metabolic precursor for glyco-gen synthesis, biguanides may direct glycolytic intermediatesaway from glycogen synthesis, which is a nutrient storage path-way that normally occurs in cells during energy abundance (Fig.2E). UDP-glucuronate feeds in the pentose phosphate pathway,but this pathway is not significantly affected by either biguanide(Fig. 2E).
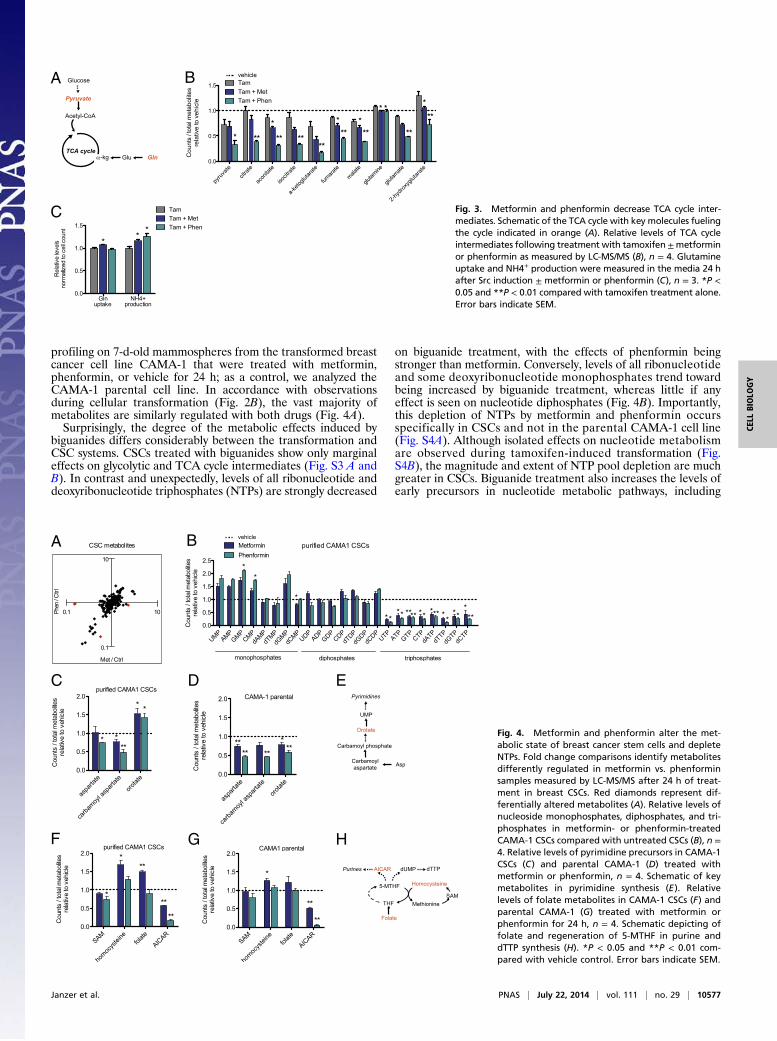
Metformin and Phenformin Decrease the Level of TCA CycleIntermediates. In addition to boosting glycolysis, cancer cellsmust allocate nutrients toward the TCA cycle to generate ATPand intermediates necessary for macromolecule biosynthesis(27). Along with glucose-derived pyruvate, glutamine flux con-tributes substantially to fueling the TCA cycle in many cancercells. Strikingly, nearly all TCA cycle metabolites are stronglydecreased with both metformin and phenformin (Fig. 3 A and B).Decreased levels of TCA cycle intermediates correlate withdecreased pyruvate (with phenformin), increased shunting ofglucose-derived carbons toward lactate, and decreased levels ofglutamate and (marginally) glutamine (Fig. 3B). Glutamine up-take is not decreased by biguanides, indicating there is no defectin glutamine transport across the cell membrane (Fig. 3C).Ammonium production is increased by biguanide treatment (Fig.3C), suggesting increased utilization of glutamine as an attemptto refuel the TCA cycle via anaplerosis.Our results appear to differ from a previous report in prostate
cancer suggesting that metformin does not inhibit the TCA cyclebut rather alters the fuel source by decreasing the oxidation ofglucose-derived pyruvate and increasing glutamine anaplerosis(28). We considered the possibility that this apparent differencein TCA cycle inhibition might be due to analysis of stablytransformed cancer cells as opposed to cells early in the processof transformation. However, biguanide treatment of a stablytransformed breast cancer cell line (CAMA-1) leads to a de-crease in TCA cycle intermediates (Fig. S2), suggesting that themetabolic reduction of the TCA cycle by biguanides may beimportant for inhibiting transformation.
Biguanides Induce a CSC-Specific Depletion of Nucleotide Triphosphates.Metformin selectively kills breast CSCs and, as a consequence, canact together with standard chemotherapeutic drugs to increase tu-mor regression and prolong relapse in mouse xenografts (8, 10).CSCs represent a minor population of cancer cells either in primarytissue or cancer cell lines, but they are enriched in mammo-spheres that form when cultivated in nonadherent and non-differentiating conditions (29, 30). We performed metabolic
vehicleER-Src MCF-10A metabolites
glucose lactate0.0
0.5
1.0
1.5
2.0
uptake production
TamTam + MetTam + Phen
**
Rel
ativ
ele
v els
norm
aliz
edto
cel lc
o unt **
***
0.1 10
0.1
10
Met / CtrlPh
en/C
trl
Glycolysis
Fructose-1,6-bisphosphate
1,3-bisphosphoglycerate
Glyceraldehyde 3-phosphateDHAPGlycerol
3-phosphate
Fructose-6-phosphate Pentose phosphatepathway
Triglycerides
Nucleotide sugars;Glycogen
Glucose
Glucose-6-phosphate
Pentose phosphatepathway
Tamoxifen + Biguanide
gluco
se 6-
phos
phate
fructo
se 6-
phos
phate
fructo
se 1,
6-bisp
hosp
hate
DHAP
glyce
ralde
hyde
3-P
1,3-bi
spho
spho
glyce
rate
3-pho
spho
glyce
rate
0.0
0.5
1.0
1.5
2.0
2.5
TamTam + MetTam + Phen
** * *
Cou
nts
/tot
alm
etab
olite
sre
lativ
eto
vehi
cle
Pyruvate
Increased by Met and PhenDecreased by Met and Phen
glucose lactate Gln NH4+0.0
0.5
1.0
1.5
2.0 TamEtOH
** **** **
uptake uptakeproduction production
Rel
ativ
ele
vels
norm
aliz
edt o
cell c
ount
***
** *
** **
NADHNAD+
Decreased by Phen
gluco
se 1-
phos
phate
UDP-gluc
ose
UDP-gluc
urona
te
deox
yribo
se5-p
hosp
hate
gluco
nate
dehy
droglu
cona
te
ribos
e pho
spha
te
sedo
heptu
lose 7
-phos
phate
erythr
ose-4
-phos
phate
glyce
rol 3-
phos
phate
0
1
2
3
4
nucleotide sugars;glycogen
pentose phosphatepathway
triglycerides;NAD production
Cou
nts
/tot
alm
e tab
o lit e
sre
l ati v
et o
v ehi
c le
+
* **
A B C
D E
F
Fig. 2. Metformin and phenformin alter the met-abolic state of the transformation process, specifi-cally preventing an increase in some glycolyticintermediates. Twenty-four hours after Src in-duction by tamoxifen (Tam) or control treatmentwith ethanol (EtOH), glucose and glutamine uptakeand lactate and ammonium production were mea-sured in the media of MCF10A ERSrc cells (A), n = 3.To identify metformin vs. phenformin differences,fold changes of both drugs for all LS-MS/MSmetabolites over the tamoxifen-only sample weredetermined and ratios were calculated. Red dotsindicate differentially regulated metabolites out-side of a 99.7% CI generated over all ratios (B).Relative levels of glycolytic intermediates measuredwith LC-MS/MS for tamoxifen ± metformin orphenformin and vehicle (ethanol)-treated samples(C), n = 4. Glucose uptake and lactate productionwere measured in the media 24 h after Src induction ±metformin (D), n = 3. Relative levels of metabolitesbranching from glycolysis with tamoxifen±metforminor phenformin and vehicle-treated samples (E), n = 4.Diagram of glycolytic intermediates altered by met-formin or phenformin (F) treatment. The role ofglycerol 3-phosphate production in regeneration ofNAD+ is indicated in orange. For all panels, *P < 0.05and **P < 0.01 compared with control sample. Errorbars indicate SEM.
10576 | www.pnas.org/cgi/doi/10.1073/pnas.1409844111 Janzer et al.
profiling on 7-d-old mammospheres from the transformed breastcancer cell line CAMA-1 that were treated with metformin,phenformin, or vehicle for 24 h; as a control, we analyzed theCAMA-1 parental cell line. In accordance with observationsduring cellular transformation (Fig. 2B), the vast majority ofmetabolites are similarly regulated with both drugs (Fig. 4A).Surprisingly, the degree of the metabolic effects induced by
biguanides differs considerably between the transformation andCSC systems. CSCs treated with biguanides show only marginaleffects on glycolytic and TCA cycle intermediates (Fig. S3 A andB). In contrast and unexpectedly, levels of all ribonucleotide anddeoxyribonucleotide triphosphates (NTPs) are strongly decreased
on biguanide treatment, with the effects of phenformin beingstronger than metformin. Conversely, levels of all ribonucleotideand some deoxyribonucleotide monophosphates trend towardbeing increased by biguanide treatment, whereas little if anyeffect is seen on nucleotide diphosphates (Fig. 4B). Importantly,this depletion of NTPs by metformin and phenformin occursspecifically in CSCs and not in the parental CAMA-1 cell line(Fig. S4A). Although isolated effects on nucleotide metabolismare observed during tamoxifen-induced transformation (Fig.S4B), the magnitude and extent of NTP pool depletion are muchgreater in CSCs. Biguanide treatment also increases the levels ofearly precursors in nucleotide metabolic pathways, including
A B
C Fig. 3. Metformin and phenformin decrease TCA cycle inter-mediates. Schematic of the TCA cycle with key molecules fuelingthe cycle indicated in orange (A). Relative levels of TCA cycleintermediates following treatment with tamoxifen±metforminor phenformin as measured by LC-MS/MS (B), n = 4. Glutamineuptake and NH4+ production were measured in the media 24 hafter Src induction ± metformin or phenformin (C), n = 3. *P <0.05 and **P < 0.01 compared with tamoxifen treatment alone.Error bars indicate SEM.
A B
C D E
F G H
Fig. 4. Metformin and phenformin alter the met-abolic state of breast cancer stem cells and depleteNTPs. Fold change comparisons identify metabolitesdifferently regulated in metformin vs. phenforminsamples measured by LC-MS/MS after 24 h of treat-ment in breast CSCs. Red diamonds represent dif-ferentially altered metabolites (A). Relative levels ofnucleoside monophosphates, diphosphates, and tri-phosphates in metformin- or phenformin-treatedCAMA-1 CSCs compared with untreated CSCs (B), n =4. Relative levels of pyrimidine precursors in CAMA-1CSCs (C) and parental CAMA-1 (D) treated withmetformin or phenformin, n = 4. Schematic of keymetabolites in pyrimidine synthesis (E). Relativelevels of folate metabolites in CAMA-1 CSCs (F) andparental CAMA-1 (G) treated with metformin orphenformin for 24 h, n = 4. Schematic depicting offolate and regeneration of 5-MTHF in purine anddTTP synthesis (H). *P < 0.05 and **P < 0.01 com-pared with vehicle control. Error bars indicate SEM.
Janzer et al. PNAS | July 22, 2014 | vol. 111 | no. 29 | 10577
CELL
BIOLO
GY
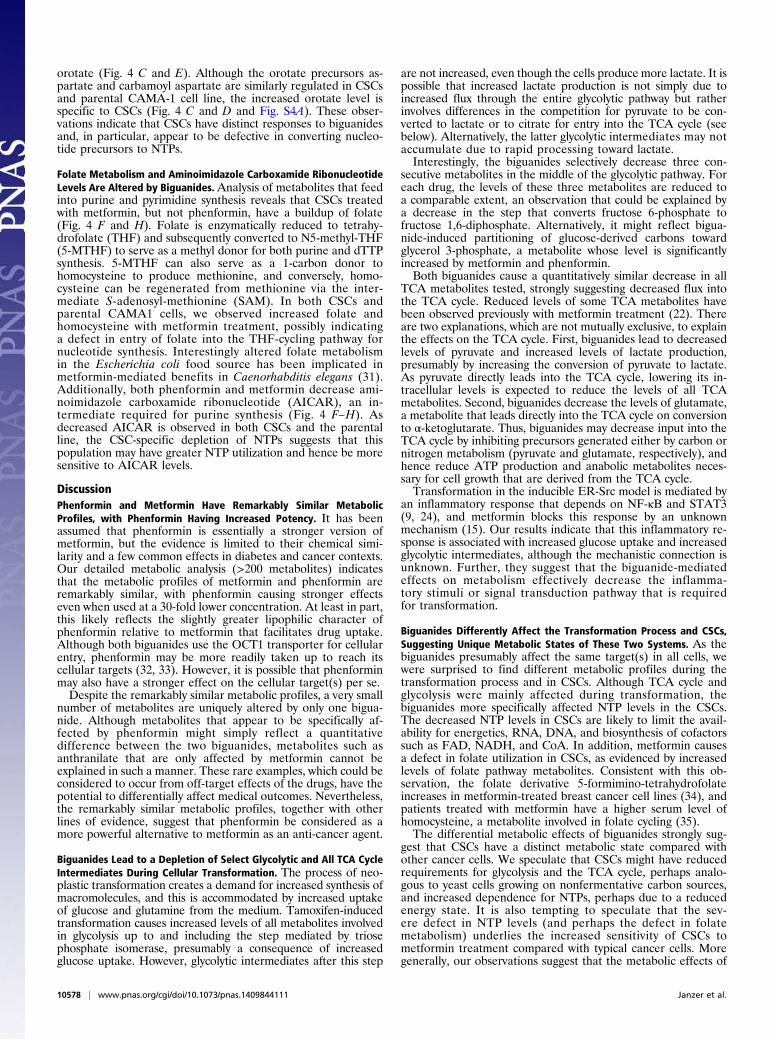
orotate (Fig. 4 C and E). Although the orotate precursors as-partate and carbamoyl aspartate are similarly regulated in CSCsand parental CAMA-1 cell line, the increased orotate level isspecific to CSCs (Fig. 4 C and D and Fig. S4A). These obser-vations indicate that CSCs have distinct responses to biguanidesand, in particular, appear to be defective in converting nucleo-tide precursors to NTPs.
Folate Metabolism and Aminoimidazole Carboxamide RibonucleotideLevels Are Altered by Biguanides. Analysis of metabolites that feedinto purine and pyrimidine synthesis reveals that CSCs treatedwith metformin, but not phenformin, have a buildup of folate(Fig. 4 F and H). Folate is enzymatically reduced to tetrahy-drofolate (THF) and subsequently converted to N5-methyl-THF(5-MTHF) to serve as a methyl donor for both purine and dTTPsynthesis. 5-MTHF can also serve as a 1-carbon donor tohomocysteine to produce methionine, and conversely, homo-cysteine can be regenerated from methionine via the inter-mediate S-adenosyl-methionine (SAM). In both CSCs andparental CAMA1 cells, we observed increased folate andhomocysteine with metformin treatment, possibly indicatinga defect in entry of folate into the THF-cycling pathway fornucleotide synthesis. Interestingly altered folate metabolismin the Escherichia coli food source has been implicated inmetformin-mediated benefits in Caenorhabditis elegans (31).Additionally, both phenformin and metformin decrease ami-noimidazole carboxamide ribonucleotide (AICAR), an in-termediate required for purine synthesis (Fig. 4 F–H). Asdecreased AICAR is observed in both CSCs and the parentalline, the CSC-specific depletion of NTPs suggests that thispopulation may have greater NTP utilization and hence be moresensitive to AICAR levels.
DiscussionPhenformin and Metformin Have Remarkably Similar MetabolicProfiles, with Phenformin Having Increased Potency. It has beenassumed that phenformin is essentially a stronger version ofmetformin, but the evidence is limited to their chemical simi-larity and a few common effects in diabetes and cancer contexts.Our detailed metabolic analysis (>200 metabolites) indicatesthat the metabolic profiles of metformin and phenformin areremarkably similar, with phenformin causing stronger effectseven when used at a 30-fold lower concentration. At least in part,this likely reflects the slightly greater lipophilic character ofphenformin relative to metformin that facilitates drug uptake.Although both biguanides use the OCT1 transporter for cellularentry, phenformin may be more readily taken up to reach itscellular targets (32, 33). However, it is possible that phenforminmay also have a stronger effect on the cellular target(s) per se.Despite the remarkably similar metabolic profiles, a very small
number of metabolites are uniquely altered by only one bigua-nide. Although metabolites that appear to be specifically af-fected by phenformin might simply reflect a quantitativedifference between the two biguanides, metabolites such asanthranilate that are only affected by metformin cannot beexplained in such a manner. These rare examples, which could beconsidered to occur from off-target effects of the drugs, have thepotential to differentially affect medical outcomes. Nevertheless,the remarkably similar metabolic profiles, together with otherlines of evidence, suggest that phenformin be considered as amore powerful alternative to metformin as an anti-cancer agent.
Biguanides Lead to a Depletion of Select Glycolytic and All TCA CycleIntermediates During Cellular Transformation. The process of neo-plastic transformation creates a demand for increased synthesis ofmacromolecules, and this is accommodated by increased uptakeof glucose and glutamine from the medium. Tamoxifen-inducedtransformation causes increased levels of all metabolites involvedin glycolysis up to and including the step mediated by triosephosphate isomerase, presumably a consequence of increasedglucose uptake. However, glycolytic intermediates after this step
are not increased, even though the cells produce more lactate. It ispossible that increased lactate production is not simply due toincreased flux through the entire glycolytic pathway but ratherinvolves differences in the competition for pyruvate to be con-verted to lactate or to citrate for entry into the TCA cycle (seebelow). Alternatively, the latter glycolytic intermediates may notaccumulate due to rapid processing toward lactate.Interestingly, the biguanides selectively decrease three con-
secutive metabolites in the middle of the glycolytic pathway. Foreach drug, the levels of these three metabolites are reduced toa comparable extent, an observation that could be explained bya decrease in the step that converts fructose 6-phosphate tofructose 1,6-diphosphate. Alternatively, it might reflect bigua-nide-induced partitioning of glucose-derived carbons towardglycerol 3-phosphate, a metabolite whose level is significantlyincreased by metformin and phenformin.Both biguanides cause a quantitatively similar decrease in all
TCA metabolites tested, strongly suggesting decreased flux intothe TCA cycle. Reduced levels of some TCA metabolites havebeen observed previously with metformin treatment (22). Thereare two explanations, which are not mutually exclusive, to explainthe effects on the TCA cycle. First, biguanides lead to decreasedlevels of pyruvate and increased levels of lactate production,presumably by increasing the conversion of pyruvate to lactate.As pyruvate directly leads into the TCA cycle, lowering its in-tracellular levels is expected to reduce the levels of all TCAmetabolites. Second, biguanides decrease the levels of glutamate,a metabolite that leads directly into the TCA cycle on conversionto α-ketoglutarate. Thus, biguanides may decrease input into theTCA cycle by inhibiting precursors generated either by carbon ornitrogen metabolism (pyruvate and glutamate, respectively), andhence reduce ATP production and anabolic metabolites neces-sary for cell growth that are derived from the TCA cycle.Transformation in the inducible ER-Src model is mediated by
an inflammatory response that depends on NF-κB and STAT3(9, 24), and metformin blocks this response by an unknownmechanism (15). Our results indicate that this inflammatory re-sponse is associated with increased glucose uptake and increasedglycolytic intermediates, although the mechanistic connection isunknown. Further, they suggest that the biguanide-mediatedeffects on metabolism effectively decrease the inflamma-tory stimuli or signal transduction pathway that is requiredfor transformation.
Biguanides Differently Affect the Transformation Process and CSCs,Suggesting Unique Metabolic States of These Two Systems. As thebiguanides presumably affect the same target(s) in all cells, wewere surprised to find different metabolic profiles during thetransformation process and in CSCs. Although TCA cycle andglycolysis were mainly affected during transformation, thebiguanides more specifically affected NTP levels in the CSCs.The decreased NTP levels in CSCs are likely to limit the avail-ability for energetics, RNA, DNA, and biosynthesis of cofactorssuch as FAD, NADH, and CoA. In addition, metformin causesa defect in folate utilization in CSCs, as evidenced by increasedlevels of folate pathway metabolites. Consistent with this ob-servation, the folate derivative 5-formimino-tetrahydrofolateincreases in metformin-treated breast cancer cell lines (34), andpatients treated with metformin have a higher serum level ofhomocysteine, a metabolite involved in folate cycling (35).The differential metabolic effects of biguanides strongly sug-
gest that CSCs have a distinct metabolic state compared withother cancer cells. We speculate that CSCs might have reducedrequirements for glycolysis and the TCA cycle, perhaps analo-gous to yeast cells growing on nonfermentative carbon sources,and increased dependence for NTPs, perhaps due to a reducedenergy state. It is also tempting to speculate that the sev-ere defect in NTP levels (and perhaps the defect in folatemetabolism) underlies the increased sensitivity of CSCs tometformin treatment compared with typical cancer cells. Moregenerally, our observations suggest that the metabolic effects of
10578 | www.pnas.org/cgi/doi/10.1073/pnas.1409844111 Janzer et al.
metformin may differ considerably among cancer cell typesand states.
Evidence for Mitochondrial Complex 1 Being a Target of Biguanidesand Future Use of Metabolic Profiles. The direct target(s) of met-formin is unknown, although mitochondrial complex I is thebest candidate at present (14, 20). A defect in complex I willdecrease oxidation of NADH to NAD+, a critical reaction tomaintain the function of the TCA cycle, and ultimately inhibitoxidative phosphorylation leading to ATP. Several observationsin this paper are consistent with the hypothesis that biguanidestarget complex I. First, biguanides decrease the levels of allTCA intermediates, suggesting an overall defect in TCA cyclefunction due to the relative inability to oxidize NADH toNAD+. Second, decreased TCA cycle function is likely to resultin preferential conversion of pyruvate to lactate as opposed toentering the TCA cycle, and this is observed in biguanide-treatedcells. In this regard, inhibition of complex I by rotenone boostslactate production (36) and reduces TCA cycle intermediates(37), allowing an alternate way to produce ATP when the elec-tron transport chain is not functional. Third, the increased lac-tate production and increased levels of glycerol-3-phosphatemay reflect stimulation of two key reactions that effectivelyoxidize NADH to NAD+, thereby compensating for lower levelsof NAD+ due to decreased complex I activity. Fourth, thestrong decrease in NTPs in CSCs suggests a major defect inenergy state necessary, likely reflecting a defect in oxidativephosphorylation.
Our detailed metabolic profiling provides independent sup-port for the idea that complex I is a target of biguanides. Asa complement to biochemical studies, examining metabolic pro-files conferred by drugs with known targets (e.g., rotenone) orcaused by functional inhibition or deletion of an individual geneshould be very helpful for identifying the physiological target ofbiguanides. In addition, metabolic profiles conferred by biguanidetreatment should be very useful for identifying new drugs withsimilar metabolic properties, and such drugs might have potentialfor treatment of diabetes or cancer.
Materials and MethodsCell and culture conditions, tamoxifen-induced transformation of MCF-10AER-Src cells, metformin (300 μM) and phenformin (10 μM) treatment (24),mammosphere culture (10), metabolic profiling by target LC MS (38), basallipogenesis analysis (39), analysis using the BioProfile FLEX analyzer (NovaBiomedicals) for levels of glucose, lactate, glutamine, and ammonia (40), andstatistical analyses were performed as described previously and in moredetail in SI Materials and Methods.
ACKNOWLEDGMENTS. We thank Min Yuan for metabolomics technicalassistance. A.J. was supported by a fellowship from the Postdoc Programmeof the German Academic Exchange Service (DAAD), N.J.G. by NationalScience Foundation Graduate Research Fellowship Grant 1000087636, K.N.G.-H.by the Paul & Daisy Soros Fellowship for New Americans, M.C.H. by NationalInstitutes of Health (NIH) Grant AG032375, the American Cancer Society NewScholar Award, and the Glenn Foundation for Medical Research, and K.S. byNIH Grant CA 107486.
1. Evans JM, Donnelly LA, Emslie-Smith AM, Alessi DR, Morris AD (2005) Metformin andreduced risk of cancer in diabetic patients. BMJ 330(7503):1304–1305.
2. Jiralerspong S, et al. (2009) Metformin and pathologic complete responses to neo-adjuvant chemotherapy in diabetic patients with breast cancer. J Clin Oncol 27(20):3297–3302.
3. Dowling RJ, Niraula S, Stambolic V, Goodwin PJ (2012) Metformin in cancer: Trans-lational challenges. J Mol Endocrinol 48(3):R31–R43.
4. Pollak MN (2012) Investigating metformin for cancer prevention and treatment: Theend of the beginning. Cancer Discov 2(9):778–790.
5. Alimova IN, et al. (2009) Metformin inhibits breast cancer cell growth, colony for-mation and induces cell cycle arrest in vitro. Cell Cycle 8(6):909–915.
6. Liu B, et al. (2009) Metformin induces unique biological and molecular responses intriple negative breast cancer cells. Cell Cycle 8(13):2031–2040.
7. Zakikhani M, Dowling R, Fantus IG, Sonenberg N, Pollak M (2006) Metformin is anAMP kinase-dependent growth inhibitor for breast cancer cells. Cancer Res 66(21):10269–10273.
8. Hirsch HA, Iliopoulos D, Tsichlis PN, Struhl K (2009) Metformin selectively targetscancer stem cells, and acts together with chemotherapy to block tumor growth andprolong remission. Cancer Res 69(19):7507–7511.
9. Hirsch HA, et al. (2010) A transcriptional signature and common gene networks linkcancer with lipid metabolism and diverse human diseases. Cancer Cell 17(4):348–361.
10. Iliopoulos D, Hirsch HA, Struhl K (2011) Metformin decreases the dose of chemo-therapy for prolonging tumor remission in mouse xenografts involving multiplecancer cell types. Cancer Res 71(9):3196–3201.
11. Huang X, et al. (2008) Important role of the LKB1-AMPK pathway in suppressingtumorigenesis in PTEN-deficient mice. Biochem J 412(2):211–221.
12. Appleyard MV, et al. (2012) Phenformin as prophylaxis and therapy in breast cancerxenografts. Br J Cancer 106(6):1117–1122.
13. Dykens JA, et al. (2008) Biguanide-induced mitochondrial dysfunction yields increasedlactate production and cytotoxicity of aerobically-poised HepG2 cells and humanhepatocytes in vitro. Toxicol Appl Pharmacol 233(2):203–210.
14. Owen MR, Doran E, Halestrap AP (2000) Evidence that metformin exerts its anti-diabetic effects through inhibition of complex 1 of the mitochondrial respiratorychain. Biochem J 348(Pt 3):607–614.
15. Hirsch HA, Iliopoulos D, Struhl K (2013) Metformin inhibits the inflammatory responseassociated with cellular transformation and cancer stem cell growth. Proc Natl AcadSci USA 110(3):972–977.
16. Li SN, et al. (2009) Metformin inhibits nuclear factor kappaB activation and decreasesserum high-sensitivity C-reactive protein level in experimental atherogenesis of rab-bits. Heart Vessels 24(6):446–453.
17. Kim SA, Choi HC (2012) Metformin inhibits inflammatory response via AMPK-PTENpathway in vascular smooth muscle cells. Biochem Biophys Res Commun 425(4):866–872.
18. Hardie DG (2008) Role of AMP-activated protein kinase in the metabolic syndromeand in heart disease. FEBS Lett 582(1):81–89.
19. Larsson O, et al. (2012) Distinct perturbation of the translatome by the antidiabeticdrug metformin. Proc Natl Acad Sci USA 109(23):8977–8982.
20. El-Mir MY, et al. (2000) Dimethylbiguanide inhibits cell respiration via an indirecteffect targeted on the respiratory chain complex I. J Biol Chem 275(1):223–228.
21. Scotland S, et al. (2013) Mitochondrial energetic and AKT status mediate metaboliceffects and apoptosis of metformin in human leukemic cells. Leukemia 27(11):2129–2138.
22. Zakikhani M, et al. (2012) Alterations in cellular energy metabolism associated withthe antiproliferative effects of the ATM inhibitor KU-55933 and with metformin. PLoSONE 7(11):e49513.
23. Soule HD, et al. (1990) Isolation and characterization of a spontaneously immortal-ized human breast epithelial cell line, MCF-10. Cancer Res 50(18):6075–6086.
24. Iliopoulos D, Hirsch HA, Struhl K (2009) An epigenetic switch involving NF-kappaB,Lin28, Let-7 MicroRNA, and IL6 links inflammation to cell transformation. Cell 139(4):693–706.
25. Rosilio C, et al. (2013) The metabolic perturbators metformin, phenformin and AICARinterfere with the growth and survival of murine PTEN-deficient T cell lymphomasand human T-ALL/T-LL cancer cells. Cancer Lett 336(1):114–126.
26. Warburg O (1956) On respiratory impairment in cancer cells. Science 124(3215):269–270.
27. Lunt SY, Vander Heiden MG (2011) Aerobic glycolysis: Meeting the metabolic re-quirements of cell proliferation. Annu Rev Cell Dev Biol 27:441–464.
28. Fendt SM, et al. (2013) Metformin decreases glucose oxidation and increases thedependency of prostate cancer cells on reductive glutamine metabolism. Cancer Res73(14):4429–4438.
29. Liao MJ, et al. (2007) Enrichment of a population of mammary gland cells that formmammospheres and have in vivo repopulating activity. Cancer Res 67(17):8131–8138.
30. Grimshaw MJ, et al. (2008) Mammosphere culture of metastatic breast cancer cellsenriches for tumorigenic breast cancer cells. Breast Cancer Res 10(3):R52.
31. Cabreiro F, et al. (2013) Metformin retards aging in C. elegans by altering microbialfolate and methionine metabolism. Cell 153(1):228–239.
32. Shu Y, et al. (2007) Effect of genetic variation in the organic cation transporter 1(OCT1) on metformin action. J Clin Invest 117(5):1422–1431.
33. Shitara Y, et al. (2013) Role of organic cation/carnitine transporter 1 in uptake ofphenformin and inhibitory effect on complex I respiration in mitochondria. Toxicol Sci132(1):32–42.
34. Corominas-Faja B, et al. (2012) Metabolomic fingerprint reveals that metformin im-pairs one-carbon metabolism in a manner similar to the antifolate class of chemo-therapy drugs. Aging (Albany, NY Online) 4(7):480–498.
35. Sahin M, Tutuncu NB, Ertugrul D, Tanaci N, Guvener ND (2007) Effects of metforminor rosiglitazone on serum concentrations of homocysteine, folate, and vitamin B12 inpatients with type 2 diabetes mellitus. J Diabetes Complications 21(2):118–123.
36. Xu Q, Vu H, Liu L, Wang TC, Schaefer WH (2011) Metabolic profiles show specificmitochondrial toxicities in vitro in myotube cells. J Biomol NMR 49(3-4):207–219.
37. Basu SS, Blair IA (2011) Rotenone-mediated changes in intracellular coenzyme Athioester levels: Implications for mitochondrial dysfunction. Chem Res Toxicol 24(10):1630–1632.
38. Shyh-Chang N, et al. (2013) Influence of threonine metabolism on S-adenosylmethionineand histone methylation. Science 339(6116):222–226.
39. Laurent G, et al. (2013) SIRT4 coordinates the balance between lipid synthesis andcatabolism by repressing malonyl CoA decarboxylase. Mol Cell 50(5):686–698.
40. Finley LW, et al. (2011) SIRT3 opposes reprogramming of cancer cell metabolismthrough HIF1α destabilization. Cancer Cell 19(3):416–428.
Janzer et al. PNAS | July 22, 2014 | vol. 111 | no. 29 | 10579
CELL
BIOLO
GY