Embed Size (px)
Citation preview

Meteorology and evaporationmodules Documentation
Release 1
Dr. M.J. Waterloo
November 21, 2014


CONTENTS
1 meteolib.py: Meteorological functions 11.1 Meteorological function names . . . . . . . . . . . . . . . . . . . . . . . . . . . . . . . . . . . 11.2 Function descriptions . . . . . . . . . . . . . . . . . . . . . . . . . . . . . . . . . . . . . . . . . 1
2 evaplib.py: Evaporation functions 72.1 Potential and actual evaporation functions . . . . . . . . . . . . . . . . . . . . . . . . . . . . . . 72.2 Function descriptions . . . . . . . . . . . . . . . . . . . . . . . . . . . . . . . . . . . . . . . . . 7
3 meteo_util.py: Utility functions 133.1 Miscellaneous functions . . . . . . . . . . . . . . . . . . . . . . . . . . . . . . . . . . . . . . . 13
4 Indices and tables 15
Python Module Index 17
i

ii

CHAPTER
ONE
METEOLIB.PY: METEOROLOGICALFUNCTIONS
Library of functions for meteorology.
1.1 Meteorological function names
• cp_calc: Calculate specific heat
• Delta_calc: Calculate slope of vapour pressure curve
• es_calc: Calculate saturation vapour pressures
• ea_calc: Calculate actual vapour pressures
• gamma_calc: Calculate psychrometric constant
• L_calc: Calculate latent heat of vapourisation
• pottemp: Calculate potential temperature (1000 hPa reference pressure)
• rho_calc: Calculate air density
• sun_NR: Maximum sunshine duration [h] and extraterrestrial radiation [J/day]
• vpd_calc: Calculate vapour pressure deficits
• windvec: Calculate average wind direction and speed
Module requires and imports math and scipy modules.
Tested for compatibility with Python 2.7.
1.2 Function descriptions
meteolib.Delta_calc(airtemp=array([], dtype=float64))Function to calculate the slope of the temperature - vapour pressure curve (Delta) from air temperatures.
Parameters:
• airtemp: (array of) air temperature [◦C].
Returns:
• Delta: (array of) slope of saturated vapour curve [Pa K−1].
1

Meteorology and evaporation modules Documentation, Release 1
References
Technical regulations 49, World Meteorological Organisation, 1984. Appendix A. 1-Ap-A-3.
Examples
>>> Delta_calc(30.0)243.34309166827094>>> x = [20, 25]>>> Delta_calc(x)array([ 144.6658414 , 188.62504569])
meteolib.L_calc(airtemp=array([], dtype=float64))Function to calculate the latent heat of vapourisation from air temperature.
Parameters:
• airtemp: (array of) air temperature [◦C].
Returns:
• L: (array of) lambda [J kg−1K−1].
References
J. Bringfelt. Test of a forest evapotranspiration model. Meteorology and Climatology Reports 52, SMHI,Norrköpping, Sweden, 1986.
Examples
>>> L_calc(25)2440883.8804625>>> t=[10, 20, 30]>>> L_calc(t)array([ 2476387.3842125, 2452718.3817125, 2429049.3792125])
meteolib.cp_calc(airtemp=array([], dtype=float64), rh=array([], dtype=float64), air-press=array([], dtype=float64))
Function to calculate the specific heat of air.
Parameters:
• airtemp: (array of) air temperature [◦C].
• rh: (array of) relative humidity data [%].
• airpress: (array of) air pressure data [Pa].
Returns: cp: array of saturated c_p values [J kg−1K−1].
References
R.G. Allen, L.S. Pereira, D. Raes and M. Smith (1998). Crop Evaporation Guidelines for computing cropwater requirements, FAO - Food and Agriculture Organization of the United Nations. Irrigation and drainagepaper 56, Chapter 3. Rome, Italy. (http://www.fao.org/docrep/x0490e/x0490e07.htm)
2 Chapter 1. meteolib.py: Meteorological functions
Meteorology and evaporation modules Documentation, Release 1
Examples
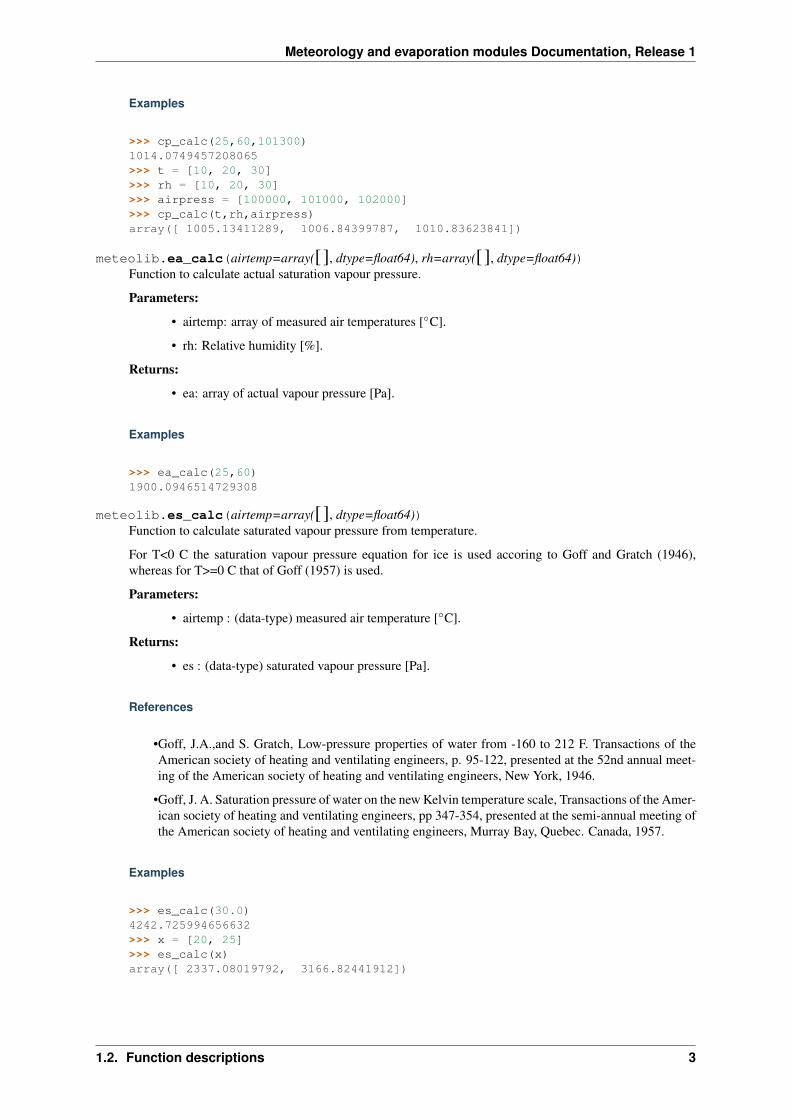
>>> cp_calc(25,60,101300)1014.0749457208065>>> t = [10, 20, 30]>>> rh = [10, 20, 30]>>> airpress = [100000, 101000, 102000]>>> cp_calc(t,rh,airpress)array([ 1005.13411289, 1006.84399787, 1010.83623841])
meteolib.ea_calc(airtemp=array([], dtype=float64), rh=array([], dtype=float64))Function to calculate actual saturation vapour pressure.
Parameters:
• airtemp: array of measured air temperatures [◦C].
• rh: Relative humidity [%].
Returns:
• ea: array of actual vapour pressure [Pa].
Examples
>>> ea_calc(25,60)1900.0946514729308
meteolib.es_calc(airtemp=array([], dtype=float64))Function to calculate saturated vapour pressure from temperature.
For T<0 C the saturation vapour pressure equation for ice is used accoring to Goff and Gratch (1946),whereas for T>=0 C that of Goff (1957) is used.
Parameters:
• airtemp : (data-type) measured air temperature [◦C].
Returns:
• es : (data-type) saturated vapour pressure [Pa].
References
•Goff, J.A.,and S. Gratch, Low-pressure properties of water from -160 to 212 F. Transactions of theAmerican society of heating and ventilating engineers, p. 95-122, presented at the 52nd annual meet-ing of the American society of heating and ventilating engineers, New York, 1946.
•Goff, J. A. Saturation pressure of water on the new Kelvin temperature scale, Transactions of the Amer-ican society of heating and ventilating engineers, pp 347-354, presented at the semi-annual meeting ofthe American society of heating and ventilating engineers, Murray Bay, Quebec. Canada, 1957.
Examples
>>> es_calc(30.0)4242.725994656632>>> x = [20, 25]>>> es_calc(x)array([ 2337.08019792, 3166.82441912])
1.2. Function descriptions 3
Meteorology and evaporation modules Documentation, Release 1
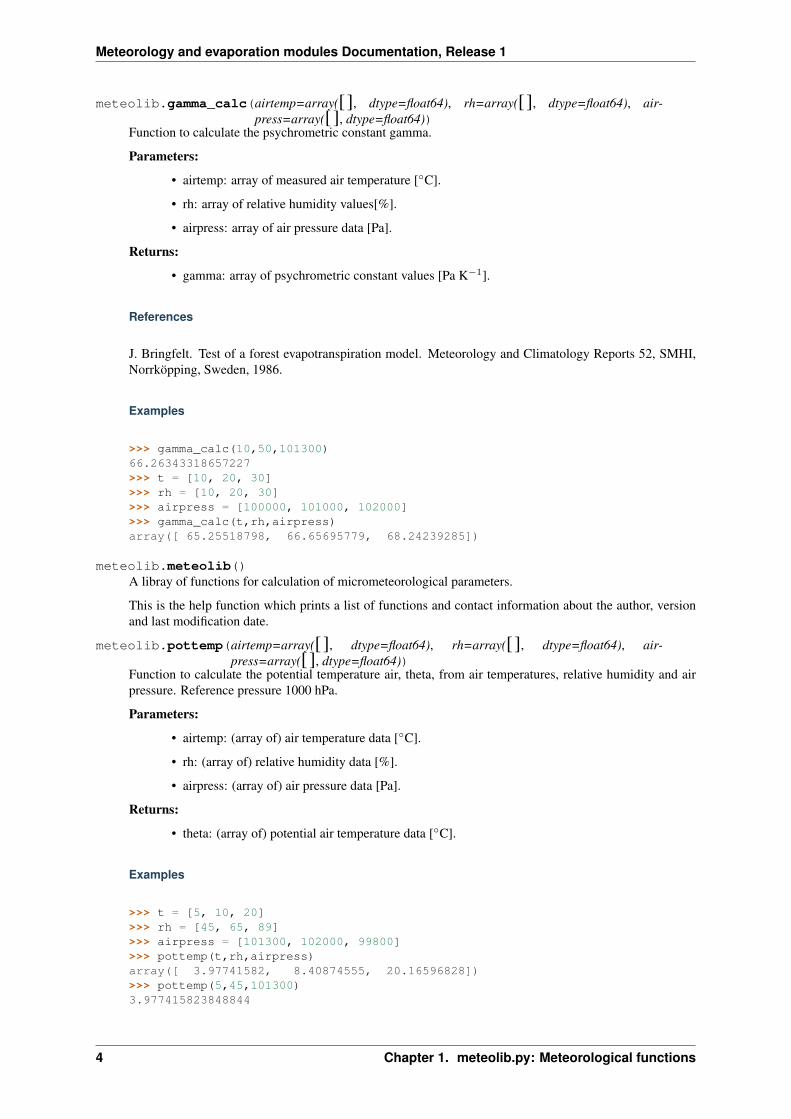
meteolib.gamma_calc(airtemp=array([], dtype=float64), rh=array([], dtype=float64), air-press=array([], dtype=float64))
Function to calculate the psychrometric constant gamma.
Parameters:
• airtemp: array of measured air temperature [◦C].
• rh: array of relative humidity values[%].
• airpress: array of air pressure data [Pa].
Returns:
• gamma: array of psychrometric constant values [Pa K−1].
References
J. Bringfelt. Test of a forest evapotranspiration model. Meteorology and Climatology Reports 52, SMHI,Norrköpping, Sweden, 1986.
Examples
>>> gamma_calc(10,50,101300)66.26343318657227>>> t = [10, 20, 30]>>> rh = [10, 20, 30]>>> airpress = [100000, 101000, 102000]>>> gamma_calc(t,rh,airpress)array([ 65.25518798, 66.65695779, 68.24239285])
meteolib.meteolib()A libray of functions for calculation of micrometeorological parameters.
This is the help function which prints a list of functions and contact information about the author, versionand last modification date.
meteolib.pottemp(airtemp=array([], dtype=float64), rh=array([], dtype=float64), air-press=array([], dtype=float64))
Function to calculate the potential temperature air, theta, from air temperatures, relative humidity and airpressure. Reference pressure 1000 hPa.
Parameters:
• airtemp: (array of) air temperature data [◦C].
• rh: (array of) relative humidity data [%].
• airpress: (array of) air pressure data [Pa].
Returns:
• theta: (array of) potential air temperature data [◦C].
Examples
>>> t = [5, 10, 20]>>> rh = [45, 65, 89]>>> airpress = [101300, 102000, 99800]>>> pottemp(t,rh,airpress)array([ 3.97741582, 8.40874555, 20.16596828])>>> pottemp(5,45,101300)3.977415823848844
4 Chapter 1. meteolib.py: Meteorological functions

Meteorology and evaporation modules Documentation, Release 1
meteolib.rho_calc(airtemp=array([], dtype=float64), rh=array([], dtype=float64), air-press=array([], dtype=float64))
Function to calculate the density of air, rho, from air temperatures, relative humidity and air pressure.
Parameters:
• airtemp: (array of) air temperature data [◦C].
• rh: (array of) relative humidity data [%].
• airpress: (array of) air pressure data [Pa].
Returns:
• rho: (array of) air density data [kg m-3].
Examples
>>> t = [10, 20, 30]>>> rh = [10, 20, 30]>>> airpress = [100000, 101000, 102000]>>> rho_calc(t,rh,airpress)array([ 1.22948419, 1.19787662, 1.16635358])>>> rho_calc(10,50,101300)1.2431927125520903
meteolib.sun_NR(doy=array([], dtype=float64), lat=<type ‘float’>)Function to calculate the maximum sunshine duration [h] and incoming radiation [MJ/day] at the top of theatmosphere from day of year and latitude.
Parameters:
• doy: (array of) day of year.
• lat: latitude in decimal degrees, negative for southern hemisphere.
Returns: - N: (float, array) maximum sunshine hours [h]. - Rext: (float, array) extraterrestrial radiation [Jday−1].
Notes
Only valid for latitudes between 0 and 67 degrees (i.e. tropics and temperate zone).
References
R.G. Allen, L.S. Pereira, D. Raes and M. Smith (1998). Crop Evaporation - Guidelines for computingcrop water requirements, FAO - Food and Agriculture Organization of the United Nations. Irrigation anddrainage paper 56, Chapter 3. Rome, Italy. (http://www.fao.org/docrep/x0490e/x0490e07.htm)
Examples
>>> sun_NR(50,60)(9.1631820597268163, 9346987.824773483)>>> days = [100,200,300]>>> latitude = 52.>>> sun_NR(days,latitude)(array([ 13.31552077, 15.87073276, 9.54607624]), array([ 29354803.66244921, 39422316.42084264, 12619144.54566777]))
meteolib.vpd_calc(airtemp=array([], dtype=float64), rh=array([], dtype=float64))Function to calculate vapour pressure deficit.
1.2. Function descriptions 5

Meteorology and evaporation modules Documentation, Release 1
Parameters:
• airtemp: measured air temperatures [◦C].
• rh: (array of) rRelative humidity [%].
Returns:
• vpd: (array of) vapour pressure deficits [Pa].
Examples
>>> vpd_calc(30,60)1697.090397862653>>> T=[20,25]>>> RH=[50,100]>>> vpd_calc(T,RH)array([ 1168.54009896, 0. ])
meteolib.windvec(u=array([], dtype=float64), D=array([], dtype=float64))Function to calculate the wind vector from time series of wind speed and direction.
Parameters:
• u: array of wind speeds [m s-1].
• D: array of wind directions [degrees from North].
Returns:
• uv: Vector wind speed [m s-1].
• Dv: Vector wind direction [degrees from North].
Examples
>>> u = scipy.array([[ 3.],[7.5],[2.1]])>>> D = scipy.array([[340],[356],[2]])>>> windvec(u,D)(4.162354202836905, array([ 353.2118882]))>>> uv, Dv = windvec(u,D)>>> uv4.162354202836905>>> Dvarray([ 353.2118882])
6 Chapter 1. meteolib.py: Meteorological functions
CHAPTER
TWO
EVAPLIB.PY: EVAPORATIONFUNCTIONS
Functions for calculation of potential and actual evaporation from meteorological data.
2.1 Potential and actual evaporation functions
• E0: Calculate Penman (1948, 1956) open water evaporation.
• Em: Calculate evaporation according to Makkink (1965).
• Ept: Calculate evaporation according to Priestley and Taylor (1972).
• ET0pm: Calculate Penman Monteith reference evaporation short grass.
• Epm: Calculate Penman-Monteith evaporation (actual).
• ra: Calculate aerodynamic resistance from windspeed and roughnes parameters.
• tvardry: calculate sensible heat flux from temperature variations.
• gash79: Gash (1979) analytical rainfall interception model.
Requires and imports scipy and meteolib modules. Compatible with Python 2.7.3.
2.2 Function descriptions
evaplib.E0(airtemp=array([], dtype=float64), rh=array([], dtype=float64), airpress=array([],dtype=float64), Rs=array([], dtype=float64), Rext=array([], dtype=float64), u=array([], dtype=float64), alpha=0.08, Z=0.0)
Function to calculate daily Penman (open) water evaporation estimates.
Parameters:
• airtemp: (array of) daily average air temperatures [◦C].
• rh: (array of) daily average relative humidity [%].
• airpress: (array of) daily average air pressure data [Pa].
• Rs: (array of) daily incoming solar radiation [J m−2 day−1].
• Rext: (array of) daily extraterrestrial radiation [J m−2 day−1].
• u: (array of) daily average wind speed at 2 m [m s-1].
• alpha: albedo [-] set at 0.08 for open water by default.
• Z: (array of) site elevation, default is 0 m a.s.l.
7
Meteorology and evaporation modules Documentation, Release 1
Returns:
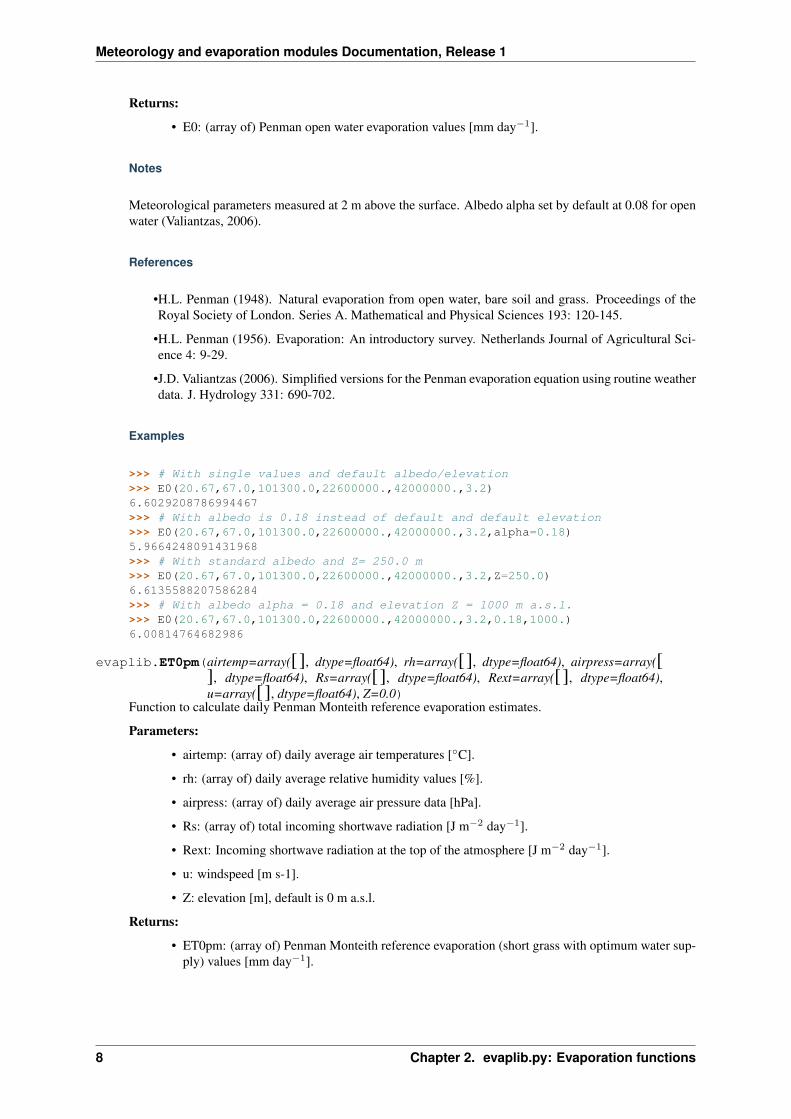
• E0: (array of) Penman open water evaporation values [mm day−1].
Notes
Meteorological parameters measured at 2 m above the surface. Albedo alpha set by default at 0.08 for openwater (Valiantzas, 2006).
References
•H.L. Penman (1948). Natural evaporation from open water, bare soil and grass. Proceedings of theRoyal Society of London. Series A. Mathematical and Physical Sciences 193: 120-145.
•H.L. Penman (1956). Evaporation: An introductory survey. Netherlands Journal of Agricultural Sci-ence 4: 9-29.
•J.D. Valiantzas (2006). Simplified versions for the Penman evaporation equation using routine weatherdata. J. Hydrology 331: 690-702.
Examples
>>> # With single values and default albedo/elevation>>> E0(20.67,67.0,101300.0,22600000.,42000000.,3.2)6.6029208786994467>>> # With albedo is 0.18 instead of default and default elevation>>> E0(20.67,67.0,101300.0,22600000.,42000000.,3.2,alpha=0.18)5.9664248091431968>>> # With standard albedo and Z= 250.0 m>>> E0(20.67,67.0,101300.0,22600000.,42000000.,3.2,Z=250.0)6.6135588207586284>>> # With albedo alpha = 0.18 and elevation Z = 1000 m a.s.l.>>> E0(20.67,67.0,101300.0,22600000.,42000000.,3.2,0.18,1000.)6.00814764682986
evaplib.ET0pm(airtemp=array([], dtype=float64), rh=array([], dtype=float64), airpress=array([], dtype=float64), Rs=array([], dtype=float64), Rext=array([], dtype=float64),u=array([], dtype=float64), Z=0.0)
Function to calculate daily Penman Monteith reference evaporation estimates.
Parameters:
• airtemp: (array of) daily average air temperatures [◦C].
• rh: (array of) daily average relative humidity values [%].
• airpress: (array of) daily average air pressure data [hPa].
• Rs: (array of) total incoming shortwave radiation [J m−2 day−1].
• Rext: Incoming shortwave radiation at the top of the atmosphere [J m−2 day−1].
• u: windspeed [m s-1].
• Z: elevation [m], default is 0 m a.s.l.
Returns:
• ET0pm: (array of) Penman Monteith reference evaporation (short grass with optimum water sup-ply) values [mm day−1].
8 Chapter 2. evaplib.py: Evaporation functions
Meteorology and evaporation modules Documentation, Release 1
Notes
Meteorological measuements standard at 2 m above soil surface.
References
R.G. Allen, L.S. Pereira, D. Raes and M. Smith (1998). Crop evapotranspiration - Guidelines for computingcrop water requirements - FAO Irrigation and drainage paper 56. FAO - Food and Agriculture Organizationof the United Nations, Rome, 1998. (http://www.fao.org/docrep/x0490e/x0490e07.htm)
Examples
>>> ET0pm(20.67,67.0,101300.0,22600000.,42000000.,3.2)4.7235349721073039
evaplib.Em(airtemp=array([], dtype=float64), rh=array([], dtype=float64), airpress=array([],dtype=float64), Rs=array([], dtype=float64))
Function to calculate Makkink evaporation (in mm/day).
The Makkink evaporation is a reference crop evaporation used in the Netherlands, which is combined witha crop factor to provide an estimate of actual crop evaporation.
Parameters:
• airtemp: (array of) daily average air temperatures [◦C].
• rh: (array of) daily average relative humidity values [%].
• airpress: (array of) daily average air pressure data [Pa].
• Rs: (array of) average daily incoming solar radiation [J m−2 day−1].
Returns:
• Em: (array of) Makkink evaporation values [mm day−1].
Notes
Meteorological measuements standard at 2 m above soil surface.
References
H.A.R. de Bruin (1987). From Penman to Makkink, in Hooghart, C. (Ed.), Evaporation and Weather,Proceedings and Information. Comm. Hydrological Research TNO, The Hague. pp. 5-30.
Examples
>>> Em(21.65,67.0,101300.,24200000.)4.503830479197991
evaplib.Epm(airtemp=array([], dtype=float64), rh=array([], dtype=float64), airpress=array([],dtype=float64), Rn=array([], dtype=float64), G=array([], dtype=float64), ra=array([], dtype=float64), rs=array([], dtype=float64))
Function to calculate the Penman Monteith evaporation.
Parameters:
• airtemp: (array of) daily average air temperatures [◦C].
• rh: (array of) daily average relative humidity values [%].
2.2. Function descriptions 9
Meteorology and evaporation modules Documentation, Release 1
• airpress: (array of) daily average air pressure data [hPa].
• Rn: (array of) average daily net radiation [J].
• G: (array of) average daily soil heat flux [J].
• ra: aerodynamic resistance [s m-1].
• rs: surface resistance [s m-1].
Returns:
• Epm: (array of) Penman Monteith evaporation values [mm].
References
J.L. Monteith (1965) Evaporation and environment. Symp. Soc. Exp. Biol. 19, 205-224.
Examples
>>> Epm(21.67,67.0,101300.0,10600000.,500000.0,11.0,120.)6.856590956174142
evaplib.Ept(airtemp=array([], dtype=float64), rh=array([], dtype=float64), airpress=array([],dtype=float64), Rn=array([], dtype=float64), G=array([], dtype=float64))
Function to calculate daily Priestley - Taylor evaporation.
Parameters:
• airtemp: (array of) daily average air temperatures [◦C].
• rh: (array of) daily average relative humidity values [%].
• airpress: (array of) daily average air pressure data [Pa].
• Rn: (array of) average daily net radiation [J m−2 day−1].
• G: (array of) average daily soil heat flux [J m−2 day−1].
Returns:
• Ept: (array of) Priestley Taylor evaporation values [mm day−1].
Notes
Meteorological parameters normally measured at 2 m above the surface.
References
Priestley, C.H.B. and R.J. Taylor, 1972. On the assessment of surface heat flux and evaporation usinglarge-scale parameters. Mon. Weather Rev. 100:81-82.
Examples
>>> Ept(21.65,67.0,101300.,18200000.,600000.)6.349456116128078
evaplib.evaplib()Evaplib: A libray with Python functions for calculation of evaporation from meteorological data.
10 Chapter 2. evaplib.py: Evaporation functions
Meteorology and evaporation modules Documentation, Release 1
evaplib.gash79(Pg=array([], dtype=float64), ER=<type ‘float’>, S=<type ‘float’>, St=<type‘float’>, p=<type ‘float’>, pt=<type ‘float’>)
Function to calculate precipitation interception loss.
Parameters:
• Pg: daily rainfall data [mm].
• ER: evaporation percentage of total rainfall [mm h-1].
• S: storage capacity canopy [mm].
• St: stem storage capacity [mm].
• p: direct throughfall [mm].
• pt: stem precipitation [mm].
Returns:
• Pg: Daily rainfall [mm].
• Ei: Interception [mm].
• TF: through fall [mm].
• SF: stemflow [mm].
References
J.H.C. Gash, An analytical model of rainfall interception by forests, Quarterly Journal of the Royal Meteo-rological Society, 1979, 105, pp. 43-55.
Examples
>>> gash79(12.4,0.15,1.3,0.2,0.2,0.02)(12.4, 8.4778854123725971, 0, 3.9221145876274024)>>> gash79(60.0,0.15,1.3,0.2,0.2,0.02)(60.0, 47.033885412372598, 0, 12.966114587627404)
evaplib.ra(z=<type ‘float’>, z0=<type ‘float’>, d=<type ‘float’>, u=array([], dtype=float64))Function to calculate aerodynamic resistance.
Parameters:
• z: measurement height [m].
• z0: roughness length [m].
• d: displacement length [m].
• u: (array of) windspeed [m s-1].
Returns:
• ra: (array of) aerodynamic resistances [s m-1].
References
A.S. Thom (1075), Momentum, mass and heat exchange of plant communities, In: Monteith, J.L. Vegetationand the Atmosphere, Academic Press, London. p. 57–109.
2.2. Function descriptions 11
Meteorology and evaporation modules Documentation, Release 1
Examples
>>> ra(3,0.12,2.4,5.0)3.2378629924752942>>> u=([2,4,6])>>> ra(3,0.12,2.4,u)array([ 8.09465748, 4.04732874, 2.69821916])
evaplib.tvardry(rho=array([], dtype=float64), cp=array([], dtype=float64), T=array([],dtype=float64), sigma_t=array([], dtype=float64), z=0.0, d=0.0)
Function to calculate the sensible heat flux from high frequency temperature measurements and its standarddeviation.
Parameters:
• rho: (array of) air density values [kg m-3].
• cp: (array of) specific heat at constant temperature values [J kg−1K−1].
• T: (array of) temperature data [◦C].
• sigma_t: (array of) standard deviation of temperature data [◦C].
• z: temperature measurement height above the surface [m].
• d: displacement height due to vegetation, default is zero [m].
Returns:
• H: (array of) sensible heat flux [W m−2].
Notes
This function holds only for free convective conditions when C2*z/L >>1, where L is the Obhukov length.
References
•J.E. Tillman (1972), The indirect determination of stability, heat and momentum fluxes in the atmo-sphere boundary layer from simple scalar variables during dry unstable conditions, Journal of AppliedMeteorology 11: 783-792.
•H.F. Vugts, M.J. Waterloo, F.J. Beekman, K.F.A. Frumau and L.A. Bruijnzeel. The temperature vari-ance method: a powerful tool in the estimation of actual evaporation rates. In J. S. Gladwell, editor,Hydrology of Warm Humid Regions, Proc. of the Yokohama Symp., IAHS Publication No. 216, pages251-260, July 1993.
Examples
>>> tvardry(1.25,1035.0,25.3,0.25,3.0)34.658669290185287>>> d=0.25>>> tvardry(1.25,1035.0,25.3,0.25,3.0,d)33.183149497185511
12 Chapter 2. evaplib.py: Evaporation functions
CHAPTER
THREE
METEO_UTIL.PY: UTILITYFUNCTIONS
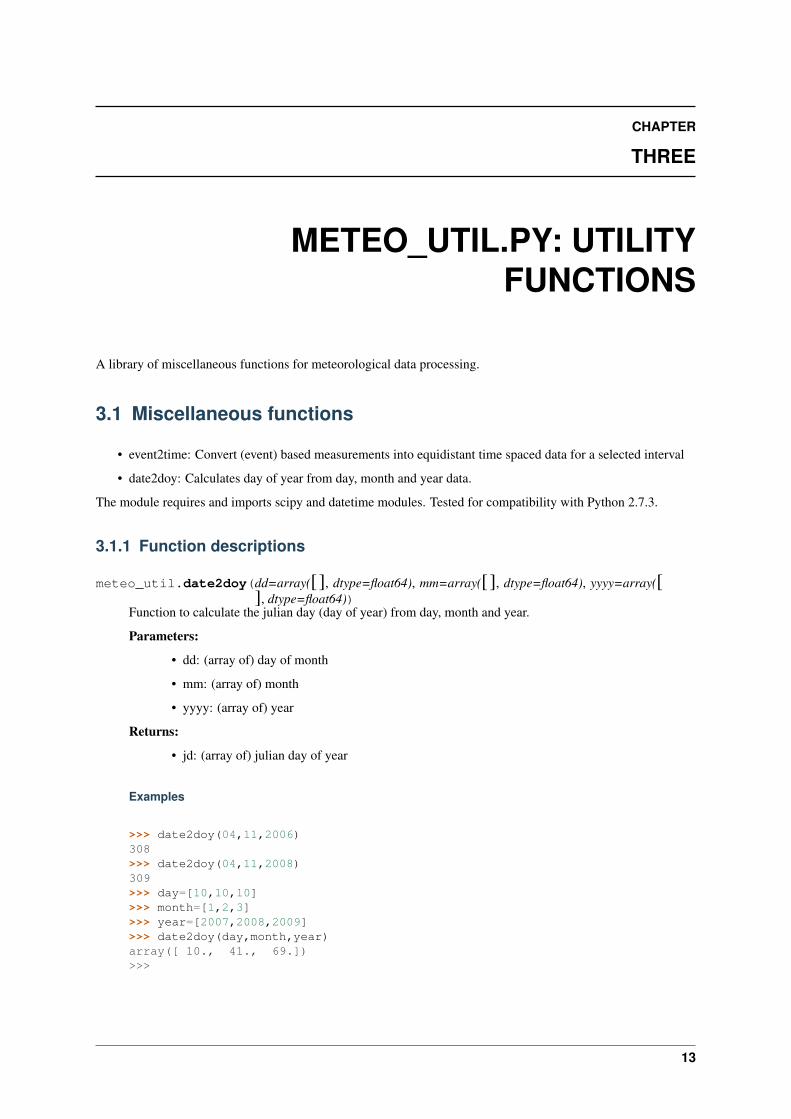
A library of miscellaneous functions for meteorological data processing.
3.1 Miscellaneous functions
• event2time: Convert (event) based measurements into equidistant time spaced data for a selected interval
• date2doy: Calculates day of year from day, month and year data.
The module requires and imports scipy and datetime modules. Tested for compatibility with Python 2.7.3.
3.1.1 Function descriptions
meteo_util.date2doy(dd=array([], dtype=float64), mm=array([], dtype=float64), yyyy=array([], dtype=float64))
Function to calculate the julian day (day of year) from day, month and year.
Parameters:
• dd: (array of) day of month
• mm: (array of) month
• yyyy: (array of) year
Returns:
• jd: (array of) julian day of year
Examples
>>> date2doy(04,11,2006)308>>> date2doy(04,11,2008)309>>> day=[10,10,10]>>> month=[1,2,3]>>> year=[2007,2008,2009]>>> date2doy(day,month,year)array([ 10., 41., 69.])>>>
13
Meteorology and evaporation modules Documentation, Release 1
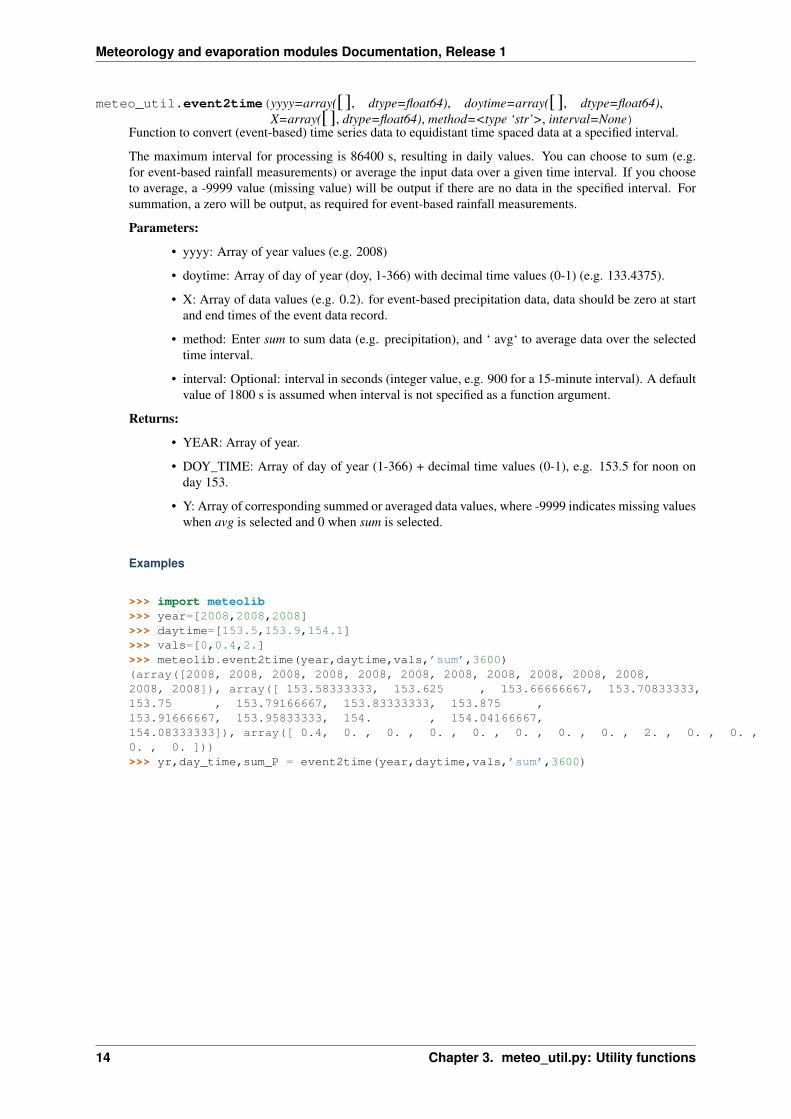
meteo_util.event2time(yyyy=array([], dtype=float64), doytime=array([], dtype=float64),X=array([], dtype=float64), method=<type ‘str’>, interval=None)
Function to convert (event-based) time series data to equidistant time spaced data at a specified interval.
The maximum interval for processing is 86400 s, resulting in daily values. You can choose to sum (e.g.for event-based rainfall measurements) or average the input data over a given time interval. If you chooseto average, a -9999 value (missing value) will be output if there are no data in the specified interval. Forsummation, a zero will be output, as required for event-based rainfall measurements.
Parameters:
• yyyy: Array of year values (e.g. 2008)
• doytime: Array of day of year (doy, 1-366) with decimal time values (0-1) (e.g. 133.4375).
• X: Array of data values (e.g. 0.2). for event-based precipitation data, data should be zero at startand end times of the event data record.
• method: Enter sum to sum data (e.g. precipitation), and ‘ avg‘ to average data over the selectedtime interval.
• interval: Optional: interval in seconds (integer value, e.g. 900 for a 15-minute interval). A defaultvalue of 1800 s is assumed when interval is not specified as a function argument.
Returns:
• YEAR: Array of year.
• DOY_TIME: Array of day of year (1-366) + decimal time values (0-1), e.g. 153.5 for noon onday 153.
• Y: Array of corresponding summed or averaged data values, where -9999 indicates missing valueswhen avg is selected and 0 when sum is selected.
Examples
>>> import meteolib>>> year=[2008,2008,2008]>>> daytime=[153.5,153.9,154.1]>>> vals=[0,0.4,2.]>>> meteolib.event2time(year,daytime,vals,’sum’,3600)(array([2008, 2008, 2008, 2008, 2008, 2008, 2008, 2008, 2008, 2008, 2008,2008, 2008]), array([ 153.58333333, 153.625 , 153.66666667, 153.70833333,153.75 , 153.79166667, 153.83333333, 153.875 ,153.91666667, 153.95833333, 154. , 154.04166667,154.08333333]), array([ 0.4, 0. , 0. , 0. , 0. , 0. , 0. , 0. , 2. , 0. , 0. ,0. , 0. ]))>>> yr,day_time,sum_P = event2time(year,daytime,vals,’sum’,3600)
14 Chapter 3. meteo_util.py: Utility functions

CHAPTER
FOUR
INDICES AND TABLES
• genindex
• modindex
• search
15
Meteorology and evaporation modules Documentation, Release 1
16 Chapter 4. Indices and tables

PYTHON MODULE INDEX
eevaplib, 7
mmeteo_util, 13meteolib, 1
17