Embed Size (px)
Citation preview
Composite Structures 152 (2016) 183–198
Contents lists available at ScienceDirect
Composite Structures
journal homepage: www.elsevier .com/locate /compstruct
Metamodel-based approach for stochastic free vibration analysisof functionally graded carbon nanotube reinforced plates
http://dx.doi.org/10.1016/j.compstruct.2016.05.0190263-8223/� 2016 Elsevier Ltd. All rights reserved.
⇑ Corresponding author.E-mail address: [email protected] (E. García-Macías).
Enrique García-Macías a,⇑, Rafael Castro-Triguero b, Michael I. Friswell c, Sondipon Adhikari c, Andrés Sáez a
aDepartment of Continuum Mechanics and Structural Analysis, School of Engineering, University of Seville, Camino de los Descubrimientos s/n, E-41092 Seville, SpainbDepartment of Mechanics, University of Cordoba, Campus de Rabanales, Cordoba CP 14071, Spainc Zienkiewicz Centre for Computational Engineering, College of Engineering, Swansea University, Singleton Park, SA2 8PP, United Kingdom
a r t i c l e i n f o
Article history:Received 25 February 2016Revised 18 April 2016Accepted 4 May 2016Available online 12 May 2016
Keywords:Uncertainty quantificationKrigingRS-HDMRCarbon nanotubeFunctionally graded materialsFinite element method
a b s t r a c t
The remarkable mechanical and sensing properties of carbon nanotubes (CNTs) suggest that they areideal candidates for high performance and self-sensing cementitious composites. However, there is stilla lack of deeper knowledge of the uncertainty associated with their incorporation into functionallygraded composite materials (FGM). The influence of these uncertainties can be critical for future applica-tions in the field of Structural Health Monitoring (SHM), techniques that usually require high accuracymodeling. Most researchers restrict the aim of their studies to the analysis of composite materials withuniform or linear grading profiles. This study sheds new light on the basis of stochastic representation ofthe grading profiles and analyzes the propagation of its uncertainty into the response of FG-CNT rein-forced plates. The finite element method (FEM) is employed to study the individual and interactive effectsof the mechanical properties (matrix/CNTs) and grading profiles via power-law distributions. The effectsof stochastic uncertainties on the overall properties of the composite material are represented usingprobability theory.
� 2016 Elsevier Ltd. All rights reserved.
1. Introduction
Since the discovery of carbon nanotubes (CNTs) by Ijima [1] in1991, many researchers have investigated their unique capabilitiesas reinforcements in composite materials (CNTRC). Due to theirremarkable mechanical, electrical and thermal properties, carbonnanotubes are considered as ideal reinforcing fibers for advancedhigh strengthmaterials and smartmaterials with self-sensing capa-bilities [2,3]. These features are specially interesting in the field ofStructural Health Monitoring (SHM). The correlation between thevariation of the applied stresses with the electrical resistance leadsto infinite possibilities for the control and assessment of civilstructures. Although still in initial development phases, these capa-bilities have already been demonstrated experimentally [4–8].Another promising direction is the application of CNTs as reinforce-ments in functionally graded materials (FGMs), a branch ofadvanced materials characterized by spatially continuous varyingproperties. Since its origin in 1984 (see e.g. [9]), this concept haspromoted the development of a wide range of functionally gradedcomposite materials (FGCM). These materials are inhomogeneouscomposites characterized by smooth and continuous variations in
both compositional profile and material properties. This featureallows designers to optimize the contribution of each phase of thecomposite, which has led to an extensive number of applicationsin many engineering fields. Given the promising capabilities ofthe employment of carbon nanotubes as reinforcements in func-tionally gradedmaterials, it is essential to develop theoretical mod-els to predict the response of full-scale functionally graded carbonnanotube reinforced (FG-CNTRC) structural elements. However,because of its inherent complexity, FG-CNTRC structures are diffi-cult to manufacture according to its exact design specifications.Hence, undesirable process-induced uncertainties may arise. Sincethe mechanical properties of the constituent materials(matrix/CNTs) may vary statistically, as well as the uncertaintiesinherent in the fabrication technique, the mass and stiffnessmatrices of FG-CNTRC structural elements are stochastic in nature.Therefore, the properties of FG-CNTRC materials should be quanti-fied probabilistically. In order to probabilistically assess the behav-ior of FG-CNTRC structures, randomness must be taken intoconsideration in three coupled aspects: (i) uncertainty in thematerial properties, (ii) uncertainty associated with the leap fromnano to macroscale through an homogenization framework and(iii) uncertainty in the reinforcement grading profile.
The number of publications on static and dynamic deterministicanalysis of CNTRC and FG-CNTRC structural elements has increased
184 E. García-Macías et al. / Composite Structures 152 (2016) 183–198
considerably in recent years with plenty of newly publishedresults. Linear distributions of single-walled carbon nanotubes(SWCNTs) within an isotropic matrix were proposed by Shen[10]. In this work, it is shown that nonlinear load-bending momentcurves of FG-CNTRC plates in thermal environments can be signif-icantly increased as a result of a functionally graded reinforcement.Zhu et al. [11] carried out bending and free vibration analysis ofFG-CNTRC plates by FEM based on first-order shear deformationplate theory (FSDT) with similar conclusions. Yas and Heshmatiimplemented the Timoshenko beam theory to analyze the vibra-tion of straight uniform [12] and linear [13] FG-CNTRC beams sub-jected to moving loads. Zhang et al. [14] proposed a state-spaceLevy method for the vibration analysis of FG-CNT composite platessubjected to in-plane loads based on higher-order shear deforma-tion theory. This research analyzed three different symmetric lin-ear distributions of the reinforcements along the thickness,namely UD, FG-X and FG-O. They concluded that FG-X providesthe largest frequency and critical buckling in-plane load. On thecontrary, the frequency for the FGO-CNT plate was the lowest.Zhang and Liew [15] presented detailed parametric studies of thelarge deflection behaviors of FG-CNTRC quadrilaterals for differenttypes of CNT distributions. They concluded that the geometricparameters such as side angle, thickness-to-width ratio or plateaspect ratios are more significant than material parameters suchas CNT distribution and CNT volume fraction. García-Macías et al.[16] proposed a shell finite element formulation based on theHu-Washizu principle in general curvilinear coordinates for thesimulation of FG-CNTRCs. In particular, it is applied for an exhaus-tive parametric analysis of the static response and free vibrationcharacteristics of FG-CNTRC skew plates with uniform and linearCNT distributions. It should be noted that all the aforementionedworks only took account of linear reinforcement grading profiles.
Uncertainty propagation in nanocomposite structures remainsas an unsolved issue. Rouhi and Rohani [17] analyzed the proba-bilistic response characteristics of a thin-walled nanocompositecylinder subjected to buckling instability. They employedmicromechanical approaches based on the Eshelby–Mori–Tanakamethod for the mathematical modeling of randomly distributedcarbon nanofibers (CNFs) in a thermoset polymer material. Byusing a dual metamodeling procedure, uncertainty in CNF materialproperties, CNF waviness and CNF-matrix interphase were takeninto consideration to carry out a reliability-based design optimiza-tion in terms of a prescribed maximum probability of failure. Gha-semi et al. [18] proposed a Kriging metamodel-based probabilisticoptimization procedure. By linking the different scales (nano-,micro-, meso- and macro-scales) by multi-scale analysis, theEshelby–Mori–Tanaka model and finite element method, they con-sidered three different uncertainty sources: material uncertainties(length, waviness, agglomeration, orientation and dispersion ofCNTs), structural uncertainties (geometry, boundary and loadingconditions) and modeling uncertainties (discretization and approx-imation errors). Their results showed that the failure probabilitystrongly depends on the CNT parameters, especially the CNT vol-ume fraction and the waviness. In addition, they also concludedthat the influence of the CNT agglomeration is nearly negligible.
The objective of the present study is to investigate the effects ofthe randomness in CNT distribution coupled with the materialuncertainties on the vibrational properties of FG-CNTRC plates.Most researchers restrict the aim of their studies to the analysisof composite materials with uniform or linear grading profiles.However, because of its manufacturing complexity, FG-CNTRCstructures may be expected to present process-induced uncertain-ties that make these linear distributions rather improbable. Thus,two main sources of uncertainty are considered: uncertainty inthe material properties (matrix/CNT) and uncertainty in the rein-forcement grading profile which, in turn, propagates the prior
uncertainties within the thickness of the specimen. To increasethe computational efficiency, the expensive-to-evaluate finite ele-ment model is surrogated by two metamodels, Kriging and High-Dimensional Model Representations (RS-HDMR). In these twocases, the actual finite element model is replaced by a responsesurface model, making the process computationally efficient andcost effective. Random samples are drawn uniformly over theentire domain ensuring good prediction capability of the con-structed metamodels in the whole design space including the tailregions. The experience in the application of these techniques forthe uncertainty analysis of composite materials is extensive andwith excellent results. The RS-HDMR approach has been employedin many different fields [19–21]. The uncertainty of the dynamiccharacteristics of angle-ply composite plates was studied by Sudipet al. [22], as well as the effects of noise on stochastic frequencyresponse functions [23] and thermal uncertainty propagation inlaminated composite plates [24]. Sudip et al. [25] also employedthe Kriging metamodel to analyze the uncertainty propagation inthe free vibration characteristics of laminated shallow doublycurved shells. In this paper, in order to cross-validate the resultsfor constructing the metamodels, a sensitivity analysis is carriedout. Furthermore, the efficacy of both metamodels are comparedto direct Monte Carlo simulation (MCS) with accurate results anda drastic reduction of computation cost. Motivated by [16], a finiteelement formulation based on a modified Hu-Washizu potentialprinciple is employed. Four-noded elements with five degrees offreedom at each node are implemented with consideration oftransverse shear strains by first-order shear deformation theory(FSDT). The element is consistently formulated by independentapproximations of displacements (bilinear), strains and stresses(piecewise constant within subregions). The paper is organizedas follows, Section 2: definition of functionally graded carbon nan-otube plates; Section 3: finite element formulation; Section 4: Sur-rogate modeling: Kriging and RS-HDMR metamodels; Section 5:results and discussion; and Section 6: Conclusions.
2. Functionally graded CNTRC plates
In the present paper, FG-CNTRC plates with uniform thicknessh, length a and width b are considered as shown in Fig. 1. Alsoshown are the four most popular linear reinforcement grading pro-files in the literature. UD-CNTRC represents the uniform distribu-tion and FG-V, FG-O and FG-X CNTRC are linear functionallygraded distributions of carbon nanotubes in the thickness directionof the composite plates. The effective material properties of thetwo-phase nanocomposites mixture of uniaxially aligned CNTsreinforcements and a polymeric matrix, can be estimated accord-ing to the Mori–Tanaka scheme [26] or the rule of mixtures[3,27]. The accuracy of the extended rule of mixtures (EROM) hasbeen widely discussed and a remarkable synergism with theMori–Tanaka scheme for functionally graded ceramic–metalbeams is reported in [28]. For simplicity and convenience, in thepresent study, the extended rule of mixture was employed byintroducing the CNT efficiency parameters and the effective mate-rial properties of CNTRC plates can thus be written as [10]
E11 ¼ g1VCNTECNT11 þ VmE
m ð1aÞg2
E22¼ VCNT
ECNT22
þ Vm
Em ð1bÞ
g3
G12¼ VCNT
GCNT12
þ Vm
Gm ð1cÞ
where ECNT11 ; ECNT
22 and GCNT12 indicate the Young’s moduli and shear
modulus of SWCNTs, respectively, and Em and Gm represent the cor-responding properties of the isotropic matrix. To account for the

(a) (b)
(c) (d)
Fig. 1. Geometry and linear configurations of the functionally graded carbon nanotube-reinforced (FG-CNTRC) plates. (a) UD CNTRC plate; (b) FG-V CNTRC plate; (c) FG-OCNTRC plate; (d) FG-X CNTRC plate.
E. García-Macías et al. / Composite Structures 152 (2016) 183–198 185
scale-dependent material properties, the CNT efficiency parameters,gj (j = 1,2,3), were introduced and can be calculated by matching theeffective properties of the CNTRC obtained from a moleculardynamics (MD) or multi-scale simulation with those from the ruleof mixtures. VCNT and Vm are the volume fractions of the carbonnanotubes and matrix, respectively, and the sum of the volume frac-tions of the two constituents should equal unity. Similarly, the ther-mal expansion coefficients, a11 and a22, in the longitudinal andtransverse directions respectively, Poisson’s ratio m12 and the den-sity q of the nanocomposite plates can be determined in the sameway as
m12 ¼ VCNTmCNT12 þ Vmmm ð2aÞq ¼ VCNTqCNT þ Vmqm ð2bÞa11 ¼ VCNTaCNT
11 þ Vmam ð2cÞa22 ¼ ð1þ mCNT12 ÞVCNTaCNT
22 þ ð1þ mmÞVmam � m12a11 ð2dÞwhere mCNT12 and mm are Poisson’s ratios, and aCNT
11 ;aCNT22 and am are the
thermal expansion coefficients of the CNT and matrix, respectively.Note that m12 is considered to be constant over the thickness of thefunctionally graded CNTRC plates. The other effective mechanicalproperties are defined as follows
E33 ¼ E22; G13 ¼ G12; G23 ¼ 12
E22
1þ m23;
m13 ¼ m12; m31 ¼ m21; m32 ¼ m23 ¼ m21;
m21 ¼ m12E22
E11
ð3Þ
The uniform and three types of linear functionally graded distribu-tions of the carbon nanotubes along the thickness direction of thenanocomposite plates shown in Fig. 1 are assumed to be
VCNT ¼ V�CNT ðUD CNTRCÞ
VCNT ¼ 4 zj jh
V�CNT ðFG-X CNTRCÞ
VCNT ¼ 1þ 2zh
� �V�
CNT ðFG-V CNTRCÞ
VCNT ¼ 2 1� 2 zj jh
� �V�
CNT ðFG-O CNTRCÞ
ð4Þ
In the present work, the source of uncertainty in the reinforce-ment grading profile is considered as a variation from the lineardistribution. In order to take into account this effect, a general dis-
tribution shape function f ðzÞ can be implemented. For a given vol-ume fraction of inclusions V�
CNT , the distribution of CNTs as afunction of the z coordinate can be derived as
VCNTðzÞ ¼ V�CNT �
f ðzÞ � hR h=2�h=2 f ðzÞdz
ð5Þ
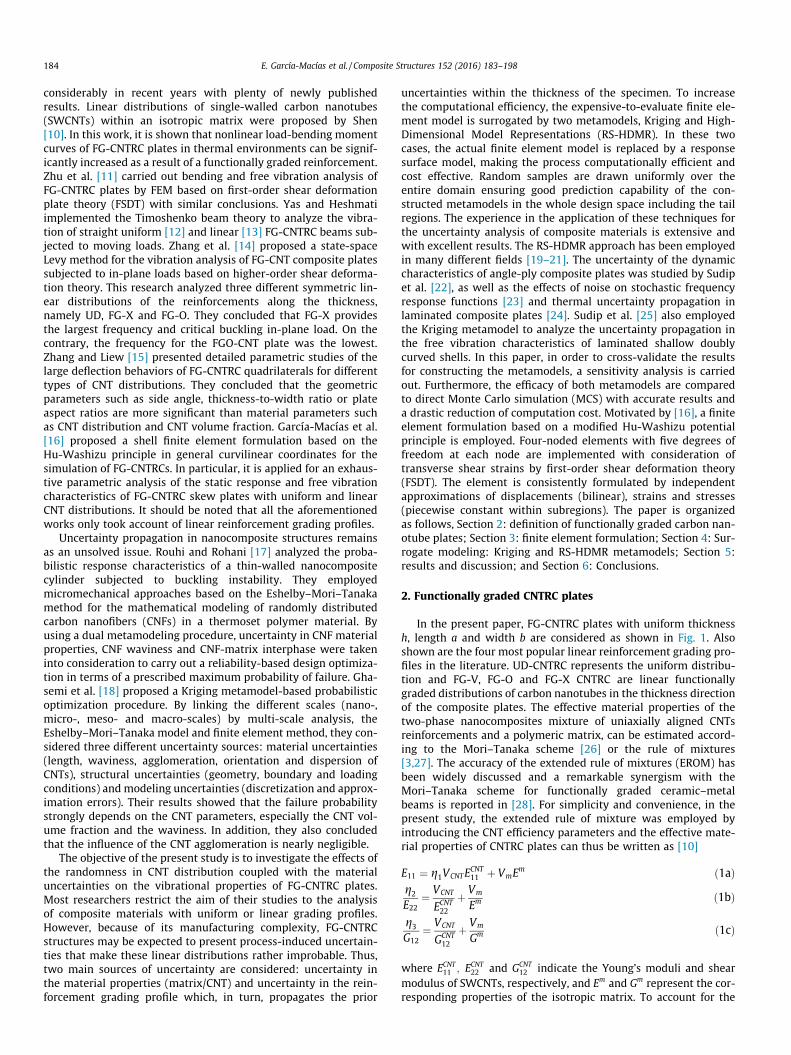
Different expressions for this distribution shape function can beassumed. Some of the most employed distributions in the litera-ture are power-law functions (P-FGM), exponential functions (E-FGM) and sigmoid functions (S-FGM) [29]. In the present paper,P-FGM is selected. For instance, in the case of FG-V and FG-X dis-tributions, the CNT volume fraction defined by P-FGM, P-FGV andP-FGX respectively, adopts the following expressions
f ðzÞ ¼ h� 2z2h
� �k
ðP-FGVÞ
f ðzÞ ¼2h z� �k 0 6 z 6 h
2
� 2h z
� �k � h2 6 z 6 0
8<: ðP-FGXÞ
ð6Þ
where the variation around the linear case (k ¼ 1) is controlled bythe power-law index k. Fig. 2 shows the different profiles obtainedby P-FGV and P-FGX for different values of the power law index.
3. Finite element formulation
Consider CNTRC plate of length a, width b and thickness t asshown in Fig. 1. In this section, the more general theoretical formu-lation developed in [16] is adopted here for the case of flat rectan-gular shells. Denoting by UðcÞ the strain energy and by c and r thevectors containing the strain and stress components, respectively,a modified potential of Hu-Washizu assumes the form [30]
PHW ½v; c;r� ¼ZV½UðcÞ � rT ðc� DvÞ �Pb�dV
�ZSv
ðv � vÞrndS�ZSt
Pt dS ð7Þ
In Eq. (7), v and the index b represent the displacement vector andthe body forces, respectively, whereas v are prescribed displace-ments on the part of the boundary in which displacements are pre-scribed ðSvÞ.
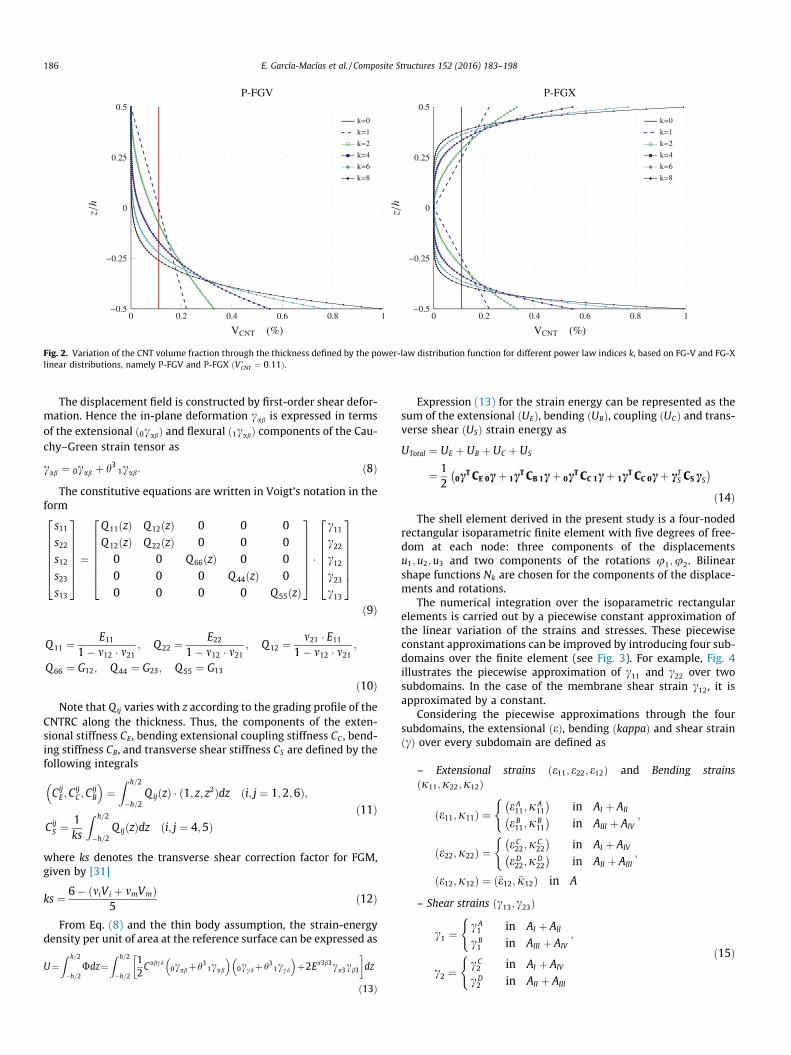
Fig. 2. Variation of the CNT volume fraction through the thickness defined by the power-law distribution function for different power law indices k, based on FG-V and FG-Xlinear distributions, namely P-FGV and P-FGX ðV�
CNT ¼ 0:11Þ.
186 E. García-Macías et al. / Composite Structures 152 (2016) 183–198
The displacement field is constructed by first-order shear defor-mation. Hence the in-plane deformation cab is expressed in termsof the extensional ð0cabÞ and flexural ð1cabÞ components of the Cau-chy–Green strain tensor as
cab ¼ 0cab þ h3 1cab: ð8ÞThe constitutive equations are written in Voigt’s notation in the
form
s11s22s12s23s13
26666664
37777775¼
Q11ðzÞ Q12ðzÞ 0 0 0Q12ðzÞ Q22ðzÞ 0 0 0
0 0 Q66ðzÞ 0 00 0 0 Q44ðzÞ 00 0 0 0 Q55ðzÞ
26666664
37777775�
c11c22c12c23c13
26666664
37777775
ð9Þ
Q11 ¼ E11
1� m12 � m21 ; Q22 ¼ E22
1� m12 � m21 ; Q12 ¼ m21 � E11
1� m12 � m21 ;Q66 ¼ G12; Q44 ¼ G23; Q55 ¼ G13
ð10ÞNote that Qij varies with z according to the grading profile of the
CNTRC along the thickness. Thus, the components of the exten-sional stiffness CE, bending extensional coupling stiffness CC , bend-ing stiffness CB, and transverse shear stiffness CS are defined by thefollowing integrals
CijE;C
ijC ;C
ijB
� �¼
Z h=2
�h=2QijðzÞ � ð1; z; z2Þdz ði; j ¼ 1;2;6Þ;
CijS ¼ 1
ks
Z h=2
�h=2QijðzÞdz ði; j ¼ 4;5Þ
ð11Þ
where ks denotes the transverse shear correction factor for FGM,given by [31]
ks ¼ 6� ðmiV i þ mmVmÞ5
ð12Þ
From Eq. (8) and the thin body assumption, the strain-energydensity per unit of area at the reference surface can be expressed as
U¼Z h=2
�h=2Udz¼
Z h=2
�h=2
12Cabcd
0cabþh3 1cab� �
0ccdþh31ccd� �
þ2Ea3b3ca3cb3
� dz
ð13Þ
Expression (13) for the strain energy can be represented as thesum of the extensional ðUEÞ, bending ðUBÞ, coupling ðUCÞ and trans-verse shear ðUSÞ strain energy as
UTotal ¼ UE þ UB þ UC þ US
¼ 12 0c
T CE 0cþ 1cT CB 1cþ 0c
T CC 1cþ 1cT CC 0cþ cTS CS cS
� �ð14Þ
The shell element derived in the present study is a four-nodedrectangular isoparametric finite element with five degrees of free-dom at each node: three components of the displacementsu1;u2;u3 and two components of the rotations u1;u2. Bilinearshape functions Nk are chosen for the components of the displace-ments and rotations.
The numerical integration over the isoparametric rectangularelements is carried out by a piecewise constant approximation ofthe linear variation of the strains and stresses. These piecewiseconstant approximations can be improved by introducing four sub-domains over the finite element (see Fig. 3). For example, Fig. 4illustrates the piecewise approximation of c11 and c22 over twosubdomains. In the case of the membrane shear strain c12, it isapproximated by a constant.
Considering the piecewise approximations through the foursubdomains, the extensional eð Þ, bending kappað Þ and shear straincð Þ over every subdomain are defined as
– Extensional strains ðe11; e22; e12Þ and Bending strainsðj11;j22;j12Þ
e11;j11ð Þ ¼ e A11;j A
11
� �in AI þ AII
e B11;j B
11
� �in AIII þ AIV
(;
e22;j22ð Þ ¼ e C22;j C
22
� �in AI þ AIV
eD22;jD
22
� �in AII þ AIII
(;
e12;j12ð Þ ¼ �e12; �j12ð Þ in A
– Shear strains ðc13; c23Þ
c1 ¼ c A1 in AI þ AII
c B1 in AIII þ AIV
(;
c2 ¼ c C2 in AI þ AIV
cD2 in AII þ AIII
( ð15Þ

Fig. 3. Subdomain areas throughout the isoparametric rectangular finite element.
E. García-Macías et al. / Composite Structures 152 (2016) 183–198 187
As a consequence of this approximation, the strain energy termin the Hu-Washizu variational principle takes the form ofZAUdA ¼ 1
2�e T �DE �eþ 1
2�j T �DB �jþ 1
2�e T �DC �jþ 1
2�j T �DC �eþ 1
2�cT �DS �c
ð16Þwhere the vectors �e; �j and �c are defined by
�e ¼
eA11
eB11eC22eD222e12
8>>>>>><>>>>>>:
9>>>>>>=>>>>>>;; �j ¼
jA11
jB11
jC22
jD22
2j12
8>>>>>><>>>>>>:
9>>>>>>=>>>>>>;; �c ¼
cA1
cB1cC2cD2
8>>><>>>:
9>>>=>>>;
ð17Þ
The matrices �DE; �DB; �DC and �DS are the discretized elasticity matri-ces according to the four subdomains. In addition, by introducingthe matrices
Fig. 4. Schematic representation of the piecewise c
AN ¼ AM ¼ diag AI þ AII;AIII þ AIV ;AI þ AIV ;AII þ AIII;Af g; ð18aÞ
AQ ¼ diag AI þ AII;AIII þ AIV ;AI þ AIV ;AII þ AIIIf g ð18bÞalong with the discretized strain–displacement relationships, thebilinear approximations for the displacements and rotations, andalso the discrete parameters for the strains and stresses, the discreteform of the generalized variational principle of Hu-Washizu is givenby
PHW ¼ 12�e T �DE �eþ 1
2�jT �DB �jþ 1
2�e T �DC �jþ 1
2�jT �DC �e
þ 12�cT �DS �c� 1
2NT AN �eþ �e T ANN
� �� 12
MT AM �jþ �jT AMM� �
� 12
Q T AQ �cþ �cT AQ Q� �
þ 12
NT EDþ D T EN� �
þ 12
M T BDþ D T BM� �
þ 12
Q T GDþ D T GQ� �
ð19Þ
with N; M and Q the discretized stress resultants similarly to Eqs.(17). The Hu-Washizu variational principle establishes that if thevariation is taken with respect to nodal displacements and rotations(D), strains, and stresses, then all field equations of elasticity and allboundary conditions appear as Euler–Lagrange equations. In partic-ular, the stationary condition for the functional dPHW ¼ 0ð Þenforces, after some algebraic manipulation, the discrete equilib-rium in terms of nodal displacements and rotations as
KExtension þ KBending þ KCoupling þ KShear
�D ¼ p ð20Þ
Therefore, the stiffness matrix, K20�20, is defined by the sum ofthe following four terms
KExtension ¼ A�1N
�DEA�1N E; ð21Þ
KBending ¼ B T A�1M
�DFA�1M B; ð22Þ
KCoupling ¼ B T A�1M
�DCA�1N Eþ E T A�1
N�DCA
�1M B; ð23Þ
KShear ¼ GT A�1Q
�DSA�1Q G: ð24Þ
The eigenvalue problem for the undamped free vibration prob-lem takes the well-known form
onstant extensional strain eð Þ approximation.
188 E. García-Macías et al. / Composite Structures 152 (2016) 183–198
Ku ¼ x2Mu; ð25Þwhere K is the stiffness matrix of the system, u represents theeigenvectors, x is the natural frequency in rad/s and M is the massmatrix of the structure. The consistent element mass matrix isderived by discretizing the kinetic energy
dUK ¼ 12
ZVq2v d€vdV ; ð26Þ
and by employing the displacement field defined by first-ordershear deformation, the consistent mass matrix can be representedby
M ¼
M11 M12 M13 M14
M22 M23 M24
M33 M34
sym M44
26664
37775
20�20
ð27Þ
Every Mij term of the mass matrix, where i and j represent therow and the column respectively, assumes the following form
Mij¼
RA I1NiNjdA
RA�I1NiNjdA 0
RA I2NiNjdA
RA�I2NiNjdAR
A I1NiNjdA 0RA�I2NiNjdA
RA I2NiNjdAR
A I1NiNjdA 0 0RA I3NiNjdA
RA�I3NiNjdA
symRA I3NiNjdA
26666664
37777775
5�5
ð28Þ
where the terms I1; I2; I3 are defined by
I1 ¼Z h=2
�h=2qðzÞdz; I2 ¼
Z h=2
�h=2qðzÞ � zdz;
I3 ¼Z h=2
�h=2qðzÞ � z2dz ð29Þ
4. Surrogate modeling
In this section, two metamodels are introduced, Kriging andrandom sampling high dimensional model representation (RS-HDMR). In general, a surrogate model is an approximation of theInput/Output of a main model. The main purpose of a surrogatemodel is to fit the outcome obtained by a large model, costly interms of computation, in a more compact and cost-effective way.There are a set of m observations, so called design sites
X ¼ ½x1; . . . ; xm�T with xi 2 Rn, and a set of corresponding outputsY ¼ ½y1; . . . ; ym�T with yi 2 Rq.
4.1. Kriging metamodel
The Kriging model, originated in geostatistics [32], is a com-monly used method of interpolation (prediction) for spatial data.This model expresses the unknown function of interest yðxÞ for an dimensional input x#D#Rn, as the sum of a regression modelyrðxÞ and a stochastic function FðxÞ as follows [33]
yðxÞ ¼ yrðxÞ þ FðxÞ ð30Þthe function FðxÞ is the realization of a stochastic process withmean zero, variance r2 and non-zero covariance, yrðxÞ is a knownregression function dependent on p regression parametersb ¼ b1; . . . ;bp
�and defined functions f j : R
n ! R [34]
yrðb; xÞ ¼ f ðxÞTb ð31Þ
It can be understood that yrðxÞ globally approximates the designspace, meanwhile FðxÞ creates the localized deviations so that theKriging model interpolates the m-sampled data points. The covari-ance matrix of FðxÞ is
Cov FðxiÞFðx jÞ � ¼ r2R Rðh; xi; x jÞ � ð32Þ
between any two of the m-sampled data points xi and x j. R is am�m symmetric matrix with ones along the diagonal.Rij ¼ Rðh; xi; x jÞ is the correlation model with parametersh ¼ h1; . . . ; h�l
�. The user can specify a wide variety of correlation
functions [35–37] dependent on h parameters. For example, in thecase of a Gaussian correlation function
Rðxi; x jÞ ¼ exp �X�l
k¼1
hk xik � x jk
��� ���2" #
ð33Þ
The relation between the predicted estimates, yðxÞ of theresponse yðxÞ at an untried point x is defined by the Kriging predic-tor as follows
yðxÞ ¼ f ðxÞT � b� þ rðxÞTðY � F � b�Þ ð34Þwhere Y is a column vector of length m that contains the samplevalues of the frequency responses and F is the m� p observabilitymatrix Fij ¼ f jðxiÞ. rðxÞ is a vector with the correlations betweenthe design sites and x:
rTðxÞ ¼ Rðh; x1; xÞ; . . . ;Rðh; xm; xÞ½ �T ð35ÞThe regression problem F � b � Y has the generalized least
squares solution
b� ¼ ðFT � R�1FÞ�1 � FT � R�1 � Y ð36Þ
and the variance estimate
r2 ¼ 1m
Y � F � b�ð ÞT � R�1 � Y � F � b�ð Þ ð37Þ
The matrix R and therefore b� and r2, depend on h. The optimalchoice of h� is defined as the maximum likelihood estimator (e.g.best guesses), i.e. the maximizer of
maxh>0
:CðhkÞ ¼ 12ðm � lnr2 þ ln Rj jÞ ð38Þ
where Rj j is the determinant of R. This optimization process resultsin a k-dimensional unconstrained non-linear optimization problem.Note that for a given set of design data the matrices b� and theparameters hk are fixed. For every new x we just have to computethe vectors f ðxÞ 2 Rp and x 2 Rm and add two simple products. Afterobtaining the Kriging surrogate model, it is possible to compute anapproximation error to evaluate the accuracy of the predictedresults. The mean squared error ðMSEÞ of the predictor is defined by
MSE ¼ E ðyðxÞ � yðxÞÞ2h i
ð39Þ
4.2. Random sampling HDMR
The random sampling high dimensional model representation(RS-HDMR) method is a set of tools explored by Rabitz et al. [38]in order to express the input–output mapping of a high dimen-sional model with a large number of input variables and a reducednumber of samples [39,40]. The relationship between the input
X ¼ ½x1; . . . ; xm�T and output variables X ¼ ½f ðx1Þ; . . . ; f ðxmÞ�T isexpressed as [41,42]:
E. García-Macías et al. / Composite Structures 152 (2016) 183–198 189
f ðXÞ ¼ f 0 þXni¼1
f iðxiÞ þX
16i<j6n
f ijðxi; xjÞ þ � � �
þ f 12...nðx1; x2; . . . ; xmÞ ð40Þhere the term f 0 is a constant (zeroth order) that stands for themean contribution of all the inputs to the outputs. The functionf iðxiÞ is a first order term giving the effect of variable xi acting inde-pendently upon the output f ðXÞ. The function f ijðxi; xjÞ is a secondorder term describing the cooperative effects of the xi and xj uponthe output f ðXÞ. The higher order terms reflect the cooperativeeffects of increasing numbers of input variables acting together toinfluence the output f ðXÞ. The last term, f ð12...mÞðx1; x2; . . . ; xmÞ,reflects any residual mth order correlated contribution of all inputvariables. In most cases, terms up to second order are enough toprovide accurate results [43]. The component functions are deter-mined through and averaging process. Firstly, all the input variablesare rescaled in the range 0;1½ �. Hence, the output response functionis defined in the domain of a unit hypercube Km ¼ ðx1; x2; . . . ; xmÞ;fi ¼ 1; ;mg. The component functions of the RS-HDMR have the fol-lowing form:
f 0 ¼ZKm
f ðxÞdx ð41aÞ
f iðxiÞ ¼ZKm�1
f ðxÞdxi � f 0 ð41bÞ
f ijðxi; xjÞ ¼ZKm�2
f ðxÞdxij � f iðxiÞ � f 0 ð41cÞ
where dxi stands for the product dx1dx2 . . .dxn without dxi whereasdxij denotes the same product without dxi and dxj. The last termf 12...nðx1; x2; . . . ; xnÞ is evaluated from the difference between f ðxÞand all the other component functions. The zeroth order term f 0is calculated by the average value of all f ðXÞ. The determination ofthe higher component functions requires the evaluation of high-dimensional integrals that can be approximately calculated bydirect Monte-Carlo integration. However this integration requireshigh computational cost. Approximations by analytical basis func-tions, such as orthonormal polynomials, provide accurate resultswith considerably less sampling effort. Thus the first and secondorder component functions are expressed as
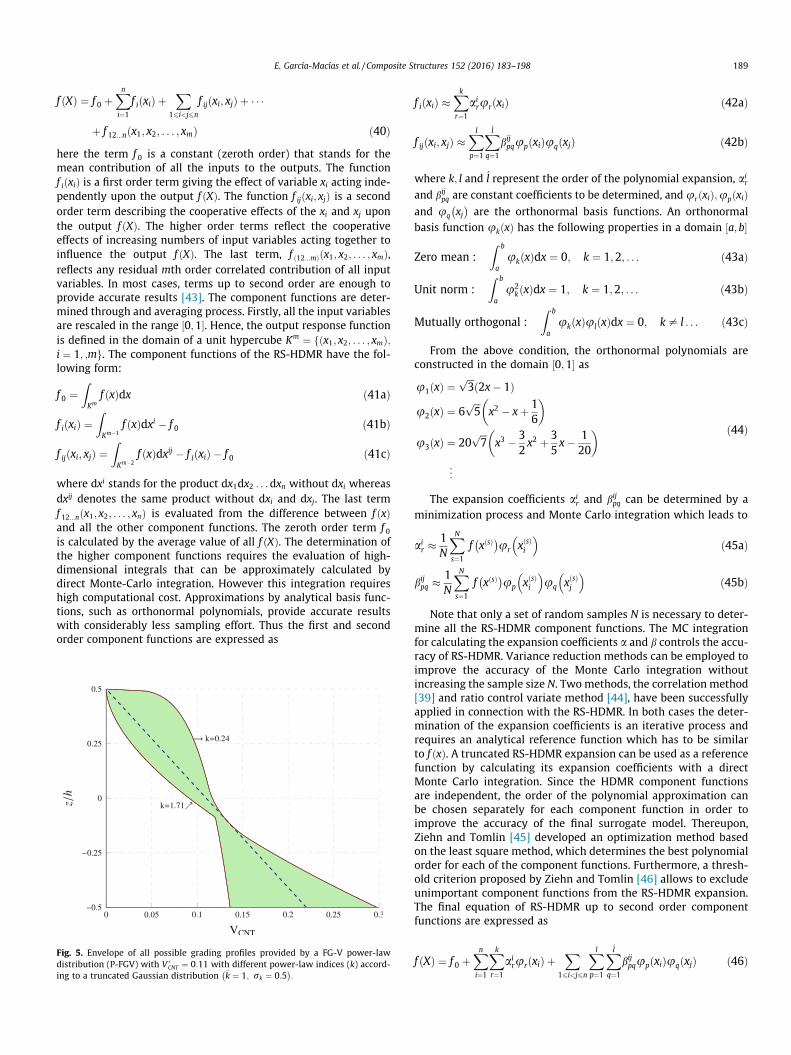
Fig. 5. Envelope of all possible grading profiles provided by a FG-V power-lawdistribution (P-FGV) with V�
CNT ¼ 0:11 with different power-law indices (k) accord-ing to a truncated Gaussian distribution �k ¼ 1; rk ¼ 0:5
� �:
f iðxiÞ �Xk
r¼1
airurðxiÞ ð42aÞ
f ijðxi; xjÞ �Xl
p¼1
X�l
q¼1
bijpqupðxiÞuqðxjÞ ð42bÞ
where k; l and �l represent the order of the polynomial expansion, air
and bijpq are constant coefficients to be determined, and ur xið Þ;up xið Þ
and uq xj� �
are the orthonormal basis functions. An orthonormalbasis function ukðxÞ has the following properties in a domain a; b½ �
Zero mean :Z b
aukðxÞdx ¼ 0; k ¼ 1;2; . . . ð43aÞ
Unit norm :Z b
au2
kðxÞdx ¼ 1; k ¼ 1;2; . . . ð43bÞ
Mutually orthogonal :Z b
aukðxÞulðxÞdx ¼ 0; k– l . . . ð43cÞ
From the above condition, the orthonormal polynomials areconstructed in the domain 0;1½ � asu1ðxÞ ¼
ffiffiffi3
p2x� 1ð Þ
u2ðxÞ ¼ 6ffiffiffi5
px2 � xþ 1
6
� �
u3ðxÞ ¼ 20ffiffiffi7
px3 � 3
2x2 þ 3
5x� 1
20
� �
..
.
ð44Þ
The expansion coefficients air and bij
pq can be determined by aminimization process and Monte Carlo integration which leads to
air �
1N
XNs¼1
f xðsÞ� �
ur xðsÞi
� �ð45aÞ
bijpq �
1N
XNs¼1
f xðsÞ� �
up xðsÞi
� �uq xðsÞj
� �ð45bÞ
Note that only a set of random samples N is necessary to deter-mine all the RS-HDMR component functions. The MC integrationfor calculating the expansion coefficients a and b controls the accu-racy of RS-HDMR. Variance reduction methods can be employed toimprove the accuracy of the Monte Carlo integration withoutincreasing the sample size N. Two methods, the correlation method[39] and ratio control variate method [44], have been successfullyapplied in connection with the RS-HDMR. In both cases the deter-mination of the expansion coefficients is an iterative process andrequires an analytical reference function which has to be similarto f ðxÞ. A truncated RS-HDMR expansion can be used as a referencefunction by calculating its expansion coefficients with a directMonte Carlo integration. Since the HDMR component functionsare independent, the order of the polynomial approximation canbe chosen separately for each component function in order toimprove the accuracy of the final surrogate model. Thereupon,Ziehn and Tomlin [45] developed an optimization method basedon the least square method, which determines the best polynomialorder for each of the component functions. Furthermore, a thresh-old criterion proposed by Ziehn and Tomlin [46] allows to excludeunimportant component functions from the RS-HDMR expansion.The final equation of RS-HDMR up to second order componentfunctions are expressed as
f ðXÞ ¼ f 0 þXni¼1
Xk
r¼1
airurðxiÞ þ
X16i<j6n
Xl
p¼1
X�l
q¼1
bijpqupðxiÞuqðxjÞ ð46Þ
190 E. García-Macías et al. / Composite Structures 152 (2016) 183–198
4.3. Stochastic approach using Kriging and RS-HDMR
Two main sources of stochasticity are considered for FG-CNTplates: the material properties of the composite phases such asthe elastic modulus and the Poisson’s ratio of the isotropic matrix,mass densities of the matrix and the CNTs, longitudinal and trans-verse elastic modulus of the CNTs and volume fraction of CNTs, aswell as variations with respect to the linear distribution of CNTs bya power-law model, defined by the power-law index k. A variationof �10% of the uniformly distributed input parameters is assumedfor the material variables. In the case of randomness in the CNTsdistribution, a truncated Gaussian distribution is set up with amean value of �k ¼ 1 and a standard deviation of rk ¼ 0:2 in therange 0 6 k 6 2. Fig. 5 shows the envelope of all the possible P-FGV reinforcement grading profiles with V�
CNT ¼ 0:11 provided bythe truncated Gaussian distribution. The random variables men-tioned above are examined in three sequential stages:
(a) Variation of the material parameters ðk ¼ 1Þ : Em;qm;Vm;fECNT11 ; ECNT
22 ;qCNT ;VCNTg(b) Variation of the reinforcement grading profile: kf g(c) Combined variation of (a) and (b).
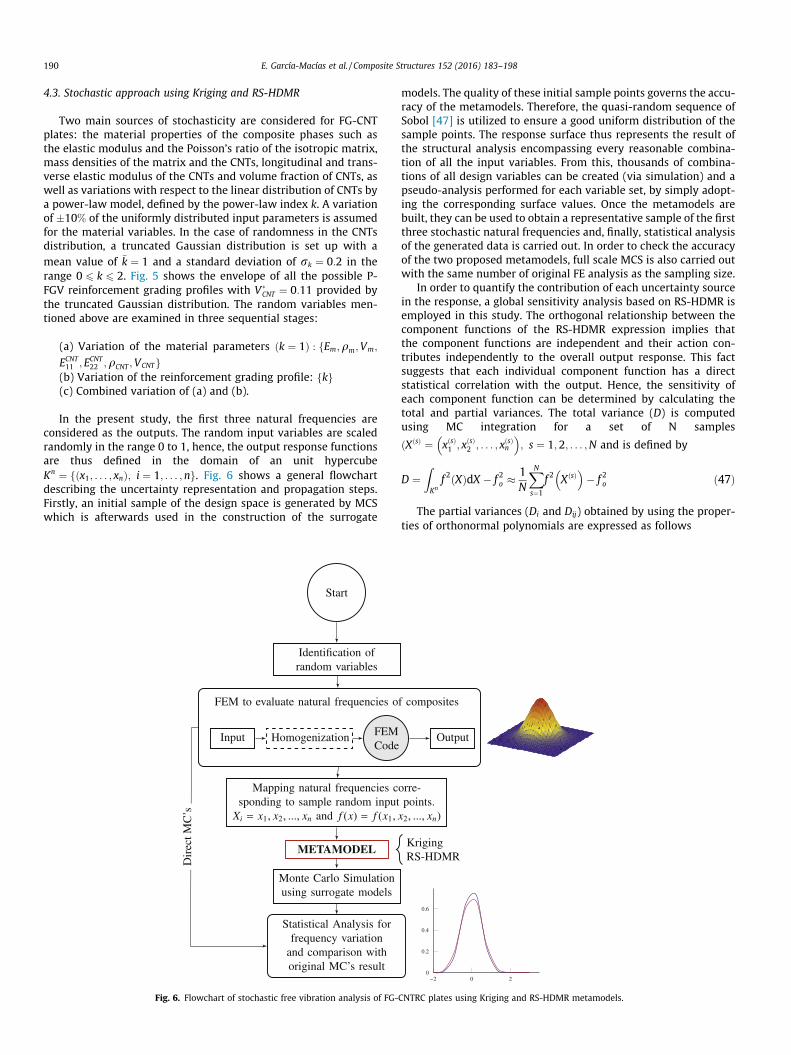
In the present study, the first three natural frequencies areconsidered as the outputs. The random input variables are scaledrandomly in the range 0 to 1, hence, the output response functionsare thus defined in the domain of an unit hypercubeKn ¼ x1; . . . ; xnð Þ; i ¼ 1; . . . ;nf g. Fig. 6 shows a general flowchartdescribing the uncertainty representation and propagation steps.Firstly, an initial sample of the design space is generated by MCSwhich is afterwards used in the construction of the surrogate
Fig. 6. Flowchart of stochastic free vibration analysis of FG-
models. The quality of these initial sample points governs the accu-racy of the metamodels. Therefore, the quasi-random sequence ofSobol [47] is utilized to ensure a good uniform distribution of thesample points. The response surface thus represents the result ofthe structural analysis encompassing every reasonable combina-tion of all the input variables. From this, thousands of combina-tions of all design variables can be created (via simulation) and apseudo-analysis performed for each variable set, by simply adopt-ing the corresponding surface values. Once the metamodels arebuilt, they can be used to obtain a representative sample of the firstthree stochastic natural frequencies and, finally, statistical analysisof the generated data is carried out. In order to check the accuracyof the two proposed metamodels, full scale MCS is also carried outwith the same number of original FE analysis as the sampling size.
In order to quantify the contribution of each uncertainty sourcein the response, a global sensitivity analysis based on RS-HDMR isemployed in this study. The orthogonal relationship between thecomponent functions of the RS-HDMR expression implies thatthe component functions are independent and their action con-tributes independently to the overall output response. This factsuggests that each individual component function has a directstatistical correlation with the output. Hence, the sensitivity ofeach component function can be determined by calculating thetotal and partial variances. The total variance (D) is computedusing MC integration for a set of N samples
ðX sð Þ ¼ x sð Þ1 ; x sð Þ
2 ; . . . ; x sð Þn
� �; s ¼ 1;2; . . . ;N and is defined by
D ¼ZKn
f 2ðXÞdX � f 2o � 1N
XNs¼1
f 2 X sð Þ� �
� f 2o ð47Þ
The partial variances (Di and Dij) obtained by using the proper-ties of orthonormal polynomials are expressed as follows
CNTRC plates using Kriging and RS-HDMR metamodels.

Table 1Mean material properties of polyf(m-phenylenevinylene)-co-[(2,5-dioctoxy-p-phe-nylene) vinylene]g (PmPV) [11] at room temperature of 300 K and (10,10) singlewalled carbon nanotubes (SWCNT) [49].
(10,10) SWCNT [49] PmPv (T = 300 K) [11]
ECNT11 ¼ 5:6466 TPa Em ¼ 2:1 GPa
ECNT22 ¼ 7:0800 TPa mm ¼ 0:34
GCNT12 ¼ 1:9445 TPa
mCNT12 ¼ 0:175
E. García-Macías et al. / Composite Structures 152 (2016) 183–198 191
Di ¼Z 1
0f 2i ðxiÞdxi �
Z 1
0
Xk
r¼1
airurðxiÞ
" #2
dxi ¼Xk
r¼1
air
� �2 ð48aÞ
Dij ¼Z 1
0
Z 1
0f 2ijðxi; xjÞdxidxj
�Z 1
0
Z 1
0
Xl
p¼1
X�l
q¼1
bijpqupðxiÞuqðxjÞ
" #¼
Xl
p¼1
X�l
q¼1
bpq
� �2 ð48bÞ
Fig. 7. Convergence of errors of the first three frequency parameters (ki , i ¼ 1;2;3) with rFG-CNTRC plates (a=b ¼ 1, h=b ¼ 0:1 and �V�
CNT ¼ 0:11).
Table 2Convergence study for the coefficient of determination R2
� �and maximum error (ME) of th
(a=b ¼ 1, h=b ¼ 0:1 and �V�CNT ¼ 0:11).
Sample size Metamodel Parameter
64 Kriging R2
ME(%)RS-HDMR R2
ME(%)
128 Kriging R2
ME(%)RS-HDMR R2
ME(%)
256 Kriging R2
ME(%)RS-HDMR R2
ME(%)
512 Kriging R2
ME(%)RS-HDMR R2
ME(%)
Finally, the sensitivity indices (Si1 ;...;is ) are given by
Si1 ;...;is ¼Di1 ;...;is
D; 1 6 i1 6 i2 . . . 6 in 6 n ð49Þ
so that,Pn
i¼1Si þPn
16i<j6nSij þ � � � þ S1;2;...n ¼ 1.The quality of the proposed approximations is appraised by
checking the coefficient of determination ðR2Þ. To ensure accuracy,the value of R2 must be close to one and is expressed as
R2 ¼ SSRSST
¼ 1� SSESST
ð0 6 R2 6 1Þ ð50Þ
where SST ¼ SSE þ SSR is the total sum of squares, and SSR and SSEare the regression sum of squares and the residual sum of squares,respectively. The quality of the surrogate models can also be deter-mined by the Relative Error ðREÞ, computed as
REð%Þ ¼ F � F 0�� ��F
� 100 ð51Þ
espect to the results provided by Zhu et al. [11] and to the mesh size (N�N) of CCCC
e Kriging and RS-HDMR metamodels with different sample sizes of CCCC P-FGV plates
k1 k2 k3
99.998 99.996 99.999
0.067 0.091 0.05998.839 98.688 98.894
1.141 1.321 1.131
99.999 99.997 99.999
0.058 0.084 0.05398.793 98.793 98.810
1.054 1.103 1.047
99.999 99.999 99.999
0.044 0.040 0.04099.918 99.536 99.940
0.569 0.745 0.511
99.999 99.998 99.999
0.048 0.056 0.03899.924 99.546 99.948
0.529 0.718 0.382
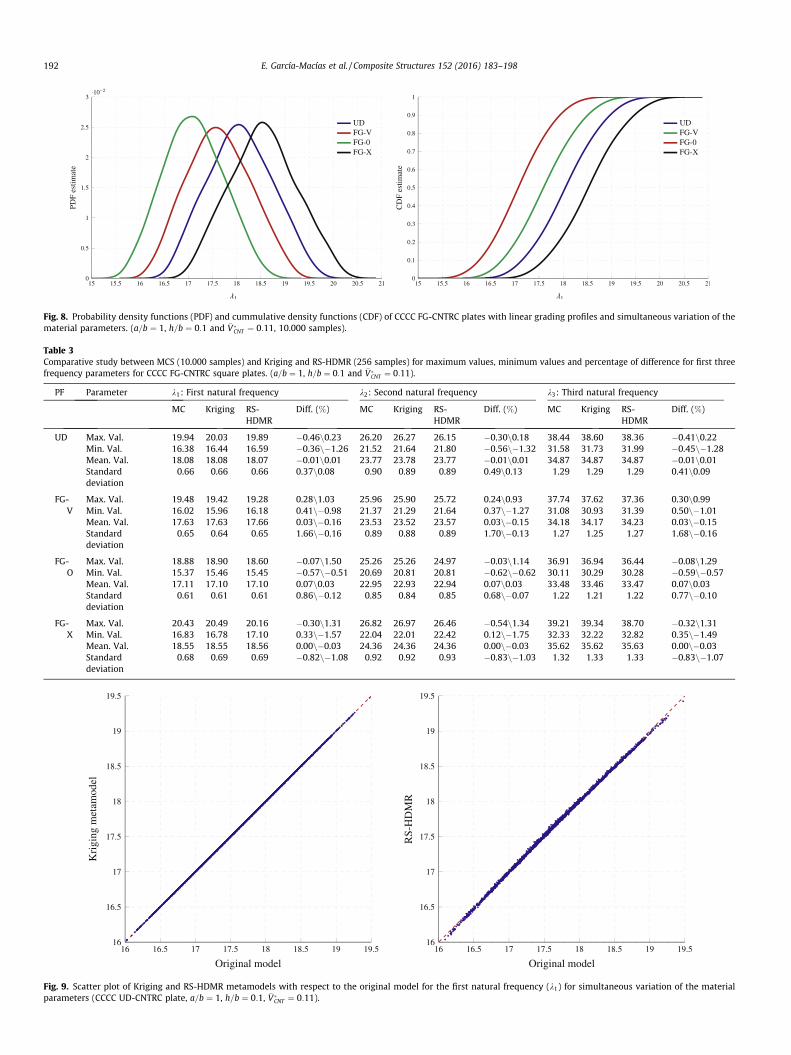
Fig. 8. Probability density functions (PDF) and cummulative density functions (CDF) of CCCC FG-CNTRC plates with linear grading profiles and simultaneous variation of thematerial parameters. (a=b ¼ 1, h=b ¼ 0:1 and �V�
CNT ¼ 0:11, 10.000 samples).
Table 3Comparative study between MCS (10.000 samples) and Kriging and RS-HDMR (256 samples) for maximum values, minimum values and percentage of difference for first threefrequency parameters for CCCC FG-CNTRC square plates. (a=b ¼ 1, h=b ¼ 0:1 and �V�
CNT ¼ 0:11).
PF Parameter k1: First natural frequency k2: Second natural frequency k3: Third natural frequency
MC Kriging RS-HDMR
Diff. (%) MC Kriging RS-HDMR
Diff. (%) MC Kriging RS-HDMR
Diff. (%)
UD Max. Val. 19.94 20.03 19.89 �0.46n0.23 26.20 26.27 26.15 �0.30n0.18 38.44 38.60 38.36 �0.41n0.22Min. Val. 16.38 16.44 16.59 �0.36n�1.26 21.52 21.64 21.80 �0.56n�1.32 31.58 31.73 31.99 �0.45n�1.28Mean. Val. 18.08 18.08 18.07 �0.01n0.01 23.77 23.78 23.77 �0.01n0.01 34.87 34.87 34.87 �0.01n0.01Standarddeviation
0.66 0.66 0.66 0.37n0.08 0.90 0.89 0.89 0.49n0.13 1.29 1.29 1.29 0.41n0.09
FG-V
Max. Val. 19.48 19.42 19.28 0.28n1.03 25.96 25.90 25.72 0.24n0.93 37.74 37.62 37.36 0.30n0.99Min. Val. 16.02 15.96 16.18 0.41n�0.98 21.37 21.29 21.64 0.37n�1.27 31.08 30.93 31.39 0.50n�1.01Mean. Val. 17.63 17.63 17.66 0.03n�0.16 23.53 23.52 23.57 0.03n�0.15 34.18 34.17 34.23 0.03n�0.15Standarddeviation
0.65 0.64 0.65 1.66n�0.16 0.89 0.88 0.89 1.70n�0.13 1.27 1.25 1.27 1.68n�0.16
FG-O
Max. Val. 18.88 18.90 18.60 �0.07n1.50 25.26 25.26 24.97 �0.03n1.14 36.91 36.94 36.44 �0.08n1.29Min. Val. 15.37 15.46 15.45 �0.57n�0.51 20.69 20.81 20.81 �0.62n�0.62 30.11 30.29 30.28 �0.59n�0.57Mean. Val. 17.11 17.10 17.10 0.07n0.03 22.95 22.93 22.94 0.07n0.03 33.48 33.46 33.47 0.07n0.03Standarddeviation
0.61 0.61 0.61 0.86n�0.12 0.85 0.84 0.85 0.68n�0.07 1.22 1.21 1.22 0.77n�0.10
FG-X
Max. Val. 20.43 20.49 20.16 �0.30n1.31 26.82 26.97 26.46 �0.54n1.34 39.21 39.34 38.70 �0.32n1.31Min. Val. 16.83 16.78 17.10 0.33n�1.57 22.04 22.01 22.42 0.12n�1.75 32.33 32.22 32.82 0.35n�1.49Mean. Val. 18.55 18.55 18.56 0.00n�0.03 24.36 24.36 24.36 0.00n�0.03 35.62 35.62 35.63 0.00n�0.03Standarddeviation
0.68 0.69 0.69 �0.82n�1.08 0.92 0.92 0.93 �0.83n�1.03 1.32 1.33 1.33 �0.83n�1.07
Fig. 9. Scatter plot of Kriging and RS-HDMR metamodels with respect to the original model for the first natural frequency (k1) for simultaneous variation of the materialparameters (CCCC UD-CNTRC plate, a=b ¼ 1, h=b ¼ 0:1, �V�
CNT ¼ 0:11).
192 E. García-Macías et al. / Composite Structures 152 (2016) 183–198
E. García-Macías et al. / Composite Structures 152 (2016) 183–198 193
where F is the actual response and F 0 is the approximated responseusing the surrogate models.
5. Results and discussion
In the present study, poly {(m-phenylenevinylene)-co-[(2,5-dioctoxy-p-phenylene) vinylene]} (PmPV) [48] is considered asthe matrix and the mean material properties are assumed to bemm ¼ 0:34; qm ¼ 1:15 g=m3 and Em ¼ 2:1 GPa at room tempera-ture of 300 K. The armchair (10,10) SWCNTs are selected as rein-forcements with properties taken from the MD simulation carriedout by Shen and Zhang [49]. The material properties of these twophases are summarized in Table 1. In this study, it is assumedthat the effective material properties are independent of thegeometry of the CNTRC plates. The detailed mean material
(a)
(b)
(c)
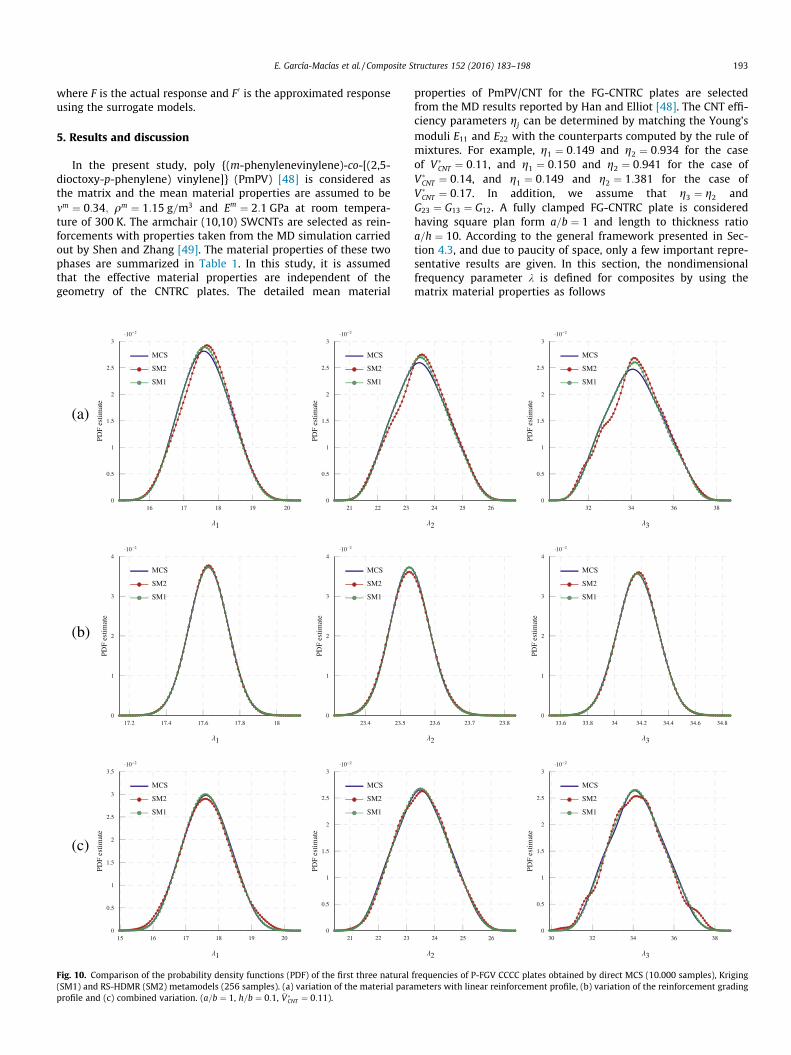
Fig. 10. Comparison of the probability density functions (PDF) of the first three natural(SM1) and RS-HDMR (SM2) metamodels (256 samples). (a) variation of the material paraprofile and (c) combined variation. (a=b ¼ 1, h=b ¼ 0:1, �V�
CNT ¼ 0:11).
properties of PmPV/CNT for the FG-CNTRC plates are selectedfrom the MD results reported by Han and Elliot [48]. The CNT effi-ciency parameters gj can be determined by matching the Young’smoduli E11 and E22 with the counterparts computed by the rule ofmixtures. For example, g1 ¼ 0:149 and g2 ¼ 0:934 for the caseof V�
CNT ¼ 0:11, and g1 ¼ 0:150 and g2 ¼ 0:941 for the case ofV�
CNT ¼ 0:14, and g1 ¼ 0:149 and g2 ¼ 1:381 for the case ofV�
CNT ¼ 0:17. In addition, we assume that g3 ¼ g2 andG23 ¼ G13 ¼ G12. A fully clamped FG-CNTRC plate is consideredhaving square plan form a=b ¼ 1 and length to thickness ratioa=h ¼ 10. According to the general framework presented in Sec-tion 4.3, and due to paucity of space, only a few important repre-sentative results are given. In this section, the nondimensionalfrequency parameter k is defined for composites by using thematrix material properties as follows
frequencies of P-FGV CCCC plates obtained by direct MCS (10.000 samples), Krigingmeters with linear reinforcement profile, (b) variation of the reinforcement grading
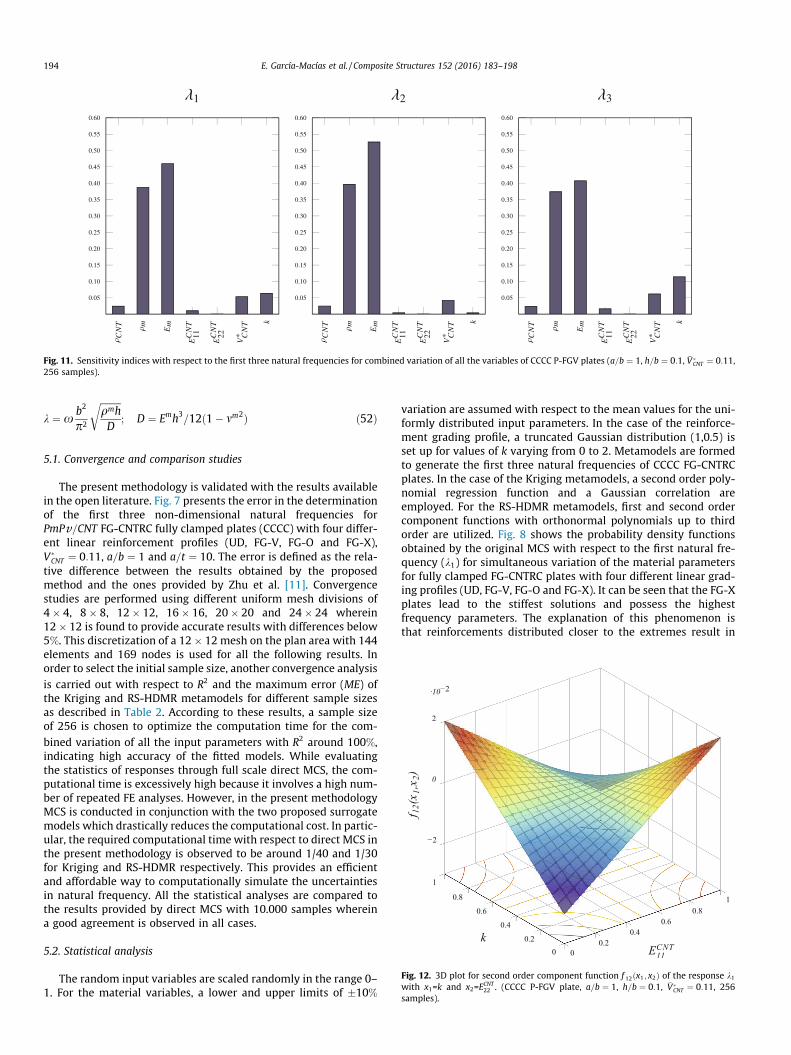
Fig. 11. Sensitivity indices with respect to the first three natural frequencies for combined variation of all the variables of CCCC P-FGV plates (a=b ¼ 1, h=b ¼ 0:1, �V �CNT ¼ 0:11,
256 samples).
194 E. García-Macías et al. / Composite Structures 152 (2016) 183–198
k ¼ xb2
p2
ffiffiffiffiffiffiffiffiffiqmhD
r; D ¼ Emh3
=12ð1� mm2Þ ð52Þ
Fig. 12. 3D plot for second order component function f 12ðx1; x2Þ of the response k1with x1=k and x2=E
CNT22 . (CCCC P-FGV plate, a=b ¼ 1, h=b ¼ 0:1, �V�
CNT ¼ 0:11, 256samples).
5.1. Convergence and comparison studies
The present methodology is validated with the results availablein the open literature. Fig. 7 presents the error in the determinationof the first three non-dimensional natural frequencies forPmPv=CNT FG-CNTRC fully clamped plates (CCCC) with four differ-ent linear reinforcement profiles (UD, FG-V, FG-O and FG-X),V�
CNT ¼ 0:11, a=b ¼ 1 and a=t ¼ 10. The error is defined as the rela-tive difference between the results obtained by the proposedmethod and the ones provided by Zhu et al. [11]. Convergencestudies are performed using different uniform mesh divisions of4� 4, 8� 8, 12� 12, 16� 16, 20� 20 and 24� 24 wherein12� 12 is found to provide accurate results with differences below5%. This discretization of a 12� 12 mesh on the plan area with 144elements and 169 nodes is used for all the following results. Inorder to select the initial sample size, another convergence analysisis carried out with respect to R2 and the maximum error (ME) ofthe Kriging and RS-HDMR metamodels for different sample sizesas described in Table 2. According to these results, a sample sizeof 256 is chosen to optimize the computation time for the com-bined variation of all the input parameters with R2 around 100%,indicating high accuracy of the fitted models. While evaluatingthe statistics of responses through full scale direct MCS, the com-putational time is excessively high because it involves a high num-ber of repeated FE analyses. However, in the present methodologyMCS is conducted in conjunction with the two proposed surrogatemodels which drastically reduces the computational cost. In partic-ular, the required computational time with respect to direct MCS inthe present methodology is observed to be around 1/40 and 1/30for Kriging and RS-HDMR respectively. This provides an efficientand affordable way to computationally simulate the uncertaintiesin natural frequency. All the statistical analyses are compared tothe results provided by direct MCS with 10.000 samples whereina good agreement is observed in all cases.
5.2. Statistical analysis
The random input variables are scaled randomly in the range 0–1. For the material variables, a lower and upper limits of �10%
variation are assumed with respect to the mean values for the uni-formly distributed input parameters. In the case of the reinforce-ment grading profile, a truncated Gaussian distribution (1,0.5) isset up for values of k varying from 0 to 2. Metamodels are formedto generate the first three natural frequencies of CCCC FG-CNTRCplates. In the case of the Kriging metamodels, a second order poly-nomial regression function and a Gaussian correlation areemployed. For the RS-HDMR metamodels, first and second ordercomponent functions with orthonormal polynomials up to thirdorder are utilized. Fig. 8 shows the probability density functionsobtained by the original MCS with respect to the first natural fre-quency (k1) for simultaneous variation of the material parametersfor fully clamped FG-CNTRC plates with four different linear grad-ing profiles (UD, FG-V, FG-O and FG-X). It can be seen that the FG-Xplates lead to the stiffest solutions and possess the highestfrequency parameters. The explanation of this phenomenon isthat reinforcements distributed closer to the extremes result in

Table4
Unc
ertainty
analysis
dueto
individu
alva
riab
ility
ofalltheinpu
tva
riab
lesby
aKriging
andRS
-HDMRmea
tamod
els(256
samples)forthefirstthreena
turalfreq
uenc
iesforCC
CCP-FG
Vplates.(a=
b¼
1;h=
b¼
0:1an
d� V� CN
T¼
0:11
).
Metam
odel
Value
qCN
Tqm
E mEC
NT
11EC
NT
22V� CN
Tk
k 1k 2
k 3k 1
k 2k 3
k 1k 2
k 3k 1
k 2k 3
k 1k 2
k 3k 1
k 2k 3
k 1k 2
k 3
KRIG
ING
Min
17.51
23.37
33.95
16.91
22.56
32.78
16.86
22.40
32.62
17.48
23.43
33.94
17.63
23.52
34.17
17.41
23.32
33.80
17.26
23.46
33.61
Max
17.75
23.68
34.40
18.45
24.62
35.76
18.35
24.58
35.63
17.76
23.61
34.37
17.63
23.53
34.18
17.84
23.73
34.53
17.97
23.68
34.70
Mea
n17
.63
23.53
34.17
17.65
23.55
34.21
17.62
23.51
34.15
17.63
23.52
34.17
17.63
23.52
34.17
17.63
23.52
34.17
17.63
23.53
34.17
SD0.07
0.09
0.13
0.44
0.59
0.86
0.43
0.63
0.86
0.08
0.05
0.12
0.00
0.00
0.00
0.12
0.12
0.21
0.09
0.03
0.14
RS-HDMR
Min
17.50
23.38
33.93
16.91
22.51
32.77
16.85
22.44
32.61
17.48
23.54
33.94
17.62
23.53
34.14
17.41
23.33
33.80
17.27
23.47
33.62
Max
17.75
23.70
34.40
18.44
24.56
35.75
18.35
24.63
35.63
17.74
23.54
34.37
17.62
23.54
34.14
17.82
23.73
34.50
18.07
23.75
34.85
Mea
n17
.63
23.54
34.17
17.64
23.53
34.19
17.62
23.54
34.15
17.62
23.54
34.16
17.62
23.53
34.14
17.62
23.53
34.16
17.63
23.54
34.16
SD0.07
0.09
0.13
0.44
0.59
0.86
0.43
0.63
0.87
0.08
0.00
0.12
0.00
0.00
0.00
0.12
0.12
0.21
0.09
0.03
0.14
E. García-Macías et al. / Composite Structures 152 (2016) 183–198 195
stiffener plates than those distributed nearer to the mid-plane.Table 3 presents the comparative study between the direct MCsand the surrogate models, Kriging and RS-HDMR, for maximumvalues, minimum values and percentage of difference for the firstthree natural frequencies obtained due to combined variability inthe material parameters for CCCC FG-CNTRC with the four linearreinforcement distributions. Fig. 9 shows a sample scatter plotdescribing the relationship between the original FE model andthe constructed metamodels for natural frequencies. The low scat-ter of the points around the diagonal line corroborates that themetamodels are both formed with accuracy. Due to space limita-tions, in all the subsequent analyses, only results of the uncertaintyof the FG-V distribution (P-FGV) will be presented. Fig. 10 showsthe comparison of the probability density functions (PDF) obtainedby direct MCS and the two surrogate models for the three cases ofuncertainty presented in Section 4.3. All the plots obtained by bothmetamodels are checked and found to be in good agreementensuring efficiency and accuracy. Global sensitivity analysis usingRS-HDMR is performed for significant input parameter screening.The sensitivity indices for each input parameter (including theinteraction effects) corresponding to different output responsesare shown in Fig. 11, while a typical interaction surface betweenk and ECNT
11 corresponding to the second order component functionof the fundamental frequency is given in Fig. 12. It is observed thatthe matrix parameters have a predominant effect on sensitivity. Asignificant effect of the power-law index k is found on the first andthird natural frequencies with considerable contribution from thevolume fraction of inclusions V�
CNT . It is also noticeable the null sen-sitivity due to random variation of the transverse elastic modulusof CNTs, ECNT
22 . Table 4 represents the minimum values, maximumvalues, mean values and standard deviation using the two pro-posed metamodels for the first three natural frequencies obtaineddue to individual variability of all the variables.
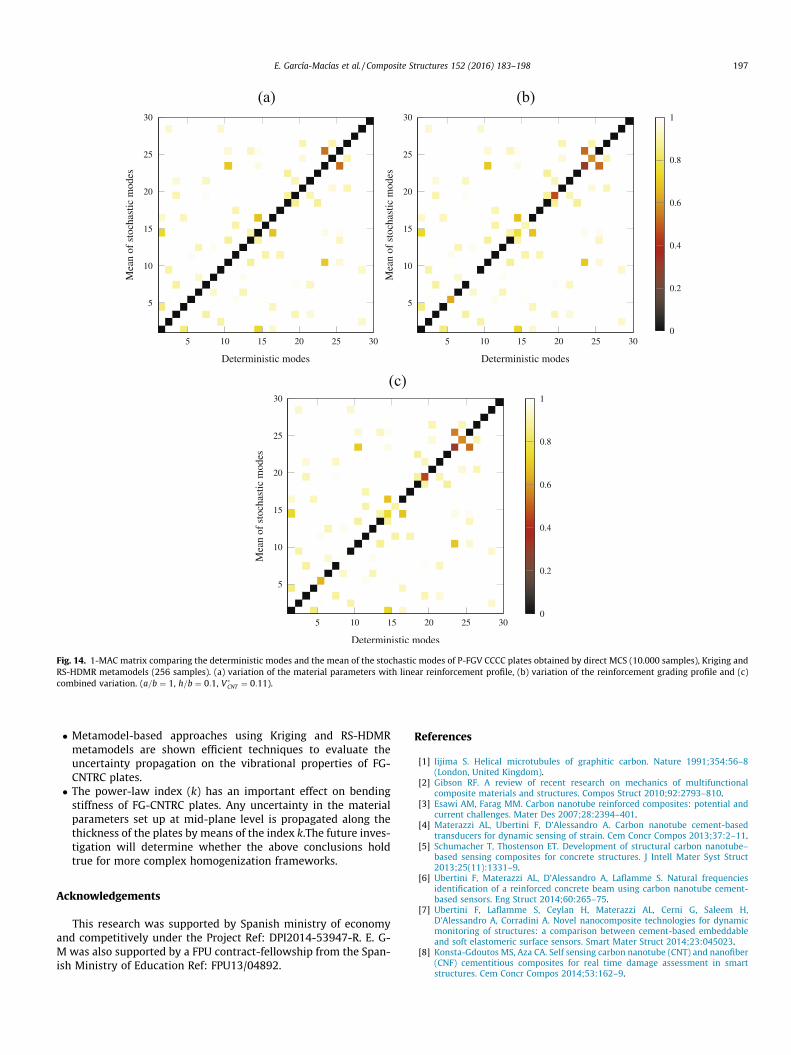
Finally, some new physical insights are drawn on the dynamicbehavior of P-FGV plates by studying the transient response inthe frequency domain and a comparison of the stochastic anddeterministic mode shapes. The transient response of a CCCC P-FGV plate under impulse loading is considered to ascertain the cor-responding amplitude (in dB) of the frequency response function(FRF) as represented in Fig. 13. The Effective Independence method(EFI) [50] was employed to select the optimal positions of threepoints, two response points (P-1 and P-2) and one driving point(DP). This methodology is based on the maximization of the deter-minant of the Fisher information matrix (FIM), defined as the pro-duct of the mode shape matrix and its transpose. The principal ideaof this method is based on the linear independence of the modeshapes. Proportional Rayleigh damping is assumed by imposingdamping ratios of 1% for the first two natural modes. Higher fre-quency shows wider volatility in the simulation bounds of FRFcompared to the lower frequency ranges. It is noticeable that theisolated randomness in the power-law index (k) does not lead togreat differences in the FRFs. Nevertheless, its simultaneous varia-tion along with the material parameters enlarges the shifts aroundthe resonance peaks and widens the FRF bounds. This can be attrib-uted to the propagating effect of k, which not only incorporatesvariation by itself, but also scatters the randomness of the rest ofthe variables, set up at mid-plane level, along the thickness ofthe plates. Fig. 14 shows the comparison between the determinis-tic modes and the mean of the stochastic modes through theassessment of the MAC (Modal Assurance Criterion) matrix. Inthe case of the uncertainty in the material parameters (a), themode shapes do not change substantially with zero values alongthe diagonal of the matrix. On the contrary, the incorporation ofthe uncertainty in the power-law index (k) does change the char-acteristics of some mode shapes. This effect, which remains in
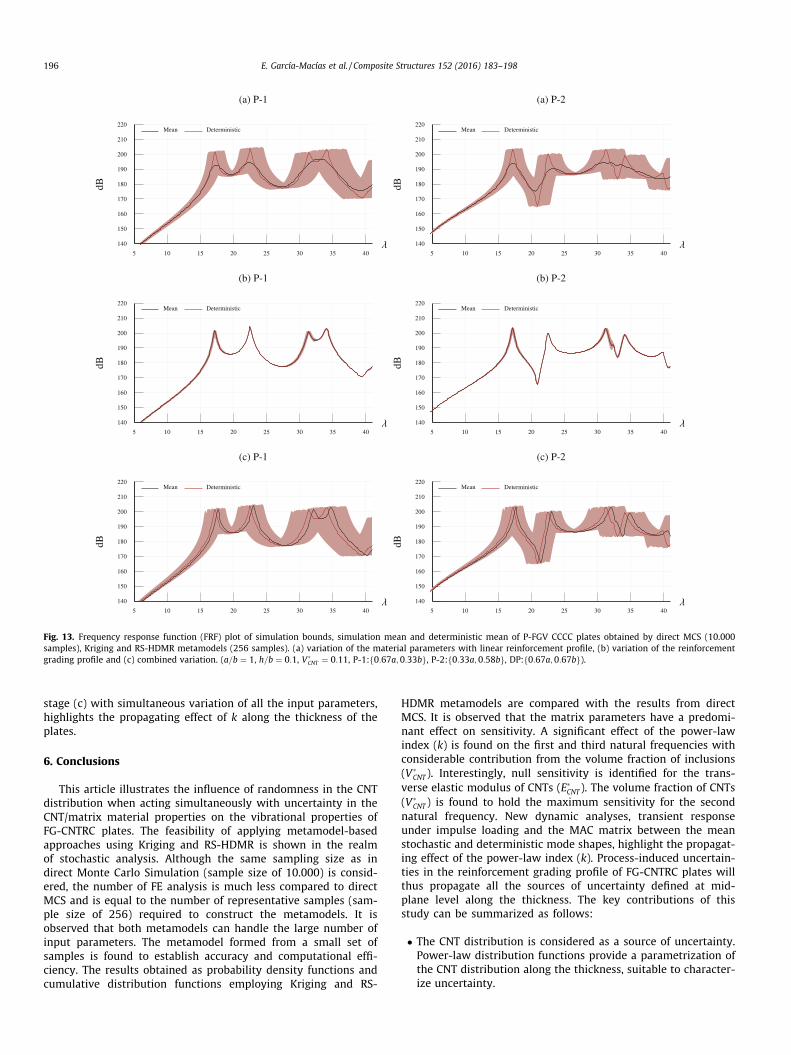
Fig. 13. Frequency response function (FRF) plot of simulation bounds, simulation mean and deterministic mean of P-FGV CCCC plates obtained by direct MCS (10.000samples), Kriging and RS-HDMR metamodels (256 samples). (a) variation of the material parameters with linear reinforcement profile, (b) variation of the reinforcementgrading profile and (c) combined variation. (a=b ¼ 1, h=b ¼ 0:1, V�
CNT ¼ 0:11, P-1: 0:67a;0:33bf g, P-2: 0:33a;0:58bf g, DP: 0:67a;0:67bf g).
196 E. García-Macías et al. / Composite Structures 152 (2016) 183–198
stage (c) with simultaneous variation of all the input parameters,highlights the propagating effect of k along the thickness of theplates.
6. Conclusions
This article illustrates the influence of randomness in the CNTdistribution when acting simultaneously with uncertainty in theCNT/matrix material properties on the vibrational properties ofFG-CNTRC plates. The feasibility of applying metamodel-basedapproaches using Kriging and RS-HDMR is shown in the realmof stochastic analysis. Although the same sampling size as indirect Monte Carlo Simulation (sample size of 10.000) is consid-ered, the number of FE analysis is much less compared to directMCS and is equal to the number of representative samples (sam-ple size of 256) required to construct the metamodels. It isobserved that both metamodels can handle the large number ofinput parameters. The metamodel formed from a small set ofsamples is found to establish accuracy and computational effi-ciency. The results obtained as probability density functions andcumulative distribution functions employing Kriging and RS-
HDMR metamodels are compared with the results from directMCS. It is observed that the matrix parameters have a predomi-nant effect on sensitivity. A significant effect of the power-lawindex (k) is found on the first and third natural frequencies withconsiderable contribution from the volume fraction of inclusions(V�
CNT). Interestingly, null sensitivity is identified for the trans-verse elastic modulus of CNTs (E�
CNT). The volume fraction of CNTs(V�
CNT) is found to hold the maximum sensitivity for the secondnatural frequency. New dynamic analyses, transient responseunder impulse loading and the MAC matrix between the meanstochastic and deterministic mode shapes, highlight the propagat-ing effect of the power-law index (k). Process-induced uncertain-ties in the reinforcement grading profile of FG-CNTRC plates willthus propagate all the sources of uncertainty defined at mid-plane level along the thickness. The key contributions of thisstudy can be summarized as follows:
The CNT distribution is considered as a source of uncertainty.Power-law distribution functions provide a parametrization ofthe CNT distribution along the thickness, suitable to character-ize uncertainty.
(a) (b)
(c)
Fig. 14. 1-MAC matrix comparing the deterministic modes and the mean of the stochastic modes of P-FGV CCCC plates obtained by direct MCS (10.000 samples), Kriging andRS-HDMR metamodels (256 samples). (a) variation of the material parameters with linear reinforcement profile, (b) variation of the reinforcement grading profile and (c)combined variation. (a=b ¼ 1, h=b ¼ 0:1, V�
CNT ¼ 0:11).
E. García-Macías et al. / Composite Structures 152 (2016) 183–198 197
Metamodel-based approaches using Kriging and RS-HDMRmetamodels are shown efficient techniques to evaluate theuncertainty propagation on the vibrational properties of FG-CNTRC plates.
The power-law index (k) has an important effect on bendingstiffness of FG-CNTRC plates. Any uncertainty in the materialparameters set up at mid-plane level is propagated along thethickness of the plates by means of the index k.The future inves-tigation will determine whether the above conclusions holdtrue for more complex homogenization frameworks.
Acknowledgements
This research was supported by Spanish ministry of economyand competitively under the Project Ref: DPI2014-53947-R. E. G-M was also supported by a FPU contract-fellowship from the Span-ish Ministry of Education Ref: FPU13/04892.
References
[1] Iijima S. Helical microtubules of graphitic carbon. Nature 1991;354:56–8(London, United Kingdom).
[2] Gibson RF. A review of recent research on mechanics of multifunctionalcomposite materials and structures. Compos Struct 2010;92:2793–810.
[3] Esawi AM, Farag MM. Carbon nanotube reinforced composites: potential andcurrent challenges. Mater Des 2007;28:2394–401.
[4] Materazzi AL, Ubertini F, D’Alessandro A. Carbon nanotube cement-basedtransducers for dynamic sensing of strain. Cem Concr Compos 2013;37:2–11.
[5] Schumacher T, Thostenson ET. Development of structural carbon nanotube–based sensing composites for concrete structures. J Intell Mater Syst Struct2013;25(11):1331–9.
[6] Ubertini F, Materazzi AL, D’Alessandro A, Laflamme S. Natural frequenciesidentification of a reinforced concrete beam using carbon nanotube cement-based sensors. Eng Struct 2014;60:265–75.
[7] Ubertini F, Laflamme S, Ceylan H, Materazzi AL, Cerni G, Saleem H,D’Alessandro A, Corradini A. Novel nanocomposite technologies for dynamicmonitoring of structures: a comparison between cement-based embeddableand soft elastomeric surface sensors. Smart Mater Struct 2014;23:045023.
[8] Konsta-Gdoutos MS, Aza CA. Self sensing carbon nanotube (CNT) and nanofiber(CNF) cementitious composites for real time damage assessment in smartstructures. Cem Concr Compos 2014;53:162–9.
198 E. García-Macías et al. / Composite Structures 152 (2016) 183–198
[9] Udupa G, Rao SS, Gangadharan K. Functionally graded composite materials: anoverview. Procedia Mater Sci 2014;5:1291–9.
[10] Shen H-S. Nonlinear bending of functionally graded carbon nanotube-reinforced composite plates in thermal environments. Compos Struct2009;91:9–19.
[11] Zhu P, Lei Z, Liew KM. Static and free vibration analyses of carbon nanotube-reinforced composite plates using finite element method with first order sheardeformation plate theory. Compos Struct 2012;94:1450–60.
[12] Yas M, Heshmati M. Dynamic analysis of functionally graded nanocompositebeams reinforced by randomly oriented carbon nanotube under the action ofmoving load. Appl Math Model 2012;36:1371–94.
[13] Heshmati M, Yas M. Vibrations of non-uniform functionally graded MWCNTs-polystyrene nanocomposite beams under action of moving load. Mater Des2013;46:206–18.
[14] Zhang L, Song Z, Liew K. State-space levy method for vibration analysis of FG-CNT composite plates subjected to in-plane loads based on higher-order sheardeformation theory. Compos Struct 2015;134:989–1003.
[15] Zhang L, Lei Z, Liew K. Buckling analysis of FG-CNT reinforced composite thickskew plates using an element-free approach. Composites Part B2015;75:36–46.
[16] García-Macías E, Castro-Triguero R, Flores EIS, Friswell MI, Gallego R. Staticand free vibration analysis of functionally graded carbon nanotube reinforcedskew plates. Compos Struct 2016.
[17] Rouhi M, Rais-Rohani M. Modeling and probabilistic design optimization of ananofiber-enhanced composite cylinder for buckling. Compos Struct2013;95:346–53.
[18] Ghasemi H, Rafiee R, Zhuang X, Muthu J, Rabczuk T. Uncertainties propagationin metamodel-based probabilistic optimization of CNT/polymer compositestructure using stochastic multi-scale modeling. Comput Mater Sci2014;85:295–305.
[19] Li G, Wang S-W, Rabitz H, Wang S, Jaffé P. Global uncertainty assessments byhigh dimensional model representations (hdmr). Chem. Eng. Sci.2002;57:4445–60.
[20] Chowdhury R, Rao B. Assessment of high dimensional model representationtechniques for reliability analysis. Prob Eng Mech 2009;24:100–15.
[21] Mukherjee D, Rao B, Prasad AM. Global sensitivity analysis of unreinforcedmasonry structure using high dimensional model representation. Eng Struct2011;33:1316–25.
[22] Dey S, Mukhopadhyay T, Adhikari S. Stochastic free vibration analysis of angle-ply composite plates – a RS-HDMR approach. Compos Struct2015;122:526–36.
[23] Dey S, Mukhopadhyay T, Spickenheuer A, Adhikari S, Heinrich G. Bottom upsurrogate based approach for stochastic frequency response analysis oflaminated composite plates. Compos Struct 2016.
[24] Dey S, Mukhopadhyay T, Sahu S, Li G, Rabitz H, Adhikari S. Thermaluncertainty quantification in frequency responses of laminated compositeplates. Composites Part B 2015;80:186–97.
[25] Dey S, Mukhopadhyay T, Adhikari S. Stochastic free vibration analyses ofcomposite doubly curved shells - a Kriging model approach. Composites Part B2015;70:99–112.
[26] Shi D-L, Feng X-Q, Huang YY, Hwang K-C, Gao H. The effect of nanotubewaviness and agglomeration on the elastic property of carbon nanotube-reinforced composites. J Eng Mater Technol 2004;126:250–7.
[27] Fidelus J, Wiesel E, Gojny F, Schulte K, Wagner H. Thermo-mechanicalproperties of randomly oriented carbon/epoxy nanocomposites. CompositesPart A 2005;36:1555–61.
[28] Sobhani Aragh B, Nasrollah Barati A, Hedayati H. Eshelby–Mori–Tanakaapproach for vibrational behavior of continuously graded carbon nanotube-reinforced cylindrical panels. Composites Part B 2012;43:1943–54.
[29] Helal WM, Shi D. Optimum material gradient for functionally gradedrectangular plate with the finite element method. Indian J Mater Sci2014;2014.
[30] Wempner G, Talaslidis D. Mechanics of solids and shells. CRC Press; 2003.[31] Efraim E, Eisenberger M. Exact vibration analysis of variable thickness thick
annular isotropic and FGM plates. J Sound Vib 2007;299:720–38.[32] Matheron G. Principles of geostatistics. Econ Geol 1963;58:1246–66.[33] Sacks J, Welch WJ, Mitchell TJ, Wynn HP. Design and analysis of computer
experiments. Stat Sci 1989:409–23.[34] Lophaven SN, Nielsen HB, Sndergaard J, DACE-A matlab Kriging toolbox,
version 2.0, technical report; 2002.[35] Koehler J, Owen A. 9 computer experiments. Handbook of statistics, vol. 13,
1996. 261–308.[36] Mitchell TJ, Morris MD. Bayesian design and analysis of computer
experiments: two examples. Stat Sin 1992;2:359–79.[37] Sacks J, Schiller SB, Welch WJ. Designs for computer experiments.
Technometrics 1989;31:41–7.[38] Rabitz H, Alis MF. General foundations of high-dimensional model
representations. J Math Chem 1999;25:197–233.[39] Li G, Rabitz H, Wang S-W, Georgopoulos PG. Correlation method for variance
reduction of Monte Carlo integration in RS-HDMR. J Comput Chem2003;24:277–83.
[40] Ziehn T, Tomlin A. GUI-HDMR – a software tool for global sensitivity analysisof complex models. Environ Model Softw 2009;24:775–85.
[41] Sobol IM. On sensitivity estimation for nonlinear mathematical models.Matematicheskoe Modelirovanie 1990;2:112–8.
[42] Sobol IM. Global sensitivity indices for nonlinear mathematical models andtheir Monte Carlo estimates. Math Comput Simul 2001;55:271–80.
[43] Li G, Wang S-W, Rabitz H. Practical approaches to construct RS-HDMRcomponent functions. J Phys Chem A 2002;106:8721–33.
[44] Li G, Rabitz H. Ratio control variate method for efficiently determining high-dimensional model representations. J Comput Chem 2006;27:1112–8.
[45] Ziehn T, Tomlin A. Global sensitivity analysis of a 3d street canyon model-parti: the development of high dimensional model representations. Atmos Environ2008;42:1857–73.
[46] Ziehn T, Tomlin AS. A global sensitivity study of sulfur chemistry in a premixedmethane flame model using HDMR. Int J Chem Kinet 2008;40:742–53.
[47] Sobol IM. On the distribution of points in a cube and the approximateevaluation of integrals. USSR Comput Math Math Phys 1967:86–112.
[48] Han Y, Elliott J. Molecular dynamics simulations of the elastic properties ofpolymer/carbon nanotube composites. Comput Mater Sci 2007;39:315–23.
[49] Shen H-S, Zhang C-L. Thermal buckling and postbuckling behavior offunctionally graded carbon nanotube-reinforced composite plates. Mater Des2010;31:3403–11.
[50] Kammer D, Yao L. Enhancement of on-orbit modal identification of large spacestructures through sensor placement. J Sound Vib 1994;171:119–39.