Embed Size (px)
Citation preview

Page 1/23
Changes in Organic Matter Composition Caused byEDTA Washing of two Soils Contaminated with ToxicMetalsErika Jez
University of Nova GoricaCarlo Bravo
University of UdineDomen Lestan
University of Ljubljana Biotechnical faculty: Univerza v Ljubljani Biotehniska fakultetaSimon Gluhar
University of Ljubljana Biotechnical faculty: Univerza v Ljubljani Biotehniska fakultetaLadislau Martin-Neto
Embrapa Instrumentacao AgropecuariaMaria De Nobili
University of UdineMarco Contin ( [email protected] )
Universita degli Studi di Udine https://orcid.org/0000-0002-7052-1990
Research Article
Keywords: Potentially toxic metals, Soil washing, EDTA, Humic substances, Soil organic matter, Humic acids,Fulvic acids.
Posted Date: April 30th, 2021
DOI: https://doi.org/10.21203/rs.3.rs-385444/v1
License: This work is licensed under a Creative Commons Attribution 4.0 International License. Read FullLicense
Version of Record: A version of this preprint was published at Environmental Science and Pollution Research onJuly 28th, 2021. See the published version at https://doi.org/10.1007/s11356-021-15406-z.

Page 2/23
AbstractTwo soils contaminated with potentially toxic metals (PTMs) contrasting in pH and mineralogy were remediatedwith CaEDTA, and changes in soil organic matter (SOM) composition were investigated. Previous studies showedno signi�cant loss of SOM from CaEDTA-treated soils, but the results of our study re�ected signi�cant decreases(from 46 to 49%) in the free fraction of humic acids (HAs). Remediation affected the composition of the free HAfraction via disturbance of intermolecular bonds - an increase in phenolic and aromatic groups with asimultaneous decrease in carbohydrates - which was con�rmed by FTIR spectroscopy in both soils. Because non-radical molecules such as carbohydrates were selectively removed, the concentration of free radicals in the freeHA fraction increased in acidic soil. The bound fraction of HAs and fulvic acids (FAs) in SOM, which areimportant due to their stability and the permanent effects they have on the soil’s physical properties, remainedunchanged in both remediated soils. The effect of soil recultivation was observed only in the EEM �uorescencespectra of HAs. In terms of SOM, CaEDTA soil washing can be considered moderately conservative, however, therestoration of free humic fractions is likely to be a long-term process.
1 IntroductionSoils contaminated by potentially toxic metals (PTMs) and in particular by lead (Pb) are a widespread problem.Pb is one of the most toxic elements whose extensive use (ore mining, tailings and smelting) has causedenvironmental and health problems in many parts of the world (Das et al. 2018; Doumas et al. 2018; Huang et al.2018; Kushwaha et al. 2018; Varrica et al. 2018).
Various biological, chemical and physical approaches are used for the elimination of PTMs from soils (Ashraf etal. 2017). If the concentration of Pb in soils contaminated by anthropogenic activities is several times thethreshold value for toxicity, soil washing can be an effective alternative to solidi�cation/stabilization andland�lling (Dermont et al. 2008). Several inorganic acids (e.g. hydrochloric, sulfuric and nitric acid), organic acids(e.g. oxalic, citric, gluconic and ascorbic acid), synthetic or biodegradable chelating agents (e.g. EDDS, EDTA,GLDA, NTA) and surfactants (e.g. rhamnolipids and sophorolipids) have been tested to improve the e�ciency ofsoil washing (Gluhar et al. 2020; Peng et al. 2018). Among them, EDTA has proven to be one of the best, mostenvironmentally friendly and most economical (Gluhar et al. 2020; Jelusic et al. 2014; Jez and Lestan 2016;Lestan 2017). Although EDTA soil washing is an e�cient and permanent way of removing PTMs fromcontaminated soils, it may affect soil properties (Yi and Sung 2015). In fact, in addition to targeted PTMs, EDTAforms strong complexes with a variety of cations, including alkaline earth metals (Ca and Mg) and other majorsoil components such as Al and Fe. This often has a detrimental effect on the structure and physical propertiesof the soil matrix (Zeng et al. 2005). Begum et al. (2013), Hartley et al. (2014) and Tsang et al. (2007) observedthe dissolution of native Fe/Al (hydro)oxides and large amounts of Ca carbonates in soils treated with Na2EDTA(about 50% of the Ca was removed). To avoid this problem, Lestan (2017) developed a novel remediation methodknown as ReSoil® washing technology in which the chelating agent is present in its CaEDTA form, whichimproves stability of soil aggregates (Zupanc et al. 2014), and consequently has a lower effect on soil fertility(Theodoratos et al. 2000).
Soil organic matter (SOM), generally measured as soil organic C (SOC), is the main indicator of soil quality andagronomic sustainability, as it affects physical, chemical, and biological properties of soil, many of whichin�uence plant growth indirectly (Magdoff and Weil 2004). It is known that SOC decreases in long-term PTM-

Page 3/23
polluted soils (Viventsova et al. 2005), but soil washing of contaminated soils may also have negative effects onSOM. Many studies have reported that after soil washing with Na2EDTA the SOM did not change (Zupanc et al.2014; Jelusic et al. 2014; Hu et al. 2014; Tahmasbian et al. 2017; Hosseini et al. 2018). Sometimes changes inSOC are di�cult to investigate because these changes occur slowly and are relatively small compared to the vastSOC pool size, but some of the soil C fractions, such as humic acids, are more sensitive than the total SOC(Slepetiene et al. 2011). Although fulvic and humic acids (FAs and HAs) are distinct and remarkably uniformacross soils, they do not exist per se in nature (Magdoff and Weil 2004). HAs and FAs are used as SOM proxies insoils even though 50% or more of the organic material in mineral soils resides in non-extractable humin (Rice2001). Nevertheless, the humic substances-based approach for understanding the natural processes of SOM andplant growth has been widely adopted (Olk et al. 2019; Hayes and Swift 2020; De Nobili et al. 2020) and it can bea useful tool for characterizing the washing effect on soil. During washing treatment, intensive mixing of the soilslurry and soil compression after de-watering in particular (Lestan 2017), can lead to decomposition of polymerichumic materials. Goulas et al. (2017) characterized the organic matter in the washing solution and found that themain organic compounds were FA, HA, glycosylated proteins, melanoidin and lignocellulose. However, to ourknowledge detailed information on whether soil washing has a negative effect on HA has not been reported. Togain better insights into the qualitative changes in HAs caused by soil washing, spectroscopic methods shouldbe used. In fact, studying the composition and quality of SOM is often more important than just looking atquantitative changes (Zhou et al. 2018). Lu et al. (2018) proposed the use of a combination of UV-visspectrometry, Fourier Transform Infrared (FTIR) spectroscopy and �uorescence spectrometry to investigate HAcomposition.
We hypothesized that EDTA soil washing would change the composition of humic substances in treated soils byin�uencing the way they bind to soil minerals and their supramolecular aggregation and that soil pH andmineralogy would play a major role. The binding of FAs and HAs to clays and oxides is indeed dependent on theformation of cationic bridges with polycations such as Ca2+ (Bachmann et al. 2008; Rowley et al 2018). Inwashed soils, Ca2+ is in excess because it is added in the form of CaEDTA (Lestan 2017). Mahieu et al. (2002)and Olk et al. (2006) showed by 13C-CPMAS-NMR that the Ca2+-bound fraction of HAs (extracted by thecomplexing action of pyrophosphate) corresponded to more humi�ed materials. Conversely, the fraction that wasfree of polycationic binding to minerals and therefore directly extractable by sodium hydroxide, was consistentlycomposed of younger, more labile materials (De Nobili et al. 2008). These fractions were useful for assessing thechemical and biochemical stabilization of SOC in soils under different management (Olk et al. 2019).
The soil properties after ReSoil® washing technology have been evaluated several times in previous studies(Lestan 2017; Gluhar et al. 2020; Kaurin et al. 2020) and have shown no signi�cant or lasting effects, apart froma slight increase in the pH value of the soil due to the lime treatment of the process solutions. However, thequalitative effect of the remediation on SOM remains largely unknown. The focus of this study was to evaluatethe qualitative changes induced by ReSoil® washing technology with CaEDTA on SOM. The changes in thehumic (FA + HA) and non-humic (NH) fractions were quanti�ed, taking into account their association with mineralsoil components (free and bound) in two PTM-polluted soils with contrasting pH and mineralogy that had beensubjected to soil washing. We completed our study by characterizing the extracted free and bound HAs usingdifferent spectroscopic techniques (UV-vis, EEM, FTIR, ESR), and tested whether two cultivation cycles were ableto restore the original composition of the SOM.

Page 4/23
2 Materials And Methods
2.1 Soil sampling and analysesThe soils used in this experiment were collected from the upper 30 cm layer of an active farmland nearArnoldstein, Austria (acidic soil) and a vegetable garden in the Meza Valley, Slovenia (calcareous soil). Leadmining and smelting for more than 300 years in the Meza Valley and more than 500 years in Arnoldstein causedsevere accumulation of Pb, Zn and Cd in these soils. Soil PTMs were analyzed by �ame (acetylene/air) atomicabsorption spectrophotometry (FAAS) (Varian AA240FS) with deuterium background correction after microwave-assisted acid extraction (USEPA 3052, 1995).
The pH was measured in a 1/2.5 (w/v) suspension of soil and 0.01M CaCl2. Carbonates were determinedvolumetrically following the method proposed by Kalra and Maynard (1991).
Total organic carbon (TOC) was determined by automated thermal analyses where carbon is converted to CO2 by�ash combustion at 1080°C (Costech Elemental Combustion System 102 elemental analyser (CostechInstruments) coupled with a Thermo Scienti�c 103 Delta V Advantage Isotope Ratio Mass Spectrometer (ThermoScienti�c)). Carbonates were previously removed from 10 mg of soils by treatment with HCl in silver capsules.
2.2 EDTA-soil washing and recultivation of washed soilsRemediation of contaminated soils (ReSoil®) was carried out in the pilot scale chelate washing plant describedby Lestan (2017). Brie�y, soil (40 kg per batch), at about 18% moisture content, was washed with recycled EDTAsolution (50 L) for 18 h in a concrete mixer. The calcareous soil was washed with solutions containing 60 mmolkg-1 EDTA, whereas 100 mmol kg-1 EDTA was used for the acidic soil. Oversized materials (> 2 mm) wereseparated from the contaminated soil by wet screening. The soil solid phase was separated from the washingsolution using a chamber �lter press. In a downstream section of the process, the washed soil was rinsed in a�lter press with three rinsing solutions recycled from the previous batch and then with fresh water (15 L) tocompensate for water losses (the difference in moisture between the soil entering and exiting the process). Theuntreated last rinsing solution from the previous batch was used for the �rst rinsing solution (50 L). Usedwashing solution (50 L), and the second (50 L) and third (50 L) rinsing solutions were treated (and the EDTAwashing solution recycled as CaEDTA) by alkalization with lime (pH > 12). Solid wastes, the precipitate of toxicmetals hydroxides and toxic metals absorbed on waste paper, were removed in a chamber �lter press and byvacuum-�ltration. The remaining EDTA was recovered as insoluble H4EDTA from the acidic phase of the secondrinsing solution (after addition of 96% H2SO4, pH 2-2.3) by vacuum-�ltration. The recycled washing solution wasprepared from EDTA recycled as CaEDTA, the addition of H4EDTA and fresh Na4EDTA to compensate for the lostchelant (10–15%). For each soil the process was carried out three times and then the batches of the same soilwere merged together. Remediated soil was passed through a 5 mm sieve to recreate soil structure and stored atroom temperature for 30 days.
Experimental plots (dimensions 70 x 40 cm, 30 cm high) �lled with remediated soils were fertilized with MnSO4
at a rate equivalent to 40 kg ha-1, right before planting a selection vegetable species. The �rst series of cropsplanted in spring 2017 was spinach (Spinacia oleracea), parsley (Petroselinum crispum) and salad (Lactucasativa) and the second series planted in autumn 2017 was spinach and Chinese cabbage (Brassica rapaPekinensis). Sampling (1 kg of soil) was carried out in October when autumn crops were still present.

Page 5/23
2.3 SOC extraction and fractionationSequential extractions and fractionations were performed on air-dried soil samples according to the schemereported in Fig. 1. Free and bound fractions were obtained by sequentially extracting 50 g of soil with 500 mL of0.5 M NaOH (free TEC) initially and then with 500 mL of 0.1 M Na4P2O7 plus 0.1 M NaOH (bound TEC). Bothextractions were carried out under an N2 saturated atmosphere for 1 h. The soil-extractant suspensions were thencentrifuged (20 min at 14000 RPM) to separate extracted organic matter from soil mineral constituents and�ltered through 0.2 µm cellulose �lters. Free and bound HAs were obtained by precipitation at pH 1.5 (using 96%H2SO4) from the corresponding TEC extracts, separated by centrifugation, washed with acidi�ed distilled waterand then freeze dried. The supernatant, containing FAs and NH fractions was fractionated by adsorptionchromatography on cross-linked polyvinylpyrrolidone (PVP) columns according to the procedure described by DeNobili and Petrussi (1988). The NH fraction was leached from the PVP column and collected, while adsorbed FAswere eluted with 0.5 M NaOH.
For UV-vis and �uorescence spectroscopy, HA fractions were re-dissolved in 0.1 M phosphate buffer (pH 7.0).
Total extractable carbon (TEC) and organic C in the FA and NH fractions were measured with a total organiccarbon analyzer (TOC-VCPN, Shimadzu) after appropriate dilution and neutralization of solutions.
2.4 Humic acid characterization
2.4.1 C/N ratio and carbon isotope compositionThe content of carbon (%C) and nitrogen (%N) and the carbon stable isotope composition (δ13C) of thelyophilized HAs were determined with a Costech Elemental Combustion System 102 elemental analyzer (CostechInstruments) coupled with a Thermo Scienti�c 103 Delta V Advantage Isotope Ratio Mass Spectrometer (ThermoScienti�c). Isotopic results were expressed in the usual δ notation in parts per mil (‰) versus the internationalstandard Vienna Pee Dee Belemite (V-PDB). Caffeine IAEA 600 was used as certi�ed reference material.
2.4.2 UV-vis spectrometryHA solutions were prepared by dissolving 5.0 ± 0.1 mg of each sample in 10 mL of 0.1 M phosphate buffer (pH7.0). UV-vis spectra (200–600 nm) were recorded with a UV-visible spectrophotometer (Cary 1E, Varian), using a 1cm quartz cuvette, after properly diluting and equilibrating the prepared solution at room temperature (20°C) for24 hours.
The E4/E6 ratios were calculated from absorbance measurements at 465 and 665 nm. The speci�c UVabsorbance at 254 nm (SUVA254) was determined by normalizing the UV absorbance at 254 nm with respect tothe C concentration in the cuvette (Shirshova et al. 2006).
2.4.3 Fourier-transformed infrared (FTIR) spectrometryThe FTIR spectra of freeze dried HAs were recorded on a Perkin Elmer FTIR spectrometer (Spectrum 100) using auniversal ATR sample accessory, over an interval of 4000 to 800 cm-1 (32 scans in each acquisition). Spectrawere recorded in transmission mode but are reported in absorbance units to calculate peak intensities. A linearbaseline correction was applied to compare spectra (Inbar et al. 1989). Ratios between main characteristic peaks(i.e. 3400, 1720, 1625 cm-1) to the 1020 cm-1 peak were calculated after baseline compensation.

Page 6/23
2.4.4 Fluorescence spectrometryFluorescence excitation emission matrix (EEM) spectroscopy of HA solutions (diluted to 80 mg L-1) was recordedwith an Agilent Technologies Cary Eclipse �uorescence spectrometer using quartz cuvettes (1 cm x 1 cm).Excitation and emission wavelength ranges were set from 220 to 500 nm (5 nm intervals) and from 300 to 650nm, respectively. The scan rate was 600 nm min-1 (average time of 0.1 s and data interval of 1 nm). Theconcentration of 80 mg L-1 was chosen after preliminary tests (Electronic Supplementary Material, Fig. S3),according to the recommendations of Belin et al. (1993), Shirshova and Khomutova (1994) and Zimmermann etal. (1997).
2.4.5 Electron Spin Resonance (ESR)The free radical content of HAs was measured using a Bruker EMX EPR spectrometer operating in the X-band (9.5GHz). About 40 mg of sample (equivalent to 10 mm in height) were placed in 3.5 mm quartz tubes. Each samplewas analyzed at room temperature in duplicate and the results are reported as the number of spins per gram of C(spins g C-1) ± standard deviation. Other instrumental parameters were: center �eld 3410 G, sweep width 160 G,sweep time 60 s, microwave power 0.2 mW, modulation amplitude 1 G, and receiver gain 104. The number ofscans varied from 1 to 9 as function of the signal to noise ratio of each sample. The microwave power of 0.2 mWwas chosen after performing the power saturation curve. Quanti�cation of radicals was performed by thesecondary standard method, using Cr(III)MgO (g = 1.9797) as a paramagnetic marker (permanently placed in theresonance cavity) calibrated with strong pitch reference (Bruker) of known free radical content (Martin-Neto et al.2001).
2.6 Statistical analysisMeasurements and analyses on soils were based on oven-dried soil, replicated three times and reported as mean ± standard deviation (SD). Data were analyzed using analysis of variance (ANOVA) with the Tukey HSD post-hoctest. Differences between treatments were considered signi�cant at P < 0.05 and identi�ed in the Figures andTables with different letters. Data were statistically analyzed with R software (R Development Core Team 2010).
3 Results And Discussion
3.1 Changes in soil chemical propertiesSoil pH and the amount of carbonates are the main differences between the two soils compared in this study(Table 1). Soil washing increased the pH of the acidic soil from 5.1 to 5.9, and had only a slight effect on thecalcareous soil (from 6.7 to 7.1). Recultivation had negligible effects on either soil pH or carbonates.

Page 7/23
Table 1Soil properties and potentially toxic metals in original calcareous and acidic soil, after CaEDTA-soil washing
(Remediated) and after two cycles of cultivation (Re-cultivated)Soil type Calcareous soil Acidic soil
Treatment Original Remediated Re-cultivated Original Remediated Re-cultivated
Sand (%) 42.2 34.8 n.d.** 42.5 31.5 n.d.
Silt (%) 47.7 55.3 n.d. 45.9 52.1 n.d.
Clay (%) 10.1 9.9 n.d. 11.6 16.4 n.d.
pH (CaCl2) 6.7 ± 0.1* 7.1 ± 0.2 7.2 ± 0.2 5.1 ± 0.1 5.9 ± 0.2 6.2 ± 0.2
CaCO3 (%) 20.3 ± 0.9 17.0 ± 1.1 16.5 ± 1.4 1 ± 0.3 1 ± 0.4 0 ± 0.3
TOC (mgg− 1)
38.4 ± 2.8 39.8 ± 3.3 37.7 ± 2.9 26.2 ± 1.7 24.6 ± 2.1 24.4 ± 1.9
Total N(mg g− 1)
3.7 ± 0.3 3.9 ± 0.2 3.4 ± 0.3 2.9 ± 0.2 2.7 ± 0.2 2.5 ± 0.2
CEC(cmol+ kg−
1)
29.3 36.6 n.d. 16.4 20.0 n.d.
P2O5 (mgkg− 1)
106 106 n.d. 4 7 n.d.
K2O (mgkg− 1)
173 182 n.d. 207 214 n.d.
Fe (mgkg− 1)
31388 30180 29750 35800 38300 37250
Mn (mgkg− 1)
828 392 450 931 672 691
Cd (mgkg− 1)
25.9 ± 0.3 11.7 ± 0.3 12.5 ± 0.6 4.2 ± 0.1 1.5 ± 0.1 1.4 ± 0.2
Pb (mgkg− 1)
4029 ± 10 1695 ± 17 1620 ± 1 8 774 ± 11 162 ± 6 174 ± 4
Zn (mgkg− 1)
2219 ± 16 1905 ± 48 1901 ± 52 339 ± 5 229 ± 4 235 ± 13
* Standard deviation
** n.d. Not determinated

Page 8/23
The original Pb concentrations were 4029 ± 10 and 774 ± 11 mg kg− 1 in the calcareous and acidic soils,respectively. Both greatly exceeded the respective thresholds of the national regulation levels of 530 and 500 mgkg− 1 for Slovenia and Austria (O�cial Gazette of the Republic of Slovenia 1996; Austrian Standards Institute2013) (Austrian Standards Institute 2013; O�cial Gazette of the Republic of Slovenia 1996). CaEDTAremediation removed 58 and 79% of the Pb from the calcareous and the acidic soils, respectively (Table 1). Inspite of the fact that a higher CaEDTA dose was used (60 vs. 100 mmol kg− 1), Pb extractability was hindered inthe calcareous soil by the abundance of Ca ions, derived from the dissociation of carbonates, which stabilizedthe CaEDTA complex (Manouchehri et al. 2006). The Zn content decreased from 2219 to 1905 and from 339 to229 mg kg− 1 in the calcareous and acidic soils, respectively, corresponding a decrease of 14 and 32%,respectively. Cadmium showed a percentage decrease that was comparable to Pb. Iron was apparently notaffected, while Mn decreased signi�cantly (52 and 28% in the calcareous and acidic soils, respectively).
3.2 Quantitative changes in soil organic matter fractionsIn both soils the total soil organic C (TOC) was not signi�cantly changed by the soil washing process, althoughwe found a statistically non-signi�cant TOC decrease (-6.1%) in the acidic soil, which did not recover afterrecultivation (Table 2). Although washing did not affect the total amount of SOC, we found signi�cant losses intotal extractable carbon (TEC), corresponding to 24% and 26% in calcareous and acidic soils, respectively(Table 2). Although the calcareous soil had a much higher TOC content than the acidic soil (38.4 versus 26.2 mgC g− 1), the soils yielded similar amounts of extractable C (15.6 and 13.9 mg C g− 1) and were subject to similarTEC losses during washing. These losses occurred mainly in the free TEC fraction (TEC extracted with 0.5 MNaOH), while the bound TEC (extracted by subsequent extraction with alkaline pyrophosphate) did not decreasein the calcareous soil. In acidic soil, the bound TEC even increased, probably due to the increase in the soil pH(from 5.1 to 5.9) and the release of calcium ions by CaEDTA, which favored the binding of extractablecompounds to soil minerals (Rowley et al. 2018). The total amounts of HAs decreased in calcareous and acidicsoils by 23% and 36%, respectively. This decrease concerned only the free HA fractions, which decreased incalcareous and acidic soils by 45 and 53%, respectively. Similar to TEC, the bound HA, not only remainedunchanged in calcareous soils, but even increased signi�cantly in acidic soil, from 1.13 mg C g− 1 in the originalsoil to 1.94 mg C g− 1 in the CaEDTA washed soil.
Page 9/23
Table 2Soil organic C and its fractionation in calcareous and acidic soil (Original), after CaEDTA-soil washing
(Remediated) and after two cycles of cultivation (Re-cultivated) expressed either as mg C g− 1 soil and aspercentage of SOC or TEC
Soil type Treatment OCfraction
SOC TEC HA FA NH
mgCg− 1
mg Cg− 1
% toSOC
mgCg− 1
% toTEC
mgCg− 1
% toTEC
mgCg− 1
% toTEC
Calcareous Original Total 38.4a*
15.16a
39.5 9.74a
64.2 2.67a
17.6 2.76a
18.2
Free 6.67a
17.4 4.30a
64.5 1.02a
15.3 1.35a
20.2
Bound 8.49a
22.1 5.44a
64.0 1.65a
19.4 1.41a
16.6
Remediated Total 39.8a
11.57b
29.1 7.53b
65.1 2.15b
18.6 1.89b
16.4
Free 4.00b
10.0 2.22b
55.6 0.69b
17.4 1.08b
27.0
Bound 7.58a
19.0 5.31a
70.1 1.46a
19.2 0.81c
10.7
Re-cultivated
Total 37.7a
11.76b
32.9 7.64b
64.9 2.07b
17.6 2.05b
17.4
Free 3.60b
10.1 1.99b
55.4 0.71b
19.7 0.90b
25.0
Bound 8.16a
22.9 5.64a
69.2 1.37a
16.7 1.15b
14.1
Acidic Original Total 26.2a
13.92a
53.1 8.65a
62.1 2.14a
15.3 3.14a
22.6
Free 11.63a
44.4 7.51a
64.6 1.71a
14.7 2.42a
20.8
Bound 2.29a
8.7 1.13a
49.6 0.43a
18.8 0.72a
31.6
Remediated Total 24.6a
10.25b
41.7 5.48b
53.5 1.93a
18.8 2.84a
27.7
Free 6.70b
27.2 3.55b
52.9 1.16b
17.3 2.00a
29.8
Bound 3.55c
14.4 1.94b
54.7 0.77b
21.6 0.84a
23.7
Re-cultivated
Total 24.4a
8.74b
35.8 4.34b
49.7 1.69a
19.3 2.71a
31.0
Free 5.79b
23.7 2.67b
46.2 1.13b
19.6 1.98a
34.2

Page 10/23
Soil type Treatment OCfraction
SOC TEC HA FA NH
Bound 2.96b
12.1 1.67b
56.5 0.56a
18.8 0.73a
24.8
SOC: Soil organic C, TEC: Total Extractable C; HA: Humic Acids; FA: Fulvic acids; NH: Non humic C
* Different letters refer to statistically differences (Tukey HSD Post-hoc test P < 0.05); comparisons are exclusivelybetween the same fraction of the three treatments: original, remediated, re-cultivated, and of the same soil.
Fulvic acids (FA) showed a decrease in both soils that paralleled the TEC �ndings, with no signi�cant changesobserved in percentage terms (Table 2). The loss of FAs in the calcareous soil was also largely due to the free FAfraction, which showed a signi�cant decrease in the acidic soil that was concomitant with a slight butstatistically signi�cant increase in the bound FA fraction.
The non-humic fraction (NH) of extractable organic matter represented about 10 to 27% and 21 to 31% of the freeand bound TEC fractions of the calcareous and acidic soils, respectively. The remediation treatment in thecalcareous soil caused a C loss in this fraction proportional to that of TEC, and occurred in both the free andbound fractions. No signi�cant changes were observed in the acidic soil (Table 2). Non humi�ed organic matter(NH) is important in soil fertility, as it is the main fraction that directly supports the soil microbial biomass in itsgrowth, survival and activities (De Nobili et al. 2001). The limited effect of soil washing on this SOM fraction, inparticular in the acidic soil, is in agreement with the results obtained by Kaurin et al. (2015, 2018, 2020), whichshowed a preservation of microbial and enzyme activities after CaEDTA soil washing.
Looking at the qualitative composition of TEC non-humi�ed and humi�ed C, the increase in the NH/(FA + HA)ratio clearly shows that soil washing in both soils caused the preferred loss of the free fractions of humi�edorganic C (2.08 and 3.96 mg g− 1 HAs and 0.33 and 0.55 mg g− 1 FAs from the calcareous and acidic soils,respectively), while the bound TEC fractions showed the opposite trend, with a greater loss of NH than humi�ed C(Electronic Supplementary Material, Table S1). Before the remediation, the NH/(FA + HA) ratio was 0.22 and didnot change after soil washing and recultivation of the calcareous soil, whereas it was slightly higher in the acidicsoil (0.29), indicating a lower degree of SOM humi�cation, but then further increased to 0.38 after soil washingand to 0.45 after recultivation of the remediated soil. The remediation treatment therefore had a strongerin�uence on the humi�ed fractions (FAs and HAs) of the acidic soil. Recultivation of remediated soils with twoseries of vegetable crops did not cause signi�cant quantitative changes in the TEC, HAs and FAs in thecalcareous soil, but increased the bound NH fraction (Table 2). This increase did not compensate for the lossesin the free fraction so the NH/(FA + HA) ratio of TEC remained practically unchanged. However, recultivationrestored the original ratios of free/bound NH in both soils (Electronic Supplementary Material, Table S1). Theratios of free to bound extractable C (TEC) ranged from 0.79 in calcareous soil to 5.08 in acidic soil, inaccordance with the much higher amount of binding polycations (especially Ca and Mg) present in calcareoussoil (Electronic Supplementary Material, Table S1). In both soils, CaEDTA soil washing caused this ratio todecrease, indicating a greater loss of the free fraction. In particular, while this fraction was lost from thecalcareous soil, in the acidic soil part of the free extractable C was bound to soil minerals, which led to asimultaneous increase in the bound TEC fraction.

Page 11/23
Indeed, the free humi�ed fractions have well-documented stimulating effects on plant growth (Chen et al. 2004;Vujinović et al. 2020) and play an important role in plant nutrition as complexing agents of severalmicronutrients, including Fe and Mn (Cesco et al. 2000). Free HAs also represent a slowly degradable N-reserve(Stevenson 1994), while the degradation of bound HAs is hindered not only by intrinsic chemical stability butalso by binding to minerals.
The ratios of free/bound humic substances (HA + FA) decreased from 0.75 to 0.43 and from 5.9 to 1.7 incalcareous and acidic soils, respectively, which illustrates the stronger in�uence of CaEDTA soil washing on thefree humic substances fraction in acidic soils (Electronic Supplementary Material, Table S1). Yip et al. (2010)showed that the adsorption of HAs on the surface of soil minerals after EDDS washing reached up to 75%, andthe same effect can be assumed for CaEDTA. The simultaneous increases in pH and the Ca ion concentration areprobably the most important factors responsible for the observed shift from free to bound humic substances.
The most important fractions of the SOM regarding stability and permanent effect on the physical properties ofsoils, is the bound HA and FA fraction. This fraction was preserved by washing the soil with CaEDTA, whereas thefree humi�ed fraction (FA + HA) decreased signi�cantly. In addition to the targeted PTMs, EDTA forms stablecomplexes with a variety of polycations in soils such as Al, Ca, Fe and Mg (Zeng et al. 2005), and this may havean adverse effect on the structure and physical properties of the soil matrix. Similarly, Tsang et al. (2007)observed the dissolution of native Fe/Al oxides, Ca carbonates and organic matter in soils that have been �ushedwith Na2EDTA. It was reported that CaEDTA, as used in this study, has a less negative effect on soil properties
(Lestan 2017; Theodoratos et al. 2000). Indeed, the soil washing solution provides Ca2+ ions that effectivelypromote the formation of cationic bridges. In this situation, the binding of organic matter to soil minerals ismaintained, and this is the main reason why the bound humic fractions have not been reduced like the freehumic fractions.
3.3 Qualitative changes in the HA fractions
3.3.1 The C/N ratio and carbon isotope composition of HAThe C/N ratios of free and bound HAs extracted from the calcareous soil was on average about 20% higher thanfrom the corresponding fraction in acidic soil (Fig. 2a). On the other hand, in both soils the C/N ratios of boundHAs were signi�cantly higher than those of free HA, indicating a proportionally lower N content. Soil washing andrecultivation did not in�uence the C/N ratio of bound HA, while recultivation signi�cantly decreased the C/N ratioof free HA.
A difference of about − 1‰ in the δ13C values was found between the corresponding fractions extracted fromcalcareous and acidic soils due to the different origin of their organic C inputs. The carbon stable isotopiccomposition of both the free and bound HAs did not allow the different soil treatments to be distinguished(Fig. 2b), indicating that CaEDTA soil washing did not cause signi�cant isotopic fractionation. Also, recultivationdid not affect the 13C signature of HA: this was expected, as HAs are the most stable components of soil organicmatter, and their formation would eventually be accompanied by an increase in SOC, which we did not observe.
3.3.2 UV-vis spectroscopy of HAThe speci�c absorbance (SA) spectra of free and bound HAs (Electronic Supplementary Material, Fig. S1)increased monotonically with decreasing wavelength and showed a shoulder around 260–280 nm (more

Page 12/23
pronounced in the free HA). Each spectrum represents the sum of the absorption bands of the componentchromophores (Sparks et al. 1996), typically C = C and C = O groups (Stevenson 1982).
Differences between spectra have been highlighted by taking into account the spectral parameters E4/E6 andSUVA254. It is often claimed that the E4/E6 ratio is related to the aromaticity and degree of condensation ofaromatic carbons in the HAs, and has been proposed as a humi�cation index (Stevenson 1982; Srilatha et al.2013; Zalba et al. 2016). This ratio is independent of the concentration of HAs, but varies according to their typeand origin (Tahiri et al. 2016). However, Chen et al. (1977) showed that the E4/E6 ratio increases when themolecular weight of the humic substances decreases. Changes in the E4/E6 ratios were negligible for the boundHA fraction after remediation (Table 3). In contrast, a signi�cant increase in this ratio in the free HAs of both soilswas observed after soil washing with CaEDTA. This indicates that the loss of HAs (Table 2) was eitherassociated with the removal of larger molecular components from this fraction during the washing treatment(which is unlikely, due to its lower solubility) or, more likely, was associated with an interruption of theintermolecular bonds. Indeed, CaEDTA (due to its relatively high concentration and complexing capacity) is ableto disrupt cationic bridges between HA molecules, resulting in an apparent decrease in molecular size. Thisinterpretation is con�rmed by the fact that SUVA254 values, which estimate the abundance of UV-absorbingchromophores (typically aromatic and carboxylic electron systems and their conjugates (McDonald et al. 2004),remained practically constant in all HA fractions of both soils. This indicated that neither the remediationtreatment nor the recultivation caused signi�cant changes in intrinsic structural complexity or aromaticity andthat the increase in the E4/E6 ratio was due to the disruption of polycationic bridges between the HA molecules.
Table 3UV-vis spectroscopic parameters of free and bound HA. Different letters refer to
statistically differences (p < 0.05) between the same fraction of the threetreatments
Soil type Treatment E4/E6 SUVA254
Free HA Bound HA Free HA Bound HA
Calcareous Original 5.8 a 6.0 a 4.5 a 5.2 a
Remediated 7.1 b 5.9 a 4.3 a 5.3 a
Re-cultivated 6.8 b 5.7 a 4.5 a 5.1 a
Acidic Original 4.9 a 5.3 a 4.1 a 4.3 a
Remediated 6.3 b 5.6 a 3.8 a 4.5 a
Re-cultivated 6.2 b 5.4 a 3.9 a 4.6 a
3.3.3 FTIR characterization of HAFTIR spectra re�ect the predominance of oxygen-containing functional groups (i.e. C-OH, OH and C = O) in humicsubstances (Schnitzer 1999). All FTIR spectra (Electronic Supplementary Material, Fig. S2) showed the typicalabsorption bands of HAs (Giovanela et al. 2004), but allowed the distinction between free and bound HAfractions, con�rming that these fractions correspond to different types of molecules. Bound HAs showed broaderand less resolved bands than free HAs, indicating a larger molecular complexity and a stronger contribution ofintra/intermolecular H-bonds (Bravo et al. 2020).
Page 13/23
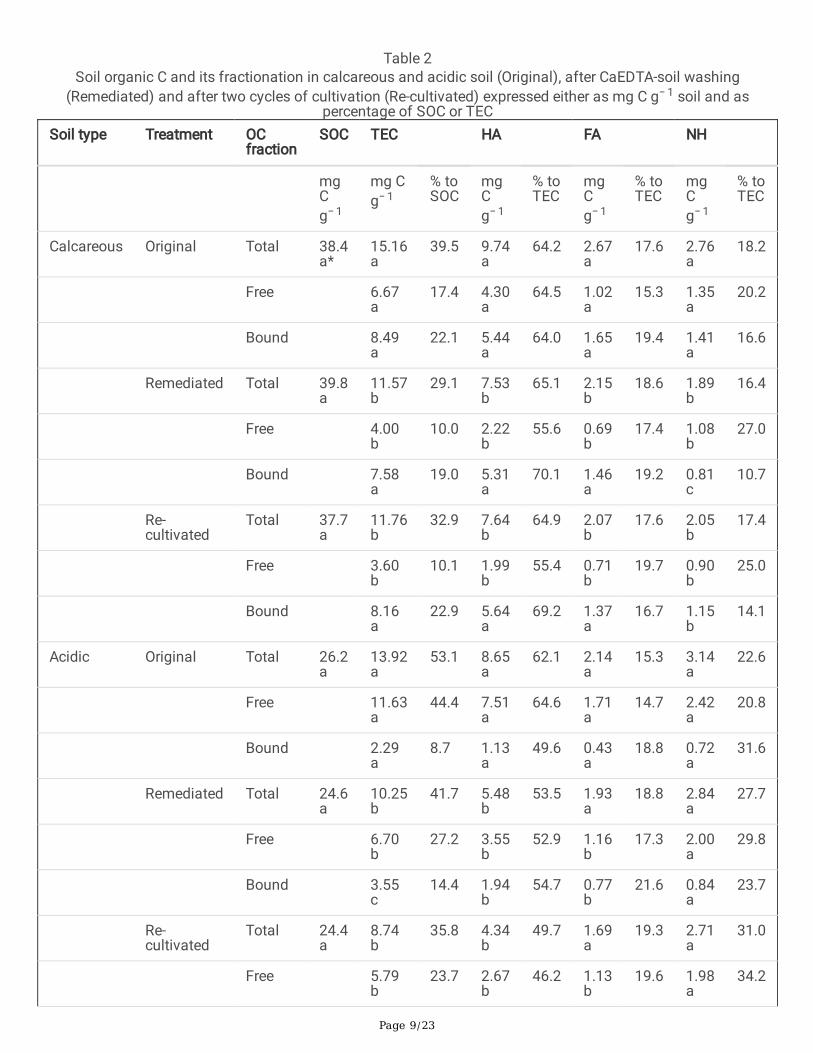
The intensity ratios of speci�c characteristic bands (Table 4) allowed highlighting of differences in thecomposition of HAs after soil washing and recultivation. Indeed, FTIR spectra of free HAs extracted from theremediated acidic soil showed an increase in absorption at 3400 cm− 1 (phenolic O-H stretching) and at 1625cm− 1 (aromatic C = C, functional quinone groups) in relation to absorption at 1020 cm− 1 (carbohydrate C-O andC-C stretching). The same was observed for free HAs in calcareous soil, but with less variation in aromaticstructures and a greater increase in aliphatic parts. The 1020 cm− 1 band can be attributed to the C-O and C-Cstretching vibrations of carbohydrate rings, and its relative decrease indicated a lower contribution of this type ofstructure in the remediated free HAs of both soils. Minor changes were observed in the bound HAs afterremediation, which are related to the fact that this fraction did not undergo any quantitative change and broughtabout a slight increase in both aliphatic and aromatic structures (C-H stretching and O-H stretching and bendingof phenols, aromatic C = C stretching) in the acidic soil. In calcareous soil, the structural composition of thebound HAs underwent virtually no modi�cation with soil washing, and no further modi�cation occurred to withrecultivation.
Table 4FTIR spectroscopic of free and bound HA in calcareous and acidic soil (Original), after CaEDTA-soil washing
(Remediated) and after two cycles of cultivation (Re-cultivated): ratio between principal peaks. Different lettersrefer to statistically differences (p < 0.05) between the same fraction of the three treatments
Soil type Treatment 3400/1020 cm− 1 1720/1020 cm− 1 1625/1020 cm− 1 1215/1020 cm− 1
FreeHA
BoundHA
FreeHA
BoundHA
FreeHA
BoundHA
FreeHA
BoundHA
Calcareous Original 0.18a
0.25 a 0.24a
0.46 a 0.34a
0.58 a 0.29a
0.49 a
Remediated 0.27a
0.27 a 0.34b
0.46 a 0.61b
0.66 a 0.65b
0.61 a
Re-cultivated
0.31b
0.32 a 0.34b
0.51 a 0.65b
0.69 a 0.63b
0.64 a
Acidicic Original 0.19a
0.25 a 0.48a
0.31 a 0.49a
0.48 a 0.48a
0.28 a
Remediated 0.30b
0.26 a 0.60b
0.39 a 0.63b
0.58 a 0.52a
0.47 b
Re-cultivated
0.30b
0.23 a 0.59b
0.38 a 0.63b
0.53 a 0.48a
0.42 b
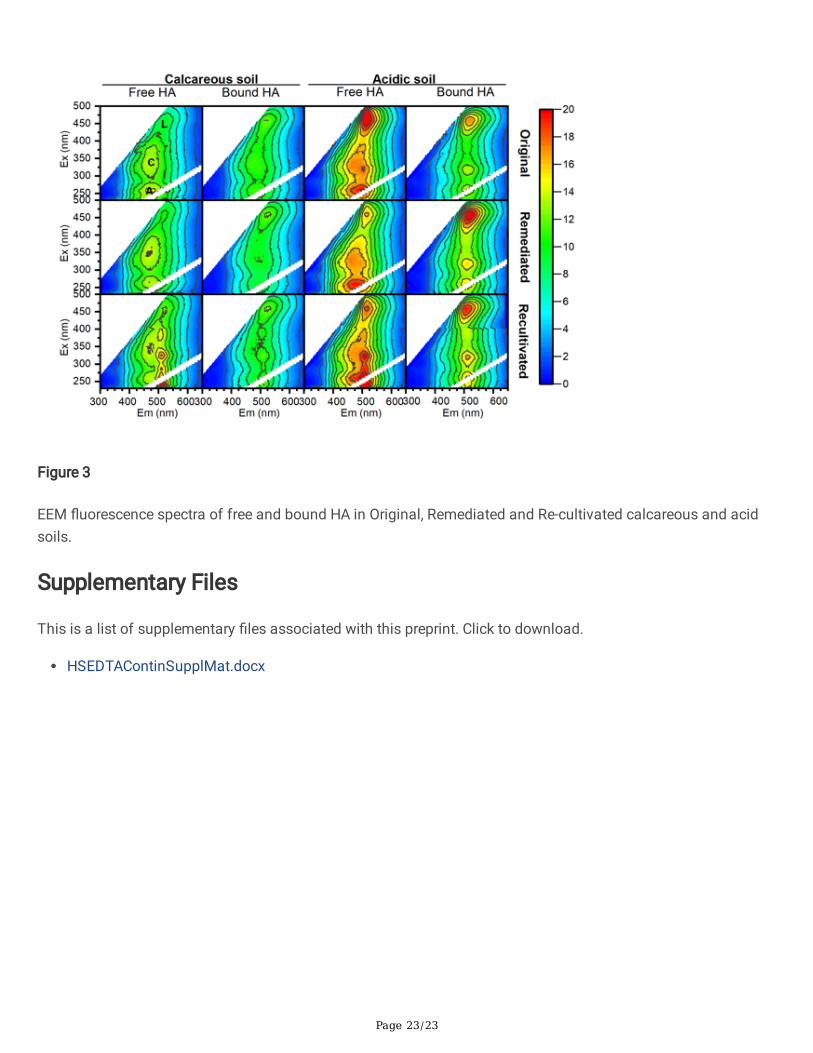
3.3.4 EEM �uorescence of HAEEM �uorescence spectroscopy has allowed identi�cation of different �uorescent peaks in HAs derived from anumber of origins (Chen et al. 2002; Santos et al. 2015). Figure 3 shows the EEM �uorescence spectra of free andbound HA extracts from both calcareous and acidic soils. All spectra were characterized by the presence of threemain peaks, in good agreement with those reported for other soil HAs (Antízar-Ladislao et al. 2006; Enev et al.2015). The principal peak (λem/λex = 455/510 nm), which occurred at long excitation and emission wavelengths,is characteristic of HAs derived from lignin (peak L) and other complex aromatic macromolecules (Matthews etal. 1996; Gao et al. 2019). Peak C (λem/ λex = 310/500 nm), which indicates phenol-like or naphthol-likestructures (Halim et al. 2013), is also typical for humic substances (Coble 1996). Finally, a peak at low excitation
Page 14/23
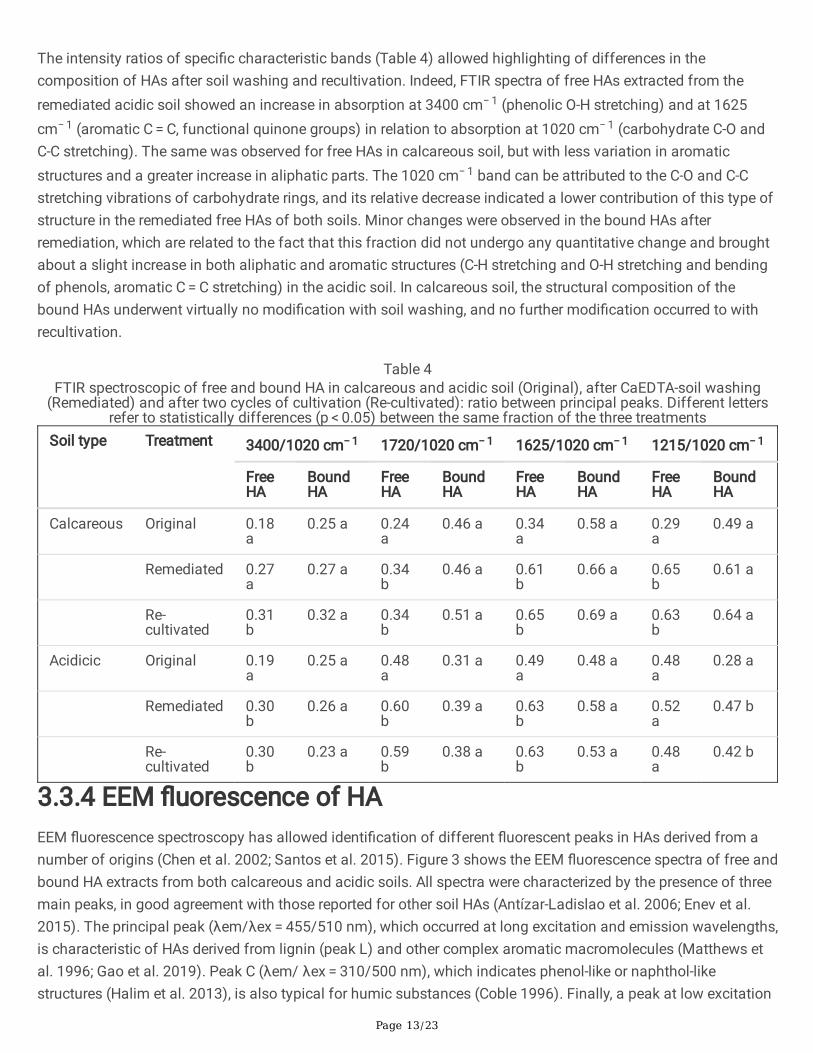
wavelengths (λem/λex = 260/500 nm) is typical for HAs from terrestrial environments (Peak A) (Tadini et al.2017).
All HA fractions extracted from the acidic soil showed a much higher �uorescence intensity than fractionsextracted from calcareous soil, and large differences were found for the free HA fractions. While there was nosigni�cant difference between the bound HA fractions, recultivation caused a redshift of about 20 nm and anincrease in the intensity of peaks A and C in the free HAs, indicating that some new �uorophores wereincorporated in the HA fraction in the presence of plants. Recultivation caused the incorporation of newnitrogenous components in the free HAs (Fig. 3). This is consistent with the hypothesis that free HAs are ayounger and more dynamic fraction than bound HAs.
3.3.5 ESR of HAsA representative solid state ESR spectrum is shown in the Electronic Supplementary Material, Fig. S4. Eachspectrum is composed of the signal of the organic radicals present in the sample and the signal of the secondarystandard. All spectra were characterized with a g-value of 2.004 ± 0.001, which corresponds to oxygen-centeredradical species such as semiquinones and methoxybenzenes (Martin-Neto et al. 1998; Watanabe et al. 2005).The concentration of free radicals in the extracted HAs is given in Table 5. Compared to free HAs, a signi�cantlyhigher concentration of radicals was found in the corresponding bound HAs, in accordance with their strongeraromatic character, which is con�rmed by their SUVA254 values and FTIR spectra. The line width of the radicalsignals was smaller in bound HAs than free HAs, suggesting a more stable molecular structure, with longerlifetime of the radical species in the bound HAs. Soil washing with CaEDTA had no effect on the concentration offree radicals either of the HA fractions in the calcareous soil (Table 5), while in the free HAs in the acidic soil asmall but signi�cant increase was observed, probably due to the increase in the soil’s pH. Changes in the freeradical content of the bound HA fraction in the acidic soil were not signi�cant.
Table 5The free-radical concentration in the extracted free and bound HA. Different
letters refer to statistically differences (p < 0.05) between the same fraction ofthe three treatments
Soil type Treatment spins g C− 1 (*1017) linewidth (G)
Free HA Bound HA Free HA Bound HA
Calcareous Original 2.78 a 5.24 a 7.32 a 5.63 a
Remediated 2.65 a 5.40 a 7.44 a 5.56 a
Re-cultivated 2.82 a 5.53 a 7.55 a 5.64 a
Acidic Original 2.50 a 4.48 a 7.80 a 5.74 a
Remediated 2.91 b 4.63 a 8.00 a 5.64 a
Re-cultivated 2.89 b 4.80 a 7.86 a 5.78 a
4 ConclusionsSoil washing with CaEDTA resulted in a selective reduction in the portion of FAs and HAs, which are not bound tosoil minerals (free FAs and HAs), but it preserved most of the bound extractable C, which is linked by cationic

Page 15/23
bridges to the surface of clays and Fe oxides. It can therefore be assumed that the surface properties of the solidmatrix of both soils were not damaged by the treatment. Surprisingly, no large difference has been foundbetween the two soils examined, irrespective of their contrasting mineralogy and pH.
Recultivation with two cycles of crops was not able to restore, either qualitatively or quantitatively, the mostdynamic fractions of the SOM, such as the NH and free HA fractions. In order to support soil fertility after EDTAsoil washing, we therefore propose to use organic amendments rich in humi�ed organic matter, such as maturefarmyard manure, compost or peat, as a way to rapidly restore the free fraction of the humi�ed SOM.
DeclarationsEthics approval and consent to participate
Not applicable
Consent for publication
Not applicable
Availability of data and materials
All data generated or analysed during this study are included in this published article and its supplementaryinformation �les.
Competing interests
The authors declare that they have no competing interests.
Funding
This work was supported by the Slovenian Research Agency, Grants J4-3609 and Z1-4272 and by TheInternational Humic Substances Society (Research Traineeship TRA 2019-2).
Authors' contributions
Conceptualization, DL and MC; methodology and investigation, EJ, CB and SG; resources, DL, MDN. and MNL.;data curation, EJ and CB; writing—original draft preparation, EJ, CB and MC; writing—review and editing, MC;supervision, DL and MDN; funding acquisition, DL and MC.
All authors read and approved the �nal manuscript.
Acknowledgements
This work was supported by the Slovenian Research Agency, Grants J4-3609 and Z1-4272.
Carlo Bravo acknowledges the �nancial support provided by Research Traineeship (TRA 2019-2) from theInternational Humic Substances Society.

Page 16/23
References1. Antízar-Ladislao B, Lopez-Real J, Beck AJ (2006) Investigation of organic matter dynamics during in-vessel
composting of an aged coal-tar contaminated soil using �uorescence excitation-emission spectroscopy.Chemosphere 64:839–847. https://doi.org/10.1016/j.chemosphere.2005.10.036
2. Ashraf MA, Hussain I, Rasheed R et al (2017) Advances in microbe-assisted reclamation of heavy metalcontaminated soils over the last decade: A review. J Environ Manage 198:132–143.https://doi.org/10.1016/J.JENVMAN.2017.04.060
3. Austrian Standards Institute A (2013) Austrian Standards Institute. ÖNORM L 1076 2013–-03‐15,Grundlagen zur Bodenfunktionsbewertung/Principles soil Funct Eval
4. Bachmann J, Guggenberger G, Baumgartl T et al (2008) Physical carbon-sequestration mechanisms underspecial consideration of soil wettability. J Plant Nutr Soil Sci 171:14–26
5. Begum ZA, Rahman IMM, Hasegawa H (2013) Management of EDTA-containing aqueous e�uent:environmental concerns and remedies. In: Molnar A (ed) EDTA: synthesis, uses and environmental concerns.Nova Science Publishers, Hauppauge, pp 163–177
�. Belin C, Quellec C, Lamotte M et al (1993) Characterization by �uorescence of the dissolved organic matterin natural water. Application to fractions obtained tangential ultra�ltration xad resin isolation. EnvironTechnol (United Kingdom) 14:1131–1144. https://doi.org/10.1080/09593339309385391
7. Bravo C, Millo C, Covelli S et al (2020) Terrestrial-marine continuum of sedimentary natural organic matter ina mid-latitude estuarine system. J Soils Sediments 20:1074–1086. https://doi.org/10.1007/s11368-019-02457-6
�. Cesco S, Römheld V, Varanini Z, Pinton R (2000) Solubilization of iron by water-extractable humicsubstances. J Plant Nutr Soil Sci 163:285–290. https://doi.org/10.1002/1522-2624(200006)163:3<285::AID-JPLN285>3.0.CO;2-Z
9. Chen J, Gu B, LeBoeuf EJ et al (2002) Spectroscopic characterization of the structural and functionalproperties of natural organic matter fractions. Chemosphere 48:59–68. https://doi.org/10.1016/S0045-6535(02)00041-3
10. Chen Y, Magen H, Clapp CE (2004) Mechanisms of plant growth stimulation by humic substances: The roleof organo-iron complexes. Soil Sci Plant Nutr 50:1089–1095.https://doi.org/10.1080/00380768.2004.10408579
11. Chen Y, Senesi N, Schnitzer M (1977) Information Provided on Humic Substances by E4/E6 Ratios. Soil SciSoc Am J 41:352–358. https://doi.org/10.2136/sssaj1977.03615995004100020037x
12. Coble PG (1996) Characterization of marine and terrestrial DOM in seawater using excitation-emissionmatrix spectroscopy. Mar Chem 51:325–346. https://doi.org/10.1016/0304-4203(95)00062-3
13. Das A, Patel SS, Kumar R et al (2018) Geochemical sources of metal contamination in a coal mining area inChhattisgarh, India using lead isotopic ratios. Chemosphere 197:152–164.https://doi.org/10.1016/J.CHEMOSPHERE.2018.01.016
14. De Nobili M, Bravo C, Chen Y (2020) The spontaneous secondary synthesis of soil organic mattercomponents: A critical examination of the soil continuum model theory. Appl Soil Ecol 154:103655
15. De Nobili M, Contin M, Mahieu N et al (2008) Assessment of chemical and biochemical stabilization oforganic C in soils from the long-term experiments at Rothamsted (UK). Waste Manag 28:723–733.
Page 17/23
https://doi.org/10.1016/j.wasman.2007.09.025
1�. De Nobili M, Contin M, Mondini C, Brookes PC (2001) Soil microbial biomass is triggered into activity bytrace amounts of substrate. Soil Biol Biochem 33:1163–1170. https://doi.org/10.1016/S0038-0717(01)00020-7
17. De Nobili M, Petrussi F (1988) Humi�cation index (HI) as evaluation of the stabilization degree duringcomposting. J Ferment Technol 66:577–583
1�. Dermont G, Bergeron M, Mercier G, Richer-La�èche M (2008) Soil washing for metal removal: A review ofphysical/chemical technologies and �eld applications. J Hazard Mater 152:1–31.https://doi.org/10.1016/J.JHAZMAT.2007.10.043
19. Doumas P, Munoz M, Banni M et al (2018) Polymetallic pollution from abandoned mines in Mediterraneanregions: a multidisciplinary approach to environmental risks. Reg Environ Chang 18:677–692
20. Enev V, Novak F, Turkeova I, Klucakova M (2015) Humic substances from typical Czech forest soil humicpodzol: chemical and spectroscopic characterization. In: 14th International Conference on EnvironmentalScience and Technology. Rhodes, Greece
21. Gao ZC, Lin YL, Xu B et al (2019) Effect of UV wavelength on humic acid degradation and disinfection by-product formation during the UV/chlorine process. Water Res 154:199–209.https://doi.org/10.1016/j.watres.2019.02.004
22. Giovanela M, Parlanti E, Soriano-Sierra EJ et al (2004) Elemental compositions, FT-IR spectra and thermalbehavior of sedimentary fulvic and humic acids from aquatic and terrestrial environments. Geochem J38:255–264
23. Gluhar S, Kaurin A, Lestan D (2020) Soil washing with biodegradable chelating agents and EDTA:Technological feasibility, remediation e�ciency and environmental sustainability. Chemosphere257:127226. https://doi.org/10.1016/j.chemosphere.2020.127226
24. Goulas A, Bourdat-Deschamps M, Nélieu S et al (2017) Development of a soft extraction method forsulfamethoxazole and transformation products from agricultural soils: Effects of organic matter co-extraction on the environmental availability assessment. Sci Total Environ 607–608:1037–1048.https://doi.org/10.1016/J.SCITOTENV.2017.06.192
25. Halim M, Spaccini R, Parlanti E et al (2013) Differences in �uorescence properties between humic acid andits size fractions separated by preparative HPSEC. J Geochemical Explor 129:23–27.https://doi.org/10.1016/j.gexplo.2012.11.006
2�. Hartley NR, Tsang DCW, Olds WE, Weber PA (2014) Soil Washing Enhanced by Humic Substances andBiodegradable Chelating Agents. Soil Sediment Contam 23:599–613.https://doi.org/10.1080/15320383.2014.852511
27. Hayes M, Swift R (2020) Vindication of humic substances as a key component of organic matter in soil andwater. Adv Agron 163:1–37. https://doi.org/10.1016/bs.agron.2020.05.001
2�. Hosseini SS, Lakzian A, Halajnia A, Hammami H (2018) The effect of olive husk extract compared to theedta on Pb availability and some chemical and biological properties in a Pb-contaminated soil. Int JPhytoremediation 20:643–649. https://doi.org/10.1080/15226514.2017.1365352
29. Hu P, Yang B, Dong C et al (2014) Assessment of EDTA heap leaching of an agricultural soil highlycontaminated with heavy metals. Chemosphere 117:532–537.https://doi.org/10.1016/J.CHEMOSPHERE.2014.08.081

Page 18/23
30. Huang Y, Chen Q, Deng M et al (2018) Heavy metal pollution and health risk assessment of agricultural soilsin a typical peri-urban area in southeast China. J Environ Manage 207:159–168.https://doi.org/10.1016/J.JENVMAN.2017.10.072
31. Jelusic M, Vodnik D, Macek I, Lestan D (2014) Effect of EDTA washing of metal polluted garden soils. Part II:Can remediated soil be used as a plant substrate? Sci Total Environ 475:142–152.https://doi.org/10.1016/j.scitotenv.2013.11.111
32. Jez E, Lestan D (2016) EDTA retention and emissions from remediated soil. Chemosphere 151:202–209.https://doi.org/10.1016/J.CHEMOSPHERE.2016.02.088
33. Kalra YP, Maynard DG (1991) Methods manual for forest soil and plant analysis. Canadian Forest Service,Northern Forestry Centre, Edmonton
34. Kaurin A, Cernilogar Z, Lestan D (2018) Revitalisation of metal-contaminated, EDTA-washed soil by additionof unpolluted soil, compost and biochar: Effects on soil enzyme activity, microbial community compositionand abundance. Chemosphere 193:726–736. https://doi.org/10.1016/J.CHEMOSPHERE.2017.11.082
35. Kaurin A, Gluhar S, Tilikj N, Lestan D (2020) Soil washing with biodegradable chelating agents and EDTA:Effect on soil properties and plant growth. Chemosphere 260:127673.https://doi.org/10.1016/j.chemosphere.2020.127673
3�. Kaurin A, Mihelič R, Kastelec D et al (2015) Consequences of minimum soil tillage on abiotic soil propertiesand composition of microbial communities in a shallow Cambisol originated from �uvioglacial deposits.Biol Fertil Soils 51:923–933. https://doi.org/10.1007/s00374-015-1037-9
37. Kushwaha A, Hans N, Kumar S, Rani R (2018) A critical review on speciation, mobilization and toxicity oflead in soil-microbe-plant system and bioremediation strategies. Ecotoxicol Environ Saf 147:1035–1045.https://doi.org/10.1016/J.ECOENV.2017.09.049
3�. Lestan D (2017) Novel chelant-based washing method for soil contaminated with Pb and other metals: Apilot-scale study. L Degrad Dev 28:2585–2595. https://doi.org/10.1002/ldr.2818
39. Lu Y, Shan G, Huang J, Li Q (2018) Insights into Characteristics of Dissolved Organic Matter Fractions in Co-composted Dairy Manure and Chinese Herbal Residues. Waste Biomass Valoriz 9:777–782.https://doi.org/10.1007/s12649-017-9842-z
40. Magdoff F, Weil RR (2004) Soil Organic Matter in Sustainable Agriculture, 1 st. CRC Press
41. Mahieu N, Olk DC, Randall EW (2002) Multinuclear Magnetic Resonance Analysis of Two Humic AcidFractions from Lowland Rice Soils. J Environ Qual 31:421–430. https://doi.org/10.2134/jeq2002.4210
42. Manouchehri N, Besancon S, Bermond A (2006) Major and trace metal extraction from soil by EDTA:Equilibrium and kinetic studies. Anal Chim Acta 559:105–112. https://doi.org/10.1016/j.aca.2005.11.050
43. Martin-Neto L, Rosell R, Sposito G (1998) Correlation of spectroscopic indicators of humi�cation with meanannual rainfall along a temperate grassland climosequence. Geoderma 81:305–311.https://doi.org/10.1016/S0016-7061(97)00089-X
44. Martin-Neto L, Traghetta DG, Vaz CMP et al (2001) On the Interaction Mechanisms of Atrazine andHydroxyatrazine with Humic Substances. J Environ Qual 30:520–525.https://doi.org/10.2134/jeq2001.302520x
45. Matthews BJH, Jones AC, Theodorou NK, Tudhope AW (1996) Excitation-emission-matrix �uorescencespectroscopy applied to humic acid bands in coral reefs. Mar Chem 55:317–332.

Page 19/23
https://doi.org/10.1016/S0304-4203(96)00039-4
4�. McDonald S, Bishop AG, Prenzler PD, Robards K (2004) Analytical chemistry of freshwater humicsubstances. Anal Chim Acta 527:105–124
47. O�cial Gazette of Republic of Slovenia S (1996) Uredba o mejnih, opozorilnih in kritičnih imisijskihvrednostih nevarnih snovi v tleh. Ur List RS, št 68/96 41/04 – ZVO-1
4�. Olk DC, Bloom PR, Perdue EM et al (2019) Environmental and Agricultural Relevance of Humic FractionsExtracted by Alkali from Soils and Natural Waters. J Environ Qual 48:217–232.https://doi.org/10.2134/jeq2019.02.0041
49. Olk DC, Cassman KG, Schmidt-Rohr K et al (2006) Chemical stabilization of soil organic nitrogen by phenoliclignin residues in anaerobic agroecosystems. Soil Biol Biochem 38:3303–3312.https://doi.org/10.1016/j.soilbio.2006.04.009
50. Peng W, Li X, Xiao S, Fan W (2018) Review of remediation technologies for sediments contaminated byheavy metals. J Soils Sediments 18:1701–1719. https://doi.org/10.1007/s11368-018-1921-7
51. R Development Core Team (2010) No Title. http://www.r-project.org/
52. Rice JA (2001) Humin Soil Sci 166:848–857
53. Rowley MC, Grand S, Verrecchia EP (2018) Calcium-mediated stabilization of soil organic carbon.Biogeochem 137:27–49. https://doi.org/10.1007/s10533-017-0410-1
54. Santos CH, Nicolodelli G, Romano RA et al (2015) Structure of humic substances from some regions of theAmazon assessed coupling 3D �uorescence spectroscopy and CP/PARAFAC. J Braz Chem Soc 26:1136–1142. https://doi.org/10.5935/0103-5053.20150076
55. Schnitzer M (1999) A Lifetime Perspective on the Chemistry of Soil Organic Matter. Adv Agron 68:1–58.https://doi.org/10.1016/S0065-2113(08)60842-1
5�. Shirshova LT, Khomutova TE (1994) The response of humic substances to soil acidi�cation and freezing.Environ Int 20:405–410. https://doi.org/10.1016/0160-4120(94)90127-9
57. Shirshova TL, Ghabbour EA, Davies G (2006) Spectroscopic characterization of humic acid fractionsisolated from soil using different extraction procedures. Geoderma 133:204–216.https://doi.org/10.1016/J.GEODERMA.2005.07.007
5�. Slepetiene A, Slepetys J, Liaudanskiene I et al (2011) Changes of soil organic carbon and mobile humicacids in response to different agricultural management. J Agric Sci 2:64–70
59. Sparks DL, Page AL, Helmke PA et al (1996) Organic Matter Characterization
�0. Srilatha M, Rao PC, Sharma SH, Padmaja G (2013) Physico - chemical characterization of humic substancesunder long – term application of fertilizers and manures in rice – rice cropping sequence in an Inceptisol. IntJ Adv Res 1:343–348
�1. Stevenson FJ (1994) Humus Chemistry: Genesis, Composition, Reactions. John Wiley & Sons
�2. Stevenson FJ (1982) Nitrogen in agricultural soils. American Society of Agronomy, Madison
�3. Tadini AM, Hajjoul H, Nicolodelli G et al (2017) Characterization of Organic Matter in Spodosol Amazonianby Fluorescence Spectroscopy. Int J Environ Chem Ecol Geol Geophys Eng 11:334–337
�4. Tahiri A, Richel A, Destain J et al (2016) Comprehensive comparison of the chemical and structuralcharacterization of land�ll leachate and leonardite humic fractions. Anal Bioanal Chem 408:1917–1928.https://doi.org/10.1007/s00216-016-9305-6

Page 20/23
�5. Tahmasbian I, Safari Sinegani AA, Nguyen TTN et al (2017) Application of manures to mitigate the harmfuleffects of electrokinetic remediation of heavy metals on soil microbial properties in polluted soils. EnvironSci Pollut Res 24:26485–26496. https://doi.org/10.1007/s11356-017-0281-y
��. Theodoratos P, Papassiopi N, Georgoudis T, Kontopoulos A (2000) Selective removal of lead from calcareouspolluted soils using the Ca-EDTA salt. Water Air Soil Pollut 122:351–368.https://doi.org/10.1023/a:1005295119231
�7. Tsang DCW, Zhang W, Lo IMC (2007) Copper extraction effectiveness and soil dissolution issues of EDTA-�ushing of arti�cially contaminated soils. Chemosphere 68:234–243.https://doi.org/10.1016/j.chemosphere.2007.01.022
��. Varrica D, Dongarrà G, Alaimo MG et al (2018) Lead isotopic �ngerprint in human scalp hair: The case studyof Iglesias mining district (Sardinia, Italy). Sci Total Environ 613–614:456–461.https://doi.org/10.1016/J.SCITOTENV.2017.09.106
�9. Viventsova E, Kumpiene J, Gunneriusson L, Holmgren A (2005) Changes in soil organic matter compositionand quantity with distance to a nickel smelter - A case study on the Kola Peninsula, NW Russia. In:Geoderma. Elsevier, pp 216–226
70. Vujinović T, Zanin L, Venuti S et al (2020) Biostimulant Action of Dissolved Humic Substances From aConventionally and an Organically Managed Soil on Nitrate Acquisition in Maize Plants. Front Plant Sci10:1652. https://doi.org/10.3389/fpls.2019.01652
71. Watanabe A, McPhail DB, Maie N et al (2005) Electron spin resonance characteristics of humic acids from awide range of soil types. Org Geochem 36:981–990. https://doi.org/10.1016/j.orggeochem.2005.03.002
72. Yi YM, Sung K (2015) In�uence of washing treatment on the qualities of heavy metal–contaminated soil.Ecol Eng 81:89–92. https://doi.org/10.1016/J.ECOLENG.2015.04.034
73. Yip TCM, Tsang DCW, Lo IMC (2010) Interactions of chelating agents with Pb-goethite at the solid–liquidinterface: Pb extraction and re-adsorption. Chemosphere 81:415–421.https://doi.org/10.1016/J.CHEMOSPHERE.2010.06.069
74. Zalba P, Amiotti NM, Galantini JA, Pistola S (2016) Soil Humic and Fulvic Acids from Different Land-UseSystems Evaluated By E4/E6 Ratios. Commun Soil Sci Plant Anal 47:1675–1679.https://doi.org/10.1080/00103624.2016.1206558
75. Zeng QR, Sauvé S, Allen HE, Hendershot WH (2005) Recycling EDTA solutions used to remediate metal-polluted soils. Environ Pollut 133:225–231. https://doi.org/10.1016/j.envpol.2004.06.006
7�. Zhou T, Wu L, Luo Y, Christie P (2018) Effects of organic matter fraction and compositional changes ondistribution of cadmium and zinc in long-term polluted paddy soils. Environ Pollut 232:514–522.https://doi.org/10.1016/J.ENVPOL.2017.09.081
77. Zimmermann U, Loehmannsroeben H-G, Skrivanek T (1997) Absorption and �uorescence spectroscopicinvestigations of PAC/humic substance-interactions in water. In: Cecchi G, Lamp T, Reuter R, Weber K (eds)Remote Sensing of Vegetation and Water, and Standardization of Remote Sensing Methods. SPIE, pp 239–249
7�. Zupanc V, Kastelec D, Lestan D, Grcman H (2014) Soil physical characteristics after EDTA washing andamendment with inorganic and organic additives. Environ Pollut 186:56–62.https://doi.org/10.1016/j.envpol.2013.11.027

Page 21/23
Figures
Figure 1
Layout of soil-washing experiment and SOM extraction and fractionation procedures

Page 22/23
Figure 2
C/N ratio (a) and carbon stable isotope composition (b) of free and bound humic acid (HA) extracted from theoriginal (●), remediated (o) and re-cultivated (x) soil samples. Bars represents standard deviation of the mean(n=3).
Page 23/23
Figure 3
EEM �uorescence spectra of free and bound HA in Original, Remediated and Re-cultivated calcareous and acidsoils.
Supplementary Files
This is a list of supplementary �les associated with this preprint. Click to download.
HSEDTAContinSupplMat.docx


![Structure of [ Co(EDTA) ] -](https://img.pdfslide.us/doc/110x75/56812b20550346895d8f1df4/structure-of-coedta-.jpg)


![Edta cleaning procedurefor_150mw[1]](https://img.pdfslide.us/doc/110x75/54bd26aa4a7959c93c8b4571/edta-cleaning-procedurefor150mw1.jpg)