Embed Size (px)
Citation preview
ERA-EDTA RegistryAcademic Medical CenterDepartment of Medical InformaticsPO Box 227001100 DE AmsterdamThe Netherlands
ISBN 978-90-817480-5-6
June 2015
Annual Report 2013
ERA-ED
TA Registry
AnnualReport
2013
ERA-EDTA Registry
www.era-edta-reg.org
ISBN 978-90-817480-5-6
Suggested Citation ERA-EDTA Registry: ERA-EDTA Registry Annual Report 2013. Academic Medical Center, Department of Medical Informatics, Amsterdam, The Netherlands, 2015
Disclaimer ERA-EDTA, its Registry Committee, AMC and its department of Medical Informatics disclaim any express or implied warranty of fi tness for the use of ERA-EDTA Registry products and shall not be liable for any direct, indirect or consequential loss; per-sonal injury; special or punitive damages; loss of profi ts, loss of savings and loss of revenue; loss of business, loss of reputation and loss of goodwill; and loss of data arising from the use of ERA-EDTA Registry products.
ERA-EDTA RegistryAnnual Report 2013
ERA-EDTA Registry
Academic Medical Center
Department of Medical Informatics
PO Box 22700
1100 DE Amsterdam
The Netherlands
Telephone +31 20 566 7637
E-mail [email protected]
Website www.era-edta-reg.org
ERA-EDTA Registry Committee
A Więcek, Poland (ERA-EDTA President)
C Wanner, Germany (Chairman)
FJ Caskey, United Kingdom
F Collart, Belgium
C Couchoud, France
D Fouque, France
JW Groothoff, The Netherlands
JG Heaf, Denmark
P Ravani, Italy
I Rychlik, Czech Republic
F Schaefer, Germany
S Schön, Sweden
Registry Office Staff
KJ Jager, epidemiologist (Managing Director)
M Bonthuis, epidemiologist (for paediatric section)
R Cornet, medical informatician
FW Dekker, epidemiologist
G Guggenheim, secretary
A Kramer, medical informatician
M Noordzij, epidemiologist
M Pippias, medical doctor
VS Stel, epidemiologist
AJ Weerstra, data manager
III
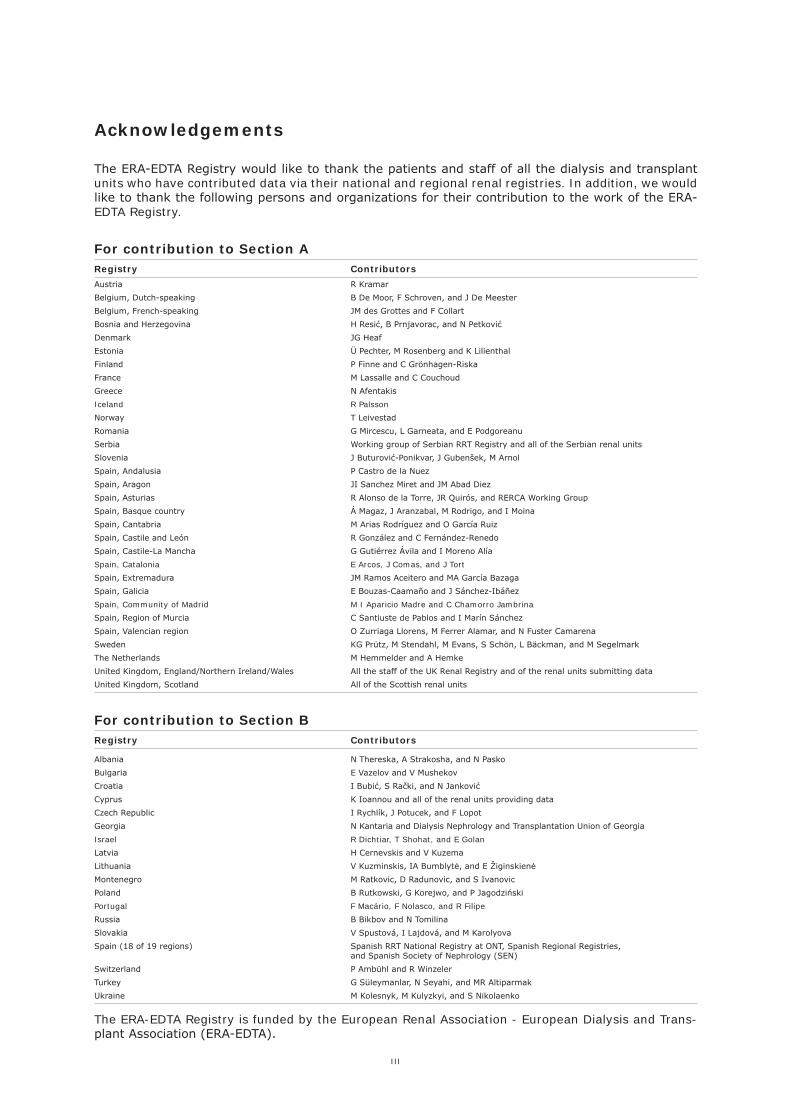
Acknowledgements
The ERA-EDTA Registry would like to thank the patients and staff of all the dialysis and transplant units who have contributed data via their national and regional renal registries. In addition, we would like to thank the following persons and organizations for their contribution to the work of the ERA-EDTA Registry.
For contribution to Section ARegistry Contributors
For contribution to Section BRegistry Contributors
The ERA-EDTA Registry is funded by the European Renal Association - European Dialysis and Trans-plant Association (ERA-EDTA).
Albania N Thereska, A Strakosha, and N Pasko
Bulgaria E Vazelov and V Mushekov
Croatia I Bubić, S Rački, and N Janković
Cyprus K Ioannou and all of the renal units providing data
Czech Republic I Rychlík, J Potucek, and F Lopot
Georgia N Kantaria and Dialysis Nephrology and Transplantation Union of Georgia
Israel R Dichtiar, T Shohat, and E Golan
Latvia H Cernevskis and V Kuzema
Lithuania V Kuzminskis, IA Bumblytė, and E Žiginskienė
Montenegro M Ratkovic, D Radunovic, and S Ivanovic
Poland B Rutkowski, G Korejwo, and P Jagodziński
Portugal F Macário, F Nolasco, and R Filipe
Russia B Bikbov and N Tomilina
Slovakia V Spustová, I Lajdová, and M Karolyova
Spain (18 of 19 regions) Spanish RRT National Registry at ONT, Spanish Regional Registries, and Spanish Society of Nephrology (SEN)
Switzerland P Ambühl and R Winzeler
Turkey G Süleymanlar, N Seyahi, and MR Altiparmak
Ukraine M Kolesnyk, M Kulyzkyi, and S Nikolaenko
Austria R Kramar
Belgium, Dutch-speaking B De Moor, F Schroven, and J De Meester
Belgium, French-speaking JM des Grottes and F Collart
Bosnia and Herzegovina H Resić, B Prnjavorac, and N Petković
Denmark JG Heaf
Estonia Ü Pechter, M Rosenberg and K Lilienthal
Finland P Finne and C Grönhagen-Riska
France M Lassalle and C Couchoud
Greece N Afentakis
Iceland R Palsson
Norway T Leivestad
Romania G Mircescu, L Garneata, and E Podgoreanu
Serbia Working group of Serbian RRT Registry and all of the Serbian renal units
Slovenia J Buturović-Ponikvar, J Gubenšek, M Arnol
Spain, Andalusia P Castro de la Nuez
Spain, Aragon JI Sanchez Miret and JM Abad Diez
Spain, Asturias R Alonso de la Torre, JR Quirós, and RERCA Working Group
Spain, Basque country Á Magaz, J Aranzabal, M Rodrigo, and I Moina
Spain, Cantabria M Arias Rodríguez and O García Ruiz
Spain, Castile and León R González and C Fernández-Renedo
Spain, Castile-La Mancha G Gutiérrez Ávila and I Moreno Alía
Spain, Catalonia E Arcos, J Comas, and J Tort
Spain, Extremadura JM Ramos Aceitero and MA García Bazaga
Spain, Galicia E Bouzas-Caamaño and J Sánchez-Ibáñez
Spain, Community of Madrid M I Aparicio Madre and C Chamorro Jambrina
Spain, Region of Murcia C Santiuste de Pablos and I Marín Sánchez
Spain, Valencian region O Zurriaga Llorens, M Ferrer Alamar, and N Fuster Camarena
Sweden KG Prütz, M Stendahl, M Evans, S Schön, L Bäckman, and M Segelmark
The Netherlands M Hemmelder and A Hemke
United Kingdom, England/Northern Ireland/Wales All the staff of the UK Renal Registry and of the renal units submitting data
United Kingdom, Scotland All of the Scottish renal units
IV
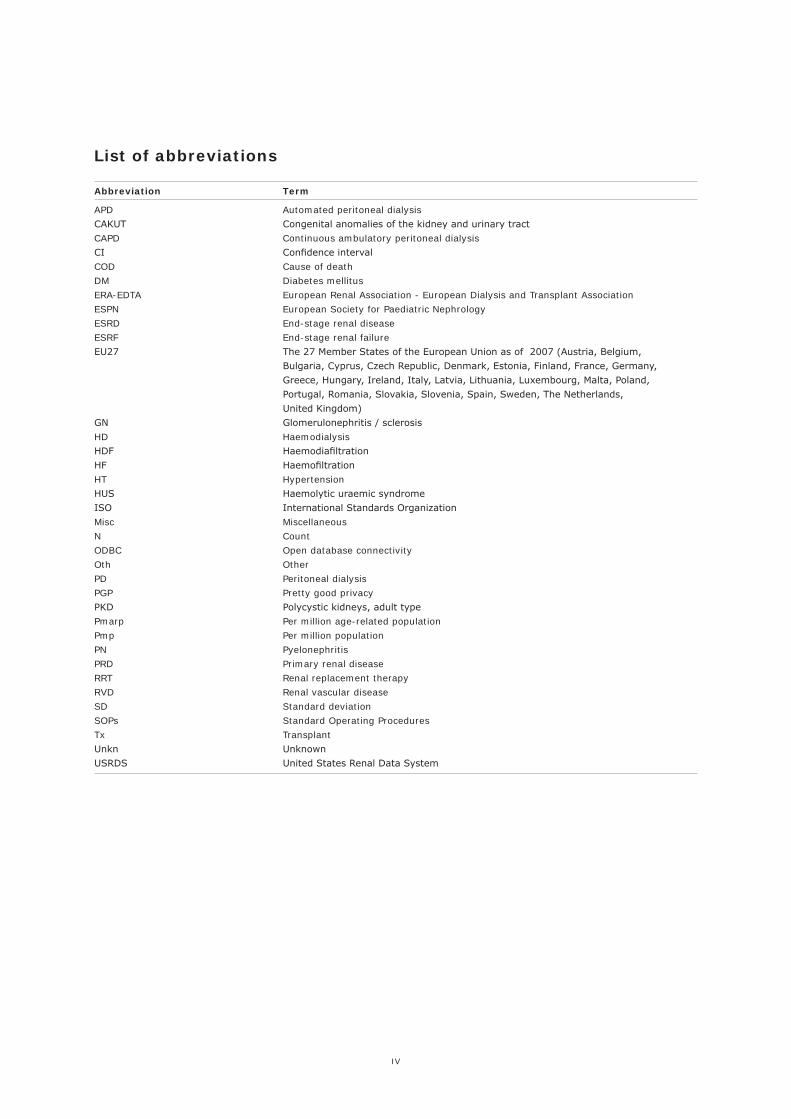
List of abbreviations
Abbreviation Term
APD Automated peritoneal dialysis
CAKUT Congenital anomalies of the kidney and urinary tract
CAPD Continuous ambulatory peritoneal dialysis
CI Confidence interval
COD Cause of death
DM Diabetes mellitus
ERA-EDTA European Renal Association - European Dialysis and Transplant Association
ESPN European Society for Paediatric Nephrology
ESRD End-stage renal disease
ESRF End-stage renal failure
EU27 The 27 Member States of the European Union as of 2007 (Austria, Belgium,
Bulgaria, Cyprus, Czech Republic, Denmark, Estonia, Finland, France, Germany,
Greece, Hungary, Ireland, Italy, Latvia, Lithuania, Luxembourg, Malta, Poland,
Portugal, Romania, Slovakia, Slovenia, Spain, Sweden, The Netherlands,
United Kingdom)
GN Glomerulonephritis / sclerosis
HD Haemodialysis
HDF Haemodiafiltration
HF Haemofiltration
HT Hypertension
HUS Haemolytic uraemic syndrome
ISO International Standards Organization
Misc Miscellaneous
N Count
ODBC Open database connectivity
Oth Other
PD Peritoneal dialysis
PGP Pretty good privacy
PKD Polycystic kidneys, adult type
Pmarp Per million age-related population
Pmp Per million population
PN Pyelonephritis
PRD Primary renal disease
RRT Renal replacement therapy
RVD Renal vascular disease
SD Standard deviation
SOPs Standard Operating Procedures
Tx Transplant
Unkn Unknown
USRDS United States Renal Data System
V
Table of Contents
I Introduction 13Chapter overview ................................................................................................................................................ 15
New to this edition .............................................................................................................................................. 15
ERA-EDTA Registry website ................................................................................................................................ 15
ESPN/ERA-EDTA Registry website ...................................................................................................................... 15
II Reference Tables - Section A 17
A1 AFFILIATED REGISTRY INFORMATION FOR 2013
Table A.1.1 .......................................................................................................................................................... 18General population of the country/region and percent coverage of general population
Table A.1.2 .......................................................................................................................................................... 19Renal centres: total number of centres and number of collaborating centres
A2 INCIDENT PATIENTS ACCEPTED FOR RRT IN 2013, AT DAY 1
Table A.2.1 .......................................................................................................................................................... 20Incident counts and percentagesat day 1, by age and gender
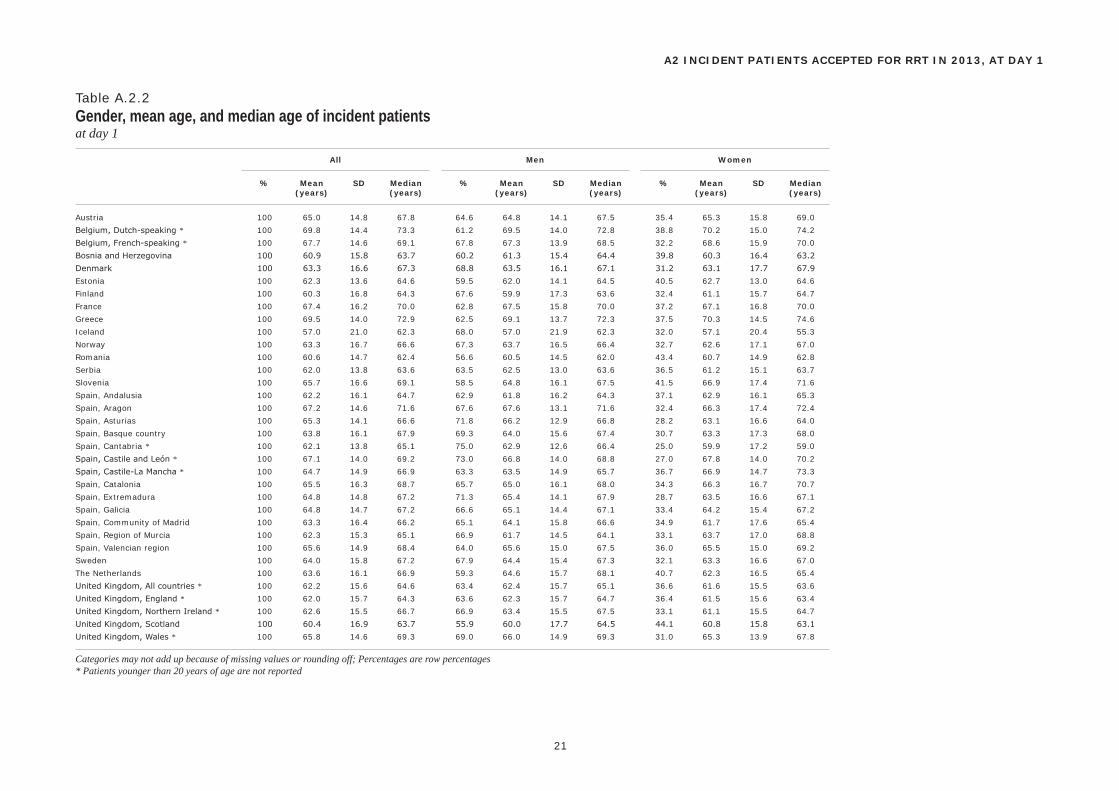
Table A.2.2 .......................................................................................................................................................... 21Gender, mean age, and median age of incident patientsat day 1
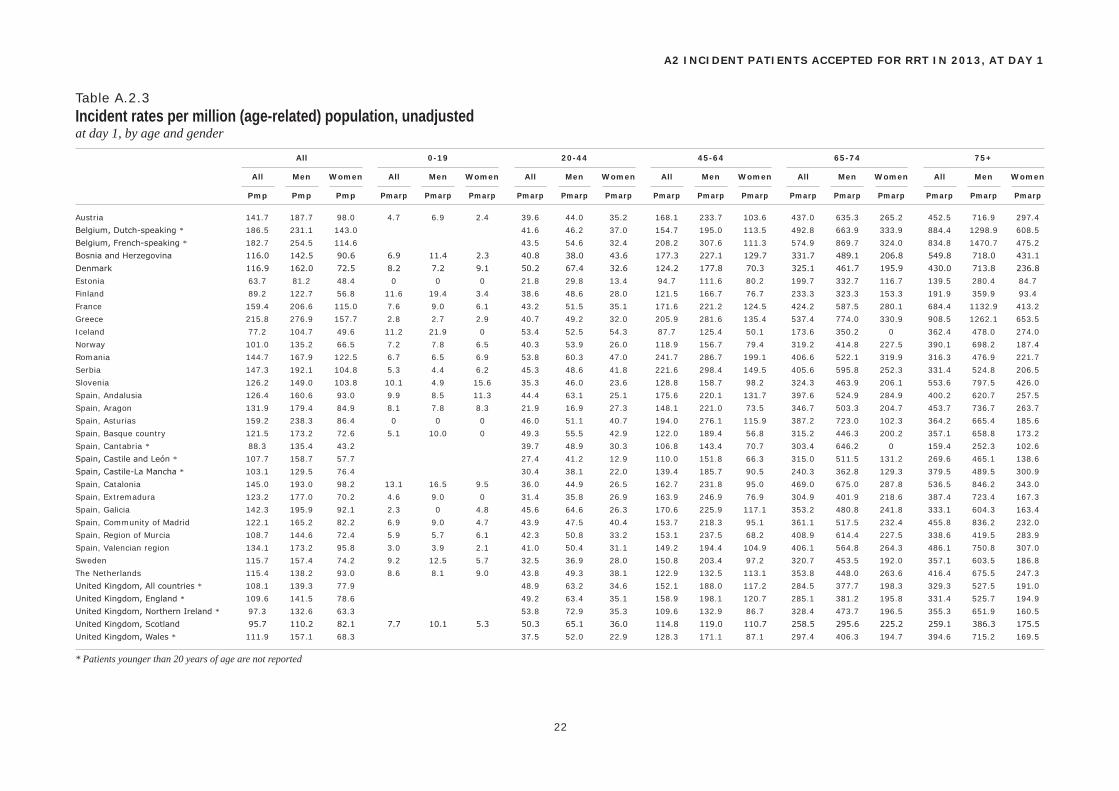
Table A.2.3 .......................................................................................................................................................... 22Incident rates per million (age-related) population, unadjustedat day 1, by age and gender
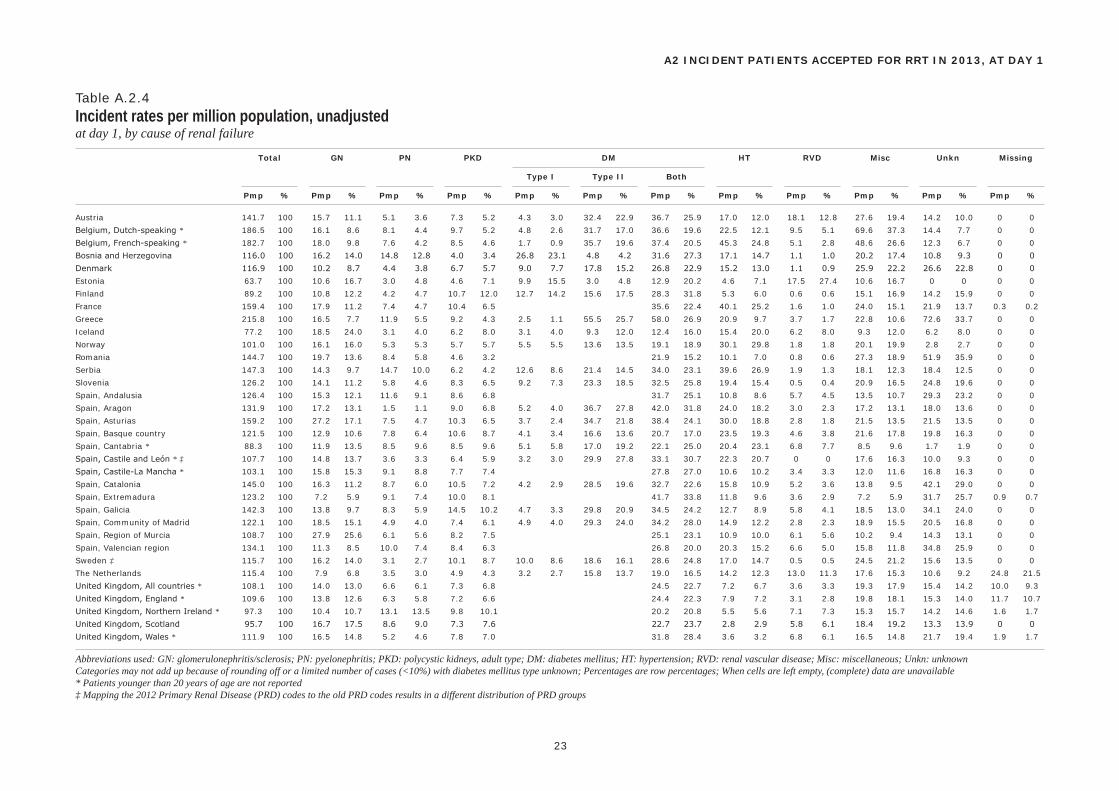
Table A.2.4 .......................................................................................................................................................... 23Incident rates per million population, unadjustedat day 1, by cause of renal failure
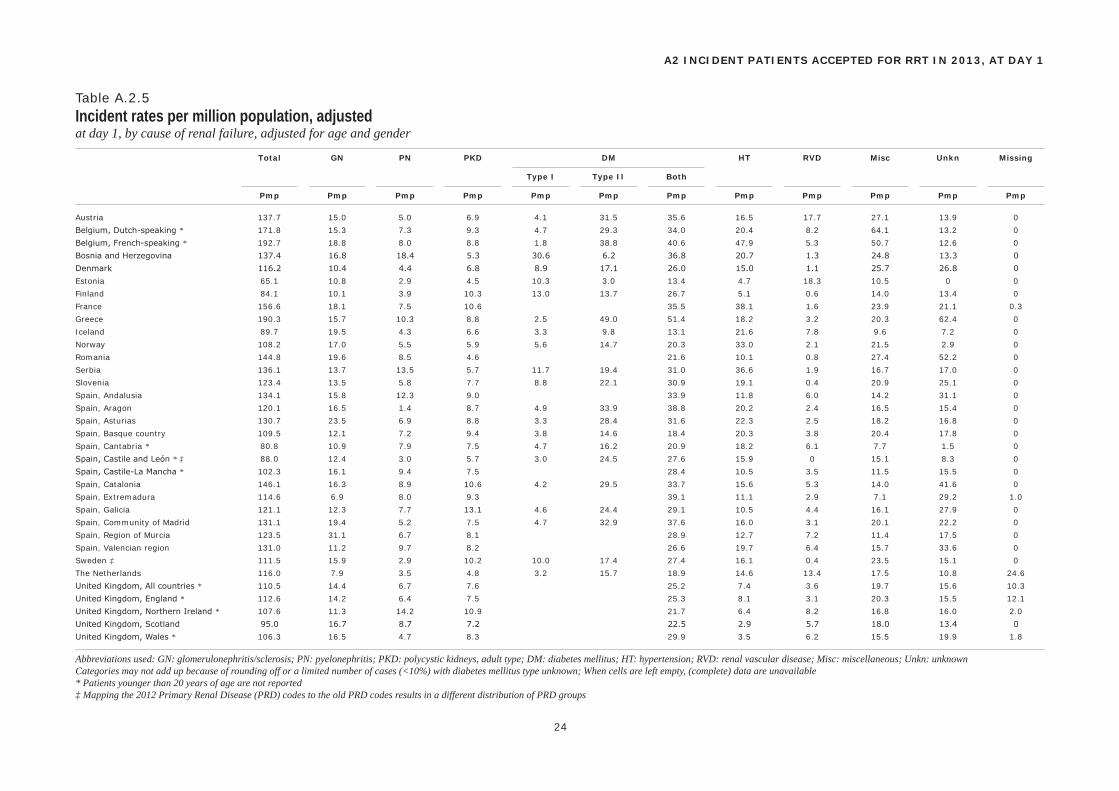
Table A.2.5 .......................................................................................................................................................... 24Incident rates per million population, adjustedat day 1, by cause of renal failure, adjusted for age and gender
A3 INCIDENT PATIENTS ACCEPTED FOR RRT IN 2013, AT DAY 91
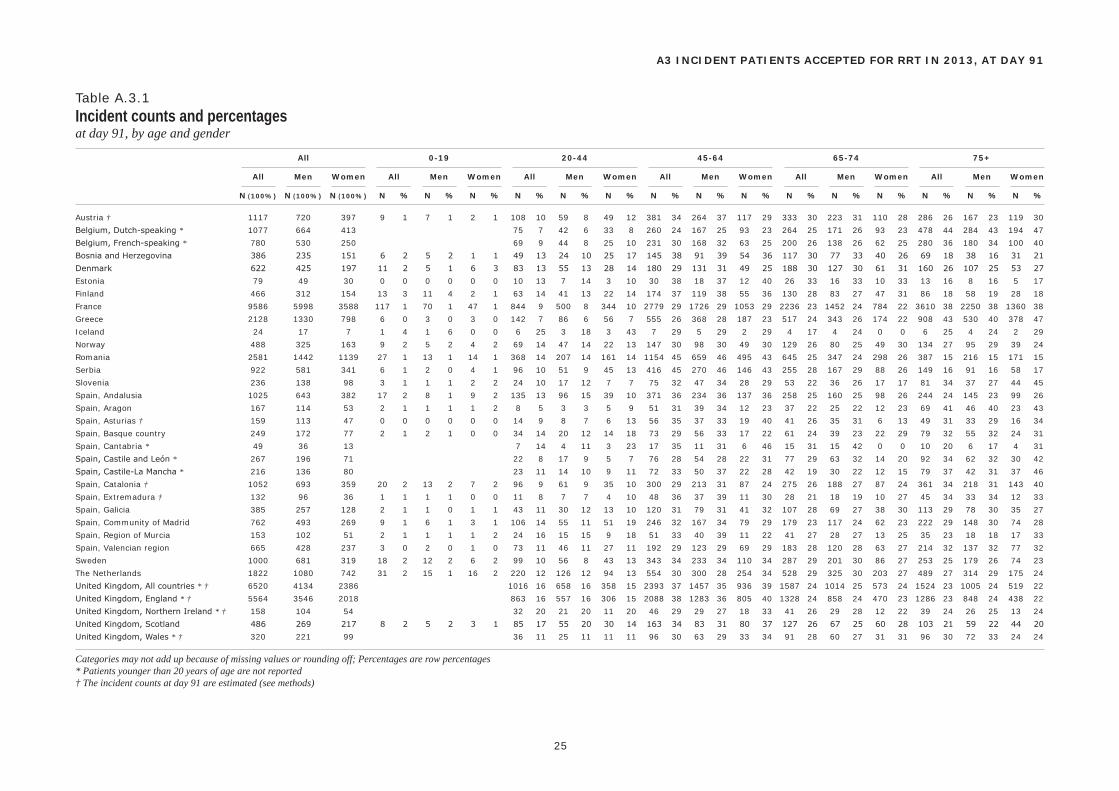
Table A.3.1 .......................................................................................................................................................... 25Incident counts and percentagesat day 91, by age and gender
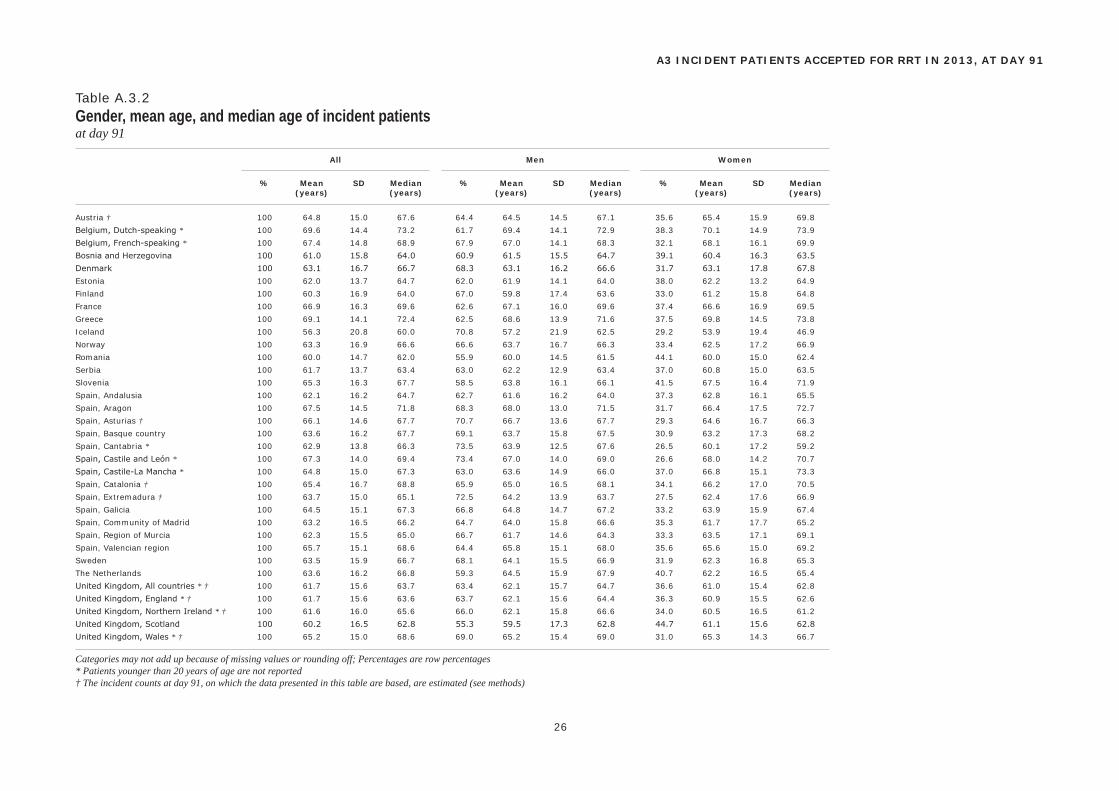
Table A.3.2 .......................................................................................................................................................... 26Gender, mean age, and median age of incident patientsat day 91
Table A.3.3 .......................................................................................................................................................... 27Incident rates per million (age-related) population, unadjustedat day 91, by age and gender
Table A.3.4 .......................................................................................................................................................... 28Incident rates per million population, unadjustedat day 91, by cause of renal failure
VI
Table A.3.5 .......................................................................................................................................................... 29Incident rates per million population, adjustedat day 91, by cause of renal failure, adjusted for age and gender
Table A.3.6 .......................................................................................................................................................... 30Incident countsat day 91, by established therapy
Table A.3.7 .......................................................................................................................................................... 31Incident rates per million population, unadjustedat day 91, by established therapy
Table A.3.8 .......................................................................................................................................................... 32Incident rates per million population, adjustedat day 91, by established therapy, adjusted for age and gender
Table A.3.9 .......................................................................................................................................................... 33Percentages of established therapy, unadjustedat day 91
Table A.3.10 ........................................................................................................................................................ 34Percentages of established therapy, unadjustedat day 91, by age, gender, and primary diagnosis
A4 PREVALENT PATIENTS ON RRT IN 2013
Table A.4.1 .......................................................................................................................................................... 35Prevalent counts and percentagesprevalent patients on December 31, by age and gender
Table A.4.2 .......................................................................................................................................................... 36Gender, mean age, and median ageprevalent patients on December 31
Table A.4.3 .......................................................................................................................................................... 37Prevalence per million (age-related) population, unadjustedprevalent patients on December 31, by age and gender
Table A.4.4 .......................................................................................................................................................... 38Prevalence per million population and percentages, unadjustedprevalent patients on December 31, by cause of renal failure
Table A.4.5 .......................................................................................................................................................... 39Prevalence per million population, adjustedprevalent patients on December 31, by cause of renal failure, adjusted for age and gender
Table A.4.6 .......................................................................................................................................................... 40Prevalent countsprevalent patients on December 31, by established therapy
Table A.4.7 .......................................................................................................................................................... 41Prevalence per million population, unadjustedprevalent patients on December 31, by established therapy
Table A.4.8 .......................................................................................................................................................... 42Prevalence per million population, adjustedprevalent patients on December 31, by established therapy, adjusted for age and gender
Table A.4.9 .......................................................................................................................................................... 43Percentages of established therapy, unadjustedprevalent patients on December 31
Table A.4.10 ........................................................................................................................................................ 44Percentages of established therapy, unadjustedprevalent patients on December 31, by age, gender, and primary diagnosis
A5 RENAL TRANSPLANTS IN 2013
Table A.5.1 .......................................................................................................................................................... 45Renal transplants performed in 2013, counts and percentagesby donor type
Table A.5.2 .......................................................................................................................................................... 46Renal transplants performed in 2013, per million populationby donor type
VII
A6 SURVIVAL PROBABILITY
Patient Survival on RRT
Table A.6.1 .......................................................................................................................................................... 4890-day, one-, two- and five-year survival probabilities (cohort 2004-2008): Incident RRT patients, unadjustedfrom day 1 to 90 days, one, two, and five years, by age, gender, and primary diagnosis
Table A.6.2 .......................................................................................................................................................... 4990-day, one-, two- and five-year survival probabilities (cohort 2004-2008): Incident RRT patients, adjustedfrom day 1 to 90 days, one, two, and five years, adjusted for age, gender, and primary diagnosis
Table A.6.3 .......................................................................................................................................................... 50One-, two- and five-year survival probabilities (cohort 2004-2008): Incident RRT patients, unadjustedfrom day 91 to one, two, and five years + 90 days, by age, gender, and primary diagnosis
Table A.6.4 .......................................................................................................................................................... 51One-, two- and five-year survival probabilities (cohort 2004-2008): Incident RRT patients, adjustedfrom day 91 to one, two, and five years + 90 days, adjusted for age, gender, and primary diagnosis
Table A.6.5 .......................................................................................................................................................... 5290-day, one- and two-year survival probabilities (cohort 2007-2011): Incident RRT patients, unadjustedfrom day 1 to 90 days, one, and two years, by age, gender, and primary diagnosis
Table A.6.6 .......................................................................................................................................................... 5390-day, one- and two-year survival probabilities (cohort 2007-2011): Incident RRT patients, adjustedfrom day 1 to 90 days, one, and two years, adjusted for age, gender, and primary diagnosis
Table A.6.7 .......................................................................................................................................................... 54One- and two-year survival probabilities (cohort 2007-2011): Incident RRT patients, unadjustedfrom day 91 to one and two years + 90 days, by age, gender, and primary diagnosis
Table A.6.8 .......................................................................................................................................................... 55One- and two-year survival probabilities (cohort 2007-2011): Incident RRT patients, adjustedfrom day 91 to one and two years + 90 days, adjusted for age, gender, and primary diagnosis
Patient Survival on Dialysis
Table A.6.9.a ....................................................................................................................................................... 5690-day, one-, two- and five-year survival probabilities (cohort 2004-2008): Incident dialysis patients, unadjustedfrom day 1 to 90 days, one, two, and five years, by age, gender, and primary diagnosis, with transplantation as censored observation
Table A.6.9.b (competing risks survival data) ..................................................................................................... 5790-day, one-, two- and five-year survival probabilities (cohort 2004-2008): Incident dialysis patients, unadjustedfrom day 1 to 90 days, one, two, and five years, by age, gender, and primary diagnosis, with transplantation as competing event
Table A.6.10.a ..................................................................................................................................................... 5890-day, one-, two- and five-year survival probabilities (cohort 2004-2008): Incident dialysis patients, adjustedfrom day 1 to 90 days, one, two, and five years, adjusted for age, gender, and primary diagnosis, with transplantation as censored observation
Table A.6.10.b (competing risks survival data) ................................................................................................... 5990-day, one-, two- and five-year survival probabilities (cohort 2004-2008): Incident dialysis patients, adjustedfrom day 1 to 90 days, one, two, and five years, adjusted for age, gender, and primary diagnosis, with transplantation as competing event
Table A.6.11.a ..................................................................................................................................................... 60One-, two- and five-year survival probabilities (cohort 2004-2008): Incident dialysis patients, unadjustedfrom day 91 to one, two, and five years + 90 days, by age, gender, and primary diagnosis, with transplantation as censo-red observation
Table A.6.11.b (competing risks survival data) ................................................................................................... 61One-, two- and five-year survival probabilities (cohort 2004-2008): Incident dialysis patients, unadjustedfrom day 91 to one, two, and five years + 90 days, by age, gender, and primary diagnosis, with transplantation as compe-ting event
Table A.6.12.a ..................................................................................................................................................... 62One-, two- and five-year survival probabilities (cohort 2004-2008): Incident dialysis patients, adjustedfrom day 91 to one, two, and five years + 90 days, adjusted for age, gender, and primary diagnosis, with transplantation as censored observation
Table A.6.12.b (competing risks survival data) ................................................................................................... 63One-, two- and five-year survival probabilities (cohort 2004-2008): Incident dialysis patients, adjustedfrom day 91 to one, two, and five years + 90 days, adjusted for age, gender, and primary diagnosis, with transplantation as competing event
Table A.6.13.a ..................................................................................................................................................... 6490-day, one- and two-year survival probabilities (cohort 2007-2011): Incident dialysis patients, unadjustedfrom day 1 to 90 days, one, and two years, by age, gender, and primary diagnosis, with transplantation as censored ob-servation
Table A.6.13.b (competing risks survival data) ................................................................................................... 6590-day, one- and two-year survival probabilities (cohort 2007-2011): Incident dialysis patients, unadjustedfrom day 1 to 90 days, one, and two years, by age, gender, and primary diagnosis, with transplantation as competing event
Table A.6.14.a ..................................................................................................................................................... 6690-day, one- and two-year survival probabilities (cohort 2007-2011): Incident dialysis patients, adjustedfrom day 1 to 90 days, one, and two years, adjusted for age, gender, and primary diagnosis, with transplantation as cen-sored observation
VIII
Table A.6.14.b (competing risks survival data) ................................................................................................... 6790-day, one- and two-year survival probabilities (cohort 2007-2011): Incident dialysis patients, adjustedfrom day 1 to 90 days, one, and two years, adjusted for age, gender, and primary diagnosis, with transplantation as com-peting event
Table A.6.15.a ..................................................................................................................................................... 68One- and two-year survival probabilities (cohort 2007-2011): Incident dialysis patients, unadjustedfrom day 91 to one and two years + 90 days, by age, gender, and primary diagnosis, with transplantation as censored observation
Table A.6.15.b (competing risks survival data) ................................................................................................... 69One- and two-year survival probabilities (cohort 2007-2011): Incident dialysis patients, unadjustedfrom day 91 to one and two years + 90 days, by age, gender, and primary diagnosis, with transplantation as competing event
Table A.6.16.a ..................................................................................................................................................... 70One- and two-year survival probabilities (cohort 2007-2011): Incident dialysis patients, adjustedfrom day 91 to one and two years + 90 days, adjusted for age, gender, and primary diagnosis, with transplantation as censored observation
Table A.6.16.b (competing risks survival data) ................................................................................................... 71One- and two-year survival probabilities (cohort 2007-2011): Incident dialysis patients, adjustedfrom day 91 to one and two years + 90 days, adjusted for age, gender, and primary diagnosis, with transplantation as competing event
Patient Survival after First Transplant (deceased donor)
Table A.6.17 ........................................................................................................................................................ 72One-, two- and five-year survival probabilities (cohort 2004-2008): First transplant patients (deceased donor), unad-justedfrom day of transplant to one, two, and five years, by age, gender, and primary diagnosis
Table A.6.18 ........................................................................................................................................................ 73One-, two- and five-year survival probabilities (cohort 2004-2008): First transplant patients (deceased donor), adjus-tedfrom day of transplant to one, two, and five years, adjusted for age, gender, and primary diagnosis
Table A.6.19 ........................................................................................................................................................ 74One- and two-year survival probabilities (cohort 2007-2011): First transplant patients (deceased donor), unadjustedfrom day of transplant to one and two years, by age, gender, and primary diagnosis
Table A.6.20 ........................................................................................................................................................ 75One- and two-year survival probabilities (cohort 2007-2011): First transplant patients (deceased donor), adjustedfrom day of transplant to one and two years, adjusted for age, gender, and primary diagnosis
Patient Survival after First Transplant (living donor)
Table A.6.21 ........................................................................................................................................................ 76One-, two- and five-year survival probabilities (cohort 2004-2008): First transplant patients (living donor), unadjustedfrom day of transplant to one, two, and five years, by age, gender, and primary diagnosis
Table A.6.22 ........................................................................................................................................................ 77One-, two- and five-year survival probabilities (cohort 2004-2008): First transplant patients (living donor), adjustedfrom day of transplant to one, two, and five years, adjusted for age, gender, and primary diagnosis
Table A.6.23 ........................................................................................................................................................ 78One- and two-year survival probabilities (cohort 2007-2011): First transplant patients (living donor), unadjustedfrom day of transplant to one and two years, by age, gender, and primary diagnosis
Table A.6.24 ........................................................................................................................................................ 79One- and two-year survival probabilities (cohort 2007-2011): First transplant patients (living donor), adjustedfrom day of transplant to one and two years, adjusted for age, gender, and primary diagnosis
Graft Survival after First Transplant (deceased donor)
Table A.6.25 ........................................................................................................................................................ 80One-, two- and five-year survival probabilities (cohort 2004-2008): First graft (deceased donor), unadjustedfrom day of transplant to one, two, and five years, by age, gender, and primary diagnosis
Table A.6.26 ........................................................................................................................................................ 81One-, two- and five-year survival probabilities (cohort 2004-2008): First graft (deceased donor), adjustedfrom day of transplant to one, two, and five years, adjusted for age, gender, and primary diagnosis
Table A.6.27 ........................................................................................................................................................ 82One- and two-year survival probabilities (cohort 2007-2011): First graft (deceased donor), unadjustedfrom day of transplant to one and two years, by age, gender, and primary diagnosis
Table A.6.28 ........................................................................................................................................................ 83One- and two-year survival probabilities (cohort 2007-2011): First graft (deceased donor), adjustedfrom day of transplant to one and two years, adjusted for age, gender, and primary diagnosis
Graft Survival after First Transplant (living donor)
Table A.6.29 ........................................................................................................................................................ 84One-, two- and five-year survival probabilities (cohort 2004-2008): First graft (living donor), unadjustedfrom day of transplant to one, two, and five years, by age, gender, and primary diagnosis
Table A.6.30 ........................................................................................................................................................ 85One-, two- and five-year survival probabilities (cohort 2004-2008): First graft (living donor), adjustedfrom day of transplant to one, two, and five years, adjusted for age, gender, and primary diagnosis
IX
Table A.6.31 ........................................................................................................................................................ 86One- and two-year survival probabilities (cohort 2007-2011): First graft (living donor), unadjustedfrom day of transplant to one and two years, by age, gender, and primary diagnosis
Table A.6.32 ........................................................................................................................................................ 87One- and two-year survival probabilities (cohort 2007-2011): First graft (living donor), adjustedfrom day of transplant to one and two years, adjusted for age, gender, and primary diagnosis
Patient Survival by Modality and Primary Diagnosis (transplantation as censored observation in dialysis survival)
Figure A.6.1 ........................................................................................................................................................ 88Adjusted survival (cohort 2004-2008): Incident dialysis patients and patients receiving a first transplant (between 2004 and 2008)from day 91, by modality, adjusted for age, gender, and primary diagnosis
Figure A.6.2 ........................................................................................................................................................ 88Adjusted survival (cohort 2004-2008): Incident haemodialysis patientsfrom day 91, by primary diagnosis, adjusted for age and gender
Figure A.6.3 ........................................................................................................................................................ 88Adjusted survival (cohort 2004-2008): Incident peritoneal dialysis patientsfrom day 91, by primary diagnosis, adjusted for age and gender
Patient Survival by Modality and Primary Diagnosis (transplantation as competing event in dialysis survival)
Figure A.6.4 ........................................................................................................................................................ 89Adjusted survival (cohort 2004-2008): Incident dialysis patients and patients receiving a first transplant (between 2004 and 2008)from day 91, by modality, adjusted for age, gender, and primary diagnosis
Figure A.6.5 ........................................................................................................................................................ 89Adjusted survival (cohort 2004-2008): Incident haemodialysis patientsfrom day 91, by primary diagnosis, adjusted for age and gender
Figure A.6.6 ........................................................................................................................................................ 89Adjusted survival (cohort 2004-2008): Incident peritoneal dialysis patientsfrom day 91, by primary diagnosis, adjusted for age and gender
A7 EXPECTED REMAINING LIFETIMES
Table A.7.1 .......................................................................................................................................................... 90Expected remaining lifetimes (years) of the general population in 2010, and of prevalent dialysis and transplant pa-tients in 2012 and 2013 (includes mortality in the first 90 days)by age and gender
III Reference Tables - Section B 91
B1 AFFILIATED REGISTRY INFORMATION FOR 2013
Table B.1.1 .......................................................................................................................................................... 92General population of the country/region and percent coverage of general population
Table B.1.2 .......................................................................................................................................................... 93Renal centres: total number of centres and number of collaborating centres
B2 INCIDENT PATIENTS ACCEPTED FOR RRT IN 2013, AT DAY 1
Table B.2.1 .......................................................................................................................................................... 94Incident counts and incident rates per million population, unadjustedat day 1
Table B.2.2 .......................................................................................................................................................... 95Gender, mean age, and median age of incident patientsat day 1
Table B.2.3 .......................................................................................................................................................... 96Incident rates per million population, adjustedat day 1, adjusted for age and gender
Table B.2.4 .......................................................................................................................................................... 97Incident rates per million population and percentages, unadjustedat day 1, by cause of renal failure
X
B3 INCIDENT PATIENTS ACCEPTED FOR RRT IN 2013, AT DAY 91
Table B.3.1 .......................................................................................................................................................... 98Incident counts and incident rates per million population, unadjustedat day 91
Table B.3.2 .......................................................................................................................................................... 99Gender, mean age, and median age of incident patientsat day 91
Table B.3.3 ........................................................................................................................................................ 100Incident rates per million population, adjustedat day 91, adjusted for age and gender
Table B.3.4 ........................................................................................................................................................ 101Incident rates per million population and percentages, unadjustedat day 91, by cause of renal failure
Table B.3.5 ........................................................................................................................................................ 102Incident countsat day 91, by established therapy
Table B.3.6 ........................................................................................................................................................ 103Incident rates per million population, unadjustedat day 91, by established therapy
Table B.3.7 ........................................................................................................................................................ 104Percentages of established therapy, unadjustedat day 91
B4 PREVALENT PATIENTS ON RRT IN 2013
Table B.4.1 ........................................................................................................................................................ 105Prevalent counts and prevalence per million population, unadjustedprevalent patients on December 31
Table B.4.2 ........................................................................................................................................................ 106Gender, mean age, and median ageprevalent patients on December 31
Table B.4.3 ........................................................................................................................................................ 107Prevalence per million population, adjustedprevalent patients on December 31, adjusted for age and gender
Table B.4.4 ........................................................................................................................................................ 108Prevalence per million population and percentages, unadjustedprevalent patients on December 31, by cause of renal failure
Table B.4.5 ........................................................................................................................................................ 109Prevalent countsprevalent patients on December 31, by established therapy
Table B.4.6 ........................................................................................................................................................ 110Prevalence per million population, unadjustedprevalent patients on December 31, by established therapy
Table B.4.7 ........................................................................................................................................................ 111Percentages of established therapy, unadjustedprevalent patients on December 31
B5 RENAL TRANSPLANTS IN 2013
Table B.5.1 ........................................................................................................................................................ 112Renal transplants performed in 2013, counts and percentagesby donor type
Table B.5.2 ........................................................................................................................................................ 113Renal transplants performed in 2013, per million populationby donor type
IV Summary Data 115Table S.1.1 ........................................................................................................................................................ 117
Section A - Summary data from registries providing individual patient data
Table S.1.2 ........................................................................................................................................................ 118Section B - Summary data from registries providing aggregated data
XI
V Reference Tables - Section Paediatric RRT 119
P1 GENERAL CHARACTERISTICS
Table P.1.1 ........................................................................................................................................................ 121Population covered (in thousands)by age and year
Table P.1.2 ........................................................................................................................................................ 121Grouping of primary renal diseases for paediatric patientsgroups and codes included
P2 INCIDENT PATIENTS ACCEPTED FOR RRT, AT DAY 1
Table P.2.1 ........................................................................................................................................................ 122Incident countsat day 1, by age and cohort
Table P.2.2 ........................................................................................................................................................ 122Incident countsat day 1, by age, treatment modality, and cohort
Table P.2.3 ........................................................................................................................................................ 122Incident countsbetween 2004 and 2013, at day 1, by age and cause of renal failure
Table P.2.4 ........................................................................................................................................................ 123Incident rates per million age-related population (per year)at day 1, by age and cohort
Table P.2.5 ........................................................................................................................................................ 123Incident rates per million age-related population (per year)at day 1, by age, treatment modality, and cohort
Table P.2.6 ........................................................................................................................................................ 123Incident rates per million age-related populationbetween 2004 and 2013, at day 1, by age and cause of renal failure
P3 PREVALENT PATIENTS ON RRT
Table P.3.1 ........................................................................................................................................................ 124Prevalent countsprevalent patients on December 31, by age and year
Table P.3.2 ........................................................................................................................................................ 124Prevalent countsprevalent patients on December 31, by age and year
Table P.3.3 ........................................................................................................................................................ 124Prevalent countsprevalent patients on December 31, 2013, by age and cause of renal failure
Table P.3.4 ........................................................................................................................................................ 125Prevalence per million age-related population (per year)prevalent patients on December 31, by age and year
Table P.3.5 ........................................................................................................................................................ 125Prevalence per million age-related population (per year)prevalent patients on December 31, by age and year
Table P.3.6 ........................................................................................................................................................ 125Prevalence per million age-related populationprevalent patients on December 31, 2013, by age and cause of renal failure
VI Methods 127Data collection and preparation ........................................................................................................................ 129
Definitions and coding systems ......................................................................................................................... 132
Statistical analyses ........................................................................................................................................... 133
Bibliography...................................................................................................................................................... 137
VII Appendices 139Appendix 1 - Grouping of primary renal diseases ............................................................................................ 140
Appendix 2 - Grouping of primary renal disease codes 2012 ........................................................................... 141
Appendix 3 - Grouping of causes of death ....................................................................................................... 146
Appendix 4 - Treatment modalities ................................................................................................................. 147
Appendix 5 - Renal registries contributing data for the different types of analyses ........................................ 148


I Introduction
14
AL Albania IS Iceland
AT Austria LT Lithuania
BA Bosnia and Herzegovina LV Latvia
BE Belgium ME Montenegro
BG Bulgaria NL The Netherlands
CH Switzerland NO Norway
CY Cyprus PL Poland
CZ Czech Republic PT Portugal
DK Denmark RO Romania
EE Estonia RS Serbia
ES Spain RU Russia
FI Finland SE Sweden
FR France SI Slovenia
GE Georgia SK Slovakia
GR Greece TR Turkey
HR Croatia UA Ukraine
IL Israel UK United Kingdom
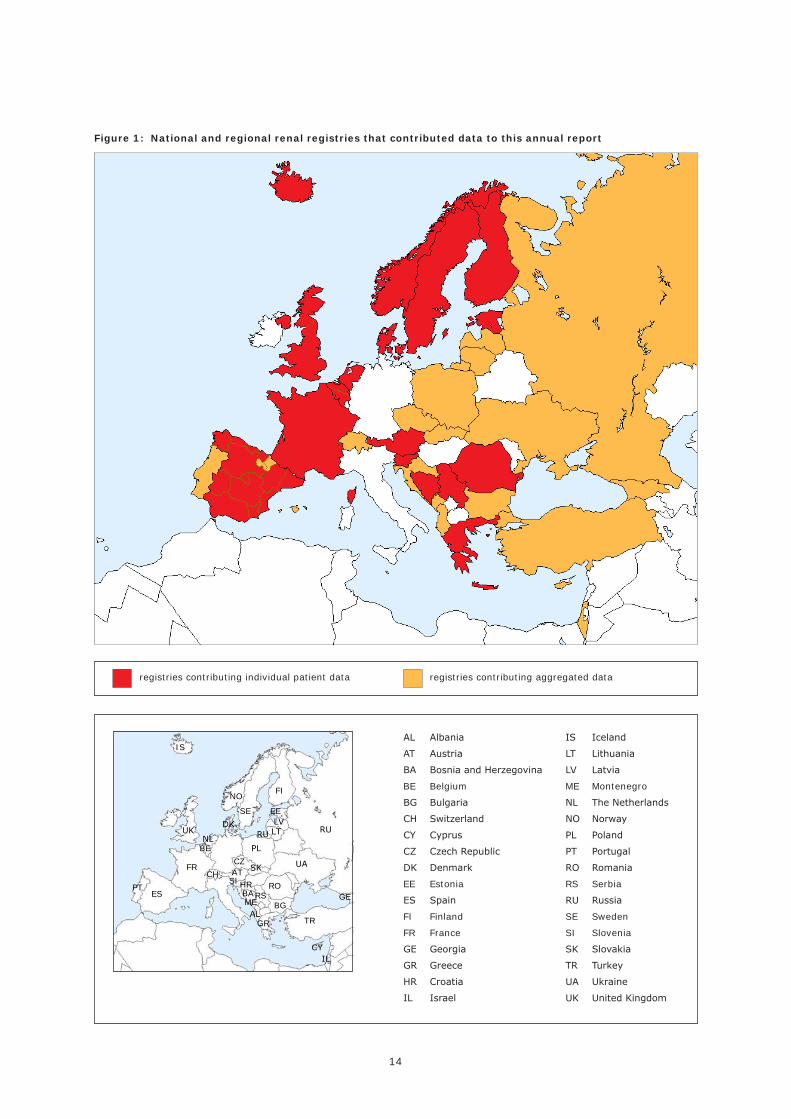
Figure 1: National and regional renal registries that contributed data to this annual report
registries contributing individual patient data registries contributing aggregated data
ES
AT
BA
BE
CZ
DK
EE
FI
FR
GR
UA
IL
IS
GE
LV
NL
NO
PL
RO
RURU
SE
SK
TR
UK
MERS
PT HRSI
AL
LT
CH
BG
CY
15
I Introduction
The ERA-EDTA Registry collects data on renal replacement therapy (RRT) via the national and regional renal registries in Europe. For this Annual Report 2013 it used 49 data sets from national or regional renal registries in 34 countries. The reference tables are presented in two parts: Section A (chapter II) and Section B (chapter III). Section A relates to individual patient data from 31 national and regional registries from 17 countries (shown in red in Figure 1), whereas section B relates to 18 national registries from 18 countries providing aggregated data based on individual patient data, centre questionnaire data or information from health authorities (shown in orange in Figure 1).
Chapter overview
Chapter II (Section A) contains data on the incidence and prevalence of RRT and data on survival and expected remaining lifetimes from those registries providing individual patient data. Chapter III (Section B) contains data on the incidence and prevalence from the countries providing aggregated data. Chapter IV describes summary data from all participating registries. The incidence and prevalence of RRT in paediatric patients are described in chapter V, based on data from registries providing individual paediatric data. Chapter VI describes the methods used, including data collection and preparation, definitions, and coding systems. In addition, it describes the statistical methods to calculate incidence and prevalence, patient and graft survival, and expected remaining lifetimes.
New to this edition
This year, Estonia provided individual patient data for the A-section of this annual report for the first time, while Cyprus, Lithuania and Switzerland provided aggregated data for the B-section of the re-port for the first time.
In addition, for the first time also competing risks analyses are used for the calculation of survival probabilities for patients treated with dialysis (with transplantation as competing event). This new method is described in detail in Chapter VI.
ERA-EDTA Registry website
PDF files of the ERA-EDTA annual reports and other information on the Registry can be downloaded from the website of the ERA-EDTA Registry: www.era-edta-reg.org. This website also includes a repository of educational publications and the 2012 version of the ERA-EDTA Coding System for PRD.
ESPN/ERA-EDTA Registry website
Information on the activities of the European Society for Paediatric Nephrology (ESPN)/ERA-EDTA Registry and on paediatric registries in general is provided at the ESPN/ERA-EDTA Registry website: www.espn-reg.org. In addition, PDF files of the ESPN/ERA-EDTA Registry annual reports can be downloaded from this website.


II Reference Tables - Section A
General population % Coverage of general of whole country/region population by the registry in thousands for individual patient data
18
A1 AFFILIATED REGISTRY INFORMATION FOR 2013
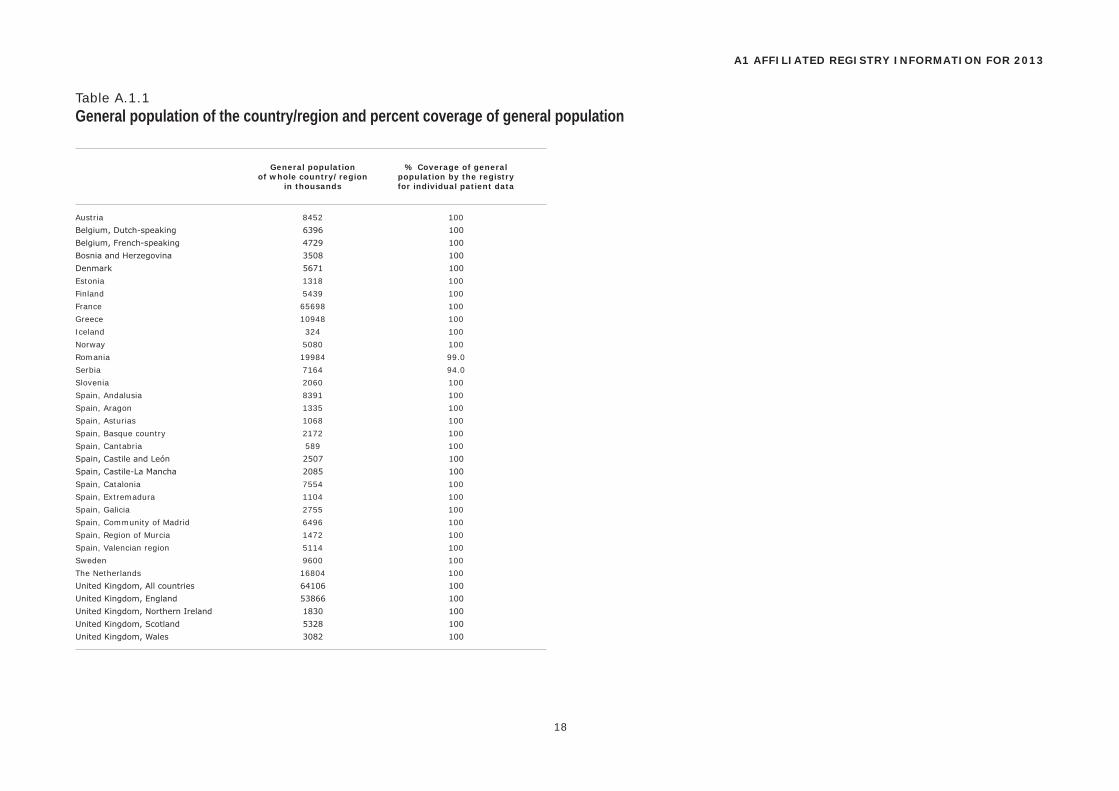
Table A.1.1General population of the country/region and percent coverage of general population
Austria 8452 100
Belgium, Dutch-speaking 6396 100
Belgium, French-speaking 4729 100
Bosnia and Herzegovina 3508 100
Denmark 5671 100
Estonia 1318 100
Finland 5439 100
France 65698 100
Greece 10948 100
Iceland 324 100
Norway 5080 100
Romania 19984 99.0
Serbia 7164 94.0
Slovenia 2060 100
Spain, Andalusia 8391 100
Spain, Aragon 1335 100
Spain, Asturias 1068 100
Spain, Basque country 2172 100
Spain, Cantabria 589 100
Spain, Castile and León 2507 100
Spain, Castile-La Mancha 2085 100
Spain, Catalonia 7554 100
Spain, Extremadura 1104 100
Spain, Galicia 2755 100
Spain, Community of Madrid 6496 100
Spain, Region of Murcia 1472 100
Spain, Valencian region 5114 100
Sweden 9600 100
The Netherlands 16804 100
United Kingdom, All countries 64106 100
United Kingdom, England 53866 100
United Kingdom, Northern Ireland 1830 100
United Kingdom, Scotland 5328 100
United Kingdom, Wales 3082 100
Total number of Number of renal centres renal centres collaborating with the registry of whole country/region for individual patient data
19
A1 AFFILIATED REGISTRY INFORMATION FOR 2013
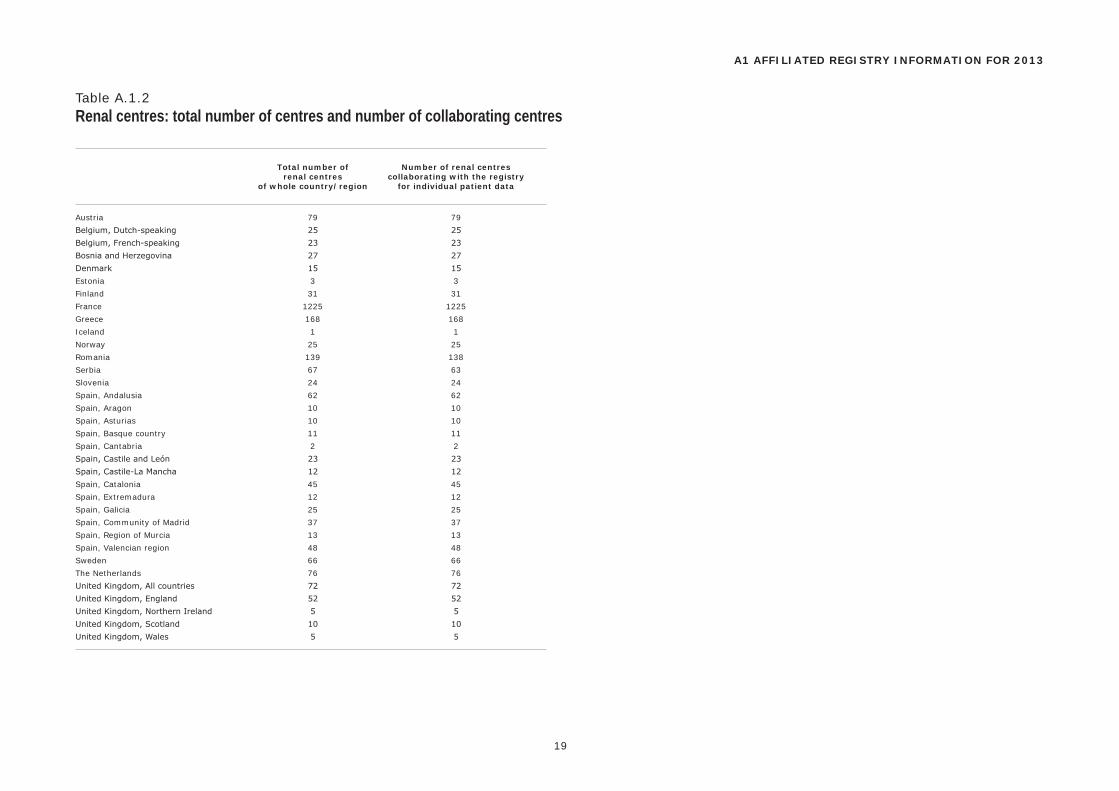
Table A.1.2Renal centres: total number of centres and number of collaborating centres
Austria 79 79
Belgium, Dutch-speaking 25 25
Belgium, French-speaking 23 23
Bosnia and Herzegovina 27 27
Denmark 15 15
Estonia 3 3
Finland 31 31
France 1225 1225
Greece 168 168
Iceland 1 1
Norway 25 25
Romania 139 138
Serbia 67 63
Slovenia 24 24
Spain, Andalusia 62 62
Spain, Aragon 10 10
Spain, Asturias 10 10
Spain, Basque country 11 11
Spain, Cantabria 2 2
Spain, Castile and León 23 23
Spain, Castile-La Mancha 12 12
Spain, Catalonia 45 45
Spain, Extremadura 12 12
Spain, Galicia 25 25
Spain, Community of Madrid 37 37
Spain, Region of Murcia 13 13
Spain, Valencian region 48 48
Sweden 66 66
The Netherlands 76 76
United Kingdom, All countries 72 72
United Kingdom, England 52 52
United Kingdom, Northern Ireland 5 5
United Kingdom, Scotland 10 10
United Kingdom, Wales 5 5
All 0-19 20-44 45-64 65-74 75+
All Men Women All Men Women All Men Women All Men Women All Men Women All Men Women
N (100%) N (100%) N (100%) N % N % N % N % N % N % N % N % N % N % N % N % N % N % N %
20
A2 INCIDENT PATIENTS ACCEPTED FOR RRT IN 2013, AT DAY 1
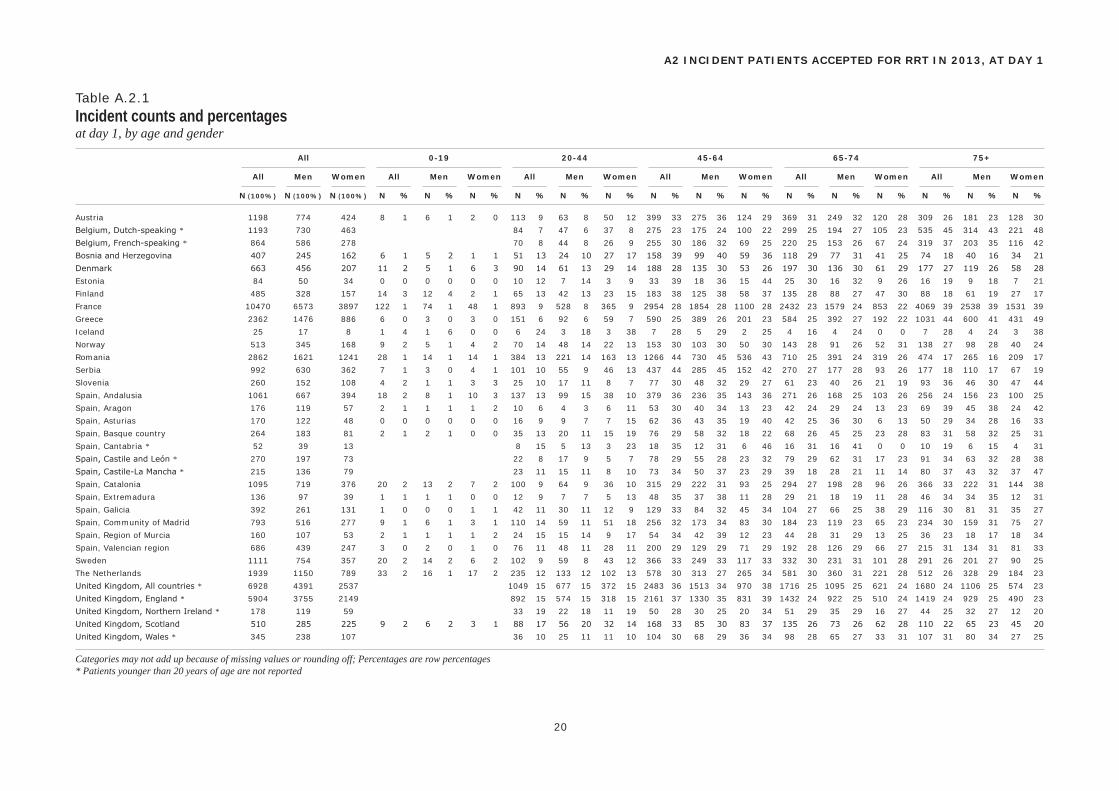
Table A.2.1Incident counts and percentagesat day 1, by age and gender
Austria 1198 774 424 8 1 6 1 2 0 113 9 63 8 50 12 399 33 275 36 124 29 369 31 249 32 120 28 309 26 181 23 128 30
Belgium, Dutch-speaking * 1193 730 463 84 7 47 6 37 8 275 23 175 24 100 22 299 25 194 27 105 23 535 45 314 43 221 48
Belgium, French-speaking * 864 586 278 70 8 44 8 26 9 255 30 186 32 69 25 220 25 153 26 67 24 319 37 203 35 116 42
Bosnia and Herzegovina 407 245 162 6 1 5 2 1 1 51 13 24 10 27 17 158 39 99 40 59 36 118 29 77 31 41 25 74 18 40 16 34 21
Denmark 663 456 207 11 2 5 1 6 3 90 14 61 13 29 14 188 28 135 30 53 26 197 30 136 30 61 29 177 27 119 26 58 28
Estonia 84 50 34 0 0 0 0 0 0 10 12 7 14 3 9 33 39 18 36 15 44 25 30 16 32 9 26 16 19 9 18 7 21
Finland 485 328 157 14 3 12 4 2 1 65 13 42 13 23 15 183 38 125 38 58 37 135 28 88 27 47 30 88 18 61 19 27 17
France 10470 6573 3897 122 1 74 1 48 1 893 9 528 8 365 9 2954 28 1854 28 1100 28 2432 23 1579 24 853 22 4069 39 2538 39 1531 39
Greece 2362 1476 886 6 0 3 0 3 0 151 6 92 6 59 7 590 25 389 26 201 23 584 25 392 27 192 22 1031 44 600 41 431 49
Iceland 25 17 8 1 4 1 6 0 0 6 24 3 18 3 38 7 28 5 29 2 25 4 16 4 24 0 0 7 28 4 24 3 38
Norway 513 345 168 9 2 5 1 4 2 70 14 48 14 22 13 153 30 103 30 50 30 143 28 91 26 52 31 138 27 98 28 40 24
Romania 2862 1621 1241 28 1 14 1 14 1 384 13 221 14 163 13 1266 44 730 45 536 43 710 25 391 24 319 26 474 17 265 16 209 17
Serbia 992 630 362 7 1 3 0 4 1 101 10 55 9 46 13 437 44 285 45 152 42 270 27 177 28 93 26 177 18 110 17 67 19
Slovenia 260 152 108 4 2 1 1 3 3 25 10 17 11 8 7 77 30 48 32 29 27 61 23 40 26 21 19 93 36 46 30 47 44
Spain, Andalusia 1061 667 394 18 2 8 1 10 3 137 13 99 15 38 10 379 36 236 35 143 36 271 26 168 25 103 26 256 24 156 23 100 25
Spain, Aragon 176 119 57 2 1 1 1 1 2 10 6 4 3 6 11 53 30 40 34 13 23 42 24 29 24 13 23 69 39 45 38 24 42
Spain, Asturias 170 122 48 0 0 0 0 0 0 16 9 9 7 7 15 62 36 43 35 19 40 42 25 36 30 6 13 50 29 34 28 16 33
Spain, Basque country 264 183 81 2 1 2 1 0 0 35 13 20 11 15 19 76 29 58 32 18 22 68 26 45 25 23 28 83 31 58 32 25 31
Spain, Cantabria * 52 39 13 8 15 5 13 3 23 18 35 12 31 6 46 16 31 16 41 0 0 10 19 6 15 4 31
Spain, Castile and León * 270 197 73 22 8 17 9 5 7 78 29 55 28 23 32 79 29 62 31 17 23 91 34 63 32 28 38
Spain, Castile-La Mancha * 215 136 79 23 11 15 11 8 10 73 34 50 37 23 29 39 18 28 21 11 14 80 37 43 32 37 47
Spain, Catalonia 1095 719 376 20 2 13 2 7 2 100 9 64 9 36 10 315 29 222 31 93 25 294 27 198 28 96 26 366 33 222 31 144 38
Spain, Extremadura 136 97 39 1 1 1 1 0 0 12 9 7 7 5 13 48 35 37 38 11 28 29 21 18 19 11 28 46 34 34 35 12 31
Spain, Galicia 392 261 131 1 0 0 0 1 1 42 11 30 11 12 9 129 33 84 32 45 34 104 27 66 25 38 29 116 30 81 31 35 27
Spain, Community of Madrid 793 516 277 9 1 6 1 3 1 110 14 59 11 51 18 256 32 173 34 83 30 184 23 119 23 65 23 234 30 159 31 75 27
Spain, Region of Murcia 160 107 53 2 1 1 1 1 2 24 15 15 14 9 17 54 34 42 39 12 23 44 28 31 29 13 25 36 23 18 17 18 34
Spain, Valencian region 686 439 247 3 0 2 0 1 0 76 11 48 11 28 11 200 29 129 29 71 29 192 28 126 29 66 27 215 31 134 31 81 33
Sweden 1111 754 357 20 2 14 2 6 2 102 9 59 8 43 12 366 33 249 33 117 33 332 30 231 31 101 28 291 26 201 27 90 25
The Netherlands 1939 1150 789 33 2 16 1 17 2 235 12 133 12 102 13 578 30 313 27 265 34 581 30 360 31 221 28 512 26 328 29 184 23
United Kingdom, All countries * 6928 4391 2537 1049 15 677 15 372 15 2483 36 1513 34 970 38 1716 25 1095 25 621 24 1680 24 1106 25 574 23
United Kingdom, England * 5904 3755 2149 892 15 574 15 318 15 2161 37 1330 35 831 39 1432 24 922 25 510 24 1419 24 929 25 490 23
United Kingdom, Northern Ireland * 178 119 59 33 19 22 18 11 19 50 28 30 25 20 34 51 29 35 29 16 27 44 25 32 27 12 20
United Kingdom, Scotland 510 285 225 9 2 6 2 3 1 88 17 56 20 32 14 168 33 85 30 83 37 135 26 73 26 62 28 110 22 65 23 45 20
United Kingdom, Wales * 345 238 107 36 10 25 11 11 10 104 30 68 29 36 34 98 28 65 27 33 31 107 31 80 34 27 25
Categories may not add up because of missing values or rounding off; Percentages are row percentages* Patients younger than 20 years of age are not reported
All Men Women
% Mean SD Median % Mean SD Median % Mean SD Median (years) (years) (years) (years) (years) (years)
21
A2 INCIDENT PATIENTS ACCEPTED FOR RRT IN 2013, AT DAY 1
Table A.2.2Gender, mean age, and median age of incident patientsat day 1
Austria 100 65.0 14.8 67.8 64.6 64.8 14.1 67.5 35.4 65.3 15.8 69.0
Belgium, Dutch-speaking * 100 69.8 14.4 73.3 61.2 69.5 14.0 72.8 38.8 70.2 15.0 74.2
Belgium, French-speaking * 100 67.7 14.6 69.1 67.8 67.3 13.9 68.5 32.2 68.6 15.9 70.0
Bosnia and Herzegovina 100 60.9 15.8 63.7 60.2 61.3 15.4 64.4 39.8 60.3 16.4 63.2
Denmark 100 63.3 16.6 67.3 68.8 63.5 16.1 67.1 31.2 63.1 17.7 67.9
Estonia 100 62.3 13.6 64.6 59.5 62.0 14.1 64.5 40.5 62.7 13.0 64.6
Finland 100 60.3 16.8 64.3 67.6 59.9 17.3 63.6 32.4 61.1 15.7 64.7
France 100 67.4 16.2 70.0 62.8 67.5 15.8 70.0 37.2 67.1 16.8 70.0
Greece 100 69.5 14.0 72.9 62.5 69.1 13.7 72.3 37.5 70.3 14.5 74.6
Iceland 100 57.0 21.0 62.3 68.0 57.0 21.9 62.3 32.0 57.1 20.4 55.3
Norway 100 63.3 16.7 66.6 67.3 63.7 16.5 66.4 32.7 62.6 17.1 67.0
Romania 100 60.6 14.7 62.4 56.6 60.5 14.5 62.0 43.4 60.7 14.9 62.8
Serbia 100 62.0 13.8 63.6 63.5 62.5 13.0 63.6 36.5 61.2 15.1 63.7
Slovenia 100 65.7 16.6 69.1 58.5 64.8 16.1 67.5 41.5 66.9 17.4 71.6
Spain, Andalusia 100 62.2 16.1 64.7 62.9 61.8 16.2 64.3 37.1 62.9 16.1 65.3
Spain, Aragon 100 67.2 14.6 71.6 67.6 67.6 13.1 71.6 32.4 66.3 17.4 72.4
Spain, Asturias 100 65.3 14.1 66.6 71.8 66.2 12.9 66.8 28.2 63.1 16.6 64.0
Spain, Basque country 100 63.8 16.1 67.9 69.3 64.0 15.6 67.4 30.7 63.3 17.3 68.0
Spain, Cantabria * 100 62.1 13.8 65.1 75.0 62.9 12.6 66.4 25.0 59.9 17.2 59.0
Spain, Castile and León * 100 67.1 14.0 69.2 73.0 66.8 14.0 68.8 27.0 67.8 14.0 70.2
Spain, Castile-La Mancha * 100 64.7 14.9 66.9 63.3 63.5 14.9 65.7 36.7 66.9 14.7 73.3
Spain, Catalonia 100 65.5 16.3 68.7 65.7 65.0 16.1 68.0 34.3 66.3 16.7 70.7
Spain, Extremadura 100 64.8 14.8 67.2 71.3 65.4 14.1 67.9 28.7 63.5 16.6 67.1
Spain, Galicia 100 64.8 14.7 67.2 66.6 65.1 14.4 67.1 33.4 64.2 15.4 67.2
Spain, Community of Madrid 100 63.3 16.4 66.2 65.1 64.1 15.8 66.6 34.9 61.7 17.6 65.4
Spain, Region of Murcia 100 62.3 15.3 65.1 66.9 61.7 14.5 64.1 33.1 63.7 17.0 68.8
Spain, Valencian region 100 65.6 14.9 68.4 64.0 65.6 15.0 67.5 36.0 65.5 15.0 69.2
Sweden 100 64.0 15.8 67.2 67.9 64.4 15.4 67.3 32.1 63.3 16.6 67.0
The Netherlands 100 63.6 16.1 66.9 59.3 64.6 15.7 68.1 40.7 62.3 16.5 65.4
United Kingdom, All countries * 100 62.2 15.6 64.6 63.4 62.4 15.7 65.1 36.6 61.6 15.5 63.6
United Kingdom, England * 100 62.0 15.7 64.3 63.6 62.3 15.7 64.7 36.4 61.5 15.6 63.4
United Kingdom, Northern Ireland * 100 62.6 15.5 66.7 66.9 63.4 15.5 67.5 33.1 61.1 15.5 64.7
United Kingdom, Scotland 100 60.4 16.9 63.7 55.9 60.0 17.7 64.5 44.1 60.8 15.8 63.1
United Kingdom, Wales * 100 65.8 14.6 69.3 69.0 66.0 14.9 69.3 31.0 65.3 13.9 67.8
Categories may not add up because of missing values or rounding off; Percentages are row percentages* Patients younger than 20 years of age are not reported
All 0-19 20-44 45-64 65-74 75+
All Men Women All Men Women All Men Women All Men Women All Men Women All Men Women
Pmp Pmp Pmp Pmarp Pmarp Pmarp Pmarp Pmarp Pmarp Pmarp Pmarp Pmarp Pmarp Pmarp Pmarp Pmarp Pmarp Pmarp
22
A2 INCIDENT PATIENTS ACCEPTED FOR RRT IN 2013, AT DAY 1
Table A.2.3Incident rates per million (age-related) population, unadjustedat day 1, by age and gender
Austria 141.7 187.7 98.0 4.7 6.9 2.4 39.6 44.0 35.2 168.1 233.7 103.6 437.0 635.3 265.2 452.5 716.9 297.4
Belgium, Dutch-speaking * 186.5 231.1 143.0 41.6 46.2 37.0 154.7 195.0 113.5 492.8 663.9 333.9 884.4 1298.9 608.5
Belgium, French-speaking * 182.7 254.5 114.6 43.5 54.6 32.4 208.2 307.6 111.3 574.9 869.7 324.0 834.8 1470.7 475.2
Bosnia and Herzegovina 116.0 142.5 90.6 6.9 11.4 2.3 40.8 38.0 43.6 177.3 227.1 129.7 331.7 489.1 206.8 549.8 718.0 431.1
Denmark 116.9 162.0 72.5 8.2 7.2 9.1 50.2 67.4 32.6 124.2 177.8 70.3 325.1 461.7 195.9 430.0 713.8 236.8
Estonia 63.7 81.2 48.4 0 0 0 21.8 29.8 13.4 94.7 111.6 80.2 199.7 332.7 116.7 139.5 280.4 84.7
Finland 89.2 122.7 56.8 11.6 19.4 3.4 38.6 48.6 28.0 121.5 166.7 76.7 233.3 323.3 153.3 191.9 359.9 93.4
France 159.4 206.6 115.0 7.6 9.0 6.1 43.2 51.5 35.1 171.6 221.2 124.5 424.2 587.5 280.1 684.4 1132.9 413.2
Greece 215.8 276.9 157.7 2.8 2.7 2.9 40.7 49.2 32.0 205.9 281.6 135.4 537.4 774.0 330.9 908.5 1262.1 653.5
Iceland 77.2 104.7 49.6 11.2 21.9 0 53.4 52.5 54.3 87.7 125.4 50.1 173.6 350.2 0 362.4 478.0 274.0
Norway 101.0 135.2 66.5 7.2 7.8 6.5 40.3 53.9 26.0 118.9 156.7 79.4 319.2 414.8 227.5 390.1 698.2 187.4
Romania 144.7 167.9 122.5 6.7 6.5 6.9 53.8 60.3 47.0 241.7 286.7 199.1 406.6 522.1 319.9 316.3 476.9 221.7
Serbia 147.3 192.1 104.8 5.3 4.4 6.2 45.3 48.6 41.8 221.6 298.4 149.5 405.6 595.8 252.3 331.4 524.8 206.5
Slovenia 126.2 149.0 103.8 10.1 4.9 15.6 35.3 46.0 23.6 128.8 158.7 98.2 324.3 463.9 206.1 553.6 797.5 426.0
Spain, Andalusia 126.4 160.6 93.0 9.9 8.5 11.3 44.4 63.1 25.1 175.6 220.1 131.7 397.6 524.9 284.9 400.2 620.7 257.5
Spain, Aragon 131.9 179.4 84.9 8.1 7.8 8.3 21.9 16.9 27.3 148.1 221.0 73.5 346.7 503.3 204.7 453.7 736.7 263.7
Spain, Asturias 159.2 238.3 86.4 0 0 0 46.0 51.1 40.7 194.0 276.1 115.9 387.2 723.0 102.3 364.2 665.4 185.6
Spain, Basque country 121.5 173.2 72.6 5.1 10.0 0 49.3 55.5 42.9 122.0 189.4 56.8 315.2 446.3 200.2 357.1 658.8 173.2
Spain, Cantabria * 88.3 135.4 43.2 39.7 48.9 30.3 106.8 143.4 70.7 303.4 646.2 0 159.4 252.3 102.6
Spain, Castile and León * 107.7 158.7 57.7 27.4 41.2 12.9 110.0 151.8 66.3 315.0 511.5 131.2 269.6 465.1 138.6
Spain, Castile-La Mancha * 103.1 129.5 76.4 30.4 38.1 22.0 139.4 185.7 90.5 240.3 362.8 129.3 379.5 489.5 300.9
Spain, Catalonia 145.0 193.0 98.2 13.1 16.5 9.5 36.0 44.9 26.5 162.7 231.8 95.0 469.0 675.0 287.8 536.5 846.2 343.0
Spain, Extremadura 123.2 177.0 70.2 4.6 9.0 0 31.4 35.8 26.9 163.9 246.9 76.9 304.9 401.9 218.6 387.4 723.4 167.3
Spain, Galicia 142.3 195.9 92.1 2.3 0 4.8 45.6 64.6 26.3 170.6 225.9 117.1 353.2 480.8 241.8 333.1 604.3 163.4
Spain, Community of Madrid 122.1 165.2 82.2 6.9 9.0 4.7 43.9 47.5 40.4 153.7 218.3 95.1 361.1 517.5 232.4 455.8 836.2 232.0
Spain, Region of Murcia 108.7 144.6 72.4 5.9 5.7 6.1 42.3 50.8 33.2 153.1 237.5 68.2 408.9 614.4 227.5 338.6 419.5 283.9
Spain, Valencian region 134.1 173.2 95.8 3.0 3.9 2.1 41.0 50.4 31.1 149.2 194.4 104.9 406.1 564.8 264.3 486.1 750.8 307.0
Sweden 115.7 157.4 74.2 9.2 12.5 5.7 32.5 36.9 28.0 150.8 203.4 97.2 320.7 453.5 192.0 357.1 603.5 186.8
The Netherlands 115.4 138.2 93.0 8.6 8.1 9.0 43.8 49.3 38.1 122.9 132.5 113.1 353.8 448.0 263.6 416.4 675.5 247.3
United Kingdom, All countries * 108.1 139.3 77.9 48.9 63.2 34.6 152.1 188.0 117.2 284.5 377.7 198.3 329.3 527.5 191.0
United Kingdom, England * 109.6 141.5 78.6 49.2 63.4 35.1 158.9 198.1 120.7 285.1 381.2 195.8 331.4 525.7 194.9
United Kingdom, Northern Ireland * 97.3 132.6 63.3 53.8 72.9 35.3 109.6 132.9 86.7 328.4 473.7 196.5 355.3 651.9 160.5
United Kingdom, Scotland 95.7 110.2 82.1 7.7 10.1 5.3 50.3 65.1 36.0 114.8 119.0 110.7 258.5 295.6 225.2 259.1 386.3 175.5
United Kingdom, Wales * 111.9 157.1 68.3 37.5 52.0 22.9 128.3 171.1 87.1 297.4 406.3 194.7 394.6 715.2 169.5
* Patients younger than 20 years of age are not reported
Total GN PN PKD DM HT RVD Misc Unkn Missing
Type I Type II Both
Pmp % Pmp % Pmp % Pmp % Pmp % Pmp % Pmp % Pmp % Pmp % Pmp % Pmp % Pmp %
23
A2 INCIDENT PATIENTS ACCEPTED FOR RRT IN 2013, AT DAY 1
Table A.2.4Incident rates per million population, unadjustedat day 1, by cause of renal failure
Austria 141.7 100 15.7 11.1 5.1 3.6 7.3 5.2 4.3 3.0 32.4 22.9 36.7 25.9 17.0 12.0 18.1 12.8 27.6 19.4 14.2 10.0 0 0
Belgium, Dutch-speaking * 186.5 100 16.1 8.6 8.1 4.4 9.7 5.2 4.8 2.6 31.7 17.0 36.6 19.6 22.5 12.1 9.5 5.1 69.6 37.3 14.4 7.7 0 0
Belgium, French-speaking * 182.7 100 18.0 9.8 7.6 4.2 8.5 4.6 1.7 0.9 35.7 19.6 37.4 20.5 45.3 24.8 5.1 2.8 48.6 26.6 12.3 6.7 0 0
Bosnia and Herzegovina 116.0 100 16.2 14.0 14.8 12.8 4.0 3.4 26.8 23.1 4.8 4.2 31.6 27.3 17.1 14.7 1.1 1.0 20.2 17.4 10.8 9.3 0 0
Denmark 116.9 100 10.2 8.7 4.4 3.8 6.7 5.7 9.0 7.7 17.8 15.2 26.8 22.9 15.2 13.0 1.1 0.9 25.9 22.2 26.6 22.8 0 0
Estonia 63.7 100 10.6 16.7 3.0 4.8 4.6 7.1 9.9 15.5 3.0 4.8 12.9 20.2 4.6 7.1 17.5 27.4 10.6 16.7 0 0 0 0
Finland 89.2 100 10.8 12.2 4.2 4.7 10.7 12.0 12.7 14.2 15.6 17.5 28.3 31.8 5.3 6.0 0.6 0.6 15.1 16.9 14.2 15.9 0 0
France 159.4 100 17.9 11.2 7.4 4.7 10.4 6.5 35.6 22.4 40.1 25.2 1.6 1.0 24.0 15.1 21.9 13.7 0.3 0.2
Greece 215.8 100 16.5 7.7 11.9 5.5 9.2 4.3 2.5 1.1 55.5 25.7 58.0 26.9 20.9 9.7 3.7 1.7 22.8 10.6 72.6 33.7 0 0
Iceland 77.2 100 18.5 24.0 3.1 4.0 6.2 8.0 3.1 4.0 9.3 12.0 12.4 16.0 15.4 20.0 6.2 8.0 9.3 12.0 6.2 8.0 0 0
Norway 101.0 100 16.1 16.0 5.3 5.3 5.7 5.7 5.5 5.5 13.6 13.5 19.1 18.9 30.1 29.8 1.8 1.8 20.1 19.9 2.8 2.7 0 0
Romania 144.7 100 19.7 13.6 8.4 5.8 4.6 3.2 21.9 15.2 10.1 7.0 0.8 0.6 27.3 18.9 51.9 35.9 0 0
Serbia 147.3 100 14.3 9.7 14.7 10.0 6.2 4.2 12.6 8.6 21.4 14.5 34.0 23.1 39.6 26.9 1.9 1.3 18.1 12.3 18.4 12.5 0 0
Slovenia 126.2 100 14.1 11.2 5.8 4.6 8.3 6.5 9.2 7.3 23.3 18.5 32.5 25.8 19.4 15.4 0.5 0.4 20.9 16.5 24.8 19.6 0 0
Spain, Andalusia 126.4 100 15.3 12.1 11.6 9.1 8.6 6.8 31.7 25.1 10.8 8.6 5.7 4.5 13.5 10.7 29.3 23.2 0 0
Spain, Aragon 131.9 100 17.2 13.1 1.5 1.1 9.0 6.8 5.2 4.0 36.7 27.8 42.0 31.8 24.0 18.2 3.0 2.3 17.2 13.1 18.0 13.6 0 0
Spain, Asturias 159.2 100 27.2 17.1 7.5 4.7 10.3 6.5 3.7 2.4 34.7 21.8 38.4 24.1 30.0 18.8 2.8 1.8 21.5 13.5 21.5 13.5 0 0
Spain, Basque country 121.5 100 12.9 10.6 7.8 6.4 10.6 8.7 4.1 3.4 16.6 13.6 20.7 17.0 23.5 19.3 4.6 3.8 21.6 17.8 19.8 16.3 0 0
Spain, Cantabria * 88.3 100 11.9 13.5 8.5 9.6 8.5 9.6 5.1 5.8 17.0 19.2 22.1 25.0 20.4 23.1 6.8 7.7 8.5 9.6 1.7 1.9 0 0
Spain, Castile and León * ‡ 107.7 100 14.8 13.7 3.6 3.3 6.4 5.9 3.2 3.0 29.9 27.8 33.1 30.7 22.3 20.7 0 0 17.6 16.3 10.0 9.3 0 0
Spain, Castile-La Mancha * 103.1 100 15.8 15.3 9.1 8.8 7.7 7.4 27.8 27.0 10.6 10.2 3.4 3.3 12.0 11.6 16.8 16.3 0 0
Spain, Catalonia 145.0 100 16.3 11.2 8.7 6.0 10.5 7.2 4.2 2.9 28.5 19.6 32.7 22.6 15.8 10.9 5.2 3.6 13.8 9.5 42.1 29.0 0 0
Spain, Extremadura 123.2 100 7.2 5.9 9.1 7.4 10.0 8.1 41.7 33.8 11.8 9.6 3.6 2.9 7.2 5.9 31.7 25.7 0.9 0.7
Spain, Galicia 142.3 100 13.8 9.7 8.3 5.9 14.5 10.2 4.7 3.3 29.8 20.9 34.5 24.2 12.7 8.9 5.8 4.1 18.5 13.0 34.1 24.0 0 0
Spain, Community of Madrid 122.1 100 18.5 15.1 4.9 4.0 7.4 6.1 4.9 4.0 29.3 24.0 34.2 28.0 14.9 12.2 2.8 2.3 18.9 15.5 20.5 16.8 0 0
Spain, Region of Murcia 108.7 100 27.9 25.6 6.1 5.6 8.2 7.5 25.1 23.1 10.9 10.0 6.1 5.6 10.2 9.4 14.3 13.1 0 0
Spain, Valencian region 134.1 100 11.3 8.5 10.0 7.4 8.4 6.3 26.8 20.0 20.3 15.2 6.6 5.0 15.8 11.8 34.8 25.9 0 0
Sweden ‡ 115.7 100 16.2 14.0 3.1 2.7 10.1 8.7 10.0 8.6 18.6 16.1 28.6 24.8 17.0 14.7 0.5 0.5 24.5 21.2 15.6 13.5 0 0
The Netherlands 115.4 100 7.9 6.8 3.5 3.0 4.9 4.3 3.2 2.7 15.8 13.7 19.0 16.5 14.2 12.3 13.0 11.3 17.6 15.3 10.6 9.2 24.8 21.5
United Kingdom, All countries * 108.1 100 14.0 13.0 6.6 6.1 7.3 6.8 24.5 22.7 7.2 6.7 3.6 3.3 19.3 17.9 15.4 14.2 10.0 9.3
United Kingdom, England * 109.6 100 13.8 12.6 6.3 5.8 7.2 6.6 24.4 22.3 7.9 7.2 3.1 2.8 19.8 18.1 15.3 14.0 11.7 10.7
United Kingdom, Northern Ireland * 97.3 100 10.4 10.7 13.1 13.5 9.8 10.1 20.2 20.8 5.5 5.6 7.1 7.3 15.3 15.7 14.2 14.6 1.6 1.7
United Kingdom, Scotland 95.7 100 16.7 17.5 8.6 9.0 7.3 7.6 22.7 23.7 2.8 2.9 5.8 6.1 18.4 19.2 13.3 13.9 0 0
United Kingdom, Wales * 111.9 100 16.5 14.8 5.2 4.6 7.8 7.0 31.8 28.4 3.6 3.2 6.8 6.1 16.5 14.8 21.7 19.4 1.9 1.7
Abbreviations used: GN: glomerulonephritis/sclerosis; PN: pyelonephritis; PKD: polycystic kidneys, adult type; DM: diabetes mellitus; HT: hypertension; RVD: renal vascular disease; Misc: miscellaneous; Unkn: unknownCategories may not add up because of rounding off or a limited number of cases (<10%) with diabetes mellitus type unknown; Percentages are row percentages; When cells are left empty, (complete) data are unavailable* Patients younger than 20 years of age are not reported‡ Mapping the 2012 Primary Renal Disease (PRD) codes to the old PRD codes results in a different distribution of PRD groups
Total GN PN PKD DM HT RVD Misc Unkn Missing
Type I Type II Both
Pmp Pmp Pmp Pmp Pmp Pmp Pmp Pmp Pmp Pmp Pmp Pmp
24
A2 INCIDENT PATIENTS ACCEPTED FOR RRT IN 2013, AT DAY 1
Table A.2.5Incident rates per million population, adjustedat day 1, by cause of renal failure, adjusted for age and gender
Austria 137.7 15.0 5.0 6.9 4.1 31.5 35.6 16.5 17.7 27.1 13.9 0
Belgium, Dutch-speaking * 171.8 15.3 7.3 9.3 4.7 29.3 34.0 20.4 8.2 64.1 13.2 0
Belgium, French-speaking * 192.7 18.8 8.0 8.8 1.8 38.8 40.6 47.9 5.3 50.7 12.6 0
Bosnia and Herzegovina 137.4 16.8 18.4 5.3 30.6 6.2 36.8 20.7 1.3 24.8 13.3 0
Denmark 116.2 10.4 4.4 6.8 8.9 17.1 26.0 15.0 1.1 25.7 26.8 0
Estonia 65.1 10.8 2.9 4.5 10.3 3.0 13.4 4.7 18.3 10.5 0 0
Finland 84.1 10.1 3.9 10.3 13.0 13.7 26.7 5.1 0.6 14.0 13.4 0
France 156.6 18.1 7.5 10.6 35.5 38.1 1.6 23.9 21.1 0.3
Greece 190.3 15.7 10.3 8.8 2.5 49.0 51.4 18.2 3.2 20.3 62.4 0
Iceland 89.7 19.5 4.3 6.6 3.3 9.8 13.1 21.6 7.8 9.6 7.2 0
Norway 108.2 17.0 5.5 5.9 5.6 14.7 20.3 33.0 2.1 21.5 2.9 0
Romania 144.8 19.6 8.5 4.6 21.6 10.1 0.8 27.4 52.2 0
Serbia 136.1 13.7 13.5 5.7 11.7 19.4 31.0 36.6 1.9 16.7 17.0 0
Slovenia 123.4 13.5 5.8 7.7 8.8 22.1 30.9 19.1 0.4 20.9 25.1 0
Spain, Andalusia 134.1 15.8 12.3 9.0 33.9 11.8 6.0 14.2 31.1 0
Spain, Aragon 120.1 16.5 1.4 8.7 4.9 33.9 38.8 20.2 2.4 16.5 15.4 0
Spain, Asturias 130.7 23.5 6.9 8.8 3.3 28.4 31.6 22.3 2.5 18.2 16.8 0
Spain, Basque country 109.5 12.1 7.2 9.4 3.8 14.6 18.4 20.3 3.8 20.4 17.8 0
Spain, Cantabria * 80.8 10.9 7.9 7.5 4.7 16.2 20.9 18.2 6.1 7.7 1.5 0
Spain, Castile and León * ‡ 88.0 12.4 3.0 5.7 3.0 24.5 27.6 15.9 0 15.1 8.3 0
Spain, Castile-La Mancha * 102.3 16.1 9.4 7.5 28.4 10.5 3.5 11.5 15.5 0
Spain, Catalonia 146.1 16.3 8.9 10.6 4.2 29.5 33.7 15.6 5.3 14.0 41.6 0
Spain, Extremadura 114.6 6.9 8.0 9.3 39.1 11.1 2.9 7.1 29.2 1.0
Spain, Galicia 121.1 12.3 7.7 13.1 4.6 24.4 29.1 10.5 4.4 16.1 27.9 0
Spain, Community of Madrid 131.1 19.4 5.2 7.5 4.7 32.9 37.6 16.0 3.1 20.1 22.2 0
Spain, Region of Murcia 123.5 31.1 6.7 8.1 28.9 12.7 7.2 11.4 17.5 0
Spain, Valencian region 131.0 11.2 9.7 8.2 26.6 19.7 6.4 15.7 33.6 0
Sweden ‡ 111.5 15.9 2.9 10.2 10.0 17.4 27.4 16.1 0.4 23.5 15.1 0
The Netherlands 116.0 7.9 3.5 4.8 3.2 15.7 18.9 14.6 13.4 17.5 10.8 24.6
United Kingdom, All countries * 110.5 14.4 6.7 7.6 25.2 7.4 3.6 19.7 15.6 10.3
United Kingdom, England * 112.6 14.2 6.4 7.5 25.3 8.1 3.1 20.3 15.5 12.1
United Kingdom, Northern Ireland * 107.6 11.3 14.2 10.9 21.7 6.4 8.2 16.8 16.0 2.0
United Kingdom, Scotland 95.0 16.7 8.7 7.2 22.5 2.9 5.7 18.0 13.4 0
United Kingdom, Wales * 106.3 16.5 4.7 8.3 29.9 3.5 6.2 15.5 19.9 1.8
Abbreviations used: GN: glomerulonephritis/sclerosis; PN: pyelonephritis; PKD: polycystic kidneys, adult type; DM: diabetes mellitus; HT: hypertension; RVD: renal vascular disease; Misc: miscellaneous; Unkn: unknownCategories may not add up because of rounding off or a limited number of cases (<10%) with diabetes mellitus type unknown; When cells are left empty, (complete) data are unavailable* Patients younger than 20 years of age are not reported‡ Mapping the 2012 Primary Renal Disease (PRD) codes to the old PRD codes results in a different distribution of PRD groups
All 0-19 20-44 45-64 65-74 75+
All Men Women All Men Women All Men Women All Men Women All Men Women All Men Women
N (100%) N (100%) N (100%) N % N % N % N % N % N % N % N % N % N % N % N % N % N % N %
25
A3 INCIDENT PATIENTS ACCEPTED FOR RRT IN 2013, AT DAY 91
Table A.3.1Incident counts and percentagesat day 91, by age and gender
Austria † 1117 720 397 9 1 7 1 2 1 108 10 59 8 49 12 381 34 264 37 117 29 333 30 223 31 110 28 286 26 167 23 119 30
Belgium, Dutch-speaking * 1077 664 413 75 7 42 6 33 8 260 24 167 25 93 23 264 25 171 26 93 23 478 44 284 43 194 47
Belgium, French-speaking * 780 530 250 69 9 44 8 25 10 231 30 168 32 63 25 200 26 138 26 62 25 280 36 180 34 100 40
Bosnia and Herzegovina 386 235 151 6 2 5 2 1 1 49 13 24 10 25 17 145 38 91 39 54 36 117 30 77 33 40 26 69 18 38 16 31 21
Denmark 622 425 197 11 2 5 1 6 3 83 13 55 13 28 14 180 29 131 31 49 25 188 30 127 30 61 31 160 26 107 25 53 27
Estonia 79 49 30 0 0 0 0 0 0 10 13 7 14 3 10 30 38 18 37 12 40 26 33 16 33 10 33 13 16 8 16 5 17
Finland 466 312 154 13 3 11 4 2 1 63 14 41 13 22 14 174 37 119 38 55 36 130 28 83 27 47 31 86 18 58 19 28 18
France 9586 5998 3588 117 1 70 1 47 1 844 9 500 8 344 10 2779 29 1726 29 1053 29 2236 23 1452 24 784 22 3610 38 2250 38 1360 38
Greece 2128 1330 798 6 0 3 0 3 0 142 7 86 6 56 7 555 26 368 28 187 23 517 24 343 26 174 22 908 43 530 40 378 47
Iceland 24 17 7 1 4 1 6 0 0 6 25 3 18 3 43 7 29 5 29 2 29 4 17 4 24 0 0 6 25 4 24 2 29
Norway 488 325 163 9 2 5 2 4 2 69 14 47 14 22 13 147 30 98 30 49 30 129 26 80 25 49 30 134 27 95 29 39 24
Romania 2581 1442 1139 27 1 13 1 14 1 368 14 207 14 161 14 1154 45 659 46 495 43 645 25 347 24 298 26 387 15 216 15 171 15
Serbia 922 581 341 6 1 2 0 4 1 96 10 51 9 45 13 416 45 270 46 146 43 255 28 167 29 88 26 149 16 91 16 58 17
Slovenia 236 138 98 3 1 1 1 2 2 24 10 17 12 7 7 75 32 47 34 28 29 53 22 36 26 17 17 81 34 37 27 44 45
Spain, Andalusia 1025 643 382 17 2 8 1 9 2 135 13 96 15 39 10 371 36 234 36 137 36 258 25 160 25 98 26 244 24 145 23 99 26
Spain, Aragon 167 114 53 2 1 1 1 1 2 8 5 3 3 5 9 51 31 39 34 12 23 37 22 25 22 12 23 69 41 46 40 23 43
Spain, Asturias † 159 113 47 0 0 0 0 0 0 14 9 8 7 6 13 56 35 37 33 19 40 41 26 35 31 6 13 49 31 33 29 16 34
Spain, Basque country 249 172 77 2 1 2 1 0 0 34 14 20 12 14 18 73 29 56 33 17 22 61 24 39 23 22 29 79 32 55 32 24 31
Spain, Cantabria * 49 36 13 7 14 4 11 3 23 17 35 11 31 6 46 15 31 15 42 0 0 10 20 6 17 4 31
Spain, Castile and León * 267 196 71 22 8 17 9 5 7 76 28 54 28 22 31 77 29 63 32 14 20 92 34 62 32 30 42
Spain, Castile-La Mancha * 216 136 80 23 11 14 10 9 11 72 33 50 37 22 28 42 19 30 22 12 15 79 37 42 31 37 46
Spain, Catalonia † 1052 693 359 20 2 13 2 7 2 96 9 61 9 35 10 300 29 213 31 87 24 275 26 188 27 87 24 361 34 218 31 143 40
Spain, Extremadura † 132 96 36 1 1 1 1 0 0 11 8 7 7 4 10 48 36 37 39 11 30 28 21 18 19 10 27 45 34 33 34 12 33
Spain, Galicia 385 257 128 2 1 1 0 1 1 43 11 30 12 13 10 120 31 79 31 41 32 107 28 69 27 38 30 113 29 78 30 35 27
Spain, Community of Madrid 762 493 269 9 1 6 1 3 1 106 14 55 11 51 19 246 32 167 34 79 29 179 23 117 24 62 23 222 29 148 30 74 28
Spain, Region of Murcia 153 102 51 2 1 1 1 1 2 24 16 15 15 9 18 51 33 40 39 11 22 41 27 28 27 13 25 35 23 18 18 17 33
Spain, Valencian region 665 428 237 3 0 2 0 1 0 73 11 46 11 27 11 192 29 123 29 69 29 183 28 120 28 63 27 214 32 137 32 77 32
Sweden 1000 681 319 18 2 12 2 6 2 99 10 56 8 43 13 343 34 233 34 110 34 287 29 201 30 86 27 253 25 179 26 74 23
The Netherlands 1822 1080 742 31 2 15 1 16 2 220 12 126 12 94 13 554 30 300 28 254 34 528 29 325 30 203 27 489 27 314 29 175 24
United Kingdom, All countries * † 6520 4134 2386 1016 16 658 16 358 15 2393 37 1457 35 936 39 1587 24 1014 25 573 24 1524 23 1005 24 519 22
United Kingdom, England * † 5564 3546 2018 863 16 557 16 306 15 2088 38 1283 36 805 40 1328 24 858 24 470 23 1286 23 848 24 438 22
United Kingdom, Northern Ireland * † 158 104 54 32 20 21 20 11 20 46 29 29 27 18 33 41 26 29 28 12 22 39 24 26 25 13 24
United Kingdom, Scotland 486 269 217 8 2 5 2 3 1 85 17 55 20 30 14 163 34 83 31 80 37 127 26 67 25 60 28 103 21 59 22 44 20
United Kingdom, Wales * † 320 221 99 36 11 25 11 11 11 96 30 63 29 33 34 91 28 60 27 31 31 96 30 72 33 24 24
Categories may not add up because of missing values or rounding off; Percentages are row percentages* Patients younger than 20 years of age are not reported† The incident counts at day 91 are estimated (see methods)
All Men Women
% Mean SD Median % Mean SD Median % Mean SD Median (years) (years) (years) (years) (years) (years)
26
A3 INCIDENT PATIENTS ACCEPTED FOR RRT IN 2013, AT DAY 91
Table A.3.2Gender, mean age, and median age of incident patientsat day 91
Austria † 100 64.8 15.0 67.6 64.4 64.5 14.5 67.1 35.6 65.4 15.9 69.8
Belgium, Dutch-speaking * 100 69.6 14.4 73.2 61.7 69.4 14.1 72.9 38.3 70.1 14.9 73.9
Belgium, French-speaking * 100 67.4 14.8 68.9 67.9 67.0 14.1 68.3 32.1 68.1 16.1 69.9
Bosnia and Herzegovina 100 61.0 15.8 64.0 60.9 61.5 15.5 64.7 39.1 60.4 16.3 63.5
Denmark 100 63.1 16.7 66.7 68.3 63.1 16.2 66.6 31.7 63.1 17.8 67.8
Estonia 100 62.0 13.7 64.7 62.0 61.9 14.1 64.0 38.0 62.2 13.2 64.9
Finland 100 60.3 16.9 64.0 67.0 59.8 17.4 63.6 33.0 61.2 15.8 64.8
France 100 66.9 16.3 69.6 62.6 67.1 16.0 69.6 37.4 66.6 16.9 69.5
Greece 100 69.1 14.1 72.4 62.5 68.6 13.9 71.6 37.5 69.8 14.5 73.8
Iceland 100 56.3 20.8 60.0 70.8 57.2 21.9 62.5 29.2 53.9 19.4 46.9
Norway 100 63.3 16.9 66.6 66.6 63.7 16.7 66.3 33.4 62.5 17.2 66.9
Romania 100 60.0 14.7 62.0 55.9 60.0 14.5 61.5 44.1 60.0 15.0 62.4
Serbia 100 61.7 13.7 63.4 63.0 62.2 12.9 63.4 37.0 60.8 15.0 63.5
Slovenia 100 65.3 16.3 67.7 58.5 63.8 16.1 66.1 41.5 67.5 16.4 71.9
Spain, Andalusia 100 62.1 16.2 64.7 62.7 61.6 16.2 64.0 37.3 62.8 16.1 65.5
Spain, Aragon 100 67.5 14.5 71.8 68.3 68.0 13.0 71.5 31.7 66.4 17.5 72.7
Spain, Asturias † 100 66.1 14.6 67.7 70.7 66.7 13.6 67.7 29.3 64.6 16.7 66.3
Spain, Basque country 100 63.6 16.2 67.7 69.1 63.7 15.8 67.5 30.9 63.2 17.3 68.2
Spain, Cantabria * 100 62.9 13.8 66.3 73.5 63.9 12.5 67.6 26.5 60.1 17.2 59.2
Spain, Castile and León * 100 67.3 14.0 69.4 73.4 67.0 14.0 69.0 26.6 68.0 14.2 70.7
Spain, Castile-La Mancha * 100 64.8 15.0 67.3 63.0 63.6 14.9 66.0 37.0 66.8 15.1 73.3
Spain, Catalonia † 100 65.4 16.7 68.8 65.9 65.0 16.5 68.1 34.1 66.2 17.0 70.5
Spain, Extremadura † 100 63.7 15.0 65.1 72.5 64.2 13.9 63.7 27.5 62.4 17.6 66.9
Spain, Galicia 100 64.5 15.1 67.3 66.8 64.8 14.7 67.2 33.2 63.9 15.9 67.4
Spain, Community of Madrid 100 63.2 16.5 66.2 64.7 64.0 15.8 66.6 35.3 61.7 17.7 65.2
Spain, Region of Murcia 100 62.3 15.5 65.0 66.7 61.7 14.6 64.3 33.3 63.5 17.1 69.1
Spain, Valencian region 100 65.7 15.1 68.6 64.4 65.8 15.1 68.0 35.6 65.6 15.0 69.2
Sweden 100 63.5 15.9 66.7 68.1 64.1 15.5 66.9 31.9 62.3 16.8 65.3
The Netherlands 100 63.6 16.2 66.8 59.3 64.5 15.9 67.9 40.7 62.2 16.5 65.4
United Kingdom, All countries * † 100 61.7 15.6 63.7 63.4 62.1 15.7 64.7 36.6 61.0 15.4 62.8
United Kingdom, England * † 100 61.7 15.6 63.6 63.7 62.1 15.6 64.4 36.3 60.9 15.5 62.6
United Kingdom, Northern Ireland * † 100 61.6 16.0 65.6 66.0 62.1 15.8 66.6 34.0 60.5 16.5 61.2
United Kingdom, Scotland 100 60.2 16.5 62.8 55.3 59.5 17.3 62.8 44.7 61.1 15.6 62.8
United Kingdom, Wales * † 100 65.2 15.0 68.6 69.0 65.2 15.4 69.0 31.0 65.3 14.3 66.7
Categories may not add up because of missing values or rounding off; Percentages are row percentages* Patients younger than 20 years of age are not reported† The incident counts at day 91, on which the data presented in this table are based, are estimated (see methods)
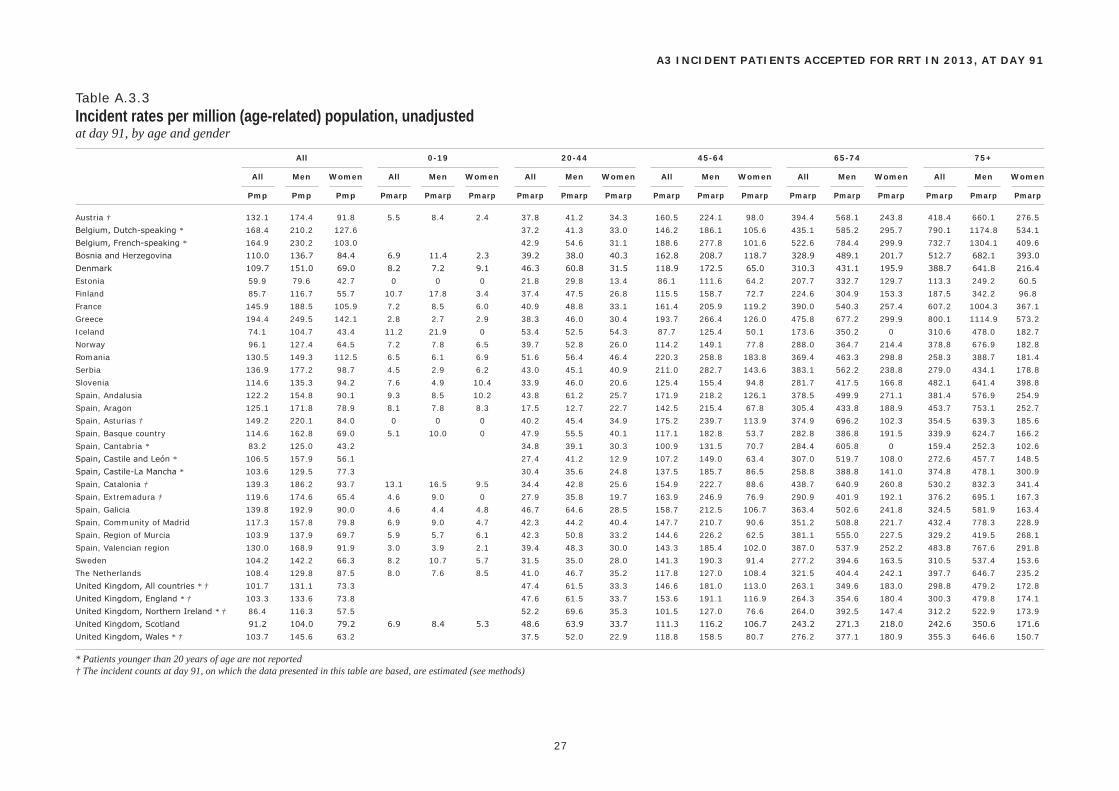
All 0-19 20-44 45-64 65-74 75+
All Men Women All Men Women All Men Women All Men Women All Men Women All Men Women
Pmp Pmp Pmp Pmarp Pmarp Pmarp Pmarp Pmarp Pmarp Pmarp Pmarp Pmarp Pmarp Pmarp Pmarp Pmarp Pmarp Pmarp
27
A3 INCIDENT PATIENTS ACCEPTED FOR RRT IN 2013, AT DAY 91
Table A.3.3Incident rates per million (age-related) population, unadjustedat day 91, by age and gender
Austria † 132.1 174.4 91.8 5.5 8.4 2.4 37.8 41.2 34.3 160.5 224.1 98.0 394.4 568.1 243.8 418.4 660.1 276.5
Belgium, Dutch-speaking * 168.4 210.2 127.6 37.2 41.3 33.0 146.2 186.1 105.6 435.1 585.2 295.7 790.1 1174.8 534.1
Belgium, French-speaking * 164.9 230.2 103.0 42.9 54.6 31.1 188.6 277.8 101.6 522.6 784.4 299.9 732.7 1304.1 409.6
Bosnia and Herzegovina 110.0 136.7 84.4 6.9 11.4 2.3 39.2 38.0 40.3 162.8 208.7 118.7 328.9 489.1 201.7 512.7 682.1 393.0
Denmark 109.7 151.0 69.0 8.2 7.2 9.1 46.3 60.8 31.5 118.9 172.5 65.0 310.3 431.1 195.9 388.7 641.8 216.4
Estonia 59.9 79.6 42.7 0 0 0 21.8 29.8 13.4 86.1 111.6 64.2 207.7 332.7 129.7 113.3 249.2 60.5
Finland 85.7 116.7 55.7 10.7 17.8 3.4 37.4 47.5 26.8 115.5 158.7 72.7 224.6 304.9 153.3 187.5 342.2 96.8
France 145.9 188.5 105.9 7.2 8.5 6.0 40.9 48.8 33.1 161.4 205.9 119.2 390.0 540.3 257.4 607.2 1004.3 367.1
Greece 194.4 249.5 142.1 2.8 2.7 2.9 38.3 46.0 30.4 193.7 266.4 126.0 475.8 677.2 299.9 800.1 1114.9 573.2
Iceland 74.1 104.7 43.4 11.2 21.9 0 53.4 52.5 54.3 87.7 125.4 50.1 173.6 350.2 0 310.6 478.0 182.7
Norway 96.1 127.4 64.5 7.2 7.8 6.5 39.7 52.8 26.0 114.2 149.1 77.8 288.0 364.7 214.4 378.8 676.9 182.8
Romania 130.5 149.3 112.5 6.5 6.1 6.9 51.6 56.4 46.4 220.3 258.8 183.8 369.4 463.3 298.8 258.3 388.7 181.4
Serbia 136.9 177.2 98.7 4.5 2.9 6.2 43.0 45.1 40.9 211.0 282.7 143.6 383.1 562.2 238.8 279.0 434.1 178.8
Slovenia 114.6 135.3 94.2 7.6 4.9 10.4 33.9 46.0 20.6 125.4 155.4 94.8 281.7 417.5 166.8 482.1 641.4 398.8
Spain, Andalusia 122.2 154.8 90.1 9.3 8.5 10.2 43.8 61.2 25.7 171.9 218.2 126.1 378.5 499.9 271.1 381.4 576.9 254.9
Spain, Aragon 125.1 171.8 78.9 8.1 7.8 8.3 17.5 12.7 22.7 142.5 215.4 67.8 305.4 433.8 188.9 453.7 753.1 252.7
Spain, Asturias † 149.2 220.1 84.0 0 0 0 40.2 45.4 34.9 175.2 239.7 113.9 374.9 696.2 102.3 354.5 639.3 185.6
Spain, Basque country 114.6 162.8 69.0 5.1 10.0 0 47.9 55.5 40.1 117.1 182.8 53.7 282.8 386.8 191.5 339.9 624.7 166.2
Spain, Cantabria * 83.2 125.0 43.2 34.8 39.1 30.3 100.9 131.5 70.7 284.4 605.8 0 159.4 252.3 102.6
Spain, Castile and León * 106.5 157.9 56.1 27.4 41.2 12.9 107.2 149.0 63.4 307.0 519.7 108.0 272.6 457.7 148.5
Spain, Castile-La Mancha * 103.6 129.5 77.3 30.4 35.6 24.8 137.5 185.7 86.5 258.8 388.8 141.0 374.8 478.1 300.9
Spain, Catalonia † 139.3 186.2 93.7 13.1 16.5 9.5 34.4 42.8 25.6 154.9 222.7 88.6 438.7 640.9 260.8 530.2 832.3 341.4
Spain, Extremadura † 119.6 174.6 65.4 4.6 9.0 0 27.9 35.8 19.7 163.9 246.9 76.9 290.9 401.9 192.1 376.2 695.1 167.3
Spain, Galicia 139.8 192.9 90.0 4.6 4.4 4.8 46.7 64.6 28.5 158.7 212.5 106.7 363.4 502.6 241.8 324.5 581.9 163.4
Spain, Community of Madrid 117.3 157.8 79.8 6.9 9.0 4.7 42.3 44.2 40.4 147.7 210.7 90.6 351.2 508.8 221.7 432.4 778.3 228.9
Spain, Region of Murcia 103.9 137.9 69.7 5.9 5.7 6.1 42.3 50.8 33.2 144.6 226.2 62.5 381.1 555.0 227.5 329.2 419.5 268.1
Spain, Valencian region 130.0 168.9 91.9 3.0 3.9 2.1 39.4 48.3 30.0 143.3 185.4 102.0 387.0 537.9 252.2 483.8 767.6 291.8
Sweden 104.2 142.2 66.3 8.2 10.7 5.7 31.5 35.0 28.0 141.3 190.3 91.4 277.2 394.6 163.5 310.5 537.4 153.6
The Netherlands 108.4 129.8 87.5 8.0 7.6 8.5 41.0 46.7 35.2 117.8 127.0 108.4 321.5 404.4 242.1 397.7 646.7 235.2
United Kingdom, All countries * † 101.7 131.1 73.3 47.4 61.5 33.3 146.6 181.0 113.0 263.1 349.6 183.0 298.8 479.2 172.8
United Kingdom, England * † 103.3 133.6 73.8 47.6 61.5 33.7 153.6 191.1 116.9 264.3 354.6 180.4 300.3 479.8 174.1
United Kingdom, Northern Ireland * † 86.4 116.3 57.5 52.2 69.6 35.3 101.5 127.0 76.6 264.0 392.5 147.4 312.2 522.9 173.9
United Kingdom, Scotland 91.2 104.0 79.2 6.9 8.4 5.3 48.6 63.9 33.7 111.3 116.2 106.7 243.2 271.3 218.0 242.6 350.6 171.6
United Kingdom, Wales * † 103.7 145.6 63.2 37.5 52.0 22.9 118.8 158.5 80.7 276.2 377.1 180.9 355.3 646.6 150.7
* Patients younger than 20 years of age are not reported† The incident counts at day 91, on which the data presented in this table are based, are estimated (see methods)
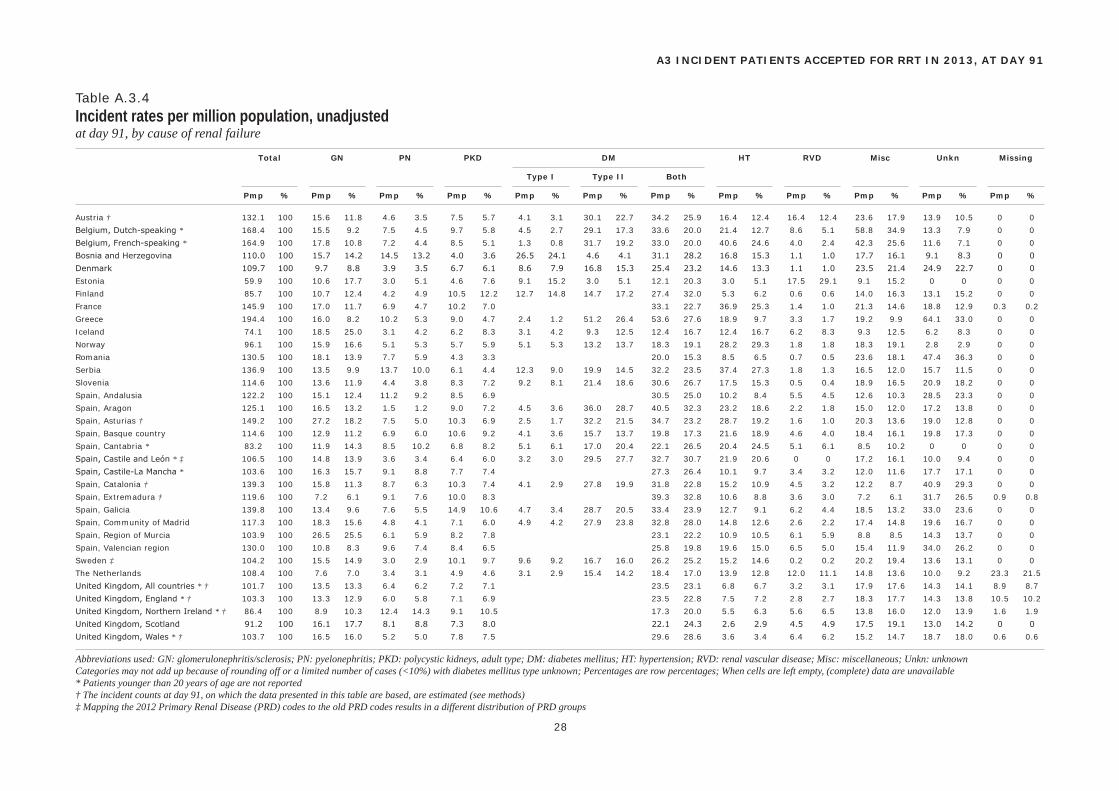
Total GN PN PKD DM HT RVD Misc Unkn Missing
Type I Type II Both
Pmp % Pmp % Pmp % Pmp % Pmp % Pmp % Pmp % Pmp % Pmp % Pmp % Pmp % Pmp %
28
A3 INCIDENT PATIENTS ACCEPTED FOR RRT IN 2013, AT DAY 91
Table A.3.4Incident rates per million population, unadjustedat day 91, by cause of renal failure
Austria † 132.1 100 15.6 11.8 4.6 3.5 7.5 5.7 4.1 3.1 30.1 22.7 34.2 25.9 16.4 12.4 16.4 12.4 23.6 17.9 13.9 10.5 0 0
Belgium, Dutch-speaking * 168.4 100 15.5 9.2 7.5 4.5 9.7 5.8 4.5 2.7 29.1 17.3 33.6 20.0 21.4 12.7 8.6 5.1 58.8 34.9 13.3 7.9 0 0
Belgium, French-speaking * 164.9 100 17.8 10.8 7.2 4.4 8.5 5.1 1.3 0.8 31.7 19.2 33.0 20.0 40.6 24.6 4.0 2.4 42.3 25.6 11.6 7.1 0 0
Bosnia and Herzegovina 110.0 100 15.7 14.2 14.5 13.2 4.0 3.6 26.5 24.1 4.6 4.1 31.1 28.2 16.8 15.3 1.1 1.0 17.7 16.1 9.1 8.3 0 0
Denmark 109.7 100 9.7 8.8 3.9 3.5 6.7 6.1 8.6 7.9 16.8 15.3 25.4 23.2 14.6 13.3 1.1 1.0 23.5 21.4 24.9 22.7 0 0
Estonia 59.9 100 10.6 17.7 3.0 5.1 4.6 7.6 9.1 15.2 3.0 5.1 12.1 20.3 3.0 5.1 17.5 29.1 9.1 15.2 0 0 0 0
Finland 85.7 100 10.7 12.4 4.2 4.9 10.5 12.2 12.7 14.8 14.7 17.2 27.4 32.0 5.3 6.2 0.6 0.6 14.0 16.3 13.1 15.2 0 0
France 145.9 100 17.0 11.7 6.9 4.7 10.2 7.0 33.1 22.7 36.9 25.3 1.4 1.0 21.3 14.6 18.8 12.9 0.3 0.2
Greece 194.4 100 16.0 8.2 10.2 5.3 9.0 4.7 2.4 1.2 51.2 26.4 53.6 27.6 18.9 9.7 3.3 1.7 19.2 9.9 64.1 33.0 0 0
Iceland 74.1 100 18.5 25.0 3.1 4.2 6.2 8.3 3.1 4.2 9.3 12.5 12.4 16.7 12.4 16.7 6.2 8.3 9.3 12.5 6.2 8.3 0 0
Norway 96.1 100 15.9 16.6 5.1 5.3 5.7 5.9 5.1 5.3 13.2 13.7 18.3 19.1 28.2 29.3 1.8 1.8 18.3 19.1 2.8 2.9 0 0
Romania 130.5 100 18.1 13.9 7.7 5.9 4.3 3.3 20.0 15.3 8.5 6.5 0.7 0.5 23.6 18.1 47.4 36.3 0 0
Serbia 136.9 100 13.5 9.9 13.7 10.0 6.1 4.4 12.3 9.0 19.9 14.5 32.2 23.5 37.4 27.3 1.8 1.3 16.5 12.0 15.7 11.5 0 0
Slovenia 114.6 100 13.6 11.9 4.4 3.8 8.3 7.2 9.2 8.1 21.4 18.6 30.6 26.7 17.5 15.3 0.5 0.4 18.9 16.5 20.9 18.2 0 0
Spain, Andalusia 122.2 100 15.1 12.4 11.2 9.2 8.5 6.9 30.5 25.0 10.2 8.4 5.5 4.5 12.6 10.3 28.5 23.3 0 0
Spain, Aragon 125.1 100 16.5 13.2 1.5 1.2 9.0 7.2 4.5 3.6 36.0 28.7 40.5 32.3 23.2 18.6 2.2 1.8 15.0 12.0 17.2 13.8 0 0
Spain, Asturias † 149.2 100 27.2 18.2 7.5 5.0 10.3 6.9 2.5 1.7 32.2 21.5 34.7 23.2 28.7 19.2 1.6 1.0 20.3 13.6 19.0 12.8 0 0
Spain, Basque country 114.6 100 12.9 11.2 6.9 6.0 10.6 9.2 4.1 3.6 15.7 13.7 19.8 17.3 21.6 18.9 4.6 4.0 18.4 16.1 19.8 17.3 0 0
Spain, Cantabria * 83.2 100 11.9 14.3 8.5 10.2 6.8 8.2 5.1 6.1 17.0 20.4 22.1 26.5 20.4 24.5 5.1 6.1 8.5 10.2 0 0 0 0
Spain, Castile and León * ‡ 106.5 100 14.8 13.9 3.6 3.4 6.4 6.0 3.2 3.0 29.5 27.7 32.7 30.7 21.9 20.6 0 0 17.2 16.1 10.0 9.4 0 0
Spain, Castile-La Mancha * 103.6 100 16.3 15.7 9.1 8.8 7.7 7.4 27.3 26.4 10.1 9.7 3.4 3.2 12.0 11.6 17.7 17.1 0 0
Spain, Catalonia † 139.3 100 15.8 11.3 8.7 6.3 10.3 7.4 4.1 2.9 27.8 19.9 31.8 22.8 15.2 10.9 4.5 3.2 12.2 8.7 40.9 29.3 0 0
Spain, Extremadura † 119.6 100 7.2 6.1 9.1 7.6 10.0 8.3 39.3 32.8 10.6 8.8 3.6 3.0 7.2 6.1 31.7 26.5 0.9 0.8
Spain, Galicia 139.8 100 13.4 9.6 7.6 5.5 14.9 10.6 4.7 3.4 28.7 20.5 33.4 23.9 12.7 9.1 6.2 4.4 18.5 13.2 33.0 23.6 0 0
Spain, Community of Madrid 117.3 100 18.3 15.6 4.8 4.1 7.1 6.0 4.9 4.2 27.9 23.8 32.8 28.0 14.8 12.6 2.6 2.2 17.4 14.8 19.6 16.7 0 0
Spain, Region of Murcia 103.9 100 26.5 25.5 6.1 5.9 8.2 7.8 23.1 22.2 10.9 10.5 6.1 5.9 8.8 8.5 14.3 13.7 0 0
Spain, Valencian region 130.0 100 10.8 8.3 9.6 7.4 8.4 6.5 25.8 19.8 19.6 15.0 6.5 5.0 15.4 11.9 34.0 26.2 0 0
Sweden ‡ 104.2 100 15.5 14.9 3.0 2.9 10.1 9.7 9.6 9.2 16.7 16.0 26.2 25.2 15.2 14.6 0.2 0.2 20.2 19.4 13.6 13.1 0 0
The Netherlands 108.4 100 7.6 7.0 3.4 3.1 4.9 4.6 3.1 2.9 15.4 14.2 18.4 17.0 13.9 12.8 12.0 11.1 14.8 13.6 10.0 9.2 23.3 21.5
United Kingdom, All countries * † 101.7 100 13.5 13.3 6.4 6.2 7.2 7.1 23.5 23.1 6.8 6.7 3.2 3.1 17.9 17.6 14.3 14.1 8.9 8.7
United Kingdom, England * † 103.3 100 13.3 12.9 6.0 5.8 7.1 6.9 23.5 22.8 7.5 7.2 2.8 2.7 18.3 17.7 14.3 13.8 10.5 10.2
United Kingdom, Northern Ireland * † 86.4 100 8.9 10.3 12.4 14.3 9.1 10.5 17.3 20.0 5.5 6.3 5.6 6.5 13.8 16.0 12.0 13.9 1.6 1.9
United Kingdom, Scotland 91.2 100 16.1 17.7 8.1 8.8 7.3 8.0 22.1 24.3 2.6 2.9 4.5 4.9 17.5 19.1 13.0 14.2 0 0
United Kingdom, Wales * † 103.7 100 16.5 16.0 5.2 5.0 7.8 7.5 29.6 28.6 3.6 3.4 6.4 6.2 15.2 14.7 18.7 18.0 0.6 0.6
Abbreviations used: GN: glomerulonephritis/sclerosis; PN: pyelonephritis; PKD: polycystic kidneys, adult type; DM: diabetes mellitus; HT: hypertension; RVD: renal vascular disease; Misc: miscellaneous; Unkn: unknownCategories may not add up because of rounding off or a limited number of cases (<10%) with diabetes mellitus type unknown; Percentages are row percentages; When cells are left empty, (complete) data are unavailable* Patients younger than 20 years of age are not reported† The incident counts at day 91, on which the data presented in this table are based, are estimated (see methods)‡ Mapping the 2012 Primary Renal Disease (PRD) codes to the old PRD codes results in a different distribution of PRD groups
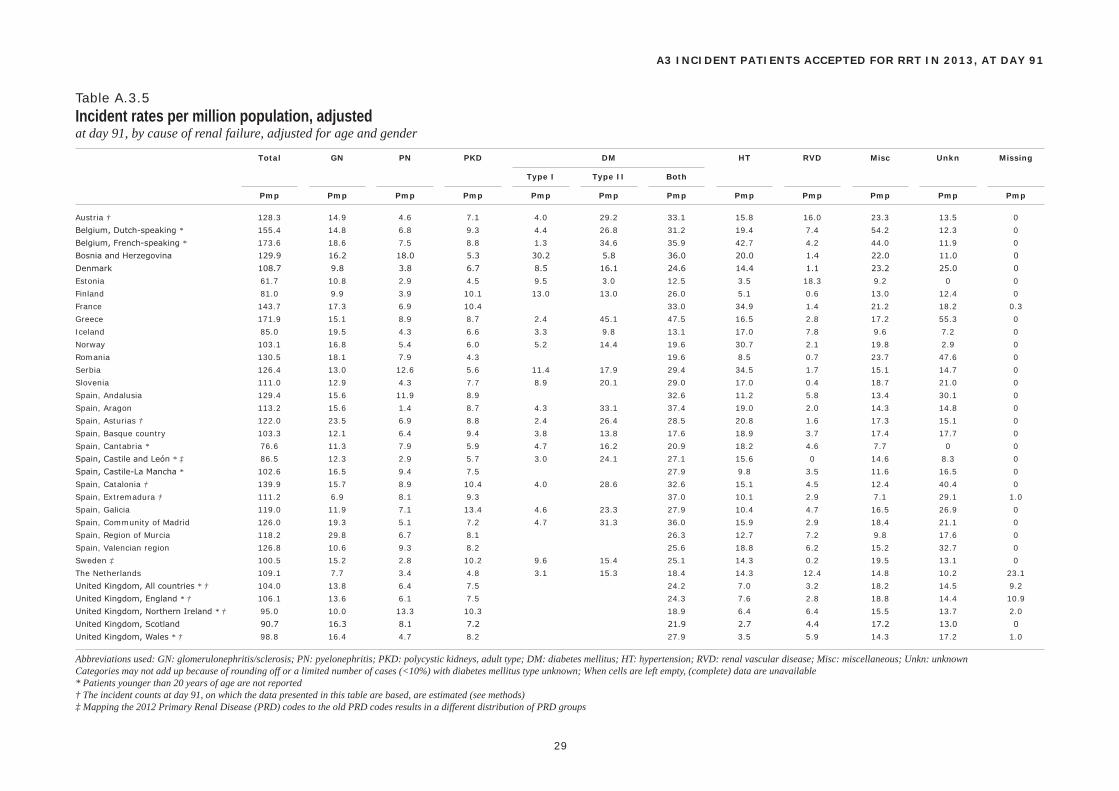
Total GN PN PKD DM HT RVD Misc Unkn Missing
Type I Type II Both
Pmp Pmp Pmp Pmp Pmp Pmp Pmp Pmp Pmp Pmp Pmp Pmp
29
A3 INCIDENT PATIENTS ACCEPTED FOR RRT IN 2013, AT DAY 91
Table A.3.5Incident rates per million population, adjustedat day 91, by cause of renal failure, adjusted for age and gender
Austria † 128.3 14.9 4.6 7.1 4.0 29.2 33.1 15.8 16.0 23.3 13.5 0
Belgium, Dutch-speaking * 155.4 14.8 6.8 9.3 4.4 26.8 31.2 19.4 7.4 54.2 12.3 0
Belgium, French-speaking * 173.6 18.6 7.5 8.8 1.3 34.6 35.9 42.7 4.2 44.0 11.9 0
Bosnia and Herzegovina 129.9 16.2 18.0 5.3 30.2 5.8 36.0 20.0 1.4 22.0 11.0 0
Denmark 108.7 9.8 3.8 6.7 8.5 16.1 24.6 14.4 1.1 23.2 25.0 0
Estonia 61.7 10.8 2.9 4.5 9.5 3.0 12.5 3.5 18.3 9.2 0 0
Finland 81.0 9.9 3.9 10.1 13.0 13.0 26.0 5.1 0.6 13.0 12.4 0
France 143.7 17.3 6.9 10.4 33.0 34.9 1.4 21.2 18.2 0.3
Greece 171.9 15.1 8.9 8.7 2.4 45.1 47.5 16.5 2.8 17.2 55.3 0
Iceland 85.0 19.5 4.3 6.6 3.3 9.8 13.1 17.0 7.8 9.6 7.2 0
Norway 103.1 16.8 5.4 6.0 5.2 14.4 19.6 30.7 2.1 19.8 2.9 0
Romania 130.5 18.1 7.9 4.3 19.6 8.5 0.7 23.7 47.6 0
Serbia 126.4 13.0 12.6 5.6 11.4 17.9 29.4 34.5 1.7 15.1 14.7 0
Slovenia 111.0 12.9 4.3 7.7 8.9 20.1 29.0 17.0 0.4 18.7 21.0 0
Spain, Andalusia 129.4 15.6 11.9 8.9 32.6 11.2 5.8 13.4 30.1 0
Spain, Aragon 113.2 15.6 1.4 8.7 4.3 33.1 37.4 19.0 2.0 14.3 14.8 0
Spain, Asturias † 122.0 23.5 6.9 8.8 2.4 26.4 28.5 20.8 1.6 17.3 15.1 0
Spain, Basque country 103.3 12.1 6.4 9.4 3.8 13.8 17.6 18.9 3.7 17.4 17.7 0
Spain, Cantabria * 76.6 11.3 7.9 5.9 4.7 16.2 20.9 18.2 4.6 7.7 0 0
Spain, Castile and León * ‡ 86.5 12.3 2.9 5.7 3.0 24.1 27.1 15.6 0 14.6 8.3 0
Spain, Castile-La Mancha * 102.6 16.5 9.4 7.5 27.9 9.8 3.5 11.6 16.5 0
Spain, Catalonia † 139.9 15.7 8.9 10.4 4.0 28.6 32.6 15.1 4.5 12.4 40.4 0
Spain, Extremadura † 111.2 6.9 8.1 9.3 37.0 10.1 2.9 7.1 29.1 1.0
Spain, Galicia 119.0 11.9 7.1 13.4 4.6 23.3 27.9 10.4 4.7 16.5 26.9 0
Spain, Community of Madrid 126.0 19.3 5.1 7.2 4.7 31.3 36.0 15.9 2.9 18.4 21.1 0
Spain, Region of Murcia 118.2 29.8 6.7 8.1 26.3 12.7 7.2 9.8 17.6 0
Spain, Valencian region 126.8 10.6 9.3 8.2 25.6 18.8 6.2 15.2 32.7 0
Sweden ‡ 100.5 15.2 2.8 10.2 9.6 15.4 25.1 14.3 0.2 19.5 13.1 0
The Netherlands 109.1 7.7 3.4 4.8 3.1 15.3 18.4 14.3 12.4 14.8 10.2 23.1
United Kingdom, All countries * † 104.0 13.8 6.4 7.5 24.2 7.0 3.2 18.2 14.5 9.2
United Kingdom, England * † 106.1 13.6 6.1 7.5 24.3 7.6 2.8 18.8 14.4 10.9
United Kingdom, Northern Ireland * † 95.0 10.0 13.3 10.3 18.9 6.4 6.4 15.5 13.7 2.0
United Kingdom, Scotland 90.7 16.3 8.1 7.2 21.9 2.7 4.4 17.2 13.0 0
United Kingdom, Wales * † 98.8 16.4 4.7 8.2 27.9 3.5 5.9 14.3 17.2 1.0
Abbreviations used: GN: glomerulonephritis/sclerosis; PN: pyelonephritis; PKD: polycystic kidneys, adult type; DM: diabetes mellitus; HT: hypertension; RVD: renal vascular disease; Misc: miscellaneous; Unkn: unknownCategories may not add up because of rounding off or a limited number of cases (<10%) with diabetes mellitus type unknown; When cells are left empty, (complete) data are unavailable* Patients younger than 20 years of age are not reported† The incident counts at day 91, on which the data presented in this table are based, are estimated (see methods)‡ Mapping the 2012 Primary Renal Disease (PRD) codes to the old PRD codes results in a different distribution of PRD groups
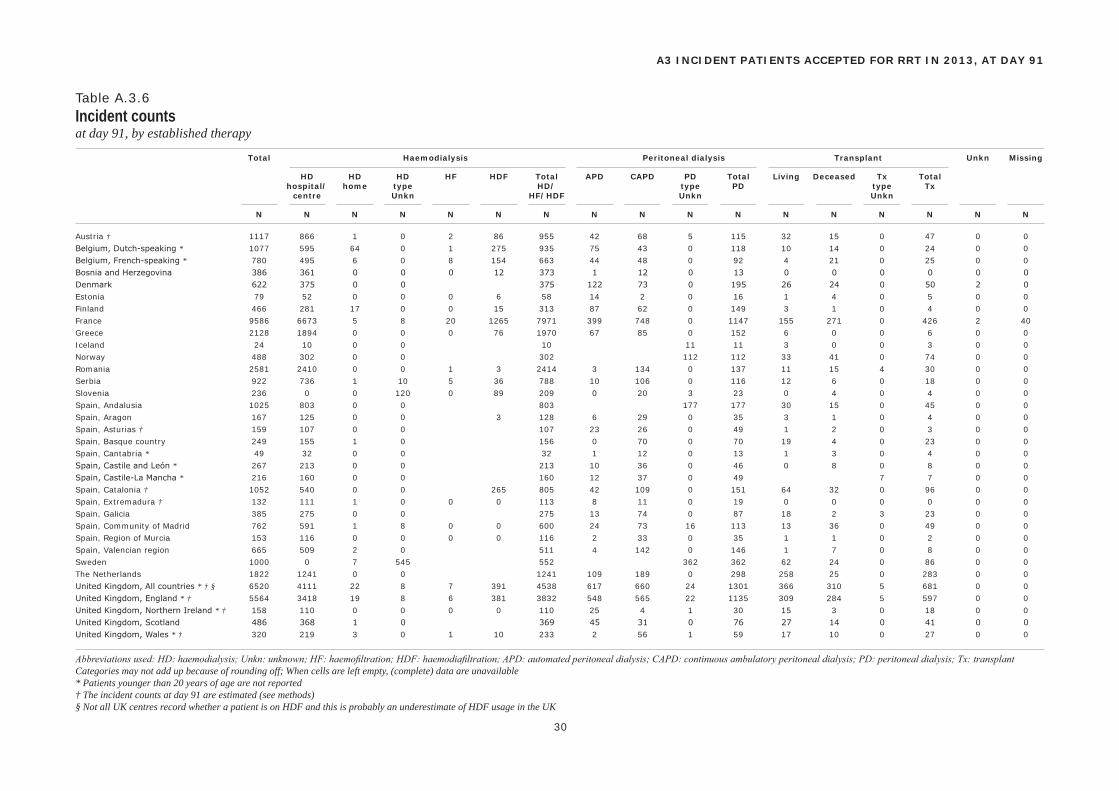
Total Haemodialysis Peritoneal dialysis Transplant Unkn Missing
HD HD HD HF HDF Total APD CAPD PD Total Living Deceased Tx Total hospital/ home type HD/ type PD type Tx centre Unkn HF/HDF Unkn Unkn
N N N N N N N N N N N N N N N N N
30
A3 INCIDENT PATIENTS ACCEPTED FOR RRT IN 2013, AT DAY 91
Table A.3.6Incident countsat day 91, by established therapy
Austria † 1117 866 1 0 2 86 955 42 68 5 115 32 15 0 47 0 0
Belgium, Dutch-speaking * 1077 595 64 0 1 275 935 75 43 0 118 10 14 0 24 0 0
Belgium, French-speaking * 780 495 6 0 8 154 663 44 48 0 92 4 21 0 25 0 0
Bosnia and Herzegovina 386 361 0 0 0 12 373 1 12 0 13 0 0 0 0 0 0
Denmark 622 375 0 0 375 122 73 0 195 26 24 0 50 2 0
Estonia 79 52 0 0 0 6 58 14 2 0 16 1 4 0 5 0 0
Finland 466 281 17 0 0 15 313 87 62 0 149 3 1 0 4 0 0
France 9586 6673 5 8 20 1265 7971 399 748 0 1147 155 271 0 426 2 40
Greece 2128 1894 0 0 0 76 1970 67 85 0 152 6 0 0 6 0 0
Iceland 24 10 0 0 10 11 11 3 0 0 3 0 0
Norway 488 302 0 0 302 112 112 33 41 0 74 0 0
Romania 2581 2410 0 0 1 3 2414 3 134 0 137 11 15 4 30 0 0
Serbia 922 736 1 10 5 36 788 10 106 0 116 12 6 0 18 0 0
Slovenia 236 0 0 120 0 89 209 0 20 3 23 0 4 0 4 0 0
Spain, Andalusia 1025 803 0 0 803 177 177 30 15 0 45 0 0
Spain, Aragon 167 125 0 0 3 128 6 29 0 35 3 1 0 4 0 0
Spain, Asturias † 159 107 0 0 107 23 26 0 49 1 2 0 3 0 0
Spain, Basque country 249 155 1 0 156 0 70 0 70 19 4 0 23 0 0
Spain, Cantabria * 49 32 0 0 32 1 12 0 13 1 3 0 4 0 0
Spain, Castile and León * 267 213 0 0 213 10 36 0 46 0 8 0 8 0 0
Spain, Castile-La Mancha * 216 160 0 0 160 12 37 0 49 7 7 0 0
Spain, Catalonia † 1052 540 0 0 265 805 42 109 0 151 64 32 0 96 0 0
Spain, Extremadura † 132 111 1 0 0 0 113 8 11 0 19 0 0 0 0 0 0
Spain, Galicia 385 275 0 0 275 13 74 0 87 18 2 3 23 0 0
Spain, Community of Madrid 762 591 1 8 0 0 600 24 73 16 113 13 36 0 49 0 0
Spain, Region of Murcia 153 116 0 0 0 0 116 2 33 0 35 1 1 0 2 0 0
Spain, Valencian region 665 509 2 0 511 4 142 0 146 1 7 0 8 0 0
Sweden 1000 0 7 545 552 362 362 62 24 0 86 0 0
The Netherlands 1822 1241 0 0 1241 109 189 0 298 258 25 0 283 0 0
United Kingdom, All countries * † § 6520 4111 22 8 7 391 4538 617 660 24 1301 366 310 5 681 0 0
United Kingdom, England * † 5564 3418 19 8 6 381 3832 548 565 22 1135 309 284 5 597 0 0
United Kingdom, Northern Ireland * † 158 110 0 0 0 0 110 25 4 1 30 15 3 0 18 0 0
United Kingdom, Scotland 486 368 1 0 369 45 31 0 76 27 14 0 41 0 0
United Kingdom, Wales * † 320 219 3 0 1 10 233 2 56 1 59 17 10 0 27 0 0
Abbreviations used: HD: haemodialysis; Unkn: unknown; HF: haemofiltration; HDF: haemodiafiltration; APD: automated peritoneal dialysis; CAPD: continuous ambulatory peritoneal dialysis; PD: peritoneal dialysis; Tx: transplantCategories may not add up because of rounding off; When cells are left empty, (complete) data are unavailable* Patients younger than 20 years of age are not reported† The incident counts at day 91 are estimated (see methods)§ Not all UK centres record whether a patient is on HDF and this is probably an underestimate of HDF usage in the UK
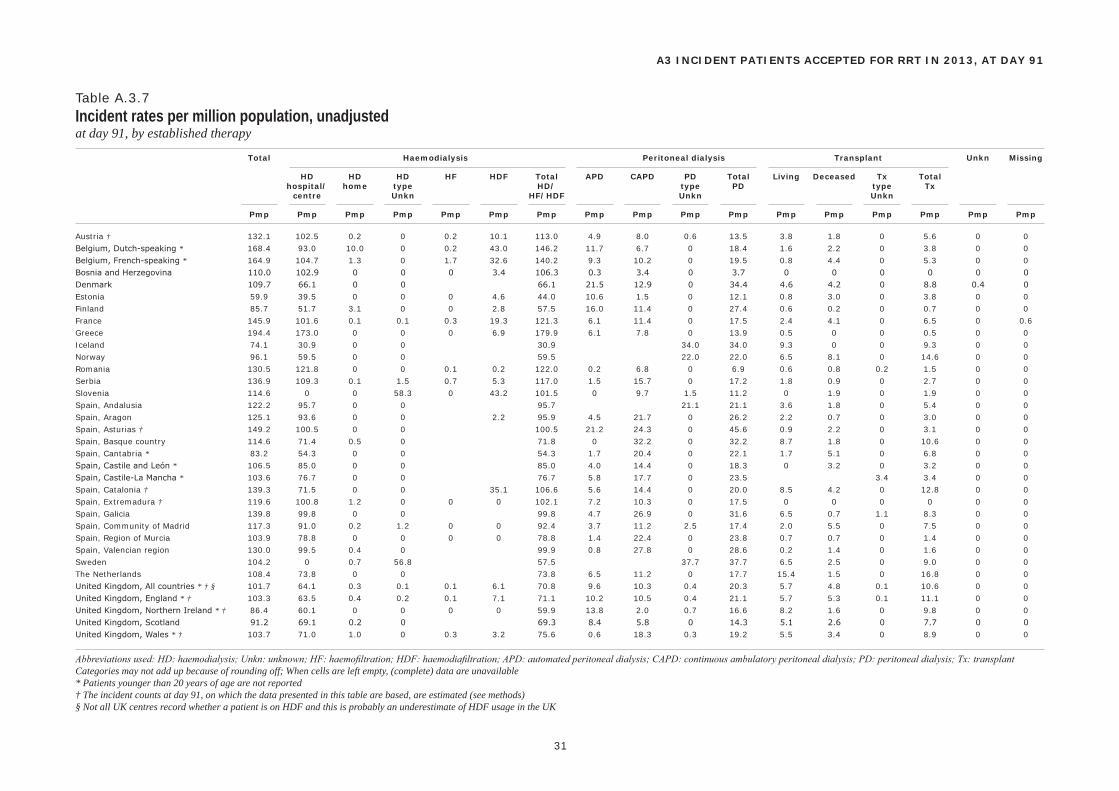
Total Haemodialysis Peritoneal dialysis Transplant Unkn Missing
HD HD HD HF HDF Total APD CAPD PD Total Living Deceased Tx Total hospital/ home type HD/ type PD type Tx centre Unkn HF/HDF Unkn Unkn
Pmp Pmp Pmp Pmp Pmp Pmp Pmp Pmp Pmp Pmp Pmp Pmp Pmp Pmp Pmp Pmp Pmp
31
A3 INCIDENT PATIENTS ACCEPTED FOR RRT IN 2013, AT DAY 91
Table A.3.7Incident rates per million population, unadjustedat day 91, by established therapy
Austria † 132.1 102.5 0.2 0 0.2 10.1 113.0 4.9 8.0 0.6 13.5 3.8 1.8 0 5.6 0 0
Belgium, Dutch-speaking * 168.4 93.0 10.0 0 0.2 43.0 146.2 11.7 6.7 0 18.4 1.6 2.2 0 3.8 0 0
Belgium, French-speaking * 164.9 104.7 1.3 0 1.7 32.6 140.2 9.3 10.2 0 19.5 0.8 4.4 0 5.3 0 0
Bosnia and Herzegovina 110.0 102.9 0 0 0 3.4 106.3 0.3 3.4 0 3.7 0 0 0 0 0 0
Denmark 109.7 66.1 0 0 66.1 21.5 12.9 0 34.4 4.6 4.2 0 8.8 0.4 0
Estonia 59.9 39.5 0 0 0 4.6 44.0 10.6 1.5 0 12.1 0.8 3.0 0 3.8 0 0
Finland 85.7 51.7 3.1 0 0 2.8 57.5 16.0 11.4 0 27.4 0.6 0.2 0 0.7 0 0
France 145.9 101.6 0.1 0.1 0.3 19.3 121.3 6.1 11.4 0 17.5 2.4 4.1 0 6.5 0 0.6
Greece 194.4 173.0 0 0 0 6.9 179.9 6.1 7.8 0 13.9 0.5 0 0 0.5 0 0
Iceland 74.1 30.9 0 0 30.9 34.0 34.0 9.3 0 0 9.3 0 0
Norway 96.1 59.5 0 0 59.5 22.0 22.0 6.5 8.1 0 14.6 0 0
Romania 130.5 121.8 0 0 0.1 0.2 122.0 0.2 6.8 0 6.9 0.6 0.8 0.2 1.5 0 0
Serbia 136.9 109.3 0.1 1.5 0.7 5.3 117.0 1.5 15.7 0 17.2 1.8 0.9 0 2.7 0 0
Slovenia 114.6 0 0 58.3 0 43.2 101.5 0 9.7 1.5 11.2 0 1.9 0 1.9 0 0
Spain, Andalusia 122.2 95.7 0 0 95.7 21.1 21.1 3.6 1.8 0 5.4 0 0
Spain, Aragon 125.1 93.6 0 0 2.2 95.9 4.5 21.7 0 26.2 2.2 0.7 0 3.0 0 0
Spain, Asturias † 149.2 100.5 0 0 100.5 21.2 24.3 0 45.6 0.9 2.2 0 3.1 0 0
Spain, Basque country 114.6 71.4 0.5 0 71.8 0 32.2 0 32.2 8.7 1.8 0 10.6 0 0
Spain, Cantabria * 83.2 54.3 0 0 54.3 1.7 20.4 0 22.1 1.7 5.1 0 6.8 0 0
Spain, Castile and León * 106.5 85.0 0 0 85.0 4.0 14.4 0 18.3 0 3.2 0 3.2 0 0
Spain, Castile-La Mancha * 103.6 76.7 0 0 76.7 5.8 17.7 0 23.5 3.4 3.4 0 0
Spain, Catalonia † 139.3 71.5 0 0 35.1 106.6 5.6 14.4 0 20.0 8.5 4.2 0 12.8 0 0
Spain, Extremadura † 119.6 100.8 1.2 0 0 0 102.1 7.2 10.3 0 17.5 0 0 0 0 0 0
Spain, Galicia 139.8 99.8 0 0 99.8 4.7 26.9 0 31.6 6.5 0.7 1.1 8.3 0 0
Spain, Community of Madrid 117.3 91.0 0.2 1.2 0 0 92.4 3.7 11.2 2.5 17.4 2.0 5.5 0 7.5 0 0
Spain, Region of Murcia 103.9 78.8 0 0 0 0 78.8 1.4 22.4 0 23.8 0.7 0.7 0 1.4 0 0
Spain, Valencian region 130.0 99.5 0.4 0 99.9 0.8 27.8 0 28.6 0.2 1.4 0 1.6 0 0
Sweden 104.2 0 0.7 56.8 57.5 37.7 37.7 6.5 2.5 0 9.0 0 0
The Netherlands 108.4 73.8 0 0 73.8 6.5 11.2 0 17.7 15.4 1.5 0 16.8 0 0
United Kingdom, All countries * † § 101.7 64.1 0.3 0.1 0.1 6.1 70.8 9.6 10.3 0.4 20.3 5.7 4.8 0.1 10.6 0 0
United Kingdom, England * † 103.3 63.5 0.4 0.2 0.1 7.1 71.1 10.2 10.5 0.4 21.1 5.7 5.3 0.1 11.1 0 0
United Kingdom, Northern Ireland * † 86.4 60.1 0 0 0 0 59.9 13.8 2.0 0.7 16.6 8.2 1.6 0 9.8 0 0
United Kingdom, Scotland 91.2 69.1 0.2 0 69.3 8.4 5.8 0 14.3 5.1 2.6 0 7.7 0 0
United Kingdom, Wales * † 103.7 71.0 1.0 0 0.3 3.2 75.6 0.6 18.3 0.3 19.2 5.5 3.4 0 8.9 0 0
Abbreviations used: HD: haemodialysis; Unkn: unknown; HF: haemofiltration; HDF: haemodiafiltration; APD: automated peritoneal dialysis; CAPD: continuous ambulatory peritoneal dialysis; PD: peritoneal dialysis; Tx: transplantCategories may not add up because of rounding off; When cells are left empty, (complete) data are unavailable* Patients younger than 20 years of age are not reported† The incident counts at day 91, on which the data presented in this table are based, are estimated (see methods)§ Not all UK centres record whether a patient is on HDF and this is probably an underestimate of HDF usage in the UK
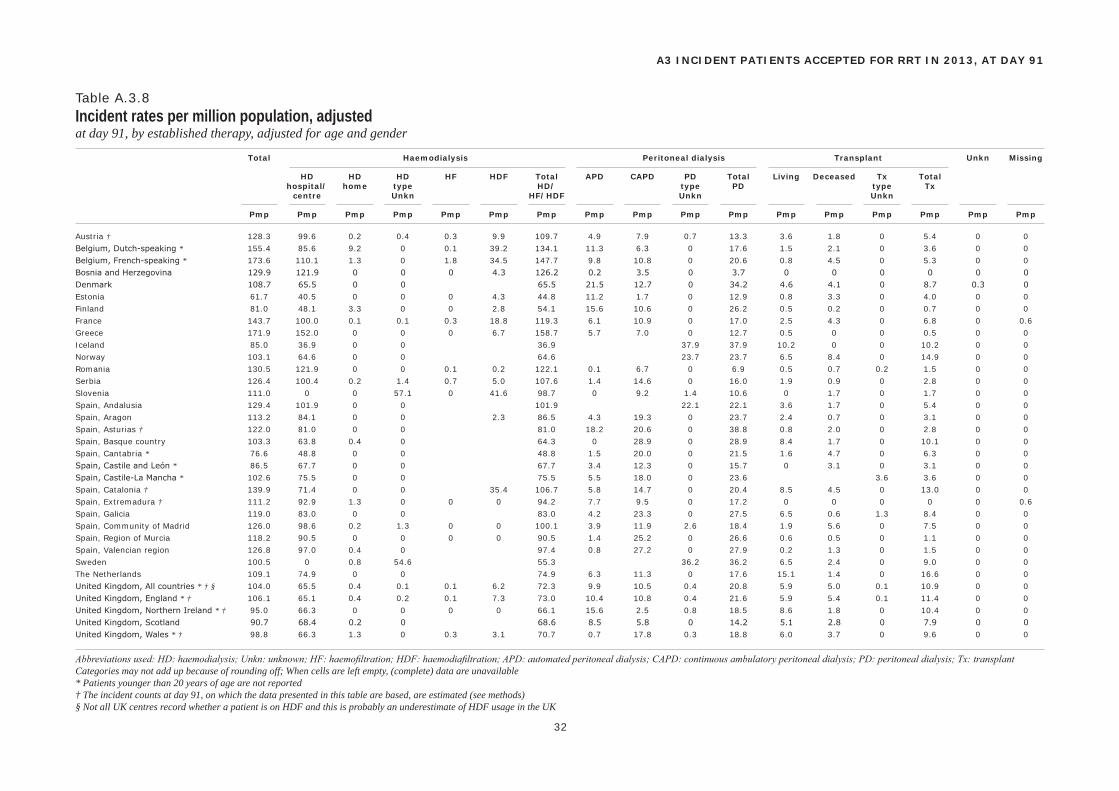
Total Haemodialysis Peritoneal dialysis Transplant Unkn Missing
HD HD HD HF HDF Total APD CAPD PD Total Living Deceased Tx Total hospital/ home type HD/ type PD type Tx centre Unkn HF/HDF Unkn Unkn
Pmp Pmp Pmp Pmp Pmp Pmp Pmp Pmp Pmp Pmp Pmp Pmp Pmp Pmp Pmp Pmp Pmp
32
A3 INCIDENT PATIENTS ACCEPTED FOR RRT IN 2013, AT DAY 91
Table A.3.8Incident rates per million population, adjustedat day 91, by established therapy, adjusted for age and gender
Austria † 128.3 99.6 0.2 0.4 0.3 9.9 109.7 4.9 7.9 0.7 13.3 3.6 1.8 0 5.4 0 0
Belgium, Dutch-speaking * 155.4 85.6 9.2 0 0.1 39.2 134.1 11.3 6.3 0 17.6 1.5 2.1 0 3.6 0 0
Belgium, French-speaking * 173.6 110.1 1.3 0 1.8 34.5 147.7 9.8 10.8 0 20.6 0.8 4.5 0 5.3 0 0
Bosnia and Herzegovina 129.9 121.9 0 0 0 4.3 126.2 0.2 3.5 0 3.7 0 0 0 0 0 0
Denmark 108.7 65.5 0 0 65.5 21.5 12.7 0 34.2 4.6 4.1 0 8.7 0.3 0
Estonia 61.7 40.5 0 0 0 4.3 44.8 11.2 1.7 0 12.9 0.8 3.3 0 4.0 0 0
Finland 81.0 48.1 3.3 0 0 2.8 54.1 15.6 10.6 0 26.2 0.5 0.2 0 0.7 0 0
France 143.7 100.0 0.1 0.1 0.3 18.8 119.3 6.1 10.9 0 17.0 2.5 4.3 0 6.8 0 0.6
Greece 171.9 152.0 0 0 0 6.7 158.7 5.7 7.0 0 12.7 0.5 0 0 0.5 0 0
Iceland 85.0 36.9 0 0 36.9 37.9 37.9 10.2 0 0 10.2 0 0
Norway 103.1 64.6 0 0 64.6 23.7 23.7 6.5 8.4 0 14.9 0 0
Romania 130.5 121.9 0 0 0.1 0.2 122.1 0.1 6.7 0 6.9 0.5 0.7 0.2 1.5 0 0
Serbia 126.4 100.4 0.2 1.4 0.7 5.0 107.6 1.4 14.6 0 16.0 1.9 0.9 0 2.8 0 0
Slovenia 111.0 0 0 57.1 0 41.6 98.7 0 9.2 1.4 10.6 0 1.7 0 1.7 0 0
Spain, Andalusia 129.4 101.9 0 0 101.9 22.1 22.1 3.6 1.7 0 5.4 0 0
Spain, Aragon 113.2 84.1 0 0 2.3 86.5 4.3 19.3 0 23.7 2.4 0.7 0 3.1 0 0
Spain, Asturias † 122.0 81.0 0 0 81.0 18.2 20.6 0 38.8 0.8 2.0 0 2.8 0 0
Spain, Basque country 103.3 63.8 0.4 0 64.3 0 28.9 0 28.9 8.4 1.7 0 10.1 0 0
Spain, Cantabria * 76.6 48.8 0 0 48.8 1.5 20.0 0 21.5 1.6 4.7 0 6.3 0 0
Spain, Castile and León * 86.5 67.7 0 0 67.7 3.4 12.3 0 15.7 0 3.1 0 3.1 0 0
Spain, Castile-La Mancha * 102.6 75.5 0 0 75.5 5.5 18.0 0 23.6 3.6 3.6 0 0
Spain, Catalonia † 139.9 71.4 0 0 35.4 106.7 5.8 14.7 0 20.4 8.5 4.5 0 13.0 0 0
Spain, Extremadura † 111.2 92.9 1.3 0 0 0 94.2 7.7 9.5 0 17.2 0 0 0 0 0 0.6
Spain, Galicia 119.0 83.0 0 0 83.0 4.2 23.3 0 27.5 6.5 0.6 1.3 8.4 0 0
Spain, Community of Madrid 126.0 98.6 0.2 1.3 0 0 100.1 3.9 11.9 2.6 18.4 1.9 5.6 0 7.5 0 0
Spain, Region of Murcia 118.2 90.5 0 0 0 0 90.5 1.4 25.2 0 26.6 0.6 0.5 0 1.1 0 0
Spain, Valencian region 126.8 97.0 0.4 0 97.4 0.8 27.2 0 27.9 0.2 1.3 0 1.5 0 0
Sweden 100.5 0 0.8 54.6 55.3 36.2 36.2 6.5 2.4 0 9.0 0 0
The Netherlands 109.1 74.9 0 0 74.9 6.3 11.3 0 17.6 15.1 1.4 0 16.6 0 0
United Kingdom, All countries * † § 104.0 65.5 0.4 0.1 0.1 6.2 72.3 9.9 10.5 0.4 20.8 5.9 5.0 0.1 10.9 0 0
United Kingdom, England * † 106.1 65.1 0.4 0.2 0.1 7.3 73.0 10.4 10.8 0.4 21.6 5.9 5.4 0.1 11.4 0 0
United Kingdom, Northern Ireland * † 95.0 66.3 0 0 0 0 66.1 15.6 2.5 0.8 18.5 8.6 1.8 0 10.4 0 0
United Kingdom, Scotland 90.7 68.4 0.2 0 68.6 8.5 5.8 0 14.2 5.1 2.8 0 7.9 0 0
United Kingdom, Wales * † 98.8 66.3 1.3 0 0.3 3.1 70.7 0.7 17.8 0.3 18.8 6.0 3.7 0 9.6 0 0
Abbreviations used: HD: haemodialysis; Unkn: unknown; HF: haemofiltration; HDF: haemodiafiltration; APD: automated peritoneal dialysis; CAPD: continuous ambulatory peritoneal dialysis; PD: peritoneal dialysis; Tx: transplantCategories may not add up because of rounding off; When cells are left empty, (complete) data are unavailable* Patients younger than 20 years of age are not reported† The incident counts at day 91, on which the data presented in this table are based, are estimated (see methods)§ Not all UK centres record whether a patient is on HDF and this is probably an underestimate of HDF usage in the UK
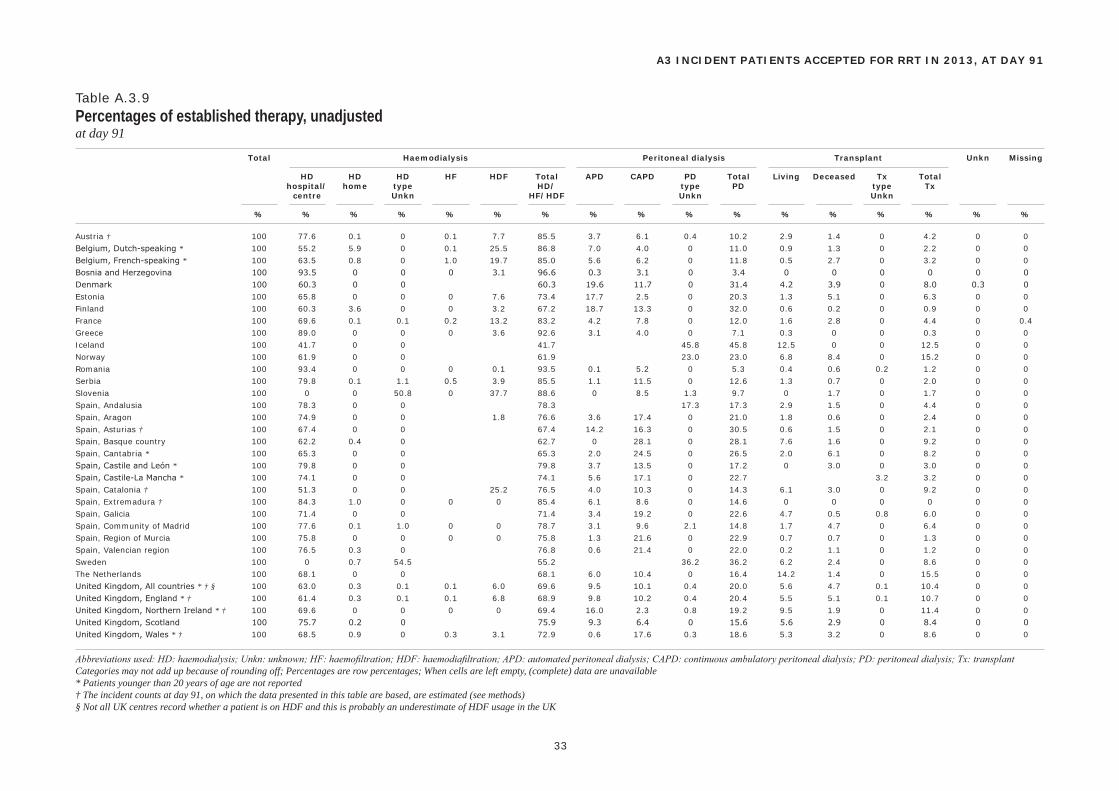
Total Haemodialysis Peritoneal dialysis Transplant Unkn Missing
HD HD HD HF HDF Total APD CAPD PD Total Living Deceased Tx Total hospital/ home type HD/ type PD type Tx centre Unkn HF/HDF Unkn Unkn
% % % % % % % % % % % % % % % % %
33
A3 INCIDENT PATIENTS ACCEPTED FOR RRT IN 2013, AT DAY 91
Table A.3.9Percentages of established therapy, unadjustedat day 91
Austria † 100 77.6 0.1 0 0.1 7.7 85.5 3.7 6.1 0.4 10.2 2.9 1.4 0 4.2 0 0
Belgium, Dutch-speaking * 100 55.2 5.9 0 0.1 25.5 86.8 7.0 4.0 0 11.0 0.9 1.3 0 2.2 0 0
Belgium, French-speaking * 100 63.5 0.8 0 1.0 19.7 85.0 5.6 6.2 0 11.8 0.5 2.7 0 3.2 0 0
Bosnia and Herzegovina 100 93.5 0 0 0 3.1 96.6 0.3 3.1 0 3.4 0 0 0 0 0 0
Denmark 100 60.3 0 0 60.3 19.6 11.7 0 31.4 4.2 3.9 0 8.0 0.3 0
Estonia 100 65.8 0 0 0 7.6 73.4 17.7 2.5 0 20.3 1.3 5.1 0 6.3 0 0
Finland 100 60.3 3.6 0 0 3.2 67.2 18.7 13.3 0 32.0 0.6 0.2 0 0.9 0 0
France 100 69.6 0.1 0.1 0.2 13.2 83.2 4.2 7.8 0 12.0 1.6 2.8 0 4.4 0 0.4
Greece 100 89.0 0 0 0 3.6 92.6 3.1 4.0 0 7.1 0.3 0 0 0.3 0 0
Iceland 100 41.7 0 0 41.7 45.8 45.8 12.5 0 0 12.5 0 0
Norway 100 61.9 0 0 61.9 23.0 23.0 6.8 8.4 0 15.2 0 0
Romania 100 93.4 0 0 0 0.1 93.5 0.1 5.2 0 5.3 0.4 0.6 0.2 1.2 0 0
Serbia 100 79.8 0.1 1.1 0.5 3.9 85.5 1.1 11.5 0 12.6 1.3 0.7 0 2.0 0 0
Slovenia 100 0 0 50.8 0 37.7 88.6 0 8.5 1.3 9.7 0 1.7 0 1.7 0 0
Spain, Andalusia 100 78.3 0 0 78.3 17.3 17.3 2.9 1.5 0 4.4 0 0
Spain, Aragon 100 74.9 0 0 1.8 76.6 3.6 17.4 0 21.0 1.8 0.6 0 2.4 0 0
Spain, Asturias † 100 67.4 0 0 67.4 14.2 16.3 0 30.5 0.6 1.5 0 2.1 0 0
Spain, Basque country 100 62.2 0.4 0 62.7 0 28.1 0 28.1 7.6 1.6 0 9.2 0 0
Spain, Cantabria * 100 65.3 0 0 65.3 2.0 24.5 0 26.5 2.0 6.1 0 8.2 0 0
Spain, Castile and León * 100 79.8 0 0 79.8 3.7 13.5 0 17.2 0 3.0 0 3.0 0 0
Spain, Castile-La Mancha * 100 74.1 0 0 74.1 5.6 17.1 0 22.7 3.2 3.2 0 0
Spain, Catalonia † 100 51.3 0 0 25.2 76.5 4.0 10.3 0 14.3 6.1 3.0 0 9.2 0 0
Spain, Extremadura † 100 84.3 1.0 0 0 0 85.4 6.1 8.6 0 14.6 0 0 0 0 0 0
Spain, Galicia 100 71.4 0 0 71.4 3.4 19.2 0 22.6 4.7 0.5 0.8 6.0 0 0
Spain, Community of Madrid 100 77.6 0.1 1.0 0 0 78.7 3.1 9.6 2.1 14.8 1.7 4.7 0 6.4 0 0
Spain, Region of Murcia 100 75.8 0 0 0 0 75.8 1.3 21.6 0 22.9 0.7 0.7 0 1.3 0 0
Spain, Valencian region 100 76.5 0.3 0 76.8 0.6 21.4 0 22.0 0.2 1.1 0 1.2 0 0
Sweden 100 0 0.7 54.5 55.2 36.2 36.2 6.2 2.4 0 8.6 0 0
The Netherlands 100 68.1 0 0 68.1 6.0 10.4 0 16.4 14.2 1.4 0 15.5 0 0
United Kingdom, All countries * † § 100 63.0 0.3 0.1 0.1 6.0 69.6 9.5 10.1 0.4 20.0 5.6 4.7 0.1 10.4 0 0
United Kingdom, England * † 100 61.4 0.3 0.1 0.1 6.8 68.9 9.8 10.2 0.4 20.4 5.5 5.1 0.1 10.7 0 0
United Kingdom, Northern Ireland * † 100 69.6 0 0 0 0 69.4 16.0 2.3 0.8 19.2 9.5 1.9 0 11.4 0 0
United Kingdom, Scotland 100 75.7 0.2 0 75.9 9.3 6.4 0 15.6 5.6 2.9 0 8.4 0 0
United Kingdom, Wales * † 100 68.5 0.9 0 0.3 3.1 72.9 0.6 17.6 0.3 18.6 5.3 3.2 0 8.6 0 0
Abbreviations used: HD: haemodialysis; Unkn: unknown; HF: haemofiltration; HDF: haemodiafiltration; APD: automated peritoneal dialysis; CAPD: continuous ambulatory peritoneal dialysis; PD: peritoneal dialysis; Tx: transplantCategories may not add up because of rounding off; Percentages are row percentages; When cells are left empty, (complete) data are unavailable* Patients younger than 20 years of age are not reported† The incident counts at day 91, on which the data presented in this table are based, are estimated (see methods)§ Not all UK centres record whether a patient is on HDF and this is probably an underestimate of HDF usage in the UK
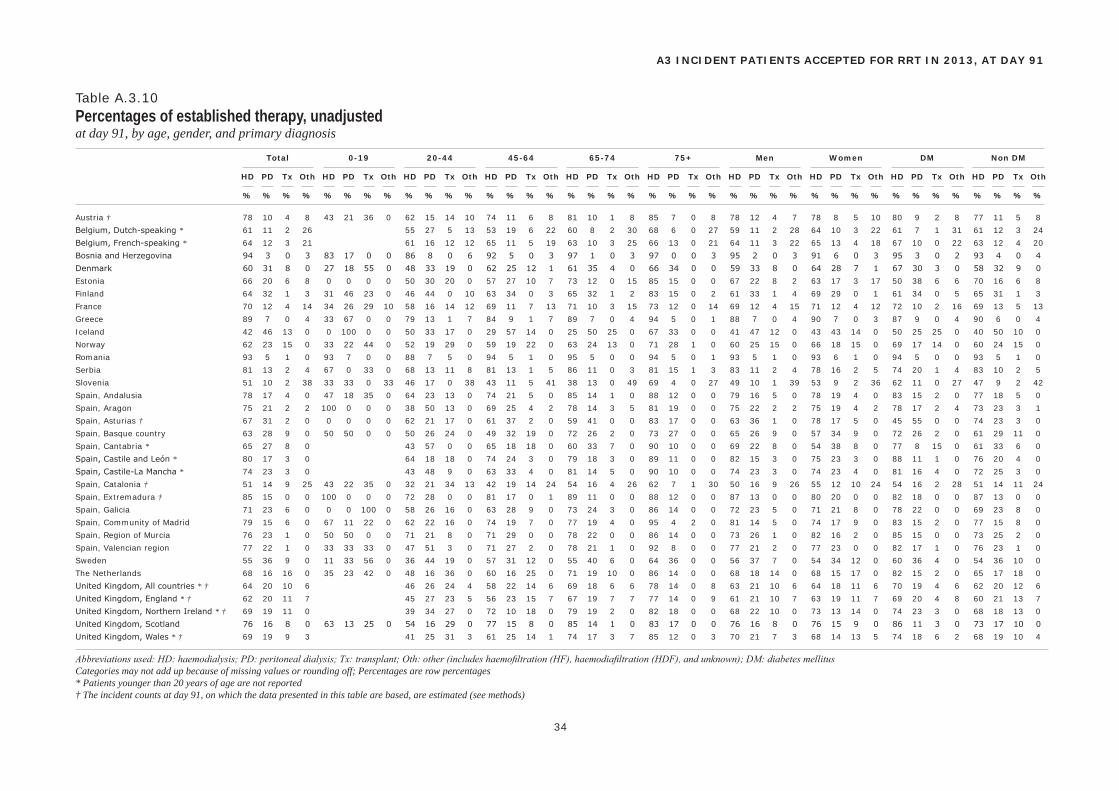
Total 0-19 20-44 45-64 65-74 75+ Men Women DM Non DM
HD PD Tx Oth HD PD Tx Oth HD PD Tx Oth HD PD Tx Oth HD PD Tx Oth HD PD Tx Oth HD PD Tx Oth HD PD Tx Oth HD PD Tx Oth HD PD Tx Oth
% % % % % % % % % % % % % % % % % % % % % % % % % % % % % % % % % % % % % % % %
34
A3 INCIDENT PATIENTS ACCEPTED FOR RRT IN 2013, AT DAY 91
Table A.3.10Percentages of established therapy, unadjustedat day 91, by age, gender, and primary diagnosis
Austria † 78 10 4 8 43 21 36 0 62 15 14 10 74 11 6 8 81 10 1 8 85 7 0 8 78 12 4 7 78 8 5 10 80 9 2 8 77 11 5 8
Belgium, Dutch-speaking * 61 11 2 26 55 27 5 13 53 19 6 22 60 8 2 30 68 6 0 27 59 11 2 28 64 10 3 22 61 7 1 31 61 12 3 24
Belgium, French-speaking * 64 12 3 21 61 16 12 12 65 11 5 19 63 10 3 25 66 13 0 21 64 11 3 22 65 13 4 18 67 10 0 22 63 12 4 20
Bosnia and Herzegovina 94 3 0 3 83 17 0 0 86 8 0 6 92 5 0 3 97 1 0 3 97 0 0 3 95 2 0 3 91 6 0 3 95 3 0 2 93 4 0 4
Denmark 60 31 8 0 27 18 55 0 48 33 19 0 62 25 12 1 61 35 4 0 66 34 0 0 59 33 8 0 64 28 7 1 67 30 3 0 58 32 9 0
Estonia 66 20 6 8 0 0 0 0 50 30 20 0 57 27 10 7 73 12 0 15 85 15 0 0 67 22 8 2 63 17 3 17 50 38 6 6 70 16 6 8
Finland 64 32 1 3 31 46 23 0 46 44 0 10 63 34 0 3 65 32 1 2 83 15 0 2 61 33 1 4 69 29 0 1 61 34 0 5 65 31 1 3
France 70 12 4 14 34 26 29 10 58 16 14 12 69 11 7 13 71 10 3 15 73 12 0 14 69 12 4 15 71 12 4 12 72 10 2 16 69 13 5 13
Greece 89 7 0 4 33 67 0 0 79 13 1 7 84 9 1 7 89 7 0 4 94 5 0 1 88 7 0 4 90 7 0 3 87 9 0 4 90 6 0 4
Iceland 42 46 13 0 0 100 0 0 50 33 17 0 29 57 14 0 25 50 25 0 67 33 0 0 41 47 12 0 43 43 14 0 50 25 25 0 40 50 10 0
Norway 62 23 15 0 33 22 44 0 52 19 29 0 59 19 22 0 63 24 13 0 71 28 1 0 60 25 15 0 66 18 15 0 69 17 14 0 60 24 15 0
Romania 93 5 1 0 93 7 0 0 88 7 5 0 94 5 1 0 95 5 0 0 94 5 0 1 93 5 1 0 93 6 1 0 94 5 0 0 93 5 1 0
Serbia 81 13 2 4 67 0 33 0 68 13 11 8 81 13 1 5 86 11 0 3 81 15 1 3 83 11 2 4 78 16 2 5 74 20 1 4 83 10 2 5
Slovenia 51 10 2 38 33 33 0 33 46 17 0 38 43 11 5 41 38 13 0 49 69 4 0 27 49 10 1 39 53 9 2 36 62 11 0 27 47 9 2 42
Spain, Andalusia 78 17 4 0 47 18 35 0 64 23 13 0 74 21 5 0 85 14 1 0 88 12 0 0 79 16 5 0 78 19 4 0 83 15 2 0 77 18 5 0
Spain, Aragon 75 21 2 2 100 0 0 0 38 50 13 0 69 25 4 2 78 14 3 5 81 19 0 0 75 22 2 2 75 19 4 2 78 17 2 4 73 23 3 1
Spain, Asturias † 67 31 2 0 0 0 0 0 62 21 17 0 61 37 2 0 59 41 0 0 83 17 0 0 63 36 1 0 78 17 5 0 45 55 0 0 74 23 3 0
Spain, Basque country 63 28 9 0 50 50 0 0 50 26 24 0 49 32 19 0 72 26 2 0 73 27 0 0 65 26 9 0 57 34 9 0 72 26 2 0 61 29 11 0
Spain, Cantabria * 65 27 8 0 43 57 0 0 65 18 18 0 60 33 7 0 90 10 0 0 69 22 8 0 54 38 8 0 77 8 15 0 61 33 6 0
Spain, Castile and León * 80 17 3 0 64 18 18 0 74 24 3 0 79 18 3 0 89 11 0 0 82 15 3 0 75 23 3 0 88 11 1 0 76 20 4 0
Spain, Castile-La Mancha * 74 23 3 0 43 48 9 0 63 33 4 0 81 14 5 0 90 10 0 0 74 23 3 0 74 23 4 0 81 16 4 0 72 25 3 0
Spain, Catalonia † 51 14 9 25 43 22 35 0 32 21 34 13 42 19 14 24 54 16 4 26 62 7 1 30 50 16 9 26 55 12 10 24 54 16 2 28 51 14 11 24
Spain, Extremadura † 85 15 0 0 100 0 0 0 72 28 0 0 81 17 0 1 89 11 0 0 88 12 0 0 87 13 0 0 80 20 0 0 82 18 0 0 87 13 0 0
Spain, Galicia 71 23 6 0 0 0 100 0 58 26 16 0 63 28 9 0 73 24 3 0 86 14 0 0 72 23 5 0 71 21 8 0 78 22 0 0 69 23 8 0
Spain, Community of Madrid 79 15 6 0 67 11 22 0 62 22 16 0 74 19 7 0 77 19 4 0 95 4 2 0 81 14 5 0 74 17 9 0 83 15 2 0 77 15 8 0
Spain, Region of Murcia 76 23 1 0 50 50 0 0 71 21 8 0 71 29 0 0 78 22 0 0 86 14 0 0 73 26 1 0 82 16 2 0 85 15 0 0 73 25 2 0
Spain, Valencian region 77 22 1 0 33 33 33 0 47 51 3 0 71 27 2 0 78 21 1 0 92 8 0 0 77 21 2 0 77 23 0 0 82 17 1 0 76 23 1 0
Sweden 55 36 9 0 11 33 56 0 36 44 19 0 57 31 12 0 55 40 6 0 64 36 0 0 56 37 7 0 54 34 12 0 60 36 4 0 54 36 10 0
The Netherlands 68 16 16 0 35 23 42 0 48 16 36 0 60 16 25 0 71 19 10 0 86 14 0 0 68 18 14 0 68 15 17 0 82 15 2 0 65 17 18 0
United Kingdom, All countries * † 64 20 10 6 46 26 24 4 58 22 14 6 69 18 6 6 78 14 0 8 63 21 10 6 64 18 11 6 70 19 4 6 62 20 12 6
United Kingdom, England * † 62 20 11 7 45 27 23 5 56 23 15 7 67 19 7 7 77 14 0 9 61 21 10 7 63 19 11 7 69 20 4 8 60 21 13 7
United Kingdom, Northern Ireland * † 69 19 11 0 39 34 27 0 72 10 18 0 79 19 2 0 82 18 0 0 68 22 10 0 73 13 14 0 74 23 3 0 68 18 13 0
United Kingdom, Scotland 76 16 8 0 63 13 25 0 54 16 29 0 77 15 8 0 85 14 1 0 83 17 0 0 76 16 8 0 76 15 9 0 86 11 3 0 73 17 10 0
United Kingdom, Wales * † 69 19 9 3 41 25 31 3 61 25 14 1 74 17 3 7 85 12 0 3 70 21 7 3 68 14 13 5 74 18 6 2 68 19 10 4
Abbreviations used: HD: haemodialysis; PD: peritoneal dialysis; Tx: transplant; Oth: other (includes haemofiltration (HF), haemodiafiltration (HDF), and unknown); DM: diabetes mellitusCategories may not add up because of missing values or rounding off; Percentages are row percentages* Patients younger than 20 years of age are not reported† The incident counts at day 91, on which the data presented in this table are based, are estimated (see methods)
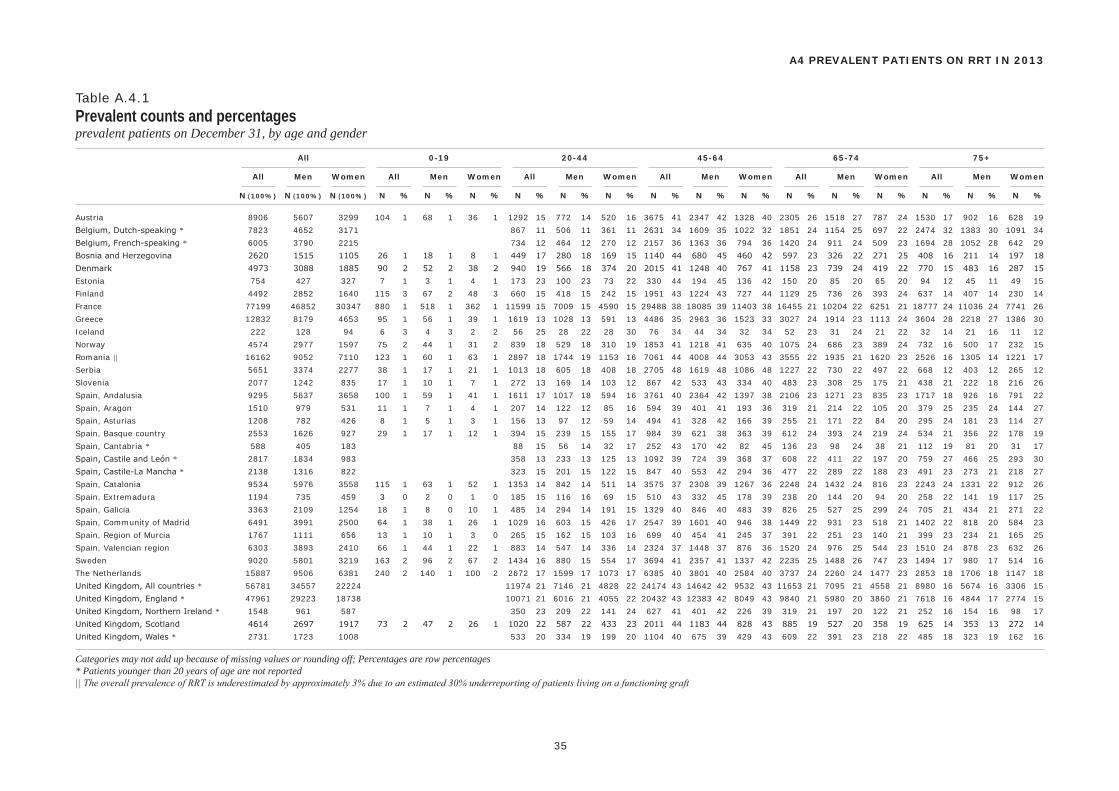
All 0-19 20-44 45-64 65-74 75+
All Men Women All Men Women All Men Women All Men Women All Men Women All Men Women
N (100%) N (100%) N (100%) N % N % N % N % N % N % N % N % N % N % N % N % N % N % N %
35
A4 PREVALENT PATIENTS ON RRT IN 2013
Table A.4.1Prevalent counts and percentagesprevalent patients on December 31, by age and gender
Austria 8906 5607 3299 104 1 68 1 36 1 1292 15 772 14 520 16 3675 41 2347 42 1328 40 2305 26 1518 27 787 24 1530 17 902 16 628 19
Belgium, Dutch-speaking * 7823 4652 3171 867 11 506 11 361 11 2631 34 1609 35 1022 32 1851 24 1154 25 697 22 2474 32 1383 30 1091 34
Belgium, French-speaking * 6005 3790 2215 734 12 464 12 270 12 2157 36 1363 36 794 36 1420 24 911 24 509 23 1694 28 1052 28 642 29
Bosnia and Herzegovina 2620 1515 1105 26 1 18 1 8 1 449 17 280 18 169 15 1140 44 680 45 460 42 597 23 326 22 271 25 408 16 211 14 197 18
Denmark 4973 3088 1885 90 2 52 2 38 2 940 19 566 18 374 20 2015 41 1248 40 767 41 1158 23 739 24 419 22 770 15 483 16 287 15
Estonia 754 427 327 7 1 3 1 4 1 173 23 100 23 73 22 330 44 194 45 136 42 150 20 85 20 65 20 94 12 45 11 49 15
Finland 4492 2852 1640 115 3 67 2 48 3 660 15 418 15 242 15 1951 43 1224 43 727 44 1129 25 736 26 393 24 637 14 407 14 230 14
France 77199 46852 30347 880 1 518 1 362 1 11599 15 7009 15 4590 15 29488 38 18085 39 11403 38 16455 21 10204 22 6251 21 18777 24 11036 24 7741 26
Greece 12832 8179 4653 95 1 56 1 39 1 1619 13 1028 13 591 13 4486 35 2963 36 1523 33 3027 24 1914 23 1113 24 3604 28 2218 27 1386 30
Iceland 222 128 94 6 3 4 3 2 2 56 25 28 22 28 30 76 34 44 34 32 34 52 23 31 24 21 22 32 14 21 16 11 12
Norway 4574 2977 1597 75 2 44 1 31 2 839 18 529 18 310 19 1853 41 1218 41 635 40 1075 24 686 23 389 24 732 16 500 17 232 15
Romania || 16162 9052 7110 123 1 60 1 63 1 2897 18 1744 19 1153 16 7061 44 4008 44 3053 43 3555 22 1935 21 1620 23 2526 16 1305 14 1221 17
Serbia 5651 3374 2277 38 1 17 1 21 1 1013 18 605 18 408 18 2705 48 1619 48 1086 48 1227 22 730 22 497 22 668 12 403 12 265 12
Slovenia 2077 1242 835 17 1 10 1 7 1 272 13 169 14 103 12 867 42 533 43 334 40 483 23 308 25 175 21 438 21 222 18 216 26
Spain, Andalusia 9295 5637 3658 100 1 59 1 41 1 1611 17 1017 18 594 16 3761 40 2364 42 1397 38 2106 23 1271 23 835 23 1717 18 926 16 791 22
Spain, Aragon 1510 979 531 11 1 7 1 4 1 207 14 122 12 85 16 594 39 401 41 193 36 319 21 214 22 105 20 379 25 235 24 144 27
Spain, Asturias 1208 782 426 8 1 5 1 3 1 156 13 97 12 59 14 494 41 328 42 166 39 255 21 171 22 84 20 295 24 181 23 114 27
Spain, Basque country 2553 1626 927 29 1 17 1 12 1 394 15 239 15 155 17 984 39 621 38 363 39 612 24 393 24 219 24 534 21 356 22 178 19
Spain, Cantabria * 588 405 183 88 15 56 14 32 17 252 43 170 42 82 45 136 23 98 24 38 21 112 19 81 20 31 17
Spain, Castile and León * 2817 1834 983 358 13 233 13 125 13 1092 39 724 39 368 37 608 22 411 22 197 20 759 27 466 25 293 30
Spain, Castile-La Mancha * 2138 1316 822 323 15 201 15 122 15 847 40 553 42 294 36 477 22 289 22 188 23 491 23 273 21 218 27
Spain, Catalonia 9534 5976 3558 115 1 63 1 52 1 1353 14 842 14 511 14 3575 37 2308 39 1267 36 2248 24 1432 24 816 23 2243 24 1331 22 912 26
Spain, Extremadura 1194 735 459 3 0 2 0 1 0 185 15 116 16 69 15 510 43 332 45 178 39 238 20 144 20 94 20 258 22 141 19 117 25
Spain, Galicia 3363 2109 1254 18 1 8 0 10 1 485 14 294 14 191 15 1329 40 846 40 483 39 826 25 527 25 299 24 705 21 434 21 271 22
Spain, Community of Madrid 6491 3991 2500 64 1 38 1 26 1 1029 16 603 15 426 17 2547 39 1601 40 946 38 1449 22 931 23 518 21 1402 22 818 20 584 23
Spain, Region of Murcia 1767 1111 656 13 1 10 1 3 0 265 15 162 15 103 16 699 40 454 41 245 37 391 22 251 23 140 21 399 23 234 21 165 25
Spain, Valencian region 6303 3893 2410 66 1 44 1 22 1 883 14 547 14 336 14 2324 37 1448 37 876 36 1520 24 976 25 544 23 1510 24 878 23 632 26
Sweden 9020 5801 3219 163 2 96 2 67 2 1434 16 880 15 554 17 3694 41 2357 41 1337 42 2235 25 1488 26 747 23 1494 17 980 17 514 16
The Netherlands 15887 9506 6381 240 2 140 1 100 2 2672 17 1599 17 1073 17 6385 40 3801 40 2584 40 3737 24 2260 24 1477 23 2853 18 1706 18 1147 18
United Kingdom, All countries * 56781 34557 22224 11974 21 7146 21 4828 22 24174 43 14642 42 9532 43 11653 21 7095 21 4558 21 8980 16 5674 16 3306 15
United Kingdom, England * 47961 29223 18738 10071 21 6016 21 4055 22 20432 43 12383 42 8049 43 9840 21 5980 20 3860 21 7618 16 4844 17 2774 15
United Kingdom, Northern Ireland * 1548 961 587 350 23 209 22 141 24 627 41 401 42 226 39 319 21 197 20 122 21 252 16 154 16 98 17
United Kingdom, Scotland 4614 2697 1917 73 2 47 2 26 1 1020 22 587 22 433 23 2011 44 1183 44 828 43 885 19 527 20 358 19 625 14 353 13 272 14
United Kingdom, Wales * 2731 1723 1008 533 20 334 19 199 20 1104 40 675 39 429 43 609 22 391 23 218 22 485 18 323 19 162 16
Categories may not add up because of missing values or rounding off; Percentages are row percentages* Patients younger than 20 years of age are not reported|| The overall prevalence of RRT is underestimated by approximately 3% due to an estimated 30% underreporting of patients living on a functioning graft
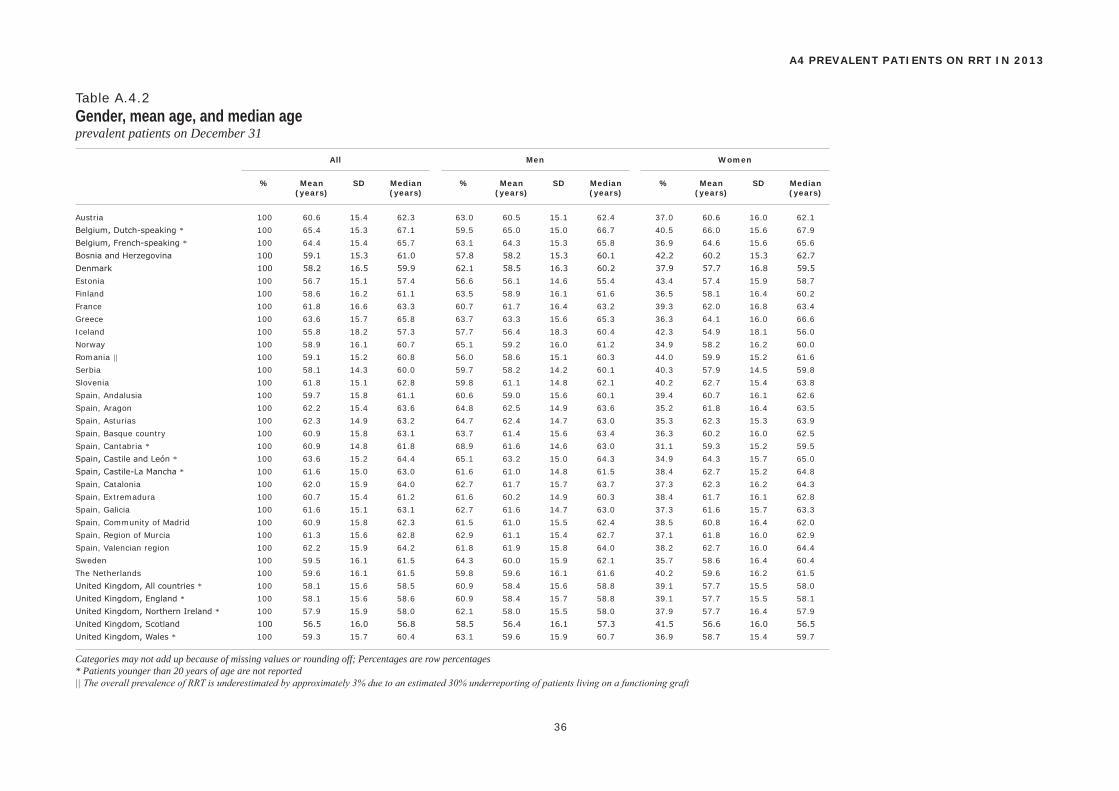
All Men Women
% Mean SD Median % Mean SD Median % Mean SD Median (years) (years) (years) (years) (years) (years)
36
A4 PREVALENT PATIENTS ON RRT IN 2013
Table A.4.2Gender, mean age, and median ageprevalent patients on December 31
Austria 100 60.6 15.4 62.3 63.0 60.5 15.1 62.4 37.0 60.6 16.0 62.1
Belgium, Dutch-speaking * 100 65.4 15.3 67.1 59.5 65.0 15.0 66.7 40.5 66.0 15.6 67.9
Belgium, French-speaking * 100 64.4 15.4 65.7 63.1 64.3 15.3 65.8 36.9 64.6 15.6 65.6
Bosnia and Herzegovina 100 59.1 15.3 61.0 57.8 58.2 15.3 60.1 42.2 60.2 15.3 62.7
Denmark 100 58.2 16.5 59.9 62.1 58.5 16.3 60.2 37.9 57.7 16.8 59.5
Estonia 100 56.7 15.1 57.4 56.6 56.1 14.6 55.4 43.4 57.4 15.9 58.7
Finland 100 58.6 16.2 61.1 63.5 58.9 16.1 61.6 36.5 58.1 16.4 60.2
France 100 61.8 16.6 63.3 60.7 61.7 16.4 63.2 39.3 62.0 16.8 63.4
Greece 100 63.6 15.7 65.8 63.7 63.3 15.6 65.3 36.3 64.1 16.0 66.6
Iceland 100 55.8 18.2 57.3 57.7 56.4 18.3 60.4 42.3 54.9 18.1 56.0
Norway 100 58.9 16.1 60.7 65.1 59.2 16.0 61.2 34.9 58.2 16.2 60.0
Romania || 100 59.1 15.2 60.8 56.0 58.6 15.1 60.3 44.0 59.9 15.2 61.6
Serbia 100 58.1 14.3 60.0 59.7 58.2 14.2 60.1 40.3 57.9 14.5 59.8
Slovenia 100 61.8 15.1 62.8 59.8 61.1 14.8 62.1 40.2 62.7 15.4 63.8
Spain, Andalusia 100 59.7 15.8 61.1 60.6 59.0 15.6 60.1 39.4 60.7 16.1 62.6
Spain, Aragon 100 62.2 15.4 63.6 64.8 62.5 14.9 63.6 35.2 61.8 16.4 63.5
Spain, Asturias 100 62.3 14.9 63.2 64.7 62.4 14.7 63.0 35.3 62.3 15.3 63.9
Spain, Basque country 100 60.9 15.8 63.1 63.7 61.4 15.6 63.4 36.3 60.2 16.0 62.5
Spain, Cantabria * 100 60.9 14.8 61.8 68.9 61.6 14.6 63.0 31.1 59.3 15.2 59.5
Spain, Castile and León * 100 63.6 15.2 64.4 65.1 63.2 15.0 64.3 34.9 64.3 15.7 65.0
Spain, Castile-La Mancha * 100 61.6 15.0 63.0 61.6 61.0 14.8 61.5 38.4 62.7 15.2 64.8
Spain, Catalonia 100 62.0 15.9 64.0 62.7 61.7 15.7 63.7 37.3 62.3 16.2 64.3
Spain, Extremadura 100 60.7 15.4 61.2 61.6 60.2 14.9 60.3 38.4 61.7 16.1 62.8
Spain, Galicia 100 61.6 15.1 63.1 62.7 61.6 14.7 63.0 37.3 61.6 15.7 63.3
Spain, Community of Madrid 100 60.9 15.8 62.3 61.5 61.0 15.5 62.4 38.5 60.8 16.4 62.0
Spain, Region of Murcia 100 61.3 15.6 62.8 62.9 61.1 15.4 62.7 37.1 61.8 16.0 62.9
Spain, Valencian region 100 62.2 15.9 64.2 61.8 61.9 15.8 64.0 38.2 62.7 16.0 64.4
Sweden 100 59.5 16.1 61.5 64.3 60.0 15.9 62.1 35.7 58.6 16.4 60.4
The Netherlands 100 59.6 16.1 61.5 59.8 59.6 16.1 61.6 40.2 59.6 16.2 61.5
United Kingdom, All countries * 100 58.1 15.6 58.5 60.9 58.4 15.6 58.8 39.1 57.7 15.5 58.0
United Kingdom, England * 100 58.1 15.6 58.6 60.9 58.4 15.7 58.8 39.1 57.7 15.5 58.1
United Kingdom, Northern Ireland * 100 57.9 15.9 58.0 62.1 58.0 15.5 58.0 37.9 57.7 16.4 57.9
United Kingdom, Scotland 100 56.5 16.0 56.8 58.5 56.4 16.1 57.3 41.5 56.6 16.0 56.5
United Kingdom, Wales * 100 59.3 15.7 60.4 63.1 59.6 15.9 60.7 36.9 58.7 15.4 59.7
Categories may not add up because of missing values or rounding off; Percentages are row percentages* Patients younger than 20 years of age are not reported|| The overall prevalence of RRT is underestimated by approximately 3% due to an estimated 30% underreporting of patients living on a functioning graft
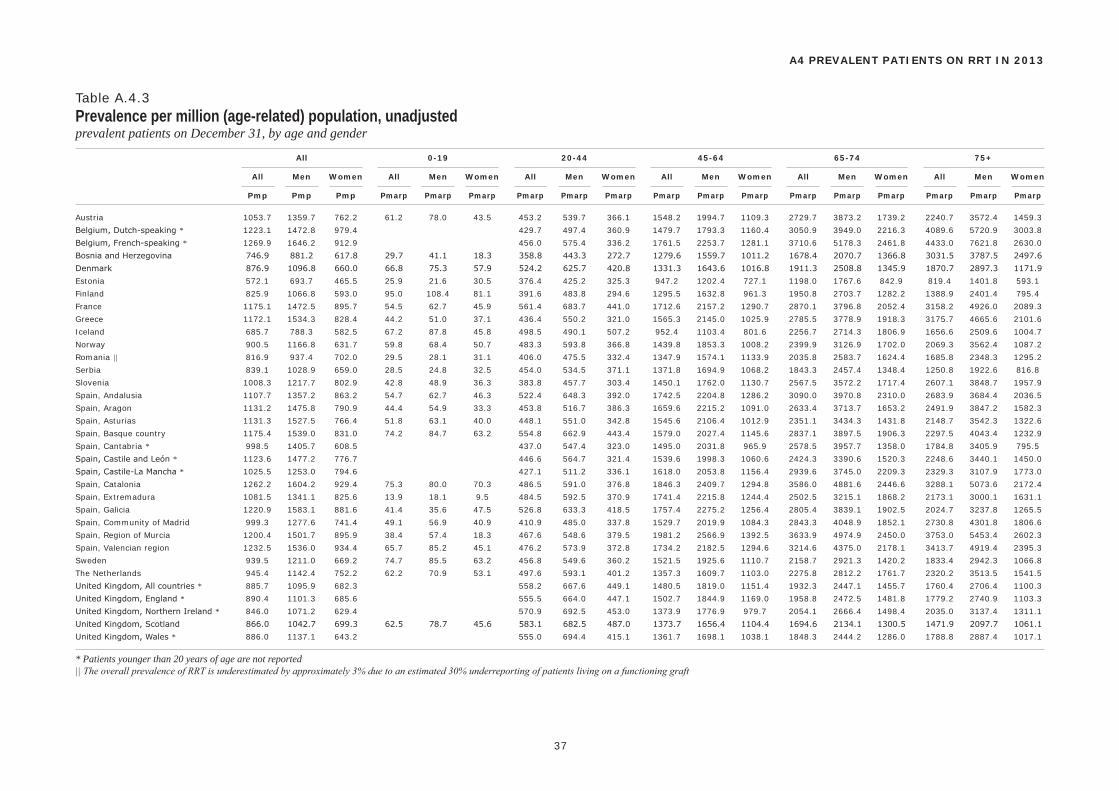
All 0-19 20-44 45-64 65-74 75+
All Men Women All Men Women All Men Women All Men Women All Men Women All Men Women
Pmp Pmp Pmp Pmarp Pmarp Pmarp Pmarp Pmarp Pmarp Pmarp Pmarp Pmarp Pmarp Pmarp Pmarp Pmarp Pmarp Pmarp
37
A4 PREVALENT PATIENTS ON RRT IN 2013
Table A.4.3Prevalence per million (age-related) population, unadjustedprevalent patients on December 31, by age and gender
Austria 1053.7 1359.7 762.2 61.2 78.0 43.5 453.2 539.7 366.1 1548.2 1994.7 1109.3 2729.7 3873.2 1739.2 2240.7 3572.4 1459.3
Belgium, Dutch-speaking * 1223.1 1472.8 979.4 429.7 497.4 360.9 1479.7 1793.3 1160.4 3050.9 3949.0 2216.3 4089.6 5720.9 3003.8
Belgium, French-speaking * 1269.9 1646.2 912.9 456.0 575.4 336.2 1761.5 2253.7 1281.1 3710.6 5178.3 2461.8 4433.0 7621.8 2630.0
Bosnia and Herzegovina 746.9 881.2 617.8 29.7 41.1 18.3 358.8 443.3 272.7 1279.6 1559.7 1011.2 1678.4 2070.7 1366.8 3031.5 3787.5 2497.6
Denmark 876.9 1096.8 660.0 66.8 75.3 57.9 524.2 625.7 420.8 1331.3 1643.6 1016.8 1911.3 2508.8 1345.9 1870.7 2897.3 1171.9
Estonia 572.1 693.7 465.5 25.9 21.6 30.5 376.4 425.2 325.3 947.2 1202.4 727.1 1198.0 1767.6 842.9 819.4 1401.8 593.1
Finland 825.9 1066.8 593.0 95.0 108.4 81.1 391.6 483.8 294.6 1295.5 1632.8 961.3 1950.8 2703.7 1282.2 1388.9 2401.4 795.4
France 1175.1 1472.5 895.7 54.5 62.7 45.9 561.4 683.7 441.0 1712.6 2157.2 1290.7 2870.1 3796.8 2052.4 3158.2 4926.0 2089.3
Greece 1172.1 1534.3 828.4 44.2 51.0 37.1 436.4 550.2 321.0 1565.3 2145.0 1025.9 2785.5 3778.9 1918.3 3175.7 4665.6 2101.6
Iceland 685.7 788.3 582.5 67.2 87.8 45.8 498.5 490.1 507.2 952.4 1103.4 801.6 2256.7 2714.3 1806.9 1656.6 2509.6 1004.7
Norway 900.5 1166.8 631.7 59.8 68.4 50.7 483.3 593.8 366.8 1439.8 1853.3 1008.2 2399.9 3126.9 1702.0 2069.3 3562.4 1087.2
Romania || 816.9 937.4 702.0 29.5 28.1 31.1 406.0 475.5 332.4 1347.9 1574.1 1133.9 2035.8 2583.7 1624.4 1685.8 2348.3 1295.2
Serbia 839.1 1028.9 659.0 28.5 24.8 32.5 454.0 534.5 371.1 1371.8 1694.9 1068.2 1843.3 2457.4 1348.4 1250.8 1922.6 816.8
Slovenia 1008.3 1217.7 802.9 42.8 48.9 36.3 383.8 457.7 303.4 1450.1 1762.0 1130.7 2567.5 3572.2 1717.4 2607.1 3848.7 1957.9
Spain, Andalusia 1107.7 1357.2 863.2 54.7 62.7 46.3 522.4 648.3 392.0 1742.5 2204.8 1286.2 3090.0 3970.8 2310.0 2683.9 3684.4 2036.5
Spain, Aragon 1131.2 1475.8 790.9 44.4 54.9 33.3 453.8 516.7 386.3 1659.6 2215.2 1091.0 2633.4 3713.7 1653.2 2491.9 3847.2 1582.3
Spain, Asturias 1131.3 1527.5 766.4 51.8 63.1 40.0 448.1 551.0 342.8 1545.6 2106.4 1012.9 2351.1 3434.3 1431.8 2148.7 3542.3 1322.6
Spain, Basque country 1175.4 1539.0 831.0 74.2 84.7 63.2 554.8 662.9 443.4 1579.0 2027.4 1145.6 2837.1 3897.5 1906.3 2297.5 4043.4 1232.9
Spain, Cantabria * 998.5 1405.7 608.5 437.0 547.4 323.0 1495.0 2031.8 965.9 2578.5 3957.7 1358.0 1784.8 3405.9 795.5
Spain, Castile and León * 1123.6 1477.2 776.7 446.6 564.7 321.4 1539.6 1998.3 1060.6 2424.3 3390.6 1520.3 2248.6 3440.1 1450.0
Spain, Castile-La Mancha * 1025.5 1253.0 794.6 427.1 511.2 336.1 1618.0 2053.8 1156.4 2939.6 3745.0 2209.3 2329.3 3107.9 1773.0
Spain, Catalonia 1262.2 1604.2 929.4 75.3 80.0 70.3 486.5 591.0 376.8 1846.3 2409.7 1294.8 3586.0 4881.6 2446.6 3288.1 5073.6 2172.4
Spain, Extremadura 1081.5 1341.1 825.6 13.9 18.1 9.5 484.5 592.5 370.9 1741.4 2215.8 1244.4 2502.5 3215.1 1868.2 2173.1 3000.1 1631.1
Spain, Galicia 1220.9 1583.1 881.6 41.4 35.6 47.5 526.8 633.3 418.5 1757.4 2275.2 1256.4 2805.4 3839.1 1902.5 2024.7 3237.8 1265.5
Spain, Community of Madrid 999.3 1277.6 741.4 49.1 56.9 40.9 410.9 485.0 337.8 1529.7 2019.9 1084.3 2843.3 4048.9 1852.1 2730.8 4301.8 1806.6
Spain, Region of Murcia 1200.4 1501.7 895.9 38.4 57.4 18.3 467.6 548.6 379.5 1981.2 2566.9 1392.5 3633.9 4974.9 2450.0 3753.0 5453.4 2602.3
Spain, Valencian region 1232.5 1536.0 934.4 65.7 85.2 45.1 476.2 573.9 372.8 1734.2 2182.5 1294.6 3214.6 4375.0 2178.1 3413.7 4919.4 2395.3
Sweden 939.5 1211.0 669.2 74.7 85.5 63.2 456.8 549.6 360.2 1521.5 1925.6 1110.7 2158.7 2921.3 1420.2 1833.4 2942.3 1066.8
The Netherlands 945.4 1142.4 752.2 62.2 70.9 53.1 497.6 593.1 401.2 1357.3 1609.7 1103.0 2275.8 2812.2 1761.7 2320.2 3513.5 1541.5
United Kingdom, All countries * 885.7 1095.9 682.3 558.2 667.6 449.1 1480.5 1819.0 1151.4 1932.3 2447.1 1455.7 1760.4 2706.4 1100.3
United Kingdom, England * 890.4 1101.3 685.6 555.5 664.0 447.1 1502.7 1844.9 1169.0 1958.8 2472.5 1481.8 1779.2 2740.9 1103.3
United Kingdom, Northern Ireland * 846.0 1071.2 629.4 570.9 692.5 453.0 1373.9 1776.9 979.7 2054.1 2666.4 1498.4 2035.0 3137.4 1311.1
United Kingdom, Scotland 866.0 1042.7 699.3 62.5 78.7 45.6 583.1 682.5 487.0 1373.7 1656.4 1104.4 1694.6 2134.1 1300.5 1471.9 2097.7 1061.1
United Kingdom, Wales * 886.0 1137.1 643.2 555.0 694.4 415.1 1361.7 1698.1 1038.1 1848.3 2444.2 1286.0 1788.8 2887.4 1017.1
* Patients younger than 20 years of age are not reported|| The overall prevalence of RRT is underestimated by approximately 3% due to an estimated 30% underreporting of patients living on a functioning graft
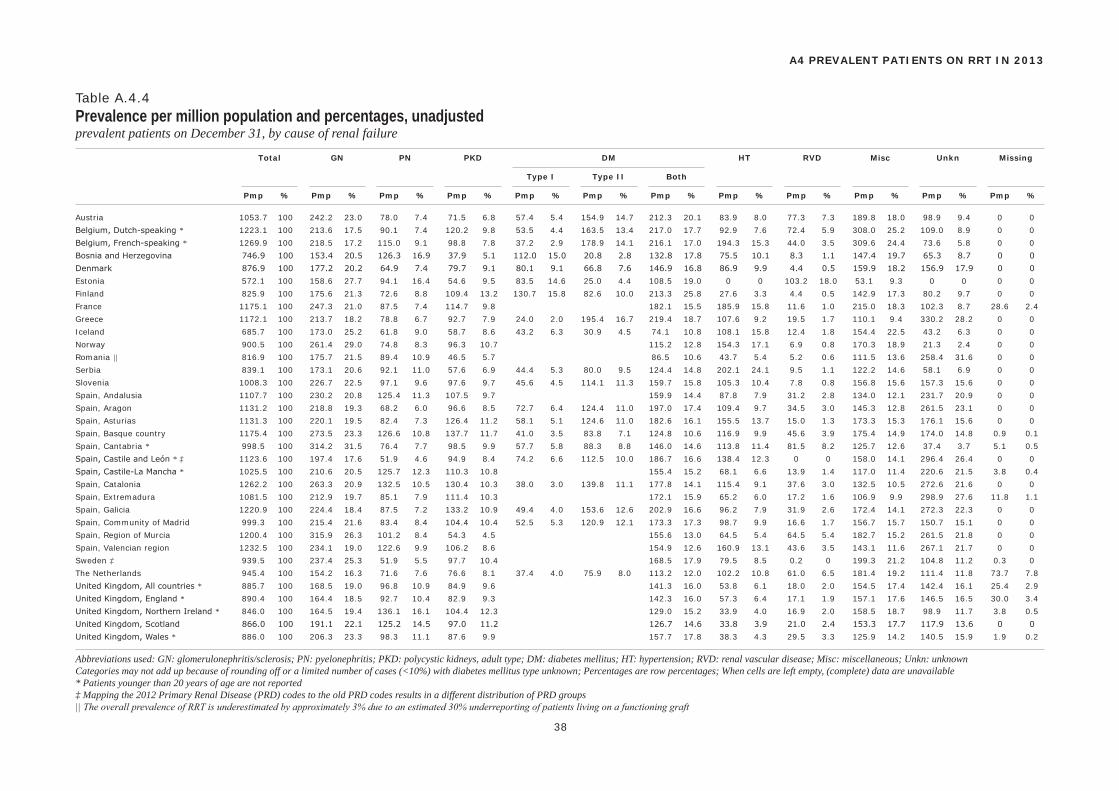
Total GN PN PKD DM HT RVD Misc Unkn Missing
Type I Type II Both
Pmp % Pmp % Pmp % Pmp % Pmp % Pmp % Pmp % Pmp % Pmp % Pmp % Pmp % Pmp %
38
A4 PREVALENT PATIENTS ON RRT IN 2013
Table A.4.4Prevalence per million population and percentages, unadjustedprevalent patients on December 31, by cause of renal failure
Austria 1053.7 100 242.2 23.0 78.0 7.4 71.5 6.8 57.4 5.4 154.9 14.7 212.3 20.1 83.9 8.0 77.3 7.3 189.8 18.0 98.9 9.4 0 0
Belgium, Dutch-speaking * 1223.1 100 213.6 17.5 90.1 7.4 120.2 9.8 53.5 4.4 163.5 13.4 217.0 17.7 92.9 7.6 72.4 5.9 308.0 25.2 109.0 8.9 0 0
Belgium, French-speaking * 1269.9 100 218.5 17.2 115.0 9.1 98.8 7.8 37.2 2.9 178.9 14.1 216.1 17.0 194.3 15.3 44.0 3.5 309.6 24.4 73.6 5.8 0 0
Bosnia and Herzegovina 746.9 100 153.4 20.5 126.3 16.9 37.9 5.1 112.0 15.0 20.8 2.8 132.8 17.8 75.5 10.1 8.3 1.1 147.4 19.7 65.3 8.7 0 0
Denmark 876.9 100 177.2 20.2 64.9 7.4 79.7 9.1 80.1 9.1 66.8 7.6 146.9 16.8 86.9 9.9 4.4 0.5 159.9 18.2 156.9 17.9 0 0
Estonia 572.1 100 158.6 27.7 94.1 16.4 54.6 9.5 83.5 14.6 25.0 4.4 108.5 19.0 0 0 103.2 18.0 53.1 9.3 0 0 0 0
Finland 825.9 100 175.6 21.3 72.6 8.8 109.4 13.2 130.7 15.8 82.6 10.0 213.3 25.8 27.6 3.3 4.4 0.5 142.9 17.3 80.2 9.7 0 0
France 1175.1 100 247.3 21.0 87.5 7.4 114.7 9.8 182.1 15.5 185.9 15.8 11.6 1.0 215.0 18.3 102.3 8.7 28.6 2.4
Greece 1172.1 100 213.7 18.2 78.8 6.7 92.7 7.9 24.0 2.0 195.4 16.7 219.4 18.7 107.6 9.2 19.5 1.7 110.1 9.4 330.2 28.2 0 0
Iceland 685.7 100 173.0 25.2 61.8 9.0 58.7 8.6 43.2 6.3 30.9 4.5 74.1 10.8 108.1 15.8 12.4 1.8 154.4 22.5 43.2 6.3 0 0
Norway 900.5 100 261.4 29.0 74.8 8.3 96.3 10.7 115.2 12.8 154.3 17.1 6.9 0.8 170.3 18.9 21.3 2.4 0 0
Romania || 816.9 100 175.7 21.5 89.4 10.9 46.5 5.7 86.5 10.6 43.7 5.4 5.2 0.6 111.5 13.6 258.4 31.6 0 0
Serbia 839.1 100 173.1 20.6 92.1 11.0 57.6 6.9 44.4 5.3 80.0 9.5 124.4 14.8 202.1 24.1 9.5 1.1 122.2 14.6 58.1 6.9 0 0
Slovenia 1008.3 100 226.7 22.5 97.1 9.6 97.6 9.7 45.6 4.5 114.1 11.3 159.7 15.8 105.3 10.4 7.8 0.8 156.8 15.6 157.3 15.6 0 0
Spain, Andalusia 1107.7 100 230.2 20.8 125.4 11.3 107.5 9.7 159.9 14.4 87.8 7.9 31.2 2.8 134.0 12.1 231.7 20.9 0 0
Spain, Aragon 1131.2 100 218.8 19.3 68.2 6.0 96.6 8.5 72.7 6.4 124.4 11.0 197.0 17.4 109.4 9.7 34.5 3.0 145.3 12.8 261.5 23.1 0 0
Spain, Asturias 1131.3 100 220.1 19.5 82.4 7.3 126.4 11.2 58.1 5.1 124.6 11.0 182.6 16.1 155.5 13.7 15.0 1.3 173.3 15.3 176.1 15.6 0 0
Spain, Basque country 1175.4 100 273.5 23.3 126.6 10.8 137.7 11.7 41.0 3.5 83.8 7.1 124.8 10.6 116.9 9.9 45.6 3.9 175.4 14.9 174.0 14.8 0.9 0.1
Spain, Cantabria * 998.5 100 314.2 31.5 76.4 7.7 98.5 9.9 57.7 5.8 88.3 8.8 146.0 14.6 113.8 11.4 81.5 8.2 125.7 12.6 37.4 3.7 5.1 0.5
Spain, Castile and León * ‡ 1123.6 100 197.4 17.6 51.9 4.6 94.9 8.4 74.2 6.6 112.5 10.0 186.7 16.6 138.4 12.3 0 0 158.0 14.1 296.4 26.4 0 0
Spain, Castile-La Mancha * 1025.5 100 210.6 20.5 125.7 12.3 110.3 10.8 155.4 15.2 68.1 6.6 13.9 1.4 117.0 11.4 220.6 21.5 3.8 0.4
Spain, Catalonia 1262.2 100 263.3 20.9 132.5 10.5 130.4 10.3 38.0 3.0 139.8 11.1 177.8 14.1 115.4 9.1 37.6 3.0 132.5 10.5 272.6 21.6 0 0
Spain, Extremadura 1081.5 100 212.9 19.7 85.1 7.9 111.4 10.3 172.1 15.9 65.2 6.0 17.2 1.6 106.9 9.9 298.9 27.6 11.8 1.1
Spain, Galicia 1220.9 100 224.4 18.4 87.5 7.2 133.2 10.9 49.4 4.0 153.6 12.6 202.9 16.6 96.2 7.9 31.9 2.6 172.4 14.1 272.3 22.3 0 0
Spain, Community of Madrid 999.3 100 215.4 21.6 83.4 8.4 104.4 10.4 52.5 5.3 120.9 12.1 173.3 17.3 98.7 9.9 16.6 1.7 156.7 15.7 150.7 15.1 0 0
Spain, Region of Murcia 1200.4 100 315.9 26.3 101.2 8.4 54.3 4.5 155.6 13.0 64.5 5.4 64.5 5.4 182.7 15.2 261.5 21.8 0 0
Spain, Valencian region 1232.5 100 234.1 19.0 122.6 9.9 106.2 8.6 154.9 12.6 160.9 13.1 43.6 3.5 143.1 11.6 267.1 21.7 0 0
Sweden ‡ 939.5 100 237.4 25.3 51.9 5.5 97.7 10.4 168.5 17.9 79.5 8.5 0.2 0 199.3 21.2 104.8 11.2 0.3 0
The Netherlands 945.4 100 154.2 16.3 71.6 7.6 76.6 8.1 37.4 4.0 75.9 8.0 113.2 12.0 102.2 10.8 61.0 6.5 181.4 19.2 111.4 11.8 73.7 7.8
United Kingdom, All countries * 885.7 100 168.5 19.0 96.8 10.9 84.9 9.6 141.3 16.0 53.8 6.1 18.0 2.0 154.5 17.4 142.4 16.1 25.4 2.9
United Kingdom, England * 890.4 100 164.4 18.5 92.7 10.4 82.9 9.3 142.3 16.0 57.3 6.4 17.1 1.9 157.1 17.6 146.5 16.5 30.0 3.4
United Kingdom, Northern Ireland * 846.0 100 164.5 19.4 136.1 16.1 104.4 12.3 129.0 15.2 33.9 4.0 16.9 2.0 158.5 18.7 98.9 11.7 3.8 0.5
United Kingdom, Scotland 866.0 100 191.1 22.1 125.2 14.5 97.0 11.2 126.7 14.6 33.8 3.9 21.0 2.4 153.3 17.7 117.9 13.6 0 0
United Kingdom, Wales * 886.0 100 206.3 23.3 98.3 11.1 87.6 9.9 157.7 17.8 38.3 4.3 29.5 3.3 125.9 14.2 140.5 15.9 1.9 0.2
Abbreviations used: GN: glomerulonephritis/sclerosis; PN: pyelonephritis; PKD: polycystic kidneys, adult type; DM: diabetes mellitus; HT: hypertension; RVD: renal vascular disease; Misc: miscellaneous; Unkn: unknownCategories may not add up because of rounding off or a limited number of cases (<10%) with diabetes mellitus type unknown; Percentages are row percentages; When cells are left empty, (complete) data are unavailable* Patients younger than 20 years of age are not reported‡ Mapping the 2012 Primary Renal Disease (PRD) codes to the old PRD codes results in a different distribution of PRD groups|| The overall prevalence of RRT is underestimated by approximately 3% due to an estimated 30% underreporting of patients living on a functioning graft
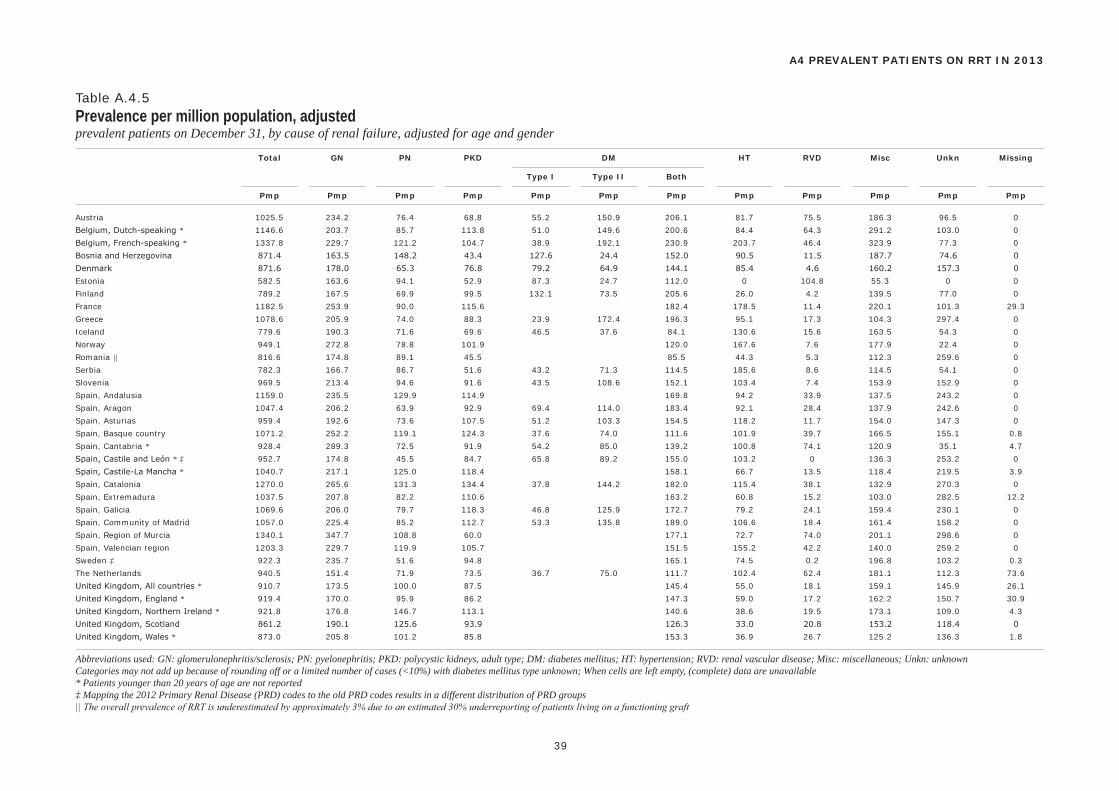
Total GN PN PKD DM HT RVD Misc Unkn Missing
Type I Type II Both
Pmp Pmp Pmp Pmp Pmp Pmp Pmp Pmp Pmp Pmp Pmp Pmp
39
A4 PREVALENT PATIENTS ON RRT IN 2013
Table A.4.5Prevalence per million population, adjustedprevalent patients on December 31, by cause of renal failure, adjusted for age and gender
Austria 1025.5 234.2 76.4 68.8 55.2 150.9 206.1 81.7 75.5 186.3 96.5 0
Belgium, Dutch-speaking * 1146.6 203.7 85.7 113.8 51.0 149.6 200.6 84.4 64.3 291.2 103.0 0
Belgium, French-speaking * 1337.8 229.7 121.2 104.7 38.9 192.1 230.9 203.7 46.4 323.9 77.3 0
Bosnia and Herzegovina 871.4 163.5 148.2 43.4 127.6 24.4 152.0 90.5 11.5 187.7 74.6 0
Denmark 871.6 178.0 65.3 76.8 79.2 64.9 144.1 85.4 4.6 160.2 157.3 0
Estonia 582.5 163.6 94.1 52.9 87.3 24.7 112.0 0 104.8 55.3 0 0
Finland 789.2 167.5 69.9 99.5 132.1 73.5 205.6 26.0 4.2 139.5 77.0 0
France 1182.5 253.9 90.0 115.6 182.4 178.5 11.4 220.1 101.3 29.3
Greece 1078.6 205.9 74.0 88.3 23.9 172.4 196.3 95.1 17.3 104.3 297.4 0
Iceland 779.6 190.3 71.6 69.6 46.5 37.6 84.1 130.6 15.6 163.5 54.3 0
Norway 949.1 272.8 78.8 101.9 120.0 167.6 7.6 177.9 22.4 0
Romania || 816.6 174.8 89.1 45.5 85.5 44.3 5.3 112.3 259.6 0
Serbia 782.3 166.7 86.7 51.6 43.2 71.3 114.5 185.6 8.6 114.5 54.1 0
Slovenia 969.5 213.4 94.6 91.6 43.5 108.6 152.1 103.4 7.4 153.9 152.9 0
Spain, Andalusia 1159.0 235.5 129.9 114.9 169.8 94.2 33.9 137.5 243.2 0
Spain, Aragon 1047.4 206.2 63.9 92.9 69.4 114.0 183.4 92.1 28.4 137.9 242.6 0
Spain, Asturias 959.4 192.6 73.6 107.5 51.2 103.3 154.5 118.2 11.7 154.0 147.3 0
Spain, Basque country 1071.2 252.2 119.1 124.3 37.6 74.0 111.6 101.9 39.7 166.5 155.1 0.8
Spain, Cantabria * 928.4 289.3 72.5 91.9 54.2 85.0 139.2 100.8 74.1 120.9 35.1 4.7
Spain, Castile and León * ‡ 952.7 174.8 45.5 84.7 65.8 89.2 155.0 103.2 0 136.3 253.2 0
Spain, Castile-La Mancha * 1040.7 217.1 125.0 118.4 158.1 66.7 13.5 118.4 219.5 3.9
Spain, Catalonia 1270.0 265.6 131.3 134.4 37.8 144.2 182.0 115.4 38.1 132.9 270.3 0
Spain, Extremadura 1037.5 207.8 82.2 110.6 163.2 60.8 15.2 103.0 282.5 12.2
Spain, Galicia 1069.6 206.0 79.7 118.3 46.8 125.9 172.7 79.2 24.1 159.4 230.1 0
Spain, Community of Madrid 1057.0 225.4 85.2 112.7 53.3 135.8 189.0 106.6 18.4 161.4 158.2 0
Spain, Region of Murcia 1340.1 347.7 108.8 60.0 177.1 72.7 74.0 201.1 298.6 0
Spain, Valencian region 1203.3 229.7 119.9 105.7 151.5 155.2 42.2 140.0 259.2 0
Sweden ‡ 922.3 235.7 51.6 94.8 165.1 74.5 0.2 196.8 103.2 0.3
The Netherlands 940.5 151.4 71.9 73.5 36.7 75.0 111.7 102.4 62.4 181.1 112.3 73.6
United Kingdom, All countries * 910.7 173.5 100.0 87.5 145.4 55.0 18.1 159.1 145.9 26.1
United Kingdom, England * 919.4 170.0 95.9 86.2 147.3 59.0 17.2 162.2 150.7 30.9
United Kingdom, Northern Ireland * 921.8 176.8 146.7 113.1 140.6 38.6 19.5 173.1 109.0 4.3
United Kingdom, Scotland 861.2 190.1 125.6 93.9 126.3 33.0 20.8 153.2 118.4 0
United Kingdom, Wales * 873.0 205.8 101.2 85.8 153.3 36.9 26.7 125.2 136.3 1.8
Abbreviations used: GN: glomerulonephritis/sclerosis; PN: pyelonephritis; PKD: polycystic kidneys, adult type; DM: diabetes mellitus; HT: hypertension; RVD: renal vascular disease; Misc: miscellaneous; Unkn: unknownCategories may not add up because of rounding off or a limited number of cases (<10%) with diabetes mellitus type unknown; When cells are left empty, (complete) data are unavailable* Patients younger than 20 years of age are not reported‡ Mapping the 2012 Primary Renal Disease (PRD) codes to the old PRD codes results in a different distribution of PRD groups|| The overall prevalence of RRT is underestimated by approximately 3% due to an estimated 30% underreporting of patients living on a functioning graft
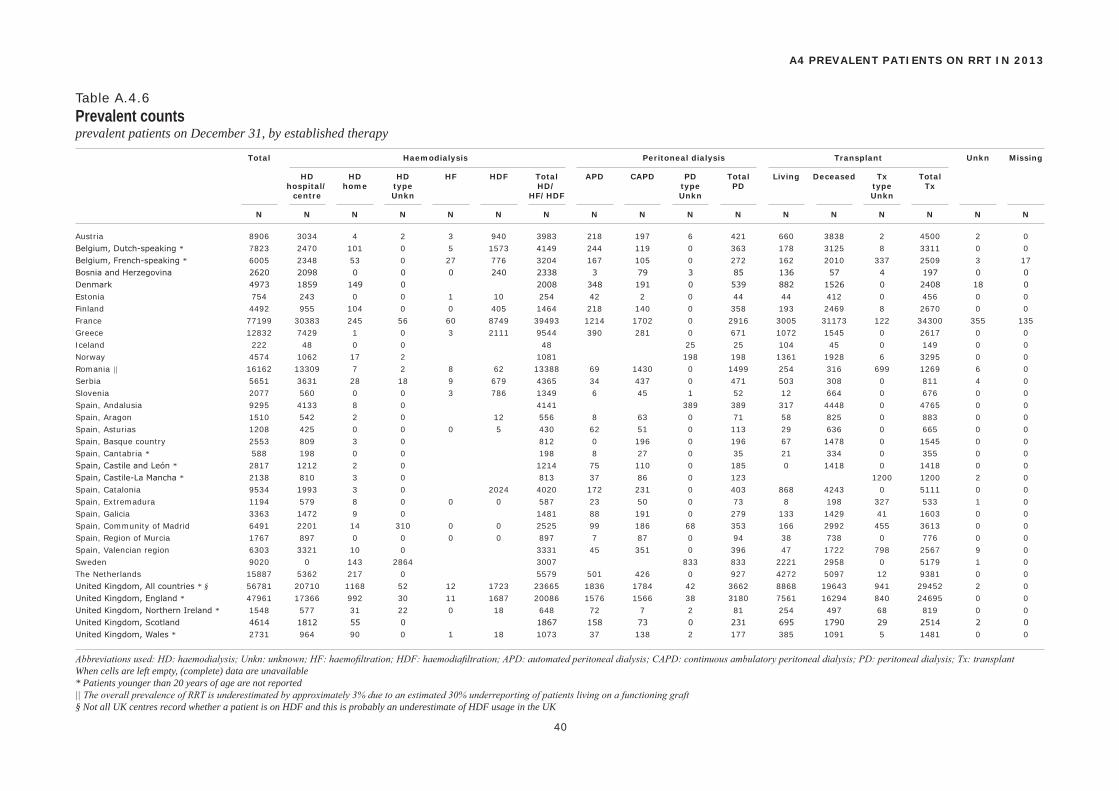
Total Haemodialysis Peritoneal dialysis Transplant Unkn Missing
HD HD HD HF HDF Total APD CAPD PD Total Living Deceased Tx Total hospital/ home type HD/ type PD type Tx centre Unkn HF/HDF Unkn Unkn
N N N N N N N N N N N N N N N N N
40
A4 PREVALENT PATIENTS ON RRT IN 2013
Table A.4.6Prevalent countsprevalent patients on December 31, by established therapy
Austria 8906 3034 4 2 3 940 3983 218 197 6 421 660 3838 2 4500 2 0
Belgium, Dutch-speaking * 7823 2470 101 0 5 1573 4149 244 119 0 363 178 3125 8 3311 0 0
Belgium, French-speaking * 6005 2348 53 0 27 776 3204 167 105 0 272 162 2010 337 2509 3 17
Bosnia and Herzegovina 2620 2098 0 0 0 240 2338 3 79 3 85 136 57 4 197 0 0
Denmark 4973 1859 149 0 2008 348 191 0 539 882 1526 0 2408 18 0
Estonia 754 243 0 0 1 10 254 42 2 0 44 44 412 0 456 0 0
Finland 4492 955 104 0 0 405 1464 218 140 0 358 193 2469 8 2670 0 0
France 77199 30383 245 56 60 8749 39493 1214 1702 0 2916 3005 31173 122 34300 355 135
Greece 12832 7429 1 0 3 2111 9544 390 281 0 671 1072 1545 0 2617 0 0
Iceland 222 48 0 0 48 25 25 104 45 0 149 0 0
Norway 4574 1062 17 2 1081 198 198 1361 1928 6 3295 0 0
Romania || 16162 13309 7 2 8 62 13388 69 1430 0 1499 254 316 699 1269 6 0
Serbia 5651 3631 28 18 9 679 4365 34 437 0 471 503 308 0 811 4 0
Slovenia 2077 560 0 0 3 786 1349 6 45 1 52 12 664 0 676 0 0
Spain, Andalusia 9295 4133 8 0 4141 389 389 317 4448 0 4765 0 0
Spain, Aragon 1510 542 2 0 12 556 8 63 0 71 58 825 0 883 0 0
Spain, Asturias 1208 425 0 0 0 5 430 62 51 0 113 29 636 0 665 0 0
Spain, Basque country 2553 809 3 0 812 0 196 0 196 67 1478 0 1545 0 0
Spain, Cantabria * 588 198 0 0 198 8 27 0 35 21 334 0 355 0 0
Spain, Castile and León * 2817 1212 2 0 1214 75 110 0 185 0 1418 0 1418 0 0
Spain, Castile-La Mancha * 2138 810 3 0 813 37 86 0 123 1200 1200 2 0
Spain, Catalonia 9534 1993 3 0 2024 4020 172 231 0 403 868 4243 0 5111 0 0
Spain, Extremadura 1194 579 8 0 0 0 587 23 50 0 73 8 198 327 533 1 0
Spain, Galicia 3363 1472 9 0 1481 88 191 0 279 133 1429 41 1603 0 0
Spain, Community of Madrid 6491 2201 14 310 0 0 2525 99 186 68 353 166 2992 455 3613 0 0
Spain, Region of Murcia 1767 897 0 0 0 0 897 7 87 0 94 38 738 0 776 0 0
Spain, Valencian region 6303 3321 10 0 3331 45 351 0 396 47 1722 798 2567 9 0
Sweden 9020 0 143 2864 3007 833 833 2221 2958 0 5179 1 0
The Netherlands 15887 5362 217 0 5579 501 426 0 927 4272 5097 12 9381 0 0
United Kingdom, All countries * § 56781 20710 1168 52 12 1723 23665 1836 1784 42 3662 8868 19643 941 29452 2 0
United Kingdom, England * 47961 17366 992 30 11 1687 20086 1576 1566 38 3180 7561 16294 840 24695 0 0
United Kingdom, Northern Ireland * 1548 577 31 22 0 18 648 72 7 2 81 254 497 68 819 0 0
United Kingdom, Scotland 4614 1812 55 0 1867 158 73 0 231 695 1790 29 2514 2 0
United Kingdom, Wales * 2731 964 90 0 1 18 1073 37 138 2 177 385 1091 5 1481 0 0
Abbreviations used: HD: haemodialysis; Unkn: unknown; HF: haemofiltration; HDF: haemodiafiltration; APD: automated peritoneal dialysis; CAPD: continuous ambulatory peritoneal dialysis; PD: peritoneal dialysis; Tx: transplantWhen cells are left empty, (complete) data are unavailable* Patients younger than 20 years of age are not reported|| The overall prevalence of RRT is underestimated by approximately 3% due to an estimated 30% underreporting of patients living on a functioning graft§ Not all UK centres record whether a patient is on HDF and this is probably an underestimate of HDF usage in the UK
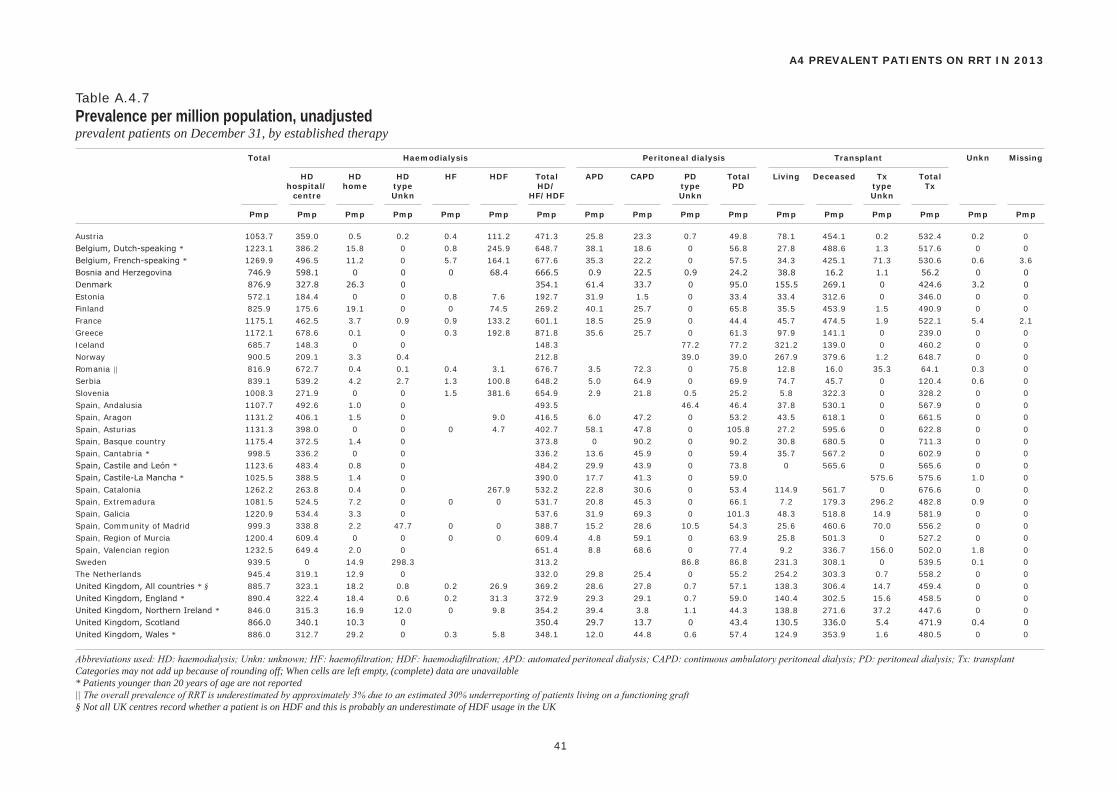
Total Haemodialysis Peritoneal dialysis Transplant Unkn Missing
HD HD HD HF HDF Total APD CAPD PD Total Living Deceased Tx Total hospital/ home type HD/ type PD type Tx centre Unkn HF/HDF Unkn Unkn
Pmp Pmp Pmp Pmp Pmp Pmp Pmp Pmp Pmp Pmp Pmp Pmp Pmp Pmp Pmp Pmp Pmp
41
A4 PREVALENT PATIENTS ON RRT IN 2013
Table A.4.7Prevalence per million population, unadjustedprevalent patients on December 31, by established therapy
Austria 1053.7 359.0 0.5 0.2 0.4 111.2 471.3 25.8 23.3 0.7 49.8 78.1 454.1 0.2 532.4 0.2 0
Belgium, Dutch-speaking * 1223.1 386.2 15.8 0 0.8 245.9 648.7 38.1 18.6 0 56.8 27.8 488.6 1.3 517.6 0 0
Belgium, French-speaking * 1269.9 496.5 11.2 0 5.7 164.1 677.6 35.3 22.2 0 57.5 34.3 425.1 71.3 530.6 0.6 3.6
Bosnia and Herzegovina 746.9 598.1 0 0 0 68.4 666.5 0.9 22.5 0.9 24.2 38.8 16.2 1.1 56.2 0 0
Denmark 876.9 327.8 26.3 0 354.1 61.4 33.7 0 95.0 155.5 269.1 0 424.6 3.2 0
Estonia 572.1 184.4 0 0 0.8 7.6 192.7 31.9 1.5 0 33.4 33.4 312.6 0 346.0 0 0
Finland 825.9 175.6 19.1 0 0 74.5 269.2 40.1 25.7 0 65.8 35.5 453.9 1.5 490.9 0 0
France 1175.1 462.5 3.7 0.9 0.9 133.2 601.1 18.5 25.9 0 44.4 45.7 474.5 1.9 522.1 5.4 2.1
Greece 1172.1 678.6 0.1 0 0.3 192.8 871.8 35.6 25.7 0 61.3 97.9 141.1 0 239.0 0 0
Iceland 685.7 148.3 0 0 148.3 77.2 77.2 321.2 139.0 0 460.2 0 0
Norway 900.5 209.1 3.3 0.4 212.8 39.0 39.0 267.9 379.6 1.2 648.7 0 0
Romania || 816.9 672.7 0.4 0.1 0.4 3.1 676.7 3.5 72.3 0 75.8 12.8 16.0 35.3 64.1 0.3 0
Serbia 839.1 539.2 4.2 2.7 1.3 100.8 648.2 5.0 64.9 0 69.9 74.7 45.7 0 120.4 0.6 0
Slovenia 1008.3 271.9 0 0 1.5 381.6 654.9 2.9 21.8 0.5 25.2 5.8 322.3 0 328.2 0 0
Spain, Andalusia 1107.7 492.6 1.0 0 493.5 46.4 46.4 37.8 530.1 0 567.9 0 0
Spain, Aragon 1131.2 406.1 1.5 0 9.0 416.5 6.0 47.2 0 53.2 43.5 618.1 0 661.5 0 0
Spain, Asturias 1131.3 398.0 0 0 0 4.7 402.7 58.1 47.8 0 105.8 27.2 595.6 0 622.8 0 0
Spain, Basque country 1175.4 372.5 1.4 0 373.8 0 90.2 0 90.2 30.8 680.5 0 711.3 0 0
Spain, Cantabria * 998.5 336.2 0 0 336.2 13.6 45.9 0 59.4 35.7 567.2 0 602.9 0 0
Spain, Castile and León * 1123.6 483.4 0.8 0 484.2 29.9 43.9 0 73.8 0 565.6 0 565.6 0 0
Spain, Castile-La Mancha * 1025.5 388.5 1.4 0 390.0 17.7 41.3 0 59.0 575.6 575.6 1.0 0
Spain, Catalonia 1262.2 263.8 0.4 0 267.9 532.2 22.8 30.6 0 53.4 114.9 561.7 0 676.6 0 0
Spain, Extremadura 1081.5 524.5 7.2 0 0 0 531.7 20.8 45.3 0 66.1 7.2 179.3 296.2 482.8 0.9 0
Spain, Galicia 1220.9 534.4 3.3 0 537.6 31.9 69.3 0 101.3 48.3 518.8 14.9 581.9 0 0
Spain, Community of Madrid 999.3 338.8 2.2 47.7 0 0 388.7 15.2 28.6 10.5 54.3 25.6 460.6 70.0 556.2 0 0
Spain, Region of Murcia 1200.4 609.4 0 0 0 0 609.4 4.8 59.1 0 63.9 25.8 501.3 0 527.2 0 0
Spain, Valencian region 1232.5 649.4 2.0 0 651.4 8.8 68.6 0 77.4 9.2 336.7 156.0 502.0 1.8 0
Sweden 939.5 0 14.9 298.3 313.2 86.8 86.8 231.3 308.1 0 539.5 0.1 0
The Netherlands 945.4 319.1 12.9 0 332.0 29.8 25.4 0 55.2 254.2 303.3 0.7 558.2 0 0
United Kingdom, All countries * § 885.7 323.1 18.2 0.8 0.2 26.9 369.2 28.6 27.8 0.7 57.1 138.3 306.4 14.7 459.4 0 0
United Kingdom, England * 890.4 322.4 18.4 0.6 0.2 31.3 372.9 29.3 29.1 0.7 59.0 140.4 302.5 15.6 458.5 0 0
United Kingdom, Northern Ireland * 846.0 315.3 16.9 12.0 0 9.8 354.2 39.4 3.8 1.1 44.3 138.8 271.6 37.2 447.6 0 0
United Kingdom, Scotland 866.0 340.1 10.3 0 350.4 29.7 13.7 0 43.4 130.5 336.0 5.4 471.9 0.4 0
United Kingdom, Wales * 886.0 312.7 29.2 0 0.3 5.8 348.1 12.0 44.8 0.6 57.4 124.9 353.9 1.6 480.5 0 0
Abbreviations used: HD: haemodialysis; Unkn: unknown; HF: haemofiltration; HDF: haemodiafiltration; APD: automated peritoneal dialysis; CAPD: continuous ambulatory peritoneal dialysis; PD: peritoneal dialysis; Tx: transplantCategories may not add up because of rounding off; When cells are left empty, (complete) data are unavailable* Patients younger than 20 years of age are not reported|| The overall prevalence of RRT is underestimated by approximately 3% due to an estimated 30% underreporting of patients living on a functioning graft§ Not all UK centres record whether a patient is on HDF and this is probably an underestimate of HDF usage in the UK
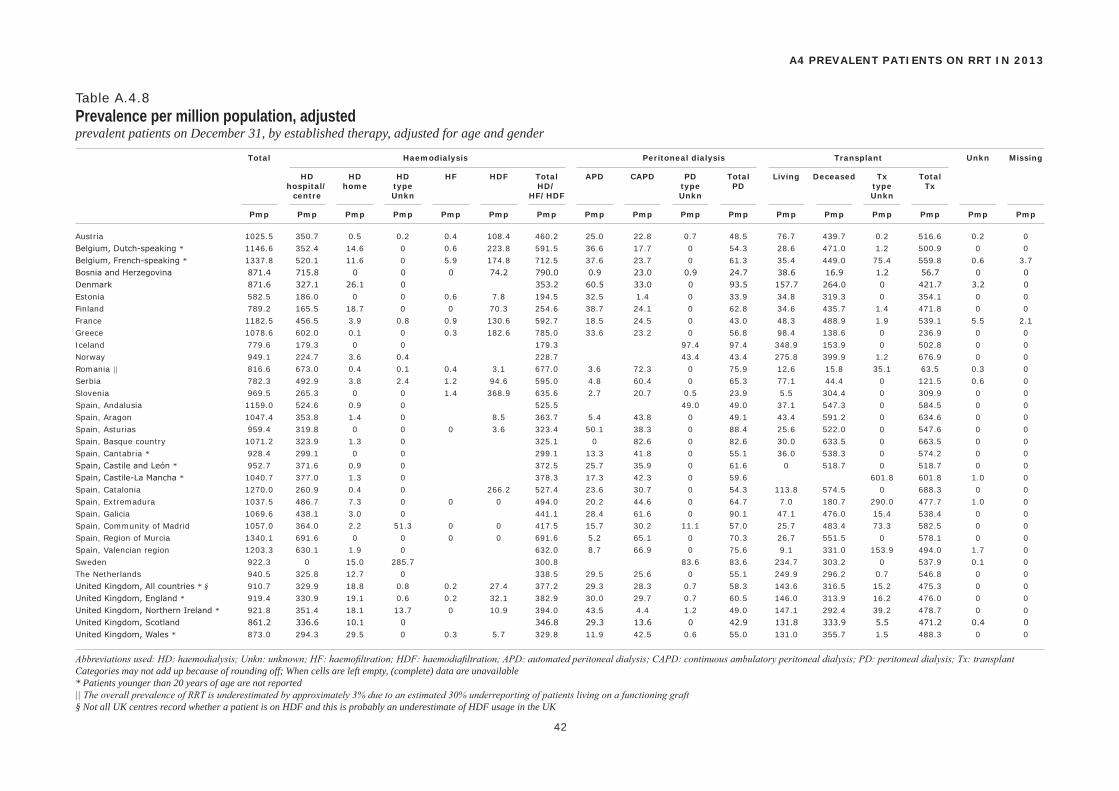
Total Haemodialysis Peritoneal dialysis Transplant Unkn Missing
HD HD HD HF HDF Total APD CAPD PD Total Living Deceased Tx Total hospital/ home type HD/ type PD type Tx centre Unkn HF/HDF Unkn Unkn
Pmp Pmp Pmp Pmp Pmp Pmp Pmp Pmp Pmp Pmp Pmp Pmp Pmp Pmp Pmp Pmp Pmp
42
A4 PREVALENT PATIENTS ON RRT IN 2013
Table A.4.8Prevalence per million population, adjustedprevalent patients on December 31, by established therapy, adjusted for age and gender
Austria 1025.5 350.7 0.5 0.2 0.4 108.4 460.2 25.0 22.8 0.7 48.5 76.7 439.7 0.2 516.6 0.2 0
Belgium, Dutch-speaking * 1146.6 352.4 14.6 0 0.6 223.8 591.5 36.6 17.7 0 54.3 28.6 471.0 1.2 500.9 0 0
Belgium, French-speaking * 1337.8 520.1 11.6 0 5.9 174.8 712.5 37.6 23.7 0 61.3 35.4 449.0 75.4 559.8 0.6 3.7
Bosnia and Herzegovina 871.4 715.8 0 0 0 74.2 790.0 0.9 23.0 0.9 24.7 38.6 16.9 1.2 56.7 0 0
Denmark 871.6 327.1 26.1 0 353.2 60.5 33.0 0 93.5 157.7 264.0 0 421.7 3.2 0
Estonia 582.5 186.0 0 0 0.6 7.8 194.5 32.5 1.4 0 33.9 34.8 319.3 0 354.1 0 0
Finland 789.2 165.5 18.7 0 0 70.3 254.6 38.7 24.1 0 62.8 34.6 435.7 1.4 471.8 0 0
France 1182.5 456.5 3.9 0.8 0.9 130.6 592.7 18.5 24.5 0 43.0 48.3 488.9 1.9 539.1 5.5 2.1
Greece 1078.6 602.0 0.1 0 0.3 182.6 785.0 33.6 23.2 0 56.8 98.4 138.6 0 236.9 0 0
Iceland 779.6 179.3 0 0 179.3 97.4 97.4 348.9 153.9 0 502.8 0 0
Norway 949.1 224.7 3.6 0.4 228.7 43.4 43.4 275.8 399.9 1.2 676.9 0 0
Romania || 816.6 673.0 0.4 0.1 0.4 3.1 677.0 3.6 72.3 0 75.9 12.6 15.8 35.1 63.5 0.3 0
Serbia 782.3 492.9 3.8 2.4 1.2 94.6 595.0 4.8 60.4 0 65.3 77.1 44.4 0 121.5 0.6 0
Slovenia 969.5 265.3 0 0 1.4 368.9 635.6 2.7 20.7 0.5 23.9 5.5 304.4 0 309.9 0 0
Spain, Andalusia 1159.0 524.6 0.9 0 525.5 49.0 49.0 37.1 547.3 0 584.5 0 0
Spain, Aragon 1047.4 353.8 1.4 0 8.5 363.7 5.4 43.8 0 49.1 43.4 591.2 0 634.6 0 0
Spain, Asturias 959.4 319.8 0 0 0 3.6 323.4 50.1 38.3 0 88.4 25.6 522.0 0 547.6 0 0
Spain, Basque country 1071.2 323.9 1.3 0 325.1 0 82.6 0 82.6 30.0 633.5 0 663.5 0 0
Spain, Cantabria * 928.4 299.1 0 0 299.1 13.3 41.8 0 55.1 36.0 538.3 0 574.2 0 0
Spain, Castile and León * 952.7 371.6 0.9 0 372.5 25.7 35.9 0 61.6 0 518.7 0 518.7 0 0
Spain, Castile-La Mancha * 1040.7 377.0 1.3 0 378.3 17.3 42.3 0 59.6 601.8 601.8 1.0 0
Spain, Catalonia 1270.0 260.9 0.4 0 266.2 527.4 23.6 30.7 0 54.3 113.8 574.5 0 688.3 0 0
Spain, Extremadura 1037.5 486.7 7.3 0 0 0 494.0 20.2 44.6 0 64.7 7.0 180.7 290.0 477.7 1.0 0
Spain, Galicia 1069.6 438.1 3.0 0 441.1 28.4 61.6 0 90.1 47.1 476.0 15.4 538.4 0 0
Spain, Community of Madrid 1057.0 364.0 2.2 51.3 0 0 417.5 15.7 30.2 11.1 57.0 25.7 483.4 73.3 582.5 0 0
Spain, Region of Murcia 1340.1 691.6 0 0 0 0 691.6 5.2 65.1 0 70.3 26.7 551.5 0 578.1 0 0
Spain, Valencian region 1203.3 630.1 1.9 0 632.0 8.7 66.9 0 75.6 9.1 331.0 153.9 494.0 1.7 0
Sweden 922.3 0 15.0 285.7 300.8 83.6 83.6 234.7 303.2 0 537.9 0.1 0
The Netherlands 940.5 325.8 12.7 0 338.5 29.5 25.6 0 55.1 249.9 296.2 0.7 546.8 0 0
United Kingdom, All countries * § 910.7 329.9 18.8 0.8 0.2 27.4 377.2 29.3 28.3 0.7 58.3 143.6 316.5 15.2 475.3 0 0
United Kingdom, England * 919.4 330.9 19.1 0.6 0.2 32.1 382.9 30.0 29.7 0.7 60.5 146.0 313.9 16.2 476.0 0 0
United Kingdom, Northern Ireland * 921.8 351.4 18.1 13.7 0 10.9 394.0 43.5 4.4 1.2 49.0 147.1 292.4 39.2 478.7 0 0
United Kingdom, Scotland 861.2 336.6 10.1 0 346.8 29.3 13.6 0 42.9 131.8 333.9 5.5 471.2 0.4 0
United Kingdom, Wales * 873.0 294.3 29.5 0 0.3 5.7 329.8 11.9 42.5 0.6 55.0 131.0 355.7 1.5 488.3 0 0
Abbreviations used: HD: haemodialysis; Unkn: unknown; HF: haemofiltration; HDF: haemodiafiltration; APD: automated peritoneal dialysis; CAPD: continuous ambulatory peritoneal dialysis; PD: peritoneal dialysis; Tx: transplantCategories may not add up because of rounding off; When cells are left empty, (complete) data are unavailable* Patients younger than 20 years of age are not reported|| The overall prevalence of RRT is underestimated by approximately 3% due to an estimated 30% underreporting of patients living on a functioning graft§ Not all UK centres record whether a patient is on HDF and this is probably an underestimate of HDF usage in the UK
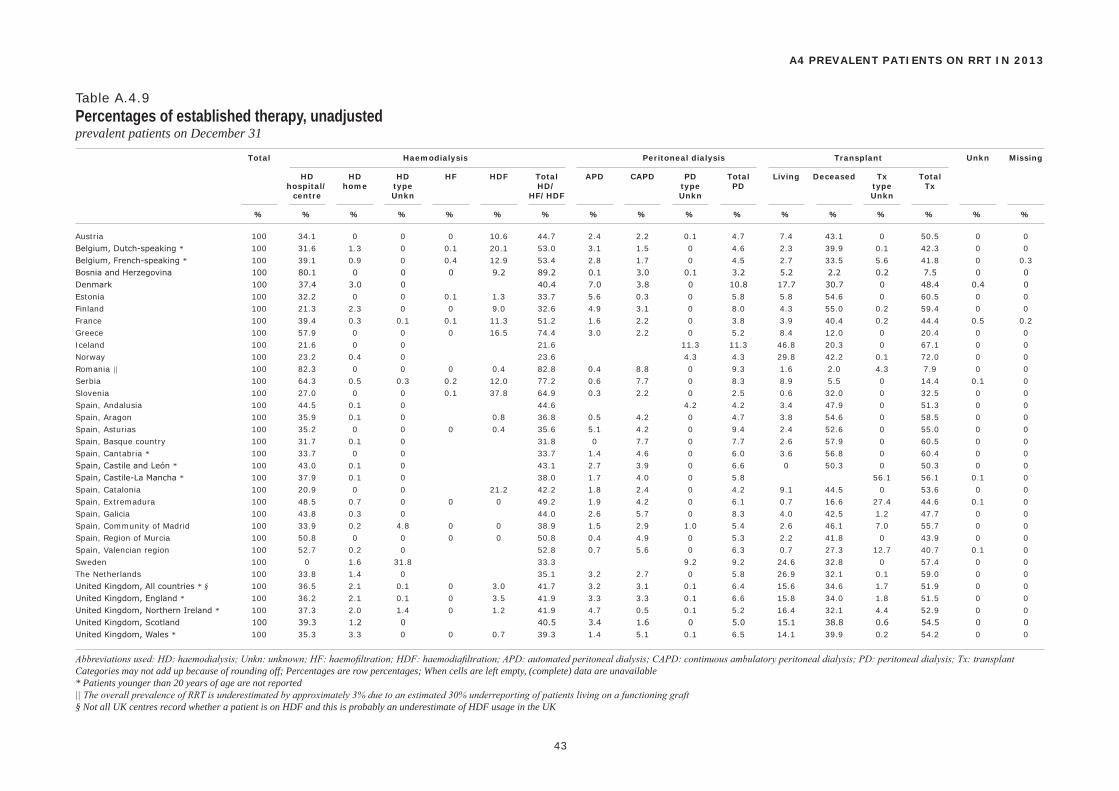
Total Haemodialysis Peritoneal dialysis Transplant Unkn Missing
HD HD HD HF HDF Total APD CAPD PD Total Living Deceased Tx Total hospital/ home type HD/ type PD type Tx centre Unkn HF/HDF Unkn Unkn
% % % % % % % % % % % % % % % % %
43
A4 PREVALENT PATIENTS ON RRT IN 2013
Table A.4.9Percentages of established therapy, unadjustedprevalent patients on December 31
Austria 100 34.1 0 0 0 10.6 44.7 2.4 2.2 0.1 4.7 7.4 43.1 0 50.5 0 0
Belgium, Dutch-speaking * 100 31.6 1.3 0 0.1 20.1 53.0 3.1 1.5 0 4.6 2.3 39.9 0.1 42.3 0 0
Belgium, French-speaking * 100 39.1 0.9 0 0.4 12.9 53.4 2.8 1.7 0 4.5 2.7 33.5 5.6 41.8 0 0.3
Bosnia and Herzegovina 100 80.1 0 0 0 9.2 89.2 0.1 3.0 0.1 3.2 5.2 2.2 0.2 7.5 0 0
Denmark 100 37.4 3.0 0 40.4 7.0 3.8 0 10.8 17.7 30.7 0 48.4 0.4 0
Estonia 100 32.2 0 0 0.1 1.3 33.7 5.6 0.3 0 5.8 5.8 54.6 0 60.5 0 0
Finland 100 21.3 2.3 0 0 9.0 32.6 4.9 3.1 0 8.0 4.3 55.0 0.2 59.4 0 0
France 100 39.4 0.3 0.1 0.1 11.3 51.2 1.6 2.2 0 3.8 3.9 40.4 0.2 44.4 0.5 0.2
Greece 100 57.9 0 0 0 16.5 74.4 3.0 2.2 0 5.2 8.4 12.0 0 20.4 0 0
Iceland 100 21.6 0 0 21.6 11.3 11.3 46.8 20.3 0 67.1 0 0
Norway 100 23.2 0.4 0 23.6 4.3 4.3 29.8 42.2 0.1 72.0 0 0
Romania || 100 82.3 0 0 0 0.4 82.8 0.4 8.8 0 9.3 1.6 2.0 4.3 7.9 0 0
Serbia 100 64.3 0.5 0.3 0.2 12.0 77.2 0.6 7.7 0 8.3 8.9 5.5 0 14.4 0.1 0
Slovenia 100 27.0 0 0 0.1 37.8 64.9 0.3 2.2 0 2.5 0.6 32.0 0 32.5 0 0
Spain, Andalusia 100 44.5 0.1 0 44.6 4.2 4.2 3.4 47.9 0 51.3 0 0
Spain, Aragon 100 35.9 0.1 0 0.8 36.8 0.5 4.2 0 4.7 3.8 54.6 0 58.5 0 0
Spain, Asturias 100 35.2 0 0 0 0.4 35.6 5.1 4.2 0 9.4 2.4 52.6 0 55.0 0 0
Spain, Basque country 100 31.7 0.1 0 31.8 0 7.7 0 7.7 2.6 57.9 0 60.5 0 0
Spain, Cantabria * 100 33.7 0 0 33.7 1.4 4.6 0 6.0 3.6 56.8 0 60.4 0 0
Spain, Castile and León * 100 43.0 0.1 0 43.1 2.7 3.9 0 6.6 0 50.3 0 50.3 0 0
Spain, Castile-La Mancha * 100 37.9 0.1 0 38.0 1.7 4.0 0 5.8 56.1 56.1 0.1 0
Spain, Catalonia 100 20.9 0 0 21.2 42.2 1.8 2.4 0 4.2 9.1 44.5 0 53.6 0 0
Spain, Extremadura 100 48.5 0.7 0 0 0 49.2 1.9 4.2 0 6.1 0.7 16.6 27.4 44.6 0.1 0
Spain, Galicia 100 43.8 0.3 0 44.0 2.6 5.7 0 8.3 4.0 42.5 1.2 47.7 0 0
Spain, Community of Madrid 100 33.9 0.2 4.8 0 0 38.9 1.5 2.9 1.0 5.4 2.6 46.1 7.0 55.7 0 0
Spain, Region of Murcia 100 50.8 0 0 0 0 50.8 0.4 4.9 0 5.3 2.2 41.8 0 43.9 0 0
Spain, Valencian region 100 52.7 0.2 0 52.8 0.7 5.6 0 6.3 0.7 27.3 12.7 40.7 0.1 0
Sweden 100 0 1.6 31.8 33.3 9.2 9.2 24.6 32.8 0 57.4 0 0
The Netherlands 100 33.8 1.4 0 35.1 3.2 2.7 0 5.8 26.9 32.1 0.1 59.0 0 0
United Kingdom, All countries * § 100 36.5 2.1 0.1 0 3.0 41.7 3.2 3.1 0.1 6.4 15.6 34.6 1.7 51.9 0 0
United Kingdom, England * 100 36.2 2.1 0.1 0 3.5 41.9 3.3 3.3 0.1 6.6 15.8 34.0 1.8 51.5 0 0
United Kingdom, Northern Ireland * 100 37.3 2.0 1.4 0 1.2 41.9 4.7 0.5 0.1 5.2 16.4 32.1 4.4 52.9 0 0
United Kingdom, Scotland 100 39.3 1.2 0 40.5 3.4 1.6 0 5.0 15.1 38.8 0.6 54.5 0 0
United Kingdom, Wales * 100 35.3 3.3 0 0 0.7 39.3 1.4 5.1 0.1 6.5 14.1 39.9 0.2 54.2 0 0
Abbreviations used: HD: haemodialysis; Unkn: unknown; HF: haemofiltration; HDF: haemodiafiltration; APD: automated peritoneal dialysis; CAPD: continuous ambulatory peritoneal dialysis; PD: peritoneal dialysis; Tx: transplantCategories may not add up because of rounding off; Percentages are row percentages; When cells are left empty, (complete) data are unavailable* Patients younger than 20 years of age are not reported|| The overall prevalence of RRT is underestimated by approximately 3% due to an estimated 30% underreporting of patients living on a functioning graft§ Not all UK centres record whether a patient is on HDF and this is probably an underestimate of HDF usage in the UK
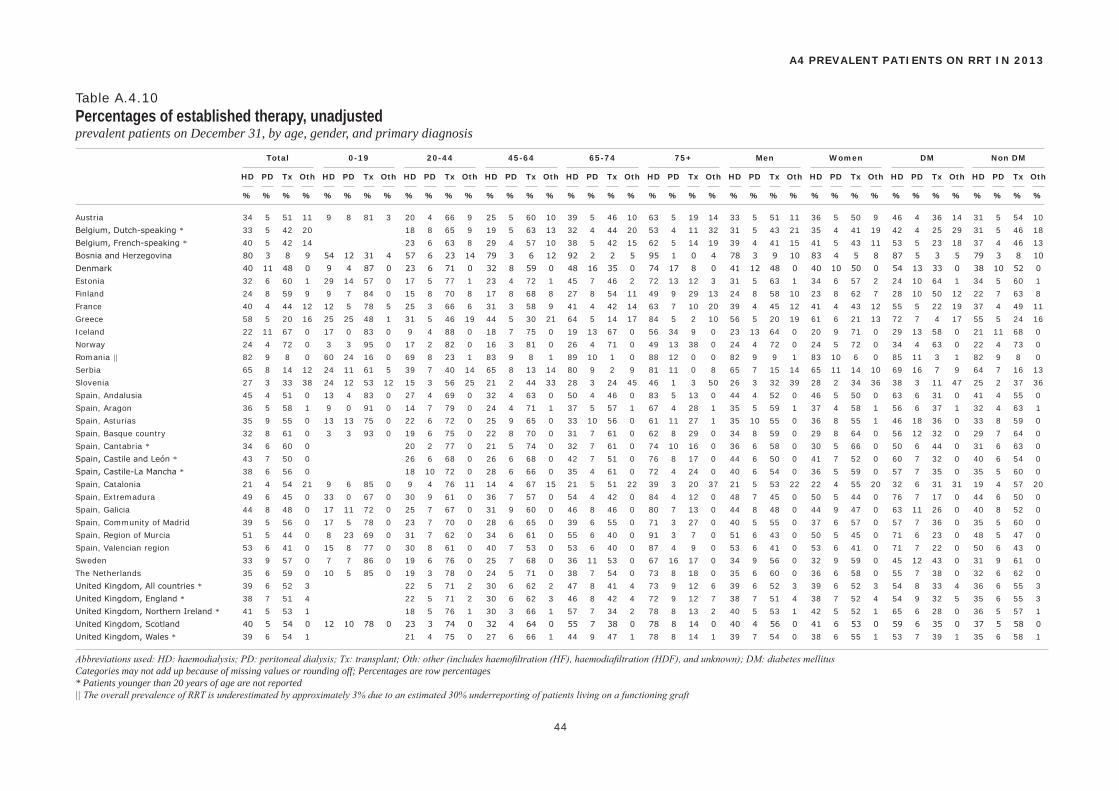
Total 0-19 20-44 45-64 65-74 75+ Men Women DM Non DM
HD PD Tx Oth HD PD Tx Oth HD PD Tx Oth HD PD Tx Oth HD PD Tx Oth HD PD Tx Oth HD PD Tx Oth HD PD Tx Oth HD PD Tx Oth HD PD Tx Oth
% % % % % % % % % % % % % % % % % % % % % % % % % % % % % % % % % % % % % % % %
44
A4 PREVALENT PATIENTS ON RRT IN 2013
Table A.4.10Percentages of established therapy, unadjustedprevalent patients on December 31, by age, gender, and primary diagnosis
Austria 34 5 51 11 9 8 81 3 20 4 66 9 25 5 60 10 39 5 46 10 63 5 19 14 33 5 51 11 36 5 50 9 46 4 36 14 31 5 54 10
Belgium, Dutch-speaking * 33 5 42 20 18 8 65 9 19 5 63 13 32 4 44 20 53 4 11 32 31 5 43 21 35 4 41 19 42 4 25 29 31 5 46 18
Belgium, French-speaking * 40 5 42 14 23 6 63 8 29 4 57 10 38 5 42 15 62 5 14 19 39 4 41 15 41 5 43 11 53 5 23 18 37 4 46 13
Bosnia and Herzegovina 80 3 8 9 54 12 31 4 57 6 23 14 79 3 6 12 92 2 2 5 95 1 0 4 78 3 9 10 83 4 5 8 87 5 3 5 79 3 8 10
Denmark 40 11 48 0 9 4 87 0 23 6 71 0 32 8 59 0 48 16 35 0 74 17 8 0 41 12 48 0 40 10 50 0 54 13 33 0 38 10 52 0
Estonia 32 6 60 1 29 14 57 0 17 5 77 1 23 4 72 1 45 7 46 2 72 13 12 3 31 5 63 1 34 6 57 2 24 10 64 1 34 5 60 1
Finland 24 8 59 9 9 7 84 0 15 8 70 8 17 8 68 8 27 8 54 11 49 9 29 13 24 8 58 10 23 8 62 7 28 10 50 12 22 7 63 8
France 40 4 44 12 12 5 78 5 25 3 66 6 31 3 58 9 41 4 42 14 63 7 10 20 39 4 45 12 41 4 43 12 55 5 22 19 37 4 49 11
Greece 58 5 20 16 25 25 48 1 31 5 46 19 44 5 30 21 64 5 14 17 84 5 2 10 56 5 20 19 61 6 21 13 72 7 4 17 55 5 24 16
Iceland 22 11 67 0 17 0 83 0 9 4 88 0 18 7 75 0 19 13 67 0 56 34 9 0 23 13 64 0 20 9 71 0 29 13 58 0 21 11 68 0
Norway 24 4 72 0 3 3 95 0 17 2 82 0 16 3 81 0 26 4 71 0 49 13 38 0 24 4 72 0 24 5 72 0 34 4 63 0 22 4 73 0
Romania || 82 9 8 0 60 24 16 0 69 8 23 1 83 9 8 1 89 10 1 0 88 12 0 0 82 9 9 1 83 10 6 0 85 11 3 1 82 9 8 0
Serbia 65 8 14 12 24 11 61 5 39 7 40 14 65 8 13 14 80 9 2 9 81 11 0 8 65 7 15 14 65 11 14 10 69 16 7 9 64 7 16 13
Slovenia 27 3 33 38 24 12 53 12 15 3 56 25 21 2 44 33 28 3 24 45 46 1 3 50 26 3 32 39 28 2 34 36 38 3 11 47 25 2 37 36
Spain, Andalusia 45 4 51 0 13 4 83 0 27 4 69 0 32 4 63 0 50 4 46 0 83 5 13 0 44 4 52 0 46 5 50 0 63 6 31 0 41 4 55 0
Spain, Aragon 36 5 58 1 9 0 91 0 14 7 79 0 24 4 71 1 37 5 57 1 67 4 28 1 35 5 59 1 37 4 58 1 56 6 37 1 32 4 63 1
Spain, Asturias 35 9 55 0 13 13 75 0 22 6 72 0 25 9 65 0 33 10 56 0 61 11 27 1 35 10 55 0 36 8 55 1 46 18 36 0 33 8 59 0
Spain, Basque country 32 8 61 0 3 3 93 0 19 6 75 0 22 8 70 0 31 7 61 0 62 8 29 0 34 8 59 0 29 8 64 0 56 12 32 0 29 7 64 0
Spain, Cantabria * 34 6 60 0 20 2 77 0 21 5 74 0 32 7 61 0 74 10 16 0 36 6 58 0 30 5 66 0 50 6 44 0 31 6 63 0
Spain, Castile and León * 43 7 50 0 26 6 68 0 26 6 68 0 42 7 51 0 76 8 17 0 44 6 50 0 41 7 52 0 60 7 32 0 40 6 54 0
Spain, Castile-La Mancha * 38 6 56 0 18 10 72 0 28 6 66 0 35 4 61 0 72 4 24 0 40 6 54 0 36 5 59 0 57 7 35 0 35 5 60 0
Spain, Catalonia 21 4 54 21 9 6 85 0 9 4 76 11 14 4 67 15 21 5 51 22 39 3 20 37 21 5 53 22 22 4 55 20 32 6 31 31 19 4 57 20
Spain, Extremadura 49 6 45 0 33 0 67 0 30 9 61 0 36 7 57 0 54 4 42 0 84 4 12 0 48 7 45 0 50 5 44 0 76 7 17 0 44 6 50 0
Spain, Galicia 44 8 48 0 17 11 72 0 25 7 67 0 31 9 60 0 46 8 46 0 80 7 13 0 44 8 48 0 44 9 47 0 63 11 26 0 40 8 52 0
Spain, Community of Madrid 39 5 56 0 17 5 78 0 23 7 70 0 28 6 65 0 39 6 55 0 71 3 27 0 40 5 55 0 37 6 57 0 57 7 36 0 35 5 60 0
Spain, Region of Murcia 51 5 44 0 8 23 69 0 31 7 62 0 34 6 61 0 55 6 40 0 91 3 7 0 51 6 43 0 50 5 45 0 71 6 23 0 48 5 47 0
Spain, Valencian region 53 6 41 0 15 8 77 0 30 8 61 0 40 7 53 0 53 6 40 0 87 4 9 0 53 6 41 0 53 6 41 0 71 7 22 0 50 6 43 0
Sweden 33 9 57 0 7 7 86 0 19 6 76 0 25 7 68 0 36 11 53 0 67 16 17 0 34 9 56 0 32 9 59 0 45 12 43 0 31 9 61 0
The Netherlands 35 6 59 0 10 5 85 0 19 3 78 0 24 5 71 0 38 7 54 0 73 8 18 0 35 6 60 0 36 6 58 0 55 7 38 0 32 6 62 0
United Kingdom, All countries * 39 6 52 3 22 5 71 2 30 6 62 2 47 8 41 4 73 9 12 6 39 6 52 3 39 6 52 3 54 8 33 4 36 6 55 3
United Kingdom, England * 38 7 51 4 22 5 71 2 30 6 62 3 46 8 42 4 72 9 12 7 38 7 51 4 38 7 52 4 54 9 32 5 35 6 55 3
United Kingdom, Northern Ireland * 41 5 53 1 18 5 76 1 30 3 66 1 57 7 34 2 78 8 13 2 40 5 53 1 42 5 52 1 65 6 28 0 36 5 57 1
United Kingdom, Scotland 40 5 54 0 12 10 78 0 23 3 74 0 32 4 64 0 55 7 38 0 78 8 14 0 40 4 56 0 41 6 53 0 59 6 35 0 37 5 58 0
United Kingdom, Wales * 39 6 54 1 21 4 75 0 27 6 66 1 44 9 47 1 78 8 14 1 39 7 54 0 38 6 55 1 53 7 39 1 35 6 58 1
Abbreviations used: HD: haemodialysis; PD: peritoneal dialysis; Tx: transplant; Oth: other (includes haemofiltration (HF), haemodiafiltration (HDF), and unknown); DM: diabetes mellitusCategories may not add up because of missing values or rounding off; Percentages are row percentages* Patients younger than 20 years of age are not reported|| The overall prevalence of RRT is underestimated by approximately 3% due to an estimated 30% underreporting of patients living on a functioning graft
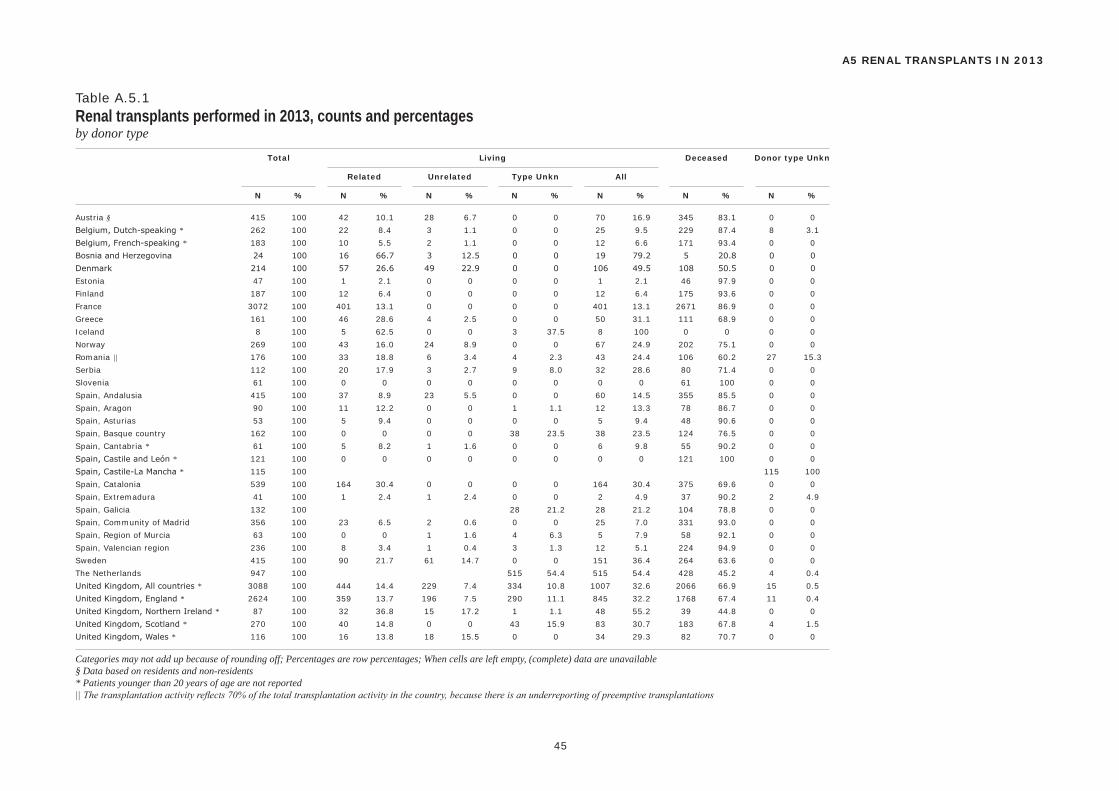
Total Living Deceased Donor type Unkn
Related Unrelated Type Unkn All
N % N % N % N % N % N % N %
45
A5 RENAL TRANSPLANTS IN 2013
Table A.5.1Renal transplants performed in 2013, counts and percentagesby donor type
Austria § 415 100 42 10.1 28 6.7 0 0 70 16.9 345 83.1 0 0
Belgium, Dutch-speaking * 262 100 22 8.4 3 1.1 0 0 25 9.5 229 87.4 8 3.1
Belgium, French-speaking * 183 100 10 5.5 2 1.1 0 0 12 6.6 171 93.4 0 0
Bosnia and Herzegovina 24 100 16 66.7 3 12.5 0 0 19 79.2 5 20.8 0 0
Denmark 214 100 57 26.6 49 22.9 0 0 106 49.5 108 50.5 0 0
Estonia 47 100 1 2.1 0 0 0 0 1 2.1 46 97.9 0 0
Finland 187 100 12 6.4 0 0 0 0 12 6.4 175 93.6 0 0
France 3072 100 401 13.1 0 0 0 0 401 13.1 2671 86.9 0 0
Greece 161 100 46 28.6 4 2.5 0 0 50 31.1 111 68.9 0 0
Iceland 8 100 5 62.5 0 0 3 37.5 8 100 0 0 0 0
Norway 269 100 43 16.0 24 8.9 0 0 67 24.9 202 75.1 0 0
Romania || 176 100 33 18.8 6 3.4 4 2.3 43 24.4 106 60.2 27 15.3
Serbia 112 100 20 17.9 3 2.7 9 8.0 32 28.6 80 71.4 0 0
Slovenia 61 100 0 0 0 0 0 0 0 0 61 100 0 0
Spain, Andalusia 415 100 37 8.9 23 5.5 0 0 60 14.5 355 85.5 0 0
Spain, Aragon 90 100 11 12.2 0 0 1 1.1 12 13.3 78 86.7 0 0
Spain, Asturias 53 100 5 9.4 0 0 0 0 5 9.4 48 90.6 0 0
Spain, Basque country 162 100 0 0 0 0 38 23.5 38 23.5 124 76.5 0 0
Spain, Cantabria * 61 100 5 8.2 1 1.6 0 0 6 9.8 55 90.2 0 0
Spain, Castile and León * 121 100 0 0 0 0 0 0 0 0 121 100 0 0
Spain, Castile-La Mancha * 115 100 115 100
Spain, Catalonia 539 100 164 30.4 0 0 0 0 164 30.4 375 69.6 0 0
Spain, Extremadura 41 100 1 2.4 1 2.4 0 0 2 4.9 37 90.2 2 4.9
Spain, Galicia 132 100 28 21.2 28 21.2 104 78.8 0 0
Spain, Community of Madrid 356 100 23 6.5 2 0.6 0 0 25 7.0 331 93.0 0 0
Spain, Region of Murcia 63 100 0 0 1 1.6 4 6.3 5 7.9 58 92.1 0 0
Spain, Valencian region 236 100 8 3.4 1 0.4 3 1.3 12 5.1 224 94.9 0 0
Sweden 415 100 90 21.7 61 14.7 0 0 151 36.4 264 63.6 0 0
The Netherlands 947 100 515 54.4 515 54.4 428 45.2 4 0.4
United Kingdom, All countries * 3088 100 444 14.4 229 7.4 334 10.8 1007 32.6 2066 66.9 15 0.5
United Kingdom, England * 2624 100 359 13.7 196 7.5 290 11.1 845 32.2 1768 67.4 11 0.4
United Kingdom, Northern Ireland * 87 100 32 36.8 15 17.2 1 1.1 48 55.2 39 44.8 0 0
United Kingdom, Scotland * 270 100 40 14.8 0 0 43 15.9 83 30.7 183 67.8 4 1.5
United Kingdom, Wales * 116 100 16 13.8 18 15.5 0 0 34 29.3 82 70.7 0 0
Categories may not add up because of rounding off; Percentages are row percentages; When cells are left empty, (complete) data are unavailable§ Data based on residents and non-residents* Patients younger than 20 years of age are not reported|| The transplantation activity reflects 70% of the total transplantation activity in the country, because there is an underreporting of preemptive transplantations
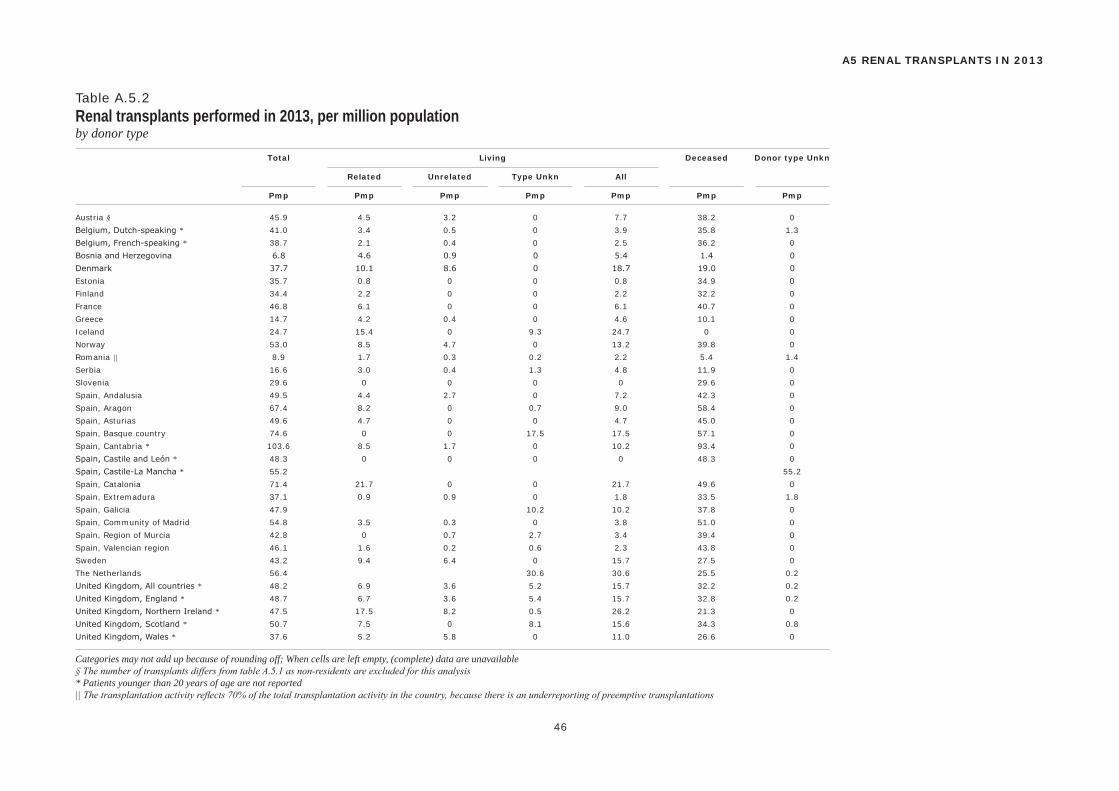
Total Living Deceased Donor type Unkn
Related Unrelated Type Unkn All
Pmp Pmp Pmp Pmp Pmp Pmp Pmp
46
A5 RENAL TRANSPLANTS IN 2013
Table A.5.2Renal transplants performed in 2013, per million populationby donor type
Austria § 45.9 4.5 3.2 0 7.7 38.2 0
Belgium, Dutch-speaking * 41.0 3.4 0.5 0 3.9 35.8 1.3
Belgium, French-speaking * 38.7 2.1 0.4 0 2.5 36.2 0
Bosnia and Herzegovina 6.8 4.6 0.9 0 5.4 1.4 0
Denmark 37.7 10.1 8.6 0 18.7 19.0 0
Estonia 35.7 0.8 0 0 0.8 34.9 0
Finland 34.4 2.2 0 0 2.2 32.2 0
France 46.8 6.1 0 0 6.1 40.7 0
Greece 14.7 4.2 0.4 0 4.6 10.1 0
Iceland 24.7 15.4 0 9.3 24.7 0 0
Norway 53.0 8.5 4.7 0 13.2 39.8 0
Romania || 8.9 1.7 0.3 0.2 2.2 5.4 1.4
Serbia 16.6 3.0 0.4 1.3 4.8 11.9 0
Slovenia 29.6 0 0 0 0 29.6 0
Spain, Andalusia 49.5 4.4 2.7 0 7.2 42.3 0
Spain, Aragon 67.4 8.2 0 0.7 9.0 58.4 0
Spain, Asturias 49.6 4.7 0 0 4.7 45.0 0
Spain, Basque country 74.6 0 0 17.5 17.5 57.1 0
Spain, Cantabria * 103.6 8.5 1.7 0 10.2 93.4 0
Spain, Castile and León * 48.3 0 0 0 0 48.3 0
Spain, Castile-La Mancha * 55.2 55.2
Spain, Catalonia 71.4 21.7 0 0 21.7 49.6 0
Spain, Extremadura 37.1 0.9 0.9 0 1.8 33.5 1.8
Spain, Galicia 47.9 10.2 10.2 37.8 0
Spain, Community of Madrid 54.8 3.5 0.3 0 3.8 51.0 0
Spain, Region of Murcia 42.8 0 0.7 2.7 3.4 39.4 0
Spain, Valencian region 46.1 1.6 0.2 0.6 2.3 43.8 0
Sweden 43.2 9.4 6.4 0 15.7 27.5 0
The Netherlands 56.4 30.6 30.6 25.5 0.2
United Kingdom, All countries * 48.2 6.9 3.6 5.2 15.7 32.2 0.2
United Kingdom, England * 48.7 6.7 3.6 5.4 15.7 32.8 0.2
United Kingdom, Northern Ireland * 47.5 17.5 8.2 0.5 26.2 21.3 0
United Kingdom, Scotland * 50.7 7.5 0 8.1 15.6 34.3 0.8
United Kingdom, Wales * 37.6 5.2 5.8 0 11.0 26.6 0
Categories may not add up because of rounding off; When cells are left empty, (complete) data are unavailable§ The number of transplants differs from table A.5.1 as non-residents are excluded for this analysis* Patients younger than 20 years of age are not reported|| The transplantation activity reflects 70% of the total transplantation activity in the country, because there is an underreporting of preemptive transplantations

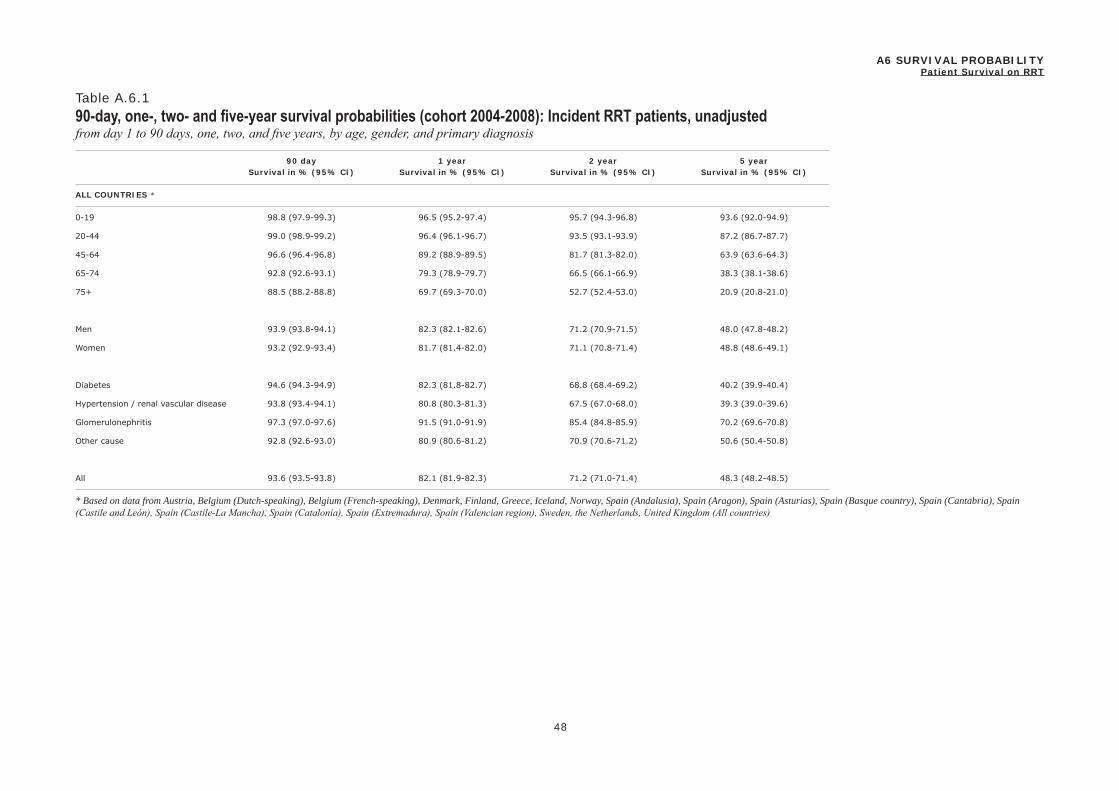
90 day 1 year 2 year 5 year
48
Survival in % (95% CI) Survival in % (95% CI) Survival in % (95% CI) Survival in % (95% CI)
ALL COUNTRIES *
A6 SURVIVAL PROBABILITYPatient Survival on RRT
Table A.6.190-day, one-, two- and five-year survival probabilities (cohort 2004-2008): Incident RRT patients, unadjustedfrom day 1 to 90 days, one, two, and five years, by age, gender, and primary diagnosis
0-19 98.8 (97.9-99.3) 96.5 (95.2-97.4) 95.7 (94.3-96.8) 93.6 (92.0-94.9)
20-44 99.0 (98.9-99.2) 96.4 (96.1-96.7) 93.5 (93.1-93.9) 87.2 (86.7-87.7)
45-64 96.6 (96.4-96.8) 89.2 (88.9-89.5) 81.7 (81.3-82.0) 63.9 (63.6-64.3)
65-74 92.8 (92.6-93.1) 79.3 (78.9-79.7) 66.5 (66.1-66.9) 38.3 (38.1-38.6)
75+ 88.5 (88.2-88.8) 69.7 (69.3-70.0) 52.7 (52.4-53.0) 20.9 (20.8-21.0)
Men 93.9 (93.8-94.1) 82.3 (82.1-82.6) 71.2 (70.9-71.5) 48.0 (47.8-48.2)
Women 93.2 (92.9-93.4) 81.7 (81.4-82.0) 71.1 (70.8-71.4) 48.8 (48.6-49.1)
Diabetes 94.6 (94.3-94.9) 82.3 (81.8-82.7) 68.8 (68.4-69.2) 40.2 (39.9-40.4)
Hypertension / renal vascular disease 93.8 (93.4-94.1) 80.8 (80.3-81.3) 67.5 (67.0-68.0) 39.3 (39.0-39.6)
Glomerulonephritis 97.3 (97.0-97.6) 91.5 (91.0-91.9) 85.4 (84.8-85.9) 70.2 (69.6-70.8)
Other cause 92.8 (92.6-93.0) 80.9 (80.6-81.2) 70.9 (70.6-71.2) 50.6 (50.4-50.8)
All 93.6 (93.5-93.8) 82.1 (81.9-82.3) 71.2 (71.0-71.4) 48.3 (48.2-48.5)
* Based on data from Austria, Belgium (Dutch-speaking), Belgium (French-speaking), Denmark, Finland, Greece, Iceland, Norway, Spain (Andalusia), Spain (Aragon), Spain (Asturias), Spain (Basque country), Spain (Cantabria), Spain (Castile and León), Spain (Castile-La Mancha), Spain (Catalonia), Spain (Extremadura), Spain (Valencian region), Sweden, the Netherlands, United Kingdom (All countries)
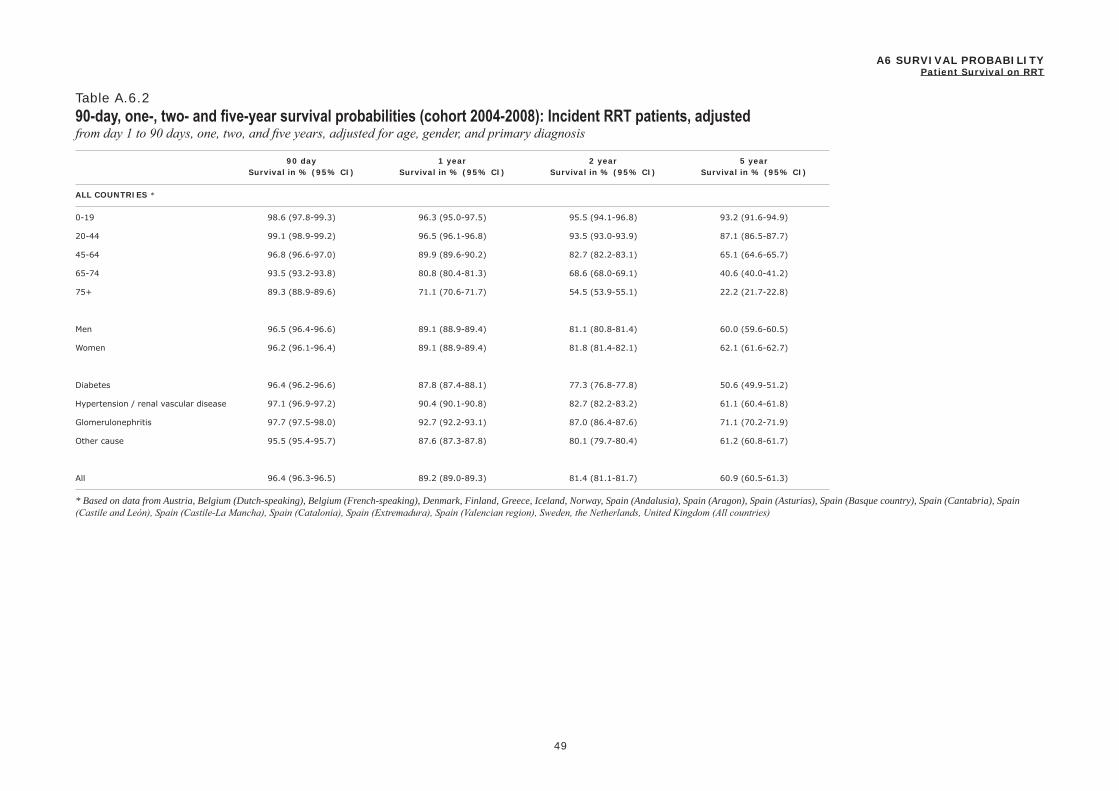
90 day 1 year 2 year 5 year
49
Survival in % (95% CI) Survival in % (95% CI) Survival in % (95% CI) Survival in % (95% CI)
ALL COUNTRIES *
A6 SURVIVAL PROBABILITYPatient Survival on RRT
Table A.6.290-day, one-, two- and five-year survival probabilities (cohort 2004-2008): Incident RRT patients, adjustedfrom day 1 to 90 days, one, two, and five years, adjusted for age, gender, and primary diagnosis
0-19 98.6 (97.8-99.3) 96.3 (95.0-97.5) 95.5 (94.1-96.8) 93.2 (91.6-94.9)
20-44 99.1 (98.9-99.2) 96.5 (96.1-96.8) 93.5 (93.0-93.9) 87.1 (86.5-87.7)
45-64 96.8 (96.6-97.0) 89.9 (89.6-90.2) 82.7 (82.2-83.1) 65.1 (64.6-65.7)
65-74 93.5 (93.2-93.8) 80.8 (80.4-81.3) 68.6 (68.0-69.1) 40.6 (40.0-41.2)
75+ 89.3 (88.9-89.6) 71.1 (70.6-71.7) 54.5 (53.9-55.1) 22.2 (21.7-22.8)
Men 96.5 (96.4-96.6) 89.1 (88.9-89.4) 81.1 (80.8-81.4) 60.0 (59.6-60.5)
Women 96.2 (96.1-96.4) 89.1 (88.9-89.4) 81.8 (81.4-82.1) 62.1 (61.6-62.7)
Diabetes 96.4 (96.2-96.6) 87.8 (87.4-88.1) 77.3 (76.8-77.8) 50.6 (49.9-51.2)
Hypertension / renal vascular disease 97.1 (96.9-97.2) 90.4 (90.1-90.8) 82.7 (82.2-83.2) 61.1 (60.4-61.8)
Glomerulonephritis 97.7 (97.5-98.0) 92.7 (92.2-93.1) 87.0 (86.4-87.6) 71.1 (70.2-71.9)
Other cause 95.5 (95.4-95.7) 87.6 (87.3-87.8) 80.1 (79.7-80.4) 61.2 (60.8-61.7)
All 96.4 (96.3-96.5) 89.2 (89.0-89.3) 81.4 (81.1-81.7) 60.9 (60.5-61.3)
* Based on data from Austria, Belgium (Dutch-speaking), Belgium (French-speaking), Denmark, Finland, Greece, Iceland, Norway, Spain (Andalusia), Spain (Aragon), Spain (Asturias), Spain (Basque country), Spain (Cantabria), Spain (Castile and León), Spain (Castile-La Mancha), Spain (Catalonia), Spain (Extremadura), Spain (Valencian region), Sweden, the Netherlands, United Kingdom (All countries)
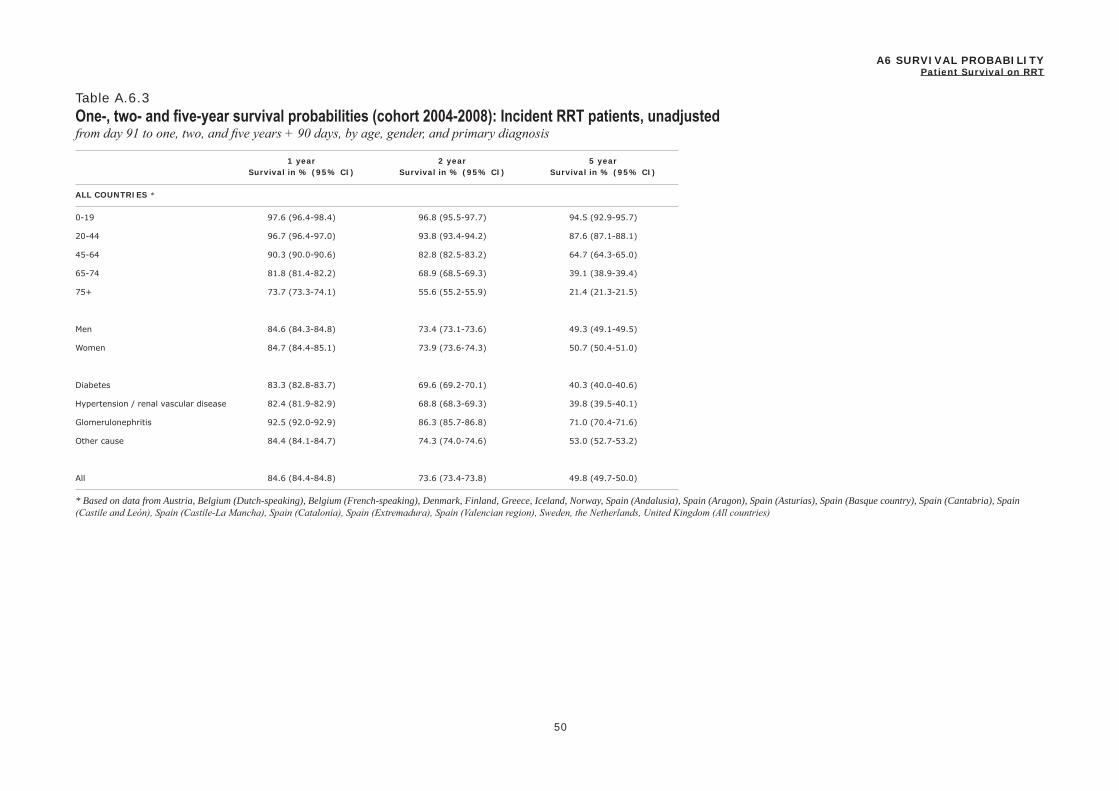
1 year 2 year 5 year
50
Survival in % (95% CI) Survival in % (95% CI) Survival in % (95% CI)
ALL COUNTRIES *
A6 SURVIVAL PROBABILITYPatient Survival on RRT
Table A.6.3One-, two- and five-year survival probabilities (cohort 2004-2008): Incident RRT patients, unadjustedfrom day 91 to one, two, and five years + 90 days, by age, gender, and primary diagnosis
0-19 97.6 (96.4-98.4) 96.8 (95.5-97.7) 94.5 (92.9-95.7)
20-44 96.7 (96.4-97.0) 93.8 (93.4-94.2) 87.6 (87.1-88.1)
45-64 90.3 (90.0-90.6) 82.8 (82.5-83.2) 64.7 (64.3-65.0)
65-74 81.8 (81.4-82.2) 68.9 (68.5-69.3) 39.1 (38.9-39.4)
75+ 73.7 (73.3-74.1) 55.6 (55.2-55.9) 21.4 (21.3-21.5)
Men 84.6 (84.3-84.8) 73.4 (73.1-73.6) 49.3 (49.1-49.5)
Women 84.7 (84.4-85.1) 73.9 (73.6-74.3) 50.7 (50.4-51.0)
Diabetes 83.3 (82.8-83.7) 69.6 (69.2-70.1) 40.3 (40.0-40.6)
Hypertension / renal vascular disease 82.4 (81.9-82.9) 68.8 (68.3-69.3) 39.8 (39.5-40.1)
Glomerulonephritis 92.5 (92.0-92.9) 86.3 (85.7-86.8) 71.0 (70.4-71.6)
Other cause 84.4 (84.1-84.7) 74.3 (74.0-74.6) 53.0 (52.7-53.2)
All 84.6 (84.4-84.8) 73.6 (73.4-73.8) 49.8 (49.7-50.0)
* Based on data from Austria, Belgium (Dutch-speaking), Belgium (French-speaking), Denmark, Finland, Greece, Iceland, Norway, Spain (Andalusia), Spain (Aragon), Spain (Asturias), Spain (Basque country), Spain (Cantabria), Spain (Castile and León), Spain (Castile-La Mancha), Spain (Catalonia), Spain (Extremadura), Spain (Valencian region), Sweden, the Netherlands, United Kingdom (All countries)
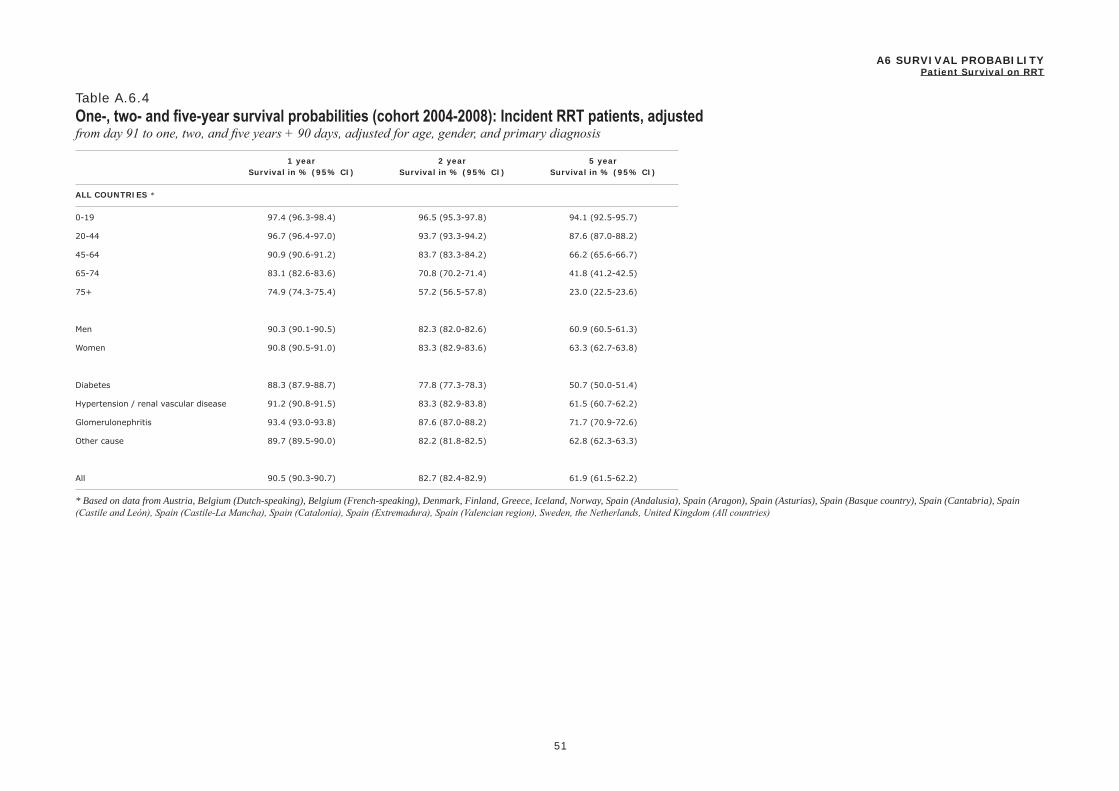
1 year 2 year 5 year
51
Survival in % (95% CI) Survival in % (95% CI) Survival in % (95% CI)
ALL COUNTRIES *
A6 SURVIVAL PROBABILITYPatient Survival on RRT
Table A.6.4One-, two- and five-year survival probabilities (cohort 2004-2008): Incident RRT patients, adjustedfrom day 91 to one, two, and five years + 90 days, adjusted for age, gender, and primary diagnosis
0-19 97.4 (96.3-98.4) 96.5 (95.3-97.8) 94.1 (92.5-95.7)
20-44 96.7 (96.4-97.0) 93.7 (93.3-94.2) 87.6 (87.0-88.2)
45-64 90.9 (90.6-91.2) 83.7 (83.3-84.2) 66.2 (65.6-66.7)
65-74 83.1 (82.6-83.6) 70.8 (70.2-71.4) 41.8 (41.2-42.5)
75+ 74.9 (74.3-75.4) 57.2 (56.5-57.8) 23.0 (22.5-23.6)
Men 90.3 (90.1-90.5) 82.3 (82.0-82.6) 60.9 (60.5-61.3)
Women 90.8 (90.5-91.0) 83.3 (82.9-83.6) 63.3 (62.7-63.8)
Diabetes 88.3 (87.9-88.7) 77.8 (77.3-78.3) 50.7 (50.0-51.4)
Hypertension / renal vascular disease 91.2 (90.8-91.5) 83.3 (82.9-83.8) 61.5 (60.7-62.2)
Glomerulonephritis 93.4 (93.0-93.8) 87.6 (87.0-88.2) 71.7 (70.9-72.6)
Other cause 89.7 (89.5-90.0) 82.2 (81.8-82.5) 62.8 (62.3-63.3)
All 90.5 (90.3-90.7) 82.7 (82.4-82.9) 61.9 (61.5-62.2)
* Based on data from Austria, Belgium (Dutch-speaking), Belgium (French-speaking), Denmark, Finland, Greece, Iceland, Norway, Spain (Andalusia), Spain (Aragon), Spain (Asturias), Spain (Basque country), Spain (Cantabria), Spain (Castile and León), Spain (Castile-La Mancha), Spain (Catalonia), Spain (Extremadura), Spain (Valencian region), Sweden, the Netherlands, United Kingdom (All countries)
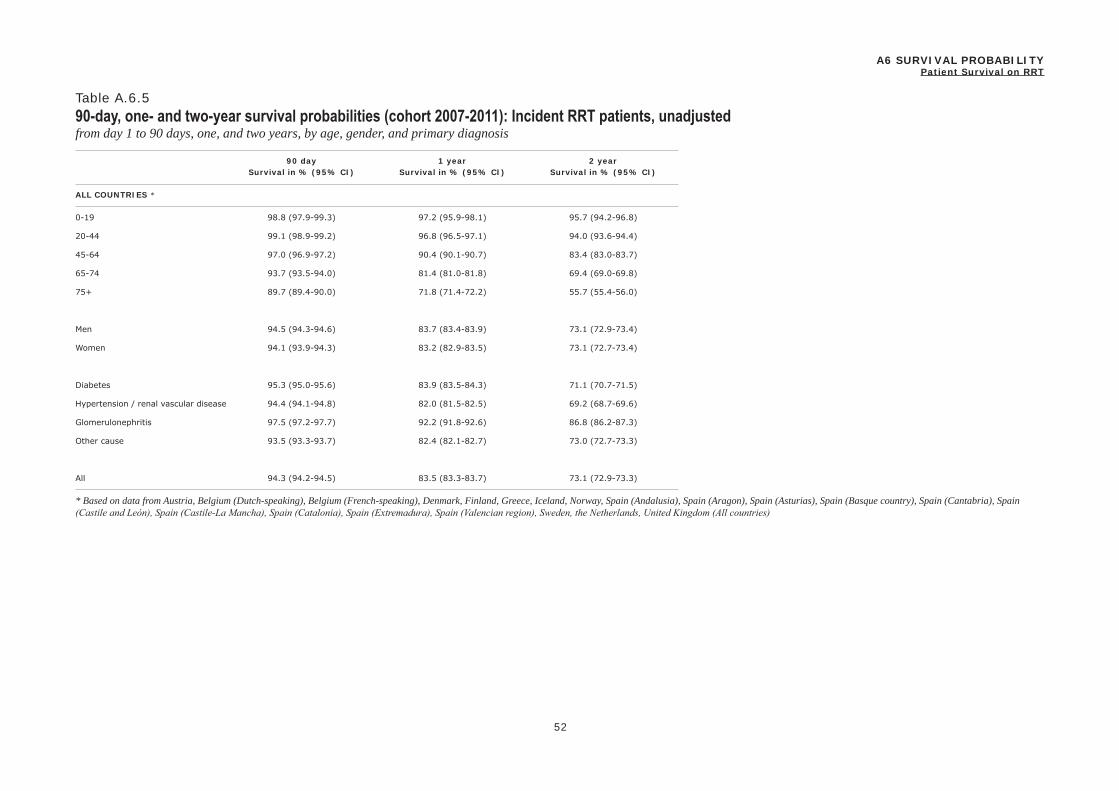
90 day 1 year 2 year
52
Survival in % (95% CI) Survival in % (95% CI) Survival in % (95% CI)
ALL COUNTRIES *
A6 SURVIVAL PROBABILITYPatient Survival on RRT
Table A.6.590-day, one- and two-year survival probabilities (cohort 2007-2011): Incident RRT patients, unadjustedfrom day 1 to 90 days, one, and two years, by age, gender, and primary diagnosis
0-19 98.8 (97.9-99.3) 97.2 (95.9-98.1) 95.7 (94.2-96.8)
20-44 99.1 (98.9-99.2) 96.8 (96.5-97.1) 94.0 (93.6-94.4)
45-64 97.0 (96.9-97.2) 90.4 (90.1-90.7) 83.4 (83.0-83.7)
65-74 93.7 (93.5-94.0) 81.4 (81.0-81.8) 69.4 (69.0-69.8)
75+ 89.7 (89.4-90.0) 71.8 (71.4-72.2) 55.7 (55.4-56.0)
Men 94.5 (94.3-94.6) 83.7 (83.4-83.9) 73.1 (72.9-73.4)
Women 94.1 (93.9-94.3) 83.2 (82.9-83.5) 73.1 (72.7-73.4)
Diabetes 95.3 (95.0-95.6) 83.9 (83.5-84.3) 71.1 (70.7-71.5)
Hypertension / renal vascular disease 94.4 (94.1-94.8) 82.0 (81.5-82.5) 69.2 (68.7-69.6)
Glomerulonephritis 97.5 (97.2-97.7) 92.2 (91.8-92.6) 86.8 (86.2-87.3)
Other cause 93.5 (93.3-93.7) 82.4 (82.1-82.7) 73.0 (72.7-73.3)
All 94.3 (94.2-94.5) 83.5 (83.3-83.7) 73.1 (72.9-73.3)
* Based on data from Austria, Belgium (Dutch-speaking), Belgium (French-speaking), Denmark, Finland, Greece, Iceland, Norway, Spain (Andalusia), Spain (Aragon), Spain (Asturias), Spain (Basque country), Spain (Cantabria), Spain (Castile and León), Spain (Castile-La Mancha), Spain (Catalonia), Spain (Extremadura), Spain (Valencian region), Sweden, the Netherlands, United Kingdom (All countries)

90 day 1 year 2 year
53
Survival in % (95% CI) Survival in % (95% CI) Survival in % (95% CI)
ALL COUNTRIES *
A6 SURVIVAL PROBABILITYPatient Survival on RRT
Table A.6.690-day, one- and two-year survival probabilities (cohort 2007-2011): Incident RRT patients, adjustedfrom day 1 to 90 days, one, and two years, adjusted for age, gender, and primary diagnosis
0-19 98.7 (97.9-99.4) 97.1 (96.0-98.2) 95.6 (94.2-97.0)
20-44 99.1 (99.0-99.3) 96.9 (96.6-97.2) 94.1 (93.7-94.5)
45-64 97.3 (97.1-97.5) 91.0 (90.7-91.3) 84.3 (83.9-84.7)
65-74 94.3 (94.0-94.6) 82.7 (82.3-83.2) 71.2 (70.7-71.7)
75+ 90.4 (90.1-90.7) 73.2 (72.7-73.7) 57.5 (56.9-58.1)
Men 96.8 (96.7-96.9) 90.0 (89.8-90.2) 82.6 (82.3-82.9)
Women 96.7 (96.5-96.8) 90.0 (89.7-90.2) 82.9 (82.5-83.3)
Diabetes 96.9 (96.8-97.1) 89.0 (88.7-89.4) 79.4 (78.9-79.9)
Hypertension / renal vascular disease 97.3 (97.2-97.5) 91.0 (90.6-91.3) 83.5 (83.0-84.0)
Glomerulonephritis 97.8 (97.6-98.0) 93.2 (92.8-93.6) 88.1 (87.5-88.7)
Other cause 96.0 (95.8-96.1) 88.6 (88.3-88.8) 81.5 (81.2-81.9)
All 96.8 (96.7-96.9) 90.0 (89.8-90.2) 82.7 (82.5-83.0)
* Based on data from Austria, Belgium (Dutch-speaking), Belgium (French-speaking), Denmark, Finland, Greece, Iceland, Norway, Spain (Andalusia), Spain (Aragon), Spain (Asturias), Spain (Basque country), Spain (Cantabria), Spain (Castile and León), Spain (Castile-La Mancha), Spain (Catalonia), Spain (Extremadura), Spain (Valencian region), Sweden, the Netherlands, United Kingdom (All countries)
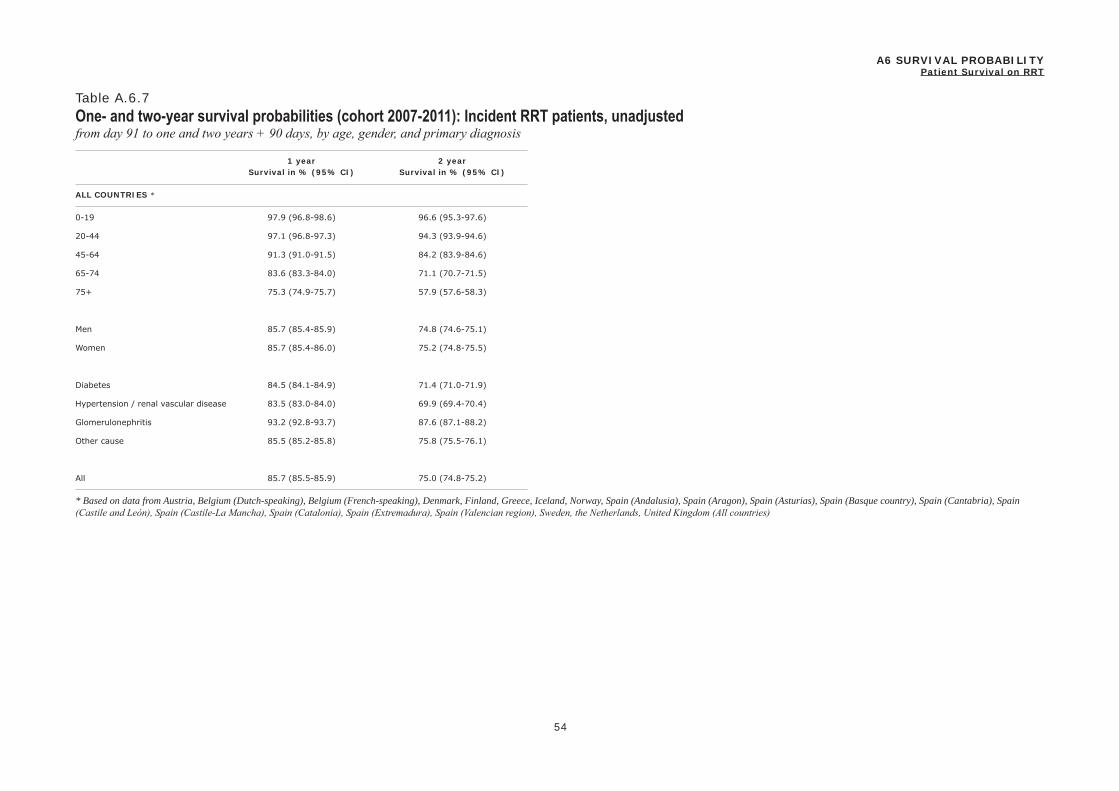
1 year 2 year
54
Survival in % (95% CI) Survival in % (95% CI)
ALL COUNTRIES *
A6 SURVIVAL PROBABILITYPatient Survival on RRT
Table A.6.7One- and two-year survival probabilities (cohort 2007-2011): Incident RRT patients, unadjustedfrom day 91 to one and two years + 90 days, by age, gender, and primary diagnosis
0-19 97.9 (96.8-98.6) 96.6 (95.3-97.6)
20-44 97.1 (96.8-97.3) 94.3 (93.9-94.6)
45-64 91.3 (91.0-91.5) 84.2 (83.9-84.6)
65-74 83.6 (83.3-84.0) 71.1 (70.7-71.5)
75+ 75.3 (74.9-75.7) 57.9 (57.6-58.3)
Men 85.7 (85.4-85.9) 74.8 (74.6-75.1)
Women 85.7 (85.4-86.0) 75.2 (74.8-75.5)
Diabetes 84.5 (84.1-84.9) 71.4 (71.0-71.9)
Hypertension / renal vascular disease 83.5 (83.0-84.0) 69.9 (69.4-70.4)
Glomerulonephritis 93.2 (92.8-93.7) 87.6 (87.1-88.2)
Other cause 85.5 (85.2-85.8) 75.8 (75.5-76.1)
All 85.7 (85.5-85.9) 75.0 (74.8-75.2)
* Based on data from Austria, Belgium (Dutch-speaking), Belgium (French-speaking), Denmark, Finland, Greece, Iceland, Norway, Spain (Andalusia), Spain (Aragon), Spain (Asturias), Spain (Basque country), Spain (Cantabria), Spain (Castile and León), Spain (Castile-La Mancha), Spain (Catalonia), Spain (Extremadura), Spain (Valencian region), Sweden, the Netherlands, United Kingdom (All countries)

1 year 2 year
55
Survival in % (95% CI) Survival in % (95% CI)
ALL COUNTRIES *
A6 SURVIVAL PROBABILITYPatient Survival on RRT
Table A.6.8One- and two-year survival probabilities (cohort 2007-2011): Incident RRT patients, adjustedfrom day 91 to one and two years + 90 days, adjusted for age, gender, and primary diagnosis
0-19 97.9 (96.9-98.8) 96.6 (95.3-97.8)
20-44 97.1 (96.8-97.4) 94.3 (93.9-94.7)
45-64 91.8 (91.5-92.1) 85.2 (84.8-85.6)
65-74 84.7 (84.3-85.2) 73.0 (72.4-73.5)
75+ 76.4 (75.9-76.9) 59.8 (59.2-60.4)
Men 91.1 (90.9-91.3) 83.5 (83.2-83.8)
Women 91.3 (91.0-91.5) 84.0 (83.7-84.4)
Diabetes 89.3 (89.0-89.7) 79.6 (79.1-80.1)
Hypertension / renal vascular disease 91.6 (91.3-92.0) 83.8 (83.4-84.3)
Glomerulonephritis 94.0 (93.6-94.4) 88.8 (88.2-89.3)
Other cause 90.4 (90.2-90.7) 83.3 (83.0-83.6)
All 91.2 (91.0-91.3) 83.8 (83.5-84.0)
* Based on data from Austria, Belgium (Dutch-speaking), Belgium (French-speaking), Denmark, Finland, Greece, Iceland, Norway, Spain (Andalusia), Spain (Aragon), Spain (Asturias), Spain (Basque country), Spain (Cantabria), Spain (Castile and León), Spain (Castile-La Mancha), Spain (Catalonia), Spain (Extremadura), Spain (Valencian region), Sweden, the Netherlands, United Kingdom (All countries)
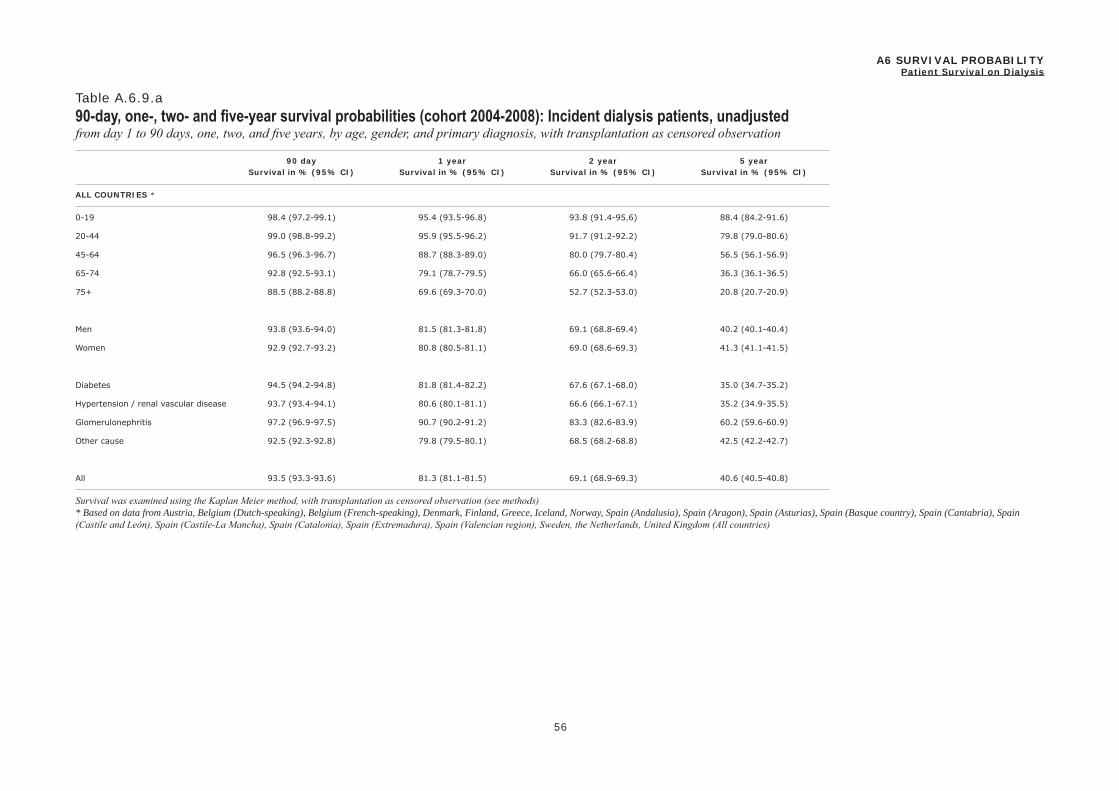
90 day 1 year 2 year 5 year
56
Survival in % (95% CI) Survival in % (95% CI) Survival in % (95% CI) Survival in % (95% CI)
ALL COUNTRIES *
A6 SURVIVAL PROBABILITYPatient Survival on Dialysis
Table A.6.9.a90-day, one-, two- and five-year survival probabilities (cohort 2004-2008): Incident dialysis patients, unadjustedfrom day 1 to 90 days, one, two, and five years, by age, gender, and primary diagnosis, with transplantation as censored observation
0-19 98.4 (97.2-99.1) 95.4 (93.5-96.8) 93.8 (91.4-95.6) 88.4 (84.2-91.6)
20-44 99.0 (98.8-99.2) 95.9 (95.5-96.2) 91.7 (91.2-92.2) 79.8 (79.0-80.6)
45-64 96.5 (96.3-96.7) 88.7 (88.3-89.0) 80.0 (79.7-80.4) 56.5 (56.1-56.9)
65-74 92.8 (92.5-93.1) 79.1 (78.7-79.5) 66.0 (65.6-66.4) 36.3 (36.1-36.5)
75+ 88.5 (88.2-88.8) 69.6 (69.3-70.0) 52.7 (52.3-53.0) 20.8 (20.7-20.9)
Men 93.8 (93.6-94.0) 81.5 (81.3-81.8) 69.1 (68.8-69.4) 40.2 (40.1-40.4)
Women 92.9 (92.7-93.2) 80.8 (80.5-81.1) 69.0 (68.6-69.3) 41.3 (41.1-41.5)
Diabetes 94.5 (94.2-94.8) 81.8 (81.4-82.2) 67.6 (67.1-68.0) 35.0 (34.7-35.2)
Hypertension / renal vascular disease 93.7 (93.4-94.1) 80.6 (80.1-81.1) 66.6 (66.1-67.1) 35.2 (34.9-35.5)
Glomerulonephritis 97.2 (96.9-97.5) 90.7 (90.2-91.2) 83.3 (82.6-83.9) 60.2 (59.6-60.9)
Other cause 92.5 (92.3-92.8) 79.8 (79.5-80.1) 68.5 (68.2-68.8) 42.5 (42.2-42.7)
All 93.5 (93.3-93.6) 81.3 (81.1-81.5) 69.1 (68.9-69.3) 40.6 (40.5-40.8)
Survival was examined using the Kaplan Meier method, with transplantation as censored observation (see methods)* Based on data from Austria, Belgium (Dutch-speaking), Belgium (French-speaking), Denmark, Finland, Greece, Iceland, Norway, Spain (Andalusia), Spain (Aragon), Spain (Asturias), Spain (Basque country), Spain (Cantabria), Spain (Castile and León), Spain (Castile-La Mancha), Spain (Catalonia), Spain (Extremadura), Spain (Valencian region), Sweden, the Netherlands, United Kingdom (All countries)
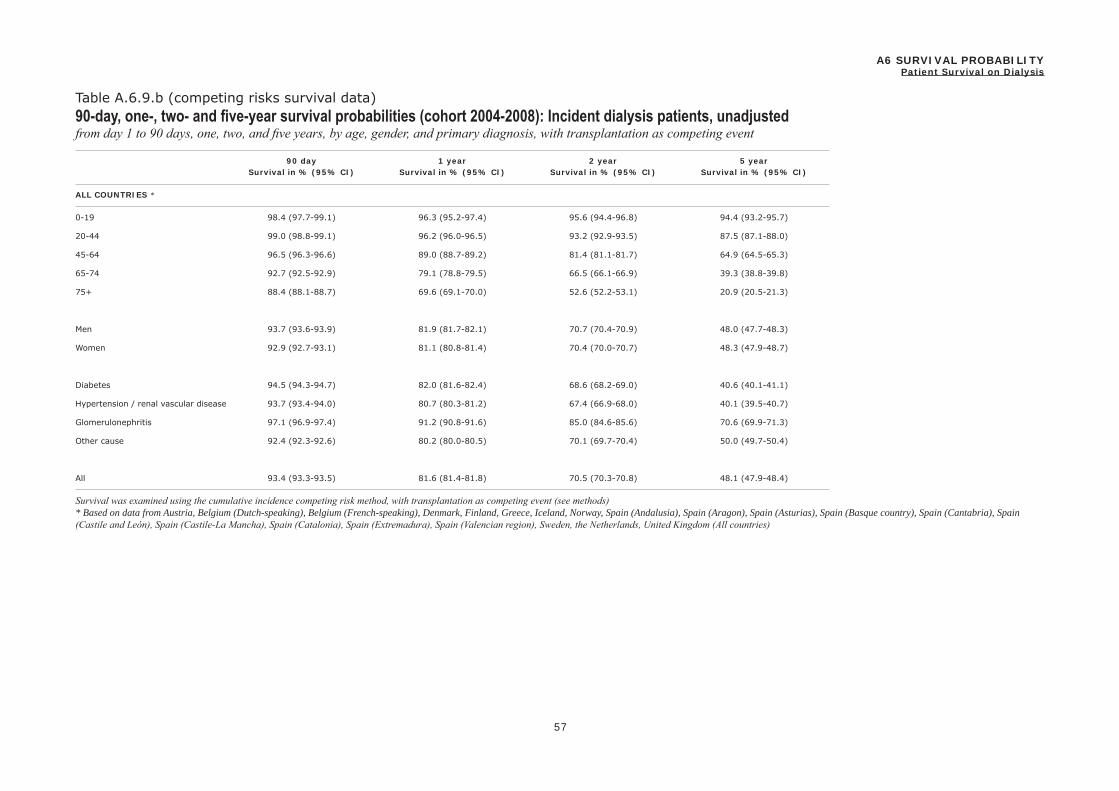
90 day 1 year 2 year 5 year
57
Survival in % (95% CI) Survival in % (95% CI) Survival in % (95% CI) Survival in % (95% CI)
ALL COUNTRIES *
A6 SURVIVAL PROBABILITYPatient Survival on Dialysis
Table A.6.9.b (competing risks survival data)90-day, one-, two- and five-year survival probabilities (cohort 2004-2008): Incident dialysis patients, unadjustedfrom day 1 to 90 days, one, two, and five years, by age, gender, and primary diagnosis, with transplantation as competing event
0-19 98.4 (97.7-99.1) 96.3 (95.2-97.4) 95.6 (94.4-96.8) 94.4 (93.2-95.7)
20-44 99.0 (98.8-99.1) 96.2 (96.0-96.5) 93.2 (92.9-93.5) 87.5 (87.1-88.0)
45-64 96.5 (96.3-96.6) 89.0 (88.7-89.2) 81.4 (81.1-81.7) 64.9 (64.5-65.3)
65-74 92.7 (92.5-92.9) 79.1 (78.8-79.5) 66.5 (66.1-66.9) 39.3 (38.8-39.8)
75+ 88.4 (88.1-88.7) 69.6 (69.1-70.0) 52.6 (52.2-53.1) 20.9 (20.5-21.3)
Men 93.7 (93.6-93.9) 81.9 (81.7-82.1) 70.7 (70.4-70.9) 48.0 (47.7-48.3)
Women 92.9 (92.7-93.1) 81.1 (80.8-81.4) 70.4 (70.0-70.7) 48.3 (47.9-48.7)
Diabetes 94.5 (94.3-94.7) 82.0 (81.6-82.4) 68.6 (68.2-69.0) 40.6 (40.1-41.1)
Hypertension / renal vascular disease 93.7 (93.4-94.0) 80.7 (80.3-81.2) 67.4 (66.9-68.0) 40.1 (39.5-40.7)
Glomerulonephritis 97.1 (96.9-97.4) 91.2 (90.8-91.6) 85.0 (84.6-85.6) 70.6 (69.9-71.3)
Other cause 92.4 (92.3-92.6) 80.2 (80.0-80.5) 70.1 (69.7-70.4) 50.0 (49.7-50.4)
All 93.4 (93.3-93.5) 81.6 (81.4-81.8) 70.5 (70.3-70.8) 48.1 (47.9-48.4)
Survival was examined using the cumulative incidence competing risk method, with transplantation as competing event (see methods)* Based on data from Austria, Belgium (Dutch-speaking), Belgium (French-speaking), Denmark, Finland, Greece, Iceland, Norway, Spain (Andalusia), Spain (Aragon), Spain (Asturias), Spain (Basque country), Spain (Cantabria), Spain (Castile and León), Spain (Castile-La Mancha), Spain (Catalonia), Spain (Extremadura), Spain (Valencian region), Sweden, the Netherlands, United Kingdom (All countries)
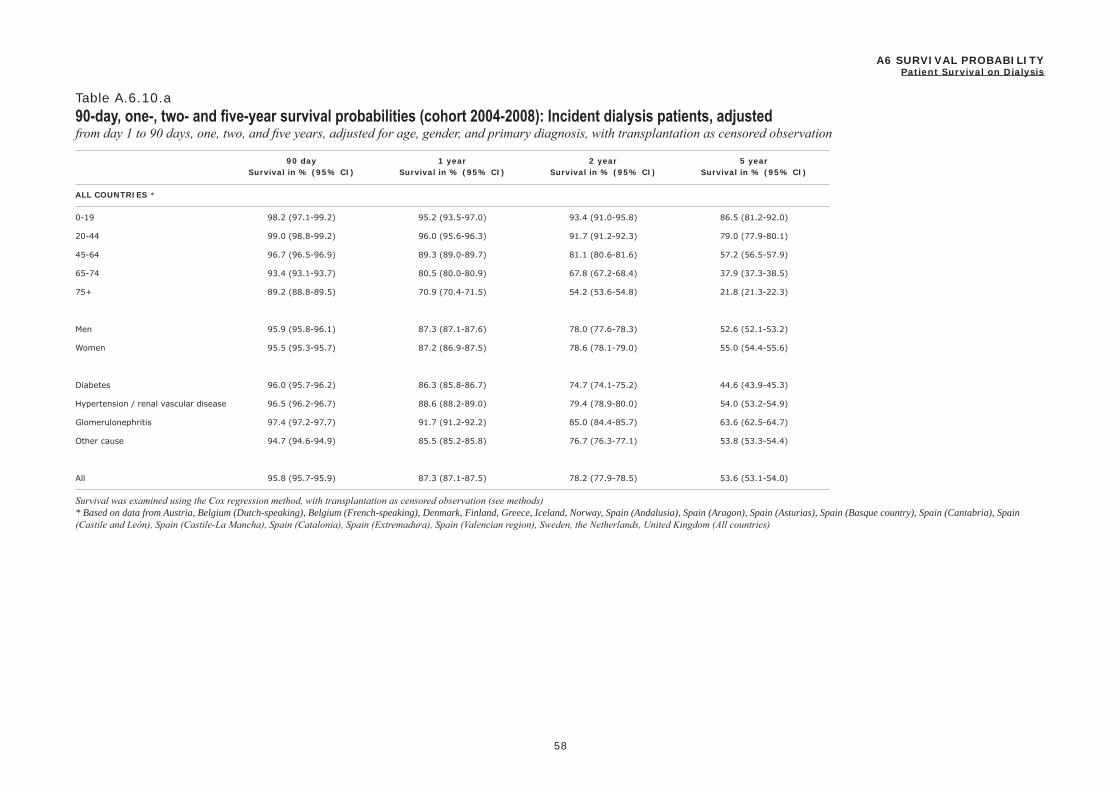
90 day 1 year 2 year 5 year
58
Survival in % (95% CI) Survival in % (95% CI) Survival in % (95% CI) Survival in % (95% CI)
ALL COUNTRIES *
A6 SURVIVAL PROBABILITYPatient Survival on Dialysis
Table A.6.10.a90-day, one-, two- and five-year survival probabilities (cohort 2004-2008): Incident dialysis patients, adjustedfrom day 1 to 90 days, one, two, and five years, adjusted for age, gender, and primary diagnosis, with transplantation as censored observation
0-19 98.2 (97.1-99.2) 95.2 (93.5-97.0) 93.4 (91.0-95.8) 86.5 (81.2-92.0)
20-44 99.0 (98.8-99.2) 96.0 (95.6-96.3) 91.7 (91.2-92.3) 79.0 (77.9-80.1)
45-64 96.7 (96.5-96.9) 89.3 (89.0-89.7) 81.1 (80.6-81.6) 57.2 (56.5-57.9)
65-74 93.4 (93.1-93.7) 80.5 (80.0-80.9) 67.8 (67.2-68.4) 37.9 (37.3-38.5)
75+ 89.2 (88.8-89.5) 70.9 (70.4-71.5) 54.2 (53.6-54.8) 21.8 (21.3-22.3)
Men 95.9 (95.8-96.1) 87.3 (87.1-87.6) 78.0 (77.6-78.3) 52.6 (52.1-53.2)
Women 95.5 (95.3-95.7) 87.2 (86.9-87.5) 78.6 (78.1-79.0) 55.0 (54.4-55.6)
Diabetes 96.0 (95.7-96.2) 86.3 (85.8-86.7) 74.7 (74.1-75.2) 44.6 (43.9-45.3)
Hypertension / renal vascular disease 96.5 (96.2-96.7) 88.6 (88.2-89.0) 79.4 (78.9-80.0) 54.0 (53.2-54.9)
Glomerulonephritis 97.4 (97.2-97.7) 91.7 (91.2-92.2) 85.0 (84.4-85.7) 63.6 (62.5-64.7)
Other cause 94.7 (94.6-94.9) 85.5 (85.2-85.8) 76.7 (76.3-77.1) 53.8 (53.3-54.4)
All 95.8 (95.7-95.9) 87.3 (87.1-87.5) 78.2 (77.9-78.5) 53.6 (53.1-54.0)
Survival was examined using the Cox regression method, with transplantation as censored observation (see methods)* Based on data from Austria, Belgium (Dutch-speaking), Belgium (French-speaking), Denmark, Finland, Greece, Iceland, Norway, Spain (Andalusia), Spain (Aragon), Spain (Asturias), Spain (Basque country), Spain (Cantabria), Spain (Castile and León), Spain (Castile-La Mancha), Spain (Catalonia), Spain (Extremadura), Spain (Valencian region), Sweden, the Netherlands, United Kingdom (All countries)
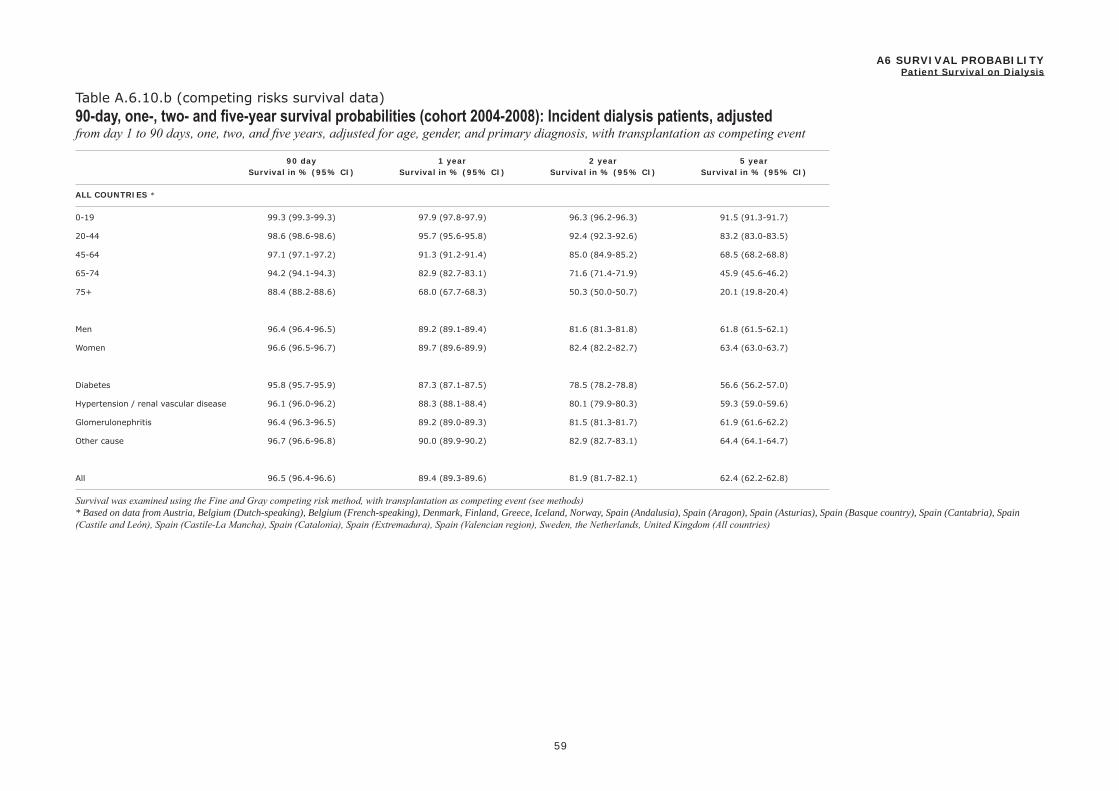
90 day 1 year 2 year 5 year
59
Survival in % (95% CI) Survival in % (95% CI) Survival in % (95% CI) Survival in % (95% CI)
ALL COUNTRIES *
A6 SURVIVAL PROBABILITYPatient Survival on Dialysis
Table A.6.10.b (competing risks survival data)90-day, one-, two- and five-year survival probabilities (cohort 2004-2008): Incident dialysis patients, adjustedfrom day 1 to 90 days, one, two, and five years, adjusted for age, gender, and primary diagnosis, with transplantation as competing event
0-19 99.3 (99.3-99.3) 97.9 (97.8-97.9) 96.3 (96.2-96.3) 91.5 (91.3-91.7)
20-44 98.6 (98.6-98.6) 95.7 (95.6-95.8) 92.4 (92.3-92.6) 83.2 (83.0-83.5)
45-64 97.1 (97.1-97.2) 91.3 (91.2-91.4) 85.0 (84.9-85.2) 68.5 (68.2-68.8)
65-74 94.2 (94.1-94.3) 82.9 (82.7-83.1) 71.6 (71.4-71.9) 45.9 (45.6-46.2)
75+ 88.4 (88.2-88.6) 68.0 (67.7-68.3) 50.3 (50.0-50.7) 20.1 (19.8-20.4)
Men 96.4 (96.4-96.5) 89.2 (89.1-89.4) 81.6 (81.3-81.8) 61.8 (61.5-62.1)
Women 96.6 (96.5-96.7) 89.7 (89.6-89.9) 82.4 (82.2-82.7) 63.4 (63.0-63.7)
Diabetes 95.8 (95.7-95.9) 87.3 (87.1-87.5) 78.5 (78.2-78.8) 56.6 (56.2-57.0)
Hypertension / renal vascular disease 96.1 (96.0-96.2) 88.3 (88.1-88.4) 80.1 (79.9-80.3) 59.3 (59.0-59.6)
Glomerulonephritis 96.4 (96.3-96.5) 89.2 (89.0-89.3) 81.5 (81.3-81.7) 61.9 (61.6-62.2)
Other cause 96.7 (96.6-96.8) 90.0 (89.9-90.2) 82.9 (82.7-83.1) 64.4 (64.1-64.7)
All 96.5 (96.4-96.6) 89.4 (89.3-89.6) 81.9 (81.7-82.1) 62.4 (62.2-62.8)
Survival was examined using the Fine and Gray competing risk method, with transplantation as competing event (see methods)* Based on data from Austria, Belgium (Dutch-speaking), Belgium (French-speaking), Denmark, Finland, Greece, Iceland, Norway, Spain (Andalusia), Spain (Aragon), Spain (Asturias), Spain (Basque country), Spain (Cantabria), Spain (Castile and León), Spain (Castile-La Mancha), Spain (Catalonia), Spain (Extremadura), Spain (Valencian region), Sweden, the Netherlands, United Kingdom (All countries)
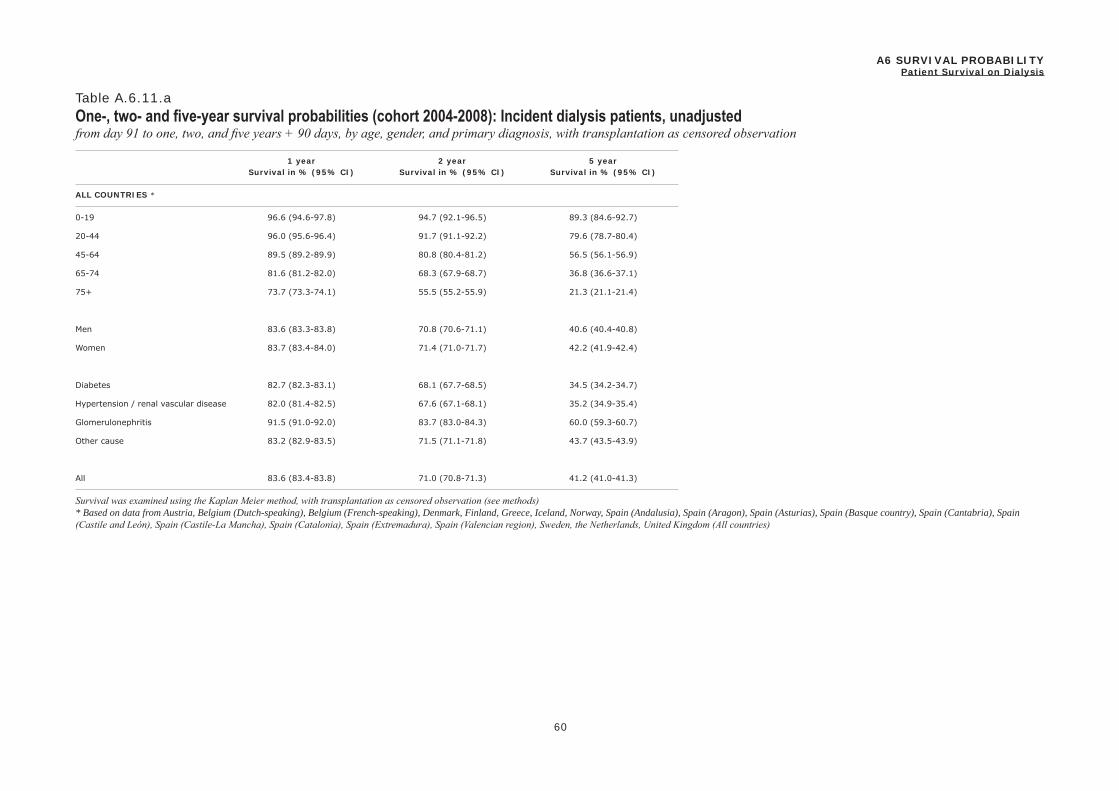
1 year 2 year 5 year
60
Survival in % (95% CI) Survival in % (95% CI) Survival in % (95% CI)
ALL COUNTRIES *
A6 SURVIVAL PROBABILITYPatient Survival on Dialysis
Table A.6.11.aOne-, two- and five-year survival probabilities (cohort 2004-2008): Incident dialysis patients, unadjustedfrom day 91 to one, two, and five years + 90 days, by age, gender, and primary diagnosis, with transplantation as censored observation
0-19 96.6 (94.6-97.8) 94.7 (92.1-96.5) 89.3 (84.6-92.7)
20-44 96.0 (95.6-96.4) 91.7 (91.1-92.2) 79.6 (78.7-80.4)
45-64 89.5 (89.2-89.9) 80.8 (80.4-81.2) 56.5 (56.1-56.9)
65-74 81.6 (81.2-82.0) 68.3 (67.9-68.7) 36.8 (36.6-37.1)
75+ 73.7 (73.3-74.1) 55.5 (55.2-55.9) 21.3 (21.1-21.4)
Men 83.6 (83.3-83.8) 70.8 (70.6-71.1) 40.6 (40.4-40.8)
Women 83.7 (83.4-84.0) 71.4 (71.0-71.7) 42.2 (41.9-42.4)
Diabetes 82.7 (82.3-83.1) 68.1 (67.7-68.5) 34.5 (34.2-34.7)
Hypertension / renal vascular disease 82.0 (81.4-82.5) 67.6 (67.1-68.1) 35.2 (34.9-35.4)
Glomerulonephritis 91.5 (91.0-92.0) 83.7 (83.0-84.3) 60.0 (59.3-60.7)
Other cause 83.2 (82.9-83.5) 71.5 (71.1-71.8) 43.7 (43.5-43.9)
All 83.6 (83.4-83.8) 71.0 (70.8-71.3) 41.2 (41.0-41.3)
Survival was examined using the Kaplan Meier method, with transplantation as censored observation (see methods)* Based on data from Austria, Belgium (Dutch-speaking), Belgium (French-speaking), Denmark, Finland, Greece, Iceland, Norway, Spain (Andalusia), Spain (Aragon), Spain (Asturias), Spain (Basque country), Spain (Cantabria), Spain (Castile and León), Spain (Castile-La Mancha), Spain (Catalonia), Spain (Extremadura), Spain (Valencian region), Sweden, the Netherlands, United Kingdom (All countries)
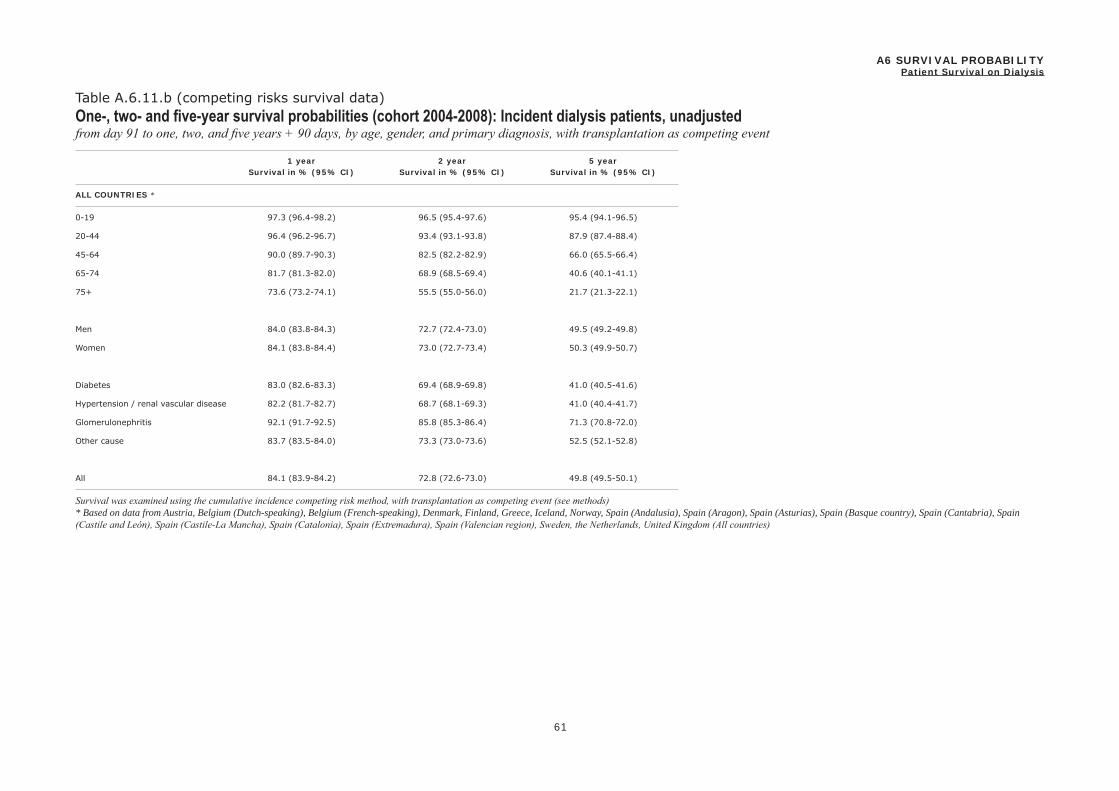
1 year 2 year 5 year
61
Survival in % (95% CI) Survival in % (95% CI) Survival in % (95% CI)
ALL COUNTRIES *
A6 SURVIVAL PROBABILITYPatient Survival on Dialysis
Table A.6.11.b (competing risks survival data)One-, two- and five-year survival probabilities (cohort 2004-2008): Incident dialysis patients, unadjustedfrom day 91 to one, two, and five years + 90 days, by age, gender, and primary diagnosis, with transplantation as competing event
0-19 97.3 (96.4-98.2) 96.5 (95.4-97.6) 95.4 (94.1-96.5)
20-44 96.4 (96.2-96.7) 93.4 (93.1-93.8) 87.9 (87.4-88.4)
45-64 90.0 (89.7-90.3) 82.5 (82.2-82.9) 66.0 (65.5-66.4)
65-74 81.7 (81.3-82.0) 68.9 (68.5-69.4) 40.6 (40.1-41.1)
75+ 73.6 (73.2-74.1) 55.5 (55.0-56.0) 21.7 (21.3-22.1)
Men 84.0 (83.8-84.3) 72.7 (72.4-73.0) 49.5 (49.2-49.8)
Women 84.1 (83.8-84.4) 73.0 (72.7-73.4) 50.3 (49.9-50.7)
Diabetes 83.0 (82.6-83.3) 69.4 (68.9-69.8) 41.0 (40.5-41.6)
Hypertension / renal vascular disease 82.2 (81.7-82.7) 68.7 (68.1-69.3) 41.0 (40.4-41.7)
Glomerulonephritis 92.1 (91.7-92.5) 85.8 (85.3-86.4) 71.3 (70.8-72.0)
Other cause 83.7 (83.5-84.0) 73.3 (73.0-73.6) 52.5 (52.1-52.8)
All 84.1 (83.9-84.2) 72.8 (72.6-73.0) 49.8 (49.5-50.1)
Survival was examined using the cumulative incidence competing risk method, with transplantation as competing event (see methods)* Based on data from Austria, Belgium (Dutch-speaking), Belgium (French-speaking), Denmark, Finland, Greece, Iceland, Norway, Spain (Andalusia), Spain (Aragon), Spain (Asturias), Spain (Basque country), Spain (Cantabria), Spain (Castile and León), Spain (Castile-La Mancha), Spain (Catalonia), Spain (Extremadura), Spain (Valencian region), Sweden, the Netherlands, United Kingdom (All countries)

1 year 2 year 5 year
62
Survival in % (95% CI) Survival in % (95% CI) Survival in % (95% CI)
ALL COUNTRIES *
A6 SURVIVAL PROBABILITYPatient Survival on Dialysis
Table A.6.12.aOne-, two- and five-year survival probabilities (cohort 2004-2008): Incident dialysis patients, adjustedfrom day 91 to one, two, and five years + 90 days, adjusted for age, gender, and primary diagnosis, with transplantation as censored observation
0-19 96.4 (94.7-98.1) 94.0 (91.3-96.7) 86.3 (80.4-92.7)
20-44 96.0 (95.6-96.4) 91.7 (91.1-92.3) 78.9 (77.8-80.0)
45-64 90.2 (89.8-90.5) 81.8 (81.3-82.3) 57.5 (56.8-58.2)
65-74 82.7 (82.2-83.2) 69.9 (69.3-70.5) 38.8 (38.1-39.4)
75+ 74.6 (74.0-75.2) 56.8 (56.1-57.4) 22.5 (22.0-23.1)
Men 88.5 (88.2-88.7) 78.9 (78.6-79.3) 52.7 (52.2-53.3)
Women 88.9 (88.6-89.2) 79.9 (79.5-80.3) 55.4 (54.8-56.1)
Diabetes 86.7 (86.3-87.1) 74.8 (74.3-75.4) 44.1 (43.3-44.8)
Hypertension / renal vascular disease 89.2 (88.8-89.6) 79.8 (79.2-80.4) 53.7 (52.9-54.6)
Glomerulonephritis 92.4 (91.9-92.9) 85.4 (84.7-86.1) 63.5 (62.4-64.7)
Other cause 87.8 (87.5-88.1) 78.7 (78.3-79.1) 54.7 (54.1-55.3)
All 88.7 (88.5-88.9) 79.3 (79.0-79.6) 53.8 (53.4-54.3)
Survival was examined using the Cox regression method, with transplantation as censored observation (see methods)* Based on data from Austria, Belgium (Dutch-speaking), Belgium (French-speaking), Denmark, Finland, Greece, Iceland, Norway, Spain (Andalusia), Spain (Aragon), Spain (Asturias), Spain (Basque country), Spain (Cantabria), Spain (Castile and León), Spain (Castile-La Mancha), Spain (Catalonia), Spain (Extremadura), Spain (Valencian region), Sweden, the Netherlands, United Kingdom (All countries)

1 year 2 year 5 year
63
Survival in % (95% CI) Survival in % (95% CI) Survival in % (95% CI)
ALL COUNTRIES *
A6 SURVIVAL PROBABILITYPatient Survival on Dialysis
Table A.6.12.b (competing risks survival data)One-, two- and five-year survival probabilities (cohort 2004-2008): Incident dialysis patients, adjustedfrom day 91 to one, two, and five years + 90 days, adjusted for age, gender, and primary diagnosis, with transplantation as competing event
0-19 98.1 (98.1-98.2) 96.5 (96.4-96.6) 91.7 (91.5-91.9)
20-44 96.2 (96.1-96.3) 93.0 (92.9-93.1) 83.7 (83.4-84.0)
45-64 92.4 (92.3-92.5) 86.1 (85.9-86.3) 69.3 (69.0-69.6)
65-74 84.9 (84.8-85.1) 73.5 (73.2-73.7) 47.0 (46.7-47.3)
75+ 71.4 (71.1-71.8) 53.0 (52.6-53.3) 21.1 (20.8-21.5)
Men 90.5 (90.3-90.6) 82.7 (82.5-82.9) 62.5 (62.1-62.9)
Women 91.1 (90.9-91.2) 83.7 (83.5-84.0) 64.5 (64.1-64.9)
Diabetes 88.4 (88.2-88.6) 79.2 (78.9-79.4) 56.3 (55.8-56.7)
Hypertension / renal vascular disease 89.5 (89.4-89.7) 81.1 (80.9-81.3) 59.7 (59.3-60.0)
Glomerulonephritis 90.5 (90.4-90.7) 82.8 (82.6-83.0) 62.9 (62.6-63.2)
Other cause 91.5 (91.3-91.6) 84.5 (84.2-84.7) 66.0 (65.6-66.4)
All 90.7 (90.6-90.8) 83.1 (82.9-83.3) 63.3 (63.0-63.6)
Survival was examined using the Fine and Gray competing risk method, with transplantation as competing event (see methods)* Based on data from Austria, Belgium (Dutch-speaking), Belgium (French-speaking), Denmark, Finland, Greece, Iceland, Norway, Spain (Andalusia), Spain (Aragon), Spain (Asturias), Spain (Basque country), Spain (Cantabria), Spain (Castile and León), Spain (Castile-La Mancha), Spain (Catalonia), Spain (Extremadura), Spain (Valencian region), Sweden, the Netherlands, United Kingdom (All countries)
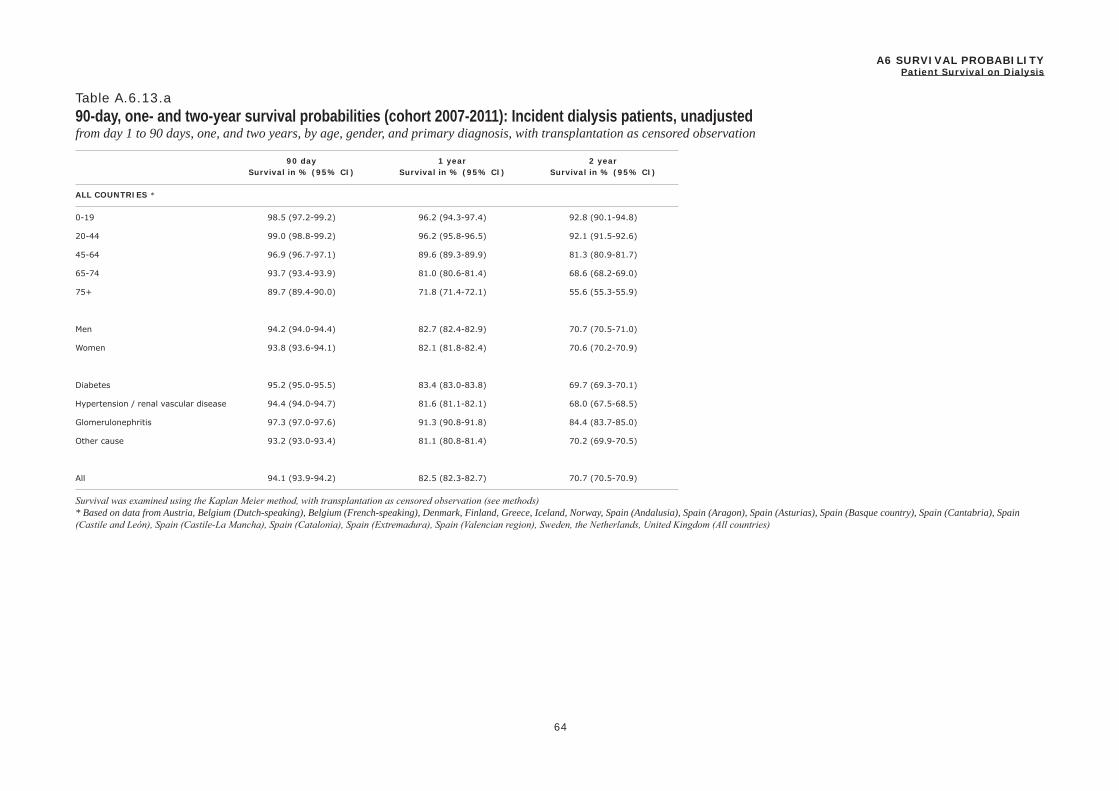
90 day 1 year 2 year
64
Survival in % (95% CI) Survival in % (95% CI) Survival in % (95% CI)
ALL COUNTRIES *
A6 SURVIVAL PROBABILITYPatient Survival on Dialysis
Table A.6.13.a90-day, one- and two-year survival probabilities (cohort 2007-2011): Incident dialysis patients, unadjustedfrom day 1 to 90 days, one, and two years, by age, gender, and primary diagnosis, with transplantation as censored observation
0-19 98.5 (97.2-99.2) 96.2 (94.3-97.4) 92.8 (90.1-94.8)
20-44 99.0 (98.8-99.2) 96.2 (95.8-96.5) 92.1 (91.5-92.6)
45-64 96.9 (96.7-97.1) 89.6 (89.3-89.9) 81.3 (80.9-81.7)
65-74 93.7 (93.4-93.9) 81.0 (80.6-81.4) 68.6 (68.2-69.0)
75+ 89.7 (89.4-90.0) 71.8 (71.4-72.1) 55.6 (55.3-55.9)
Men 94.2 (94.0-94.4) 82.7 (82.4-82.9) 70.7 (70.5-71.0)
Women 93.8 (93.6-94.1) 82.1 (81.8-82.4) 70.6 (70.2-70.9)
Diabetes 95.2 (95.0-95.5) 83.4 (83.0-83.8) 69.7 (69.3-70.1)
Hypertension / renal vascular disease 94.4 (94.0-94.7) 81.6 (81.1-82.1) 68.0 (67.5-68.5)
Glomerulonephritis 97.3 (97.0-97.6) 91.3 (90.8-91.8) 84.4 (83.7-85.0)
Other cause 93.2 (93.0-93.4) 81.1 (80.8-81.4) 70.2 (69.9-70.5)
All 94.1 (93.9-94.2) 82.5 (82.3-82.7) 70.7 (70.5-70.9)
Survival was examined using the Kaplan Meier method, with transplantation as censored observation (see methods)* Based on data from Austria, Belgium (Dutch-speaking), Belgium (French-speaking), Denmark, Finland, Greece, Iceland, Norway, Spain (Andalusia), Spain (Aragon), Spain (Asturias), Spain (Basque country), Spain (Cantabria), Spain (Castile and León), Spain (Castile-La Mancha), Spain (Catalonia), Spain (Extremadura), Spain (Valencian region), Sweden, the Netherlands, United Kingdom (All countries)
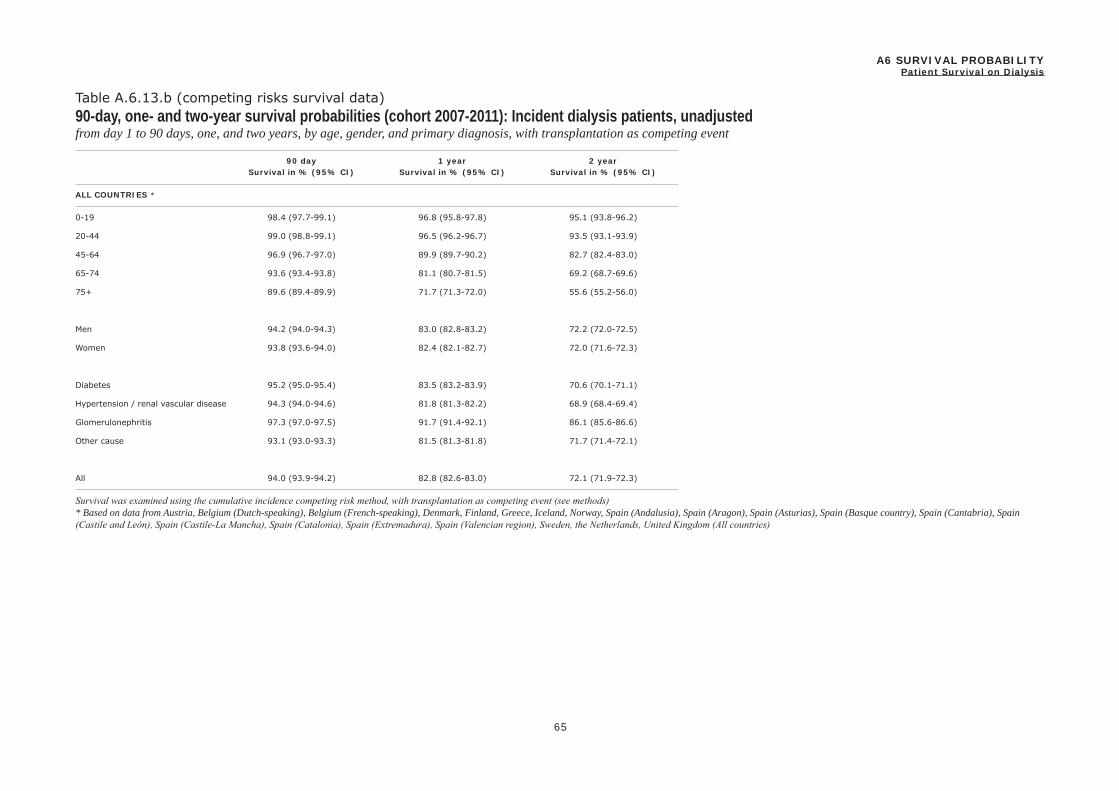
90 day 1 year 2 year
65
Survival in % (95% CI) Survival in % (95% CI) Survival in % (95% CI)
ALL COUNTRIES *
A6 SURVIVAL PROBABILITYPatient Survival on Dialysis
Table A.6.13.b (competing risks survival data)90-day, one- and two-year survival probabilities (cohort 2007-2011): Incident dialysis patients, unadjustedfrom day 1 to 90 days, one, and two years, by age, gender, and primary diagnosis, with transplantation as competing event
0-19 98.4 (97.7-99.1) 96.8 (95.8-97.8) 95.1 (93.8-96.2)
20-44 99.0 (98.8-99.1) 96.5 (96.2-96.7) 93.5 (93.1-93.9)
45-64 96.9 (96.7-97.0) 89.9 (89.7-90.2) 82.7 (82.4-83.0)
65-74 93.6 (93.4-93.8) 81.1 (80.7-81.5) 69.2 (68.7-69.6)
75+ 89.6 (89.4-89.9) 71.7 (71.3-72.0) 55.6 (55.2-56.0)
Men 94.2 (94.0-94.3) 83.0 (82.8-83.2) 72.2 (72.0-72.5)
Women 93.8 (93.6-94.0) 82.4 (82.1-82.7) 72.0 (71.6-72.3)
Diabetes 95.2 (95.0-95.4) 83.5 (83.2-83.9) 70.6 (70.1-71.1)
Hypertension / renal vascular disease 94.3 (94.0-94.6) 81.8 (81.3-82.2) 68.9 (68.4-69.4)
Glomerulonephritis 97.3 (97.0-97.5) 91.7 (91.4-92.1) 86.1 (85.6-86.6)
Other cause 93.1 (93.0-93.3) 81.5 (81.3-81.8) 71.7 (71.4-72.1)
All 94.0 (93.9-94.2) 82.8 (82.6-83.0) 72.1 (71.9-72.3)
Survival was examined using the cumulative incidence competing risk method, with transplantation as competing event (see methods)* Based on data from Austria, Belgium (Dutch-speaking), Belgium (French-speaking), Denmark, Finland, Greece, Iceland, Norway, Spain (Andalusia), Spain (Aragon), Spain (Asturias), Spain (Basque country), Spain (Cantabria), Spain (Castile and León), Spain (Castile-La Mancha), Spain (Catalonia), Spain (Extremadura), Spain (Valencian region), Sweden, the Netherlands, United Kingdom (All countries)

90 day 1 year 2 year
66
Survival in % (95% CI) Survival in % (95% CI) Survival in % (95% CI)
ALL COUNTRIES *
A6 SURVIVAL PROBABILITYPatient Survival on Dialysis
Table A.6.14.a90-day, one- and two-year survival probabilities (cohort 2007-2011): Incident dialysis patients, adjustedfrom day 1 to 90 days, one, and two years, adjusted for age, gender, and primary diagnosis, with transplantation as censored observation
0-19 98.3 (97.3-99.3) 96.0 (94.4-97.7) 92.5 (89.9-95.2)
20-44 99.0 (98.9-99.2) 96.4 (96.0-96.7) 92.2 (91.7-92.8)
45-64 97.1 (97.0-97.3) 90.3 (90.0-90.6) 82.3 (81.9-82.8)
65-74 94.2 (93.9-94.5) 82.3 (81.8-82.7) 70.2 (69.6-70.8)
75+ 90.3 (90.0-90.7) 73.0 (72.5-73.5) 57.2 (56.6-57.8)
Men 96.4 (96.2-96.5) 88.6 (88.3-88.8) 79.9 (79.6-80.3)
Women 96.2 (96.0-96.3) 88.4 (88.1-88.7) 80.2 (79.8-80.6)
Diabetes 96.6 (96.4-96.8) 87.9 (87.5-88.2) 77.2 (76.7-77.7)
Hypertension / renal vascular disease 96.9 (96.7-97.1) 89.5 (89.2-89.9) 80.9 (80.4-81.4)
Glomerulonephritis 97.6 (97.3-97.8) 92.4 (91.9-92.8) 86.3 (85.6-86.9)
Other cause 95.4 (95.2-95.5) 86.9 (86.6-87.2) 78.7 (78.3-79.1)
All 96.3 (96.2-96.4) 88.5 (88.3-88.7) 80.1 (79.8-80.4)
Survival was examined using the Cox regression method, with transplantation as censored observation (see methods)* Based on data from Austria, Belgium (Dutch-speaking), Belgium (French-speaking), Denmark, Finland, Greece, Iceland, Norway, Spain (Andalusia), Spain (Aragon), Spain (Asturias), Spain (Basque country), Spain (Cantabria), Spain (Castile and León), Spain (Castile-La Mancha), Spain (Catalonia), Spain (Extremadura), Spain (Valencian region), Sweden, the Netherlands, United Kingdom (All countries)
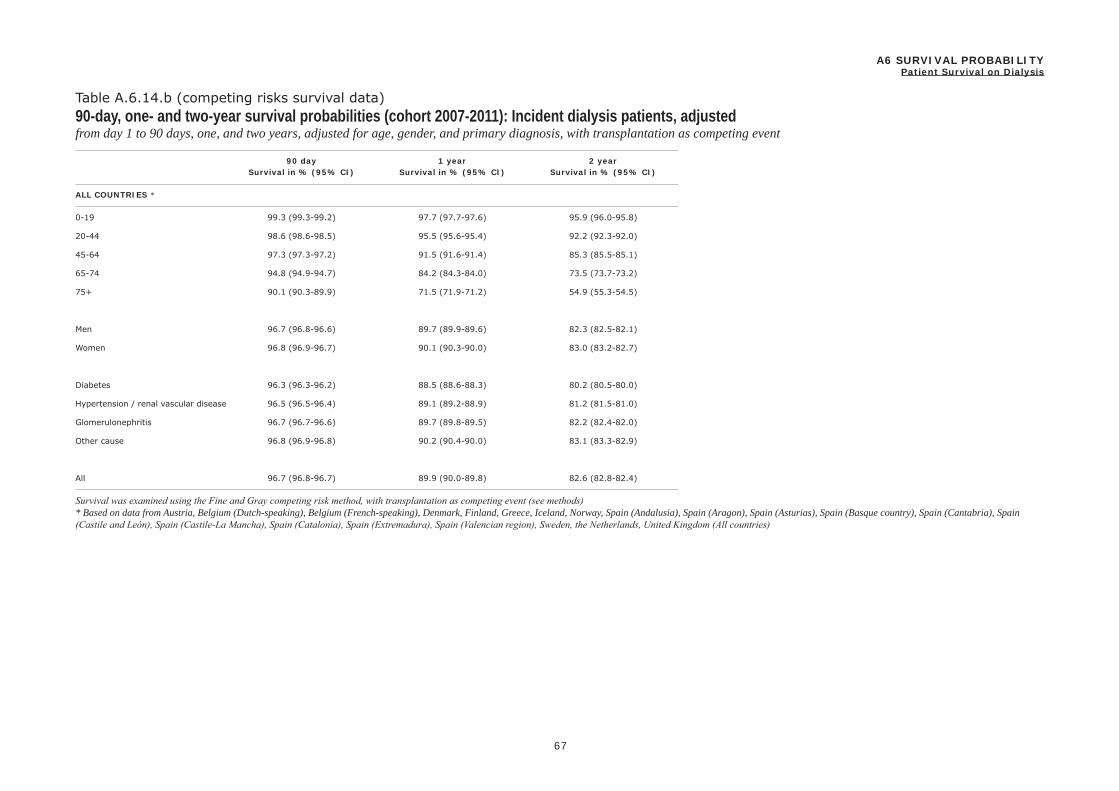
90 day 1 year 2 year
67
Survival in % (95% CI) Survival in % (95% CI) Survival in % (95% CI)
ALL COUNTRIES *
A6 SURVIVAL PROBABILITYPatient Survival on Dialysis
Table A.6.14.b (competing risks survival data)90-day, one- and two-year survival probabilities (cohort 2007-2011): Incident dialysis patients, adjustedfrom day 1 to 90 days, one, and two years, adjusted for age, gender, and primary diagnosis, with transplantation as competing event
0-19 99.3 (99.3-99.2) 97.7 (97.7-97.6) 95.9 (96.0-95.8)
20-44 98.6 (98.6-98.5) 95.5 (95.6-95.4) 92.2 (92.3-92.0)
45-64 97.3 (97.3-97.2) 91.5 (91.6-91.4) 85.3 (85.5-85.1)
65-74 94.8 (94.9-94.7) 84.2 (84.3-84.0) 73.5 (73.7-73.2)
75+ 90.1 (90.3-89.9) 71.5 (71.9-71.2) 54.9 (55.3-54.5)
Men 96.7 (96.8-96.6) 89.7 (89.9-89.6) 82.3 (82.5-82.1)
Women 96.8 (96.9-96.7) 90.1 (90.3-90.0) 83.0 (83.2-82.7)
Diabetes 96.3 (96.3-96.2) 88.5 (88.6-88.3) 80.2 (80.5-80.0)
Hypertension / renal vascular disease 96.5 (96.5-96.4) 89.1 (89.2-88.9) 81.2 (81.5-81.0)
Glomerulonephritis 96.7 (96.7-96.6) 89.7 (89.8-89.5) 82.2 (82.4-82.0)
Other cause 96.8 (96.9-96.8) 90.2 (90.4-90.0) 83.1 (83.3-82.9)
All 96.7 (96.8-96.7) 89.9 (90.0-89.8) 82.6 (82.8-82.4)
Survival was examined using the Fine and Gray competing risk method, with transplantation as competing event (see methods)* Based on data from Austria, Belgium (Dutch-speaking), Belgium (French-speaking), Denmark, Finland, Greece, Iceland, Norway, Spain (Andalusia), Spain (Aragon), Spain (Asturias), Spain (Basque country), Spain (Cantabria), Spain (Castile and León), Spain (Castile-La Mancha), Spain (Catalonia), Spain (Extremadura), Spain (Valencian region), Sweden, the Netherlands, United Kingdom (All countries)

1 year 2 year
68
Survival in % (95% CI) Survival in % (95% CI)
ALL COUNTRIES *
A6 SURVIVAL PROBABILITYPatient Survival on Dialysis
Table A.6.15.aOne- and two-year survival probabilities (cohort 2007-2011): Incident dialysis patients, unadjustedfrom day 91 to one and two years + 90 days, by age, gender, and primary diagnosis, with transplantation as censored observation
0-19 96.9 (95.0-98.1) 93.6 (90.7-95.6)
20-44 96.3 (95.9-96.6) 92.0 (91.4-92.5)
45-64 90.3 (90.0-90.6) 81.8 (81.4-82.2)
65-74 83.2 (82.8-83.6) 70.1 (69.7-70.5)
75+ 75.2 (74.8-75.6) 57.8 (57.5-58.2)
Men 84.5 (84.3-84.8) 72.0 (71.8-72.3)
Women 84.4 (84.1-84.8) 72.3 (71.9-72.6)
Diabetes 83.9 (83.5-84.3) 69.7 (69.3-70.2)
Hypertension / renal vascular disease 83.0 (82.5-83.5) 68.4 (67.9-68.9)
Glomerulonephritis 92.2 (91.7-92.6) 84.8 (84.1-85.4)
Other cause 84.1 (83.8-84.4) 72.6 (72.2-72.9)
All 84.5 (84.3-84.7) 72.1 (71.9-72.3)
Survival was examined using the Kaplan Meier method, with transplantation as censored observation (see methods)* Based on data from Austria, Belgium (Dutch-speaking), Belgium (French-speaking), Denmark, Finland, Greece, Iceland, Norway, Spain (Andalusia), Spain (Aragon), Spain (Asturias), Spain (Basque country), Spain (Cantabria), Spain (Castile and León), Spain (Castile-La Mancha), Spain (Catalonia), Spain (Extremadura), Spain (Valencian region), Sweden, the Netherlands, United Kingdom (All countries)
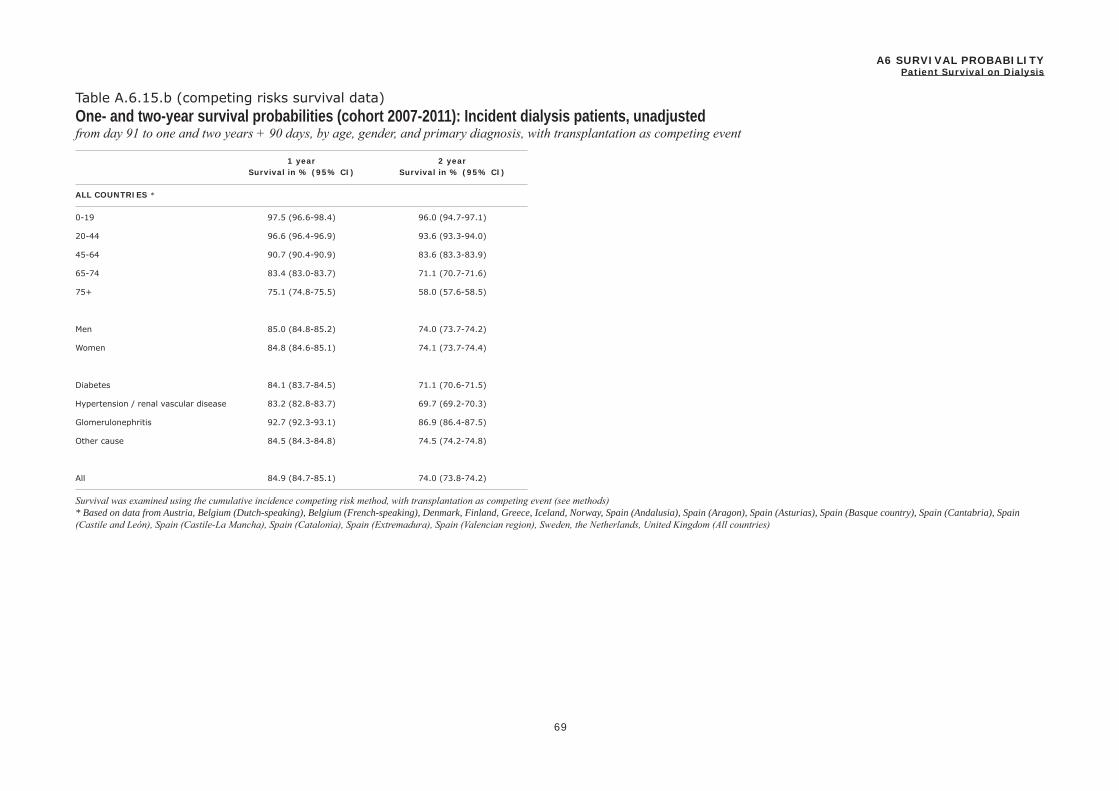
1 year 2 year
69
Survival in % (95% CI) Survival in % (95% CI)
ALL COUNTRIES *
A6 SURVIVAL PROBABILITYPatient Survival on Dialysis
Table A.6.15.b (competing risks survival data)One- and two-year survival probabilities (cohort 2007-2011): Incident dialysis patients, unadjustedfrom day 91 to one and two years + 90 days, by age, gender, and primary diagnosis, with transplantation as competing event
0-19 97.5 (96.6-98.4) 96.0 (94.7-97.1)
20-44 96.6 (96.4-96.9) 93.6 (93.3-94.0)
45-64 90.7 (90.4-90.9) 83.6 (83.3-83.9)
65-74 83.4 (83.0-83.7) 71.1 (70.7-71.6)
75+ 75.1 (74.8-75.5) 58.0 (57.6-58.5)
Men 85.0 (84.8-85.2) 74.0 (73.7-74.2)
Women 84.8 (84.6-85.1) 74.1 (73.7-74.4)
Diabetes 84.1 (83.7-84.5) 71.1 (70.6-71.5)
Hypertension / renal vascular disease 83.2 (82.8-83.7) 69.7 (69.2-70.3)
Glomerulonephritis 92.7 (92.3-93.1) 86.9 (86.4-87.5)
Other cause 84.5 (84.3-84.8) 74.5 (74.2-74.8)
All 84.9 (84.7-85.1) 74.0 (73.8-74.2)
Survival was examined using the cumulative incidence competing risk method, with transplantation as competing event (see methods)* Based on data from Austria, Belgium (Dutch-speaking), Belgium (French-speaking), Denmark, Finland, Greece, Iceland, Norway, Spain (Andalusia), Spain (Aragon), Spain (Asturias), Spain (Basque country), Spain (Cantabria), Spain (Castile and León), Spain (Castile-La Mancha), Spain (Catalonia), Spain (Extremadura), Spain (Valencian region), Sweden, the Netherlands, United Kingdom (All countries)

1 year 2 year
70
Survival in % (95% CI) Survival in % (95% CI)
ALL COUNTRIES *
A6 SURVIVAL PROBABILITYPatient Survival on Dialysis
Table A.6.16.aOne- and two-year survival probabilities (cohort 2007-2011): Incident dialysis patients, adjustedfrom day 91 to one and two years + 90 days, adjusted for age, gender, and primary diagnosis, with transplantation as censored observation
0-19 96.8 (95.1-98.5) 93.1 (90.2-96.0)
20-44 96.4 (96.0-96.7) 92.1 (91.5-92.7)
45-64 91.0 (90.6-91.3) 82.9 (82.5-83.4)
65-74 84.2 (83.8-84.7) 71.8 (71.2-72.4)
75+ 76.2 (75.7-76.7) 59.4 (58.8-60.0)
Men 89.6 (89.3-89.8) 80.7 (80.3-81.0)
Women 89.7 (89.4-90.0) 81.2 (80.8-81.6)
Diabetes 88.0 (87.7-88.4) 77.1 (76.6-77.6)
Hypertension / renal vascular disease 90.1 (89.7-90.5) 80.9 (80.3-81.5)
Glomerulonephritis 93.1 (92.6-93.6) 86.7 (86.0-87.4)
Other cause 88.8 (88.5-89.1) 80.3 (79.9-80.7)
All 89.7 (89.5-89.9) 80.9 (80.6-81.2)
Survival was examined using the Cox regression method, with transplantation as censored observation (see methods)* Based on data from Austria, Belgium (Dutch-speaking), Belgium (French-speaking), Denmark, Finland, Greece, Iceland, Norway, Spain (Andalusia), Spain (Aragon), Spain (Asturias), Spain (Basque country), Spain (Cantabria), Spain (Castile and León), Spain (Castile-La Mancha), Spain (Catalonia), Spain (Extremadura), Spain (Valencian region), Sweden, the Netherlands, United Kingdom (All countries)

1 year 2 year
71
Survival in % (95% CI) Survival in % (95% CI)
ALL COUNTRIES *
A6 SURVIVAL PROBABILITYPatient Survival on Dialysis
Table A.6.16.b (competing risks survival data)One- and two-year survival probabilities (cohort 2007-2011): Incident dialysis patients, adjustedfrom day 91 to one and two years + 90 days, adjusted for age, gender, and primary diagnosis, with transplantation as competing event
0-19 97.9 (97.9-98.0) 96.1 (96.0-96.2)
20-44 96.0 (95.9-96.1) 92.6 (92.4-92.7)
45-64 92.4 (92.3-92.6) 86.1 (86.0-86.3)
65-74 85.9 (85.7-86.1) 75.0 (74.7-75.2)
75+ 74.6 (74.2-74.9) 57.3 (56.9-57.7)
Men 90.8 (90.7-91.0) 83.2 (83.0-83.5)
Women 91.3 (91.1-91.4) 84.0 (83.8-84.3)
Diabetes 89.2 (89.0-89.4) 80.5 (80.2-80.8)
Hypertension / renal vascular disease 90.0 (89.9-90.2) 81.9 (81.7-82.2)
Glomerulonephritis 90.8 (90.7-91.0) 83.2 (83.0-83.5)
Other cause 91.5 (91.4-91.7) 84.5 (84.3-84.7)
All 91.0 (90.9-91.2) 83.5 (83.4-83.8)
Survival was examined using the Fine and Gray competing risk method, with transplantation as competing event (see methods)* Based on data from Austria, Belgium (Dutch-speaking), Belgium (French-speaking), Denmark, Finland, Greece, Iceland, Norway, Spain (Andalusia), Spain (Aragon), Spain (Asturias), Spain (Basque country), Spain (Cantabria), Spain (Castile and León), Spain (Castile-La Mancha), Spain (Catalonia), Spain (Extremadura), Spain (Valencian region), Sweden, the Netherlands, United Kingdom (All countries)
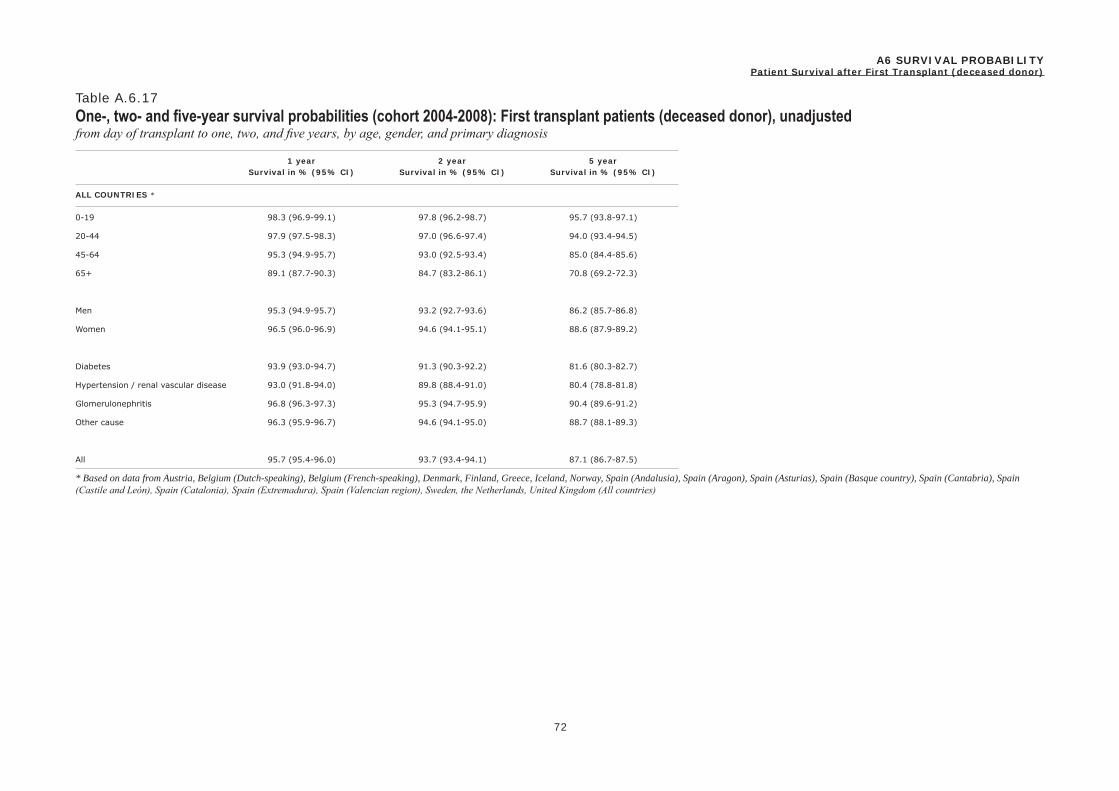
1 year 2 year 5 year
72
Survival in % (95% CI) Survival in % (95% CI) Survival in % (95% CI)
ALL COUNTRIES *
A6 SURVIVAL PROBABILITYPatient Survival after First Transplant (deceased donor)
Table A.6.17One-, two- and five-year survival probabilities (cohort 2004-2008): First transplant patients (deceased donor), unadjustedfrom day of transplant to one, two, and five years, by age, gender, and primary diagnosis
0-19 98.3 (96.9-99.1) 97.8 (96.2-98.7) 95.7 (93.8-97.1)
20-44 97.9 (97.5-98.3) 97.0 (96.6-97.4) 94.0 (93.4-94.5)
45-64 95.3 (94.9-95.7) 93.0 (92.5-93.4) 85.0 (84.4-85.6)
65+ 89.1 (87.7-90.3) 84.7 (83.2-86.1) 70.8 (69.2-72.3)
Men 95.3 (94.9-95.7) 93.2 (92.7-93.6) 86.2 (85.7-86.8)
Women 96.5 (96.0-96.9) 94.6 (94.1-95.1) 88.6 (87.9-89.2)
Diabetes 93.9 (93.0-94.7) 91.3 (90.3-92.2) 81.6 (80.3-82.7)
Hypertension / renal vascular disease 93.0 (91.8-94.0) 89.8 (88.4-91.0) 80.4 (78.8-81.8)
Glomerulonephritis 96.8 (96.3-97.3) 95.3 (94.7-95.9) 90.4 (89.6-91.2)
Other cause 96.3 (95.9-96.7) 94.6 (94.1-95.0) 88.7 (88.1-89.3)
All 95.7 (95.4-96.0) 93.7 (93.4-94.1) 87.1 (86.7-87.5)
* Based on data from Austria, Belgium (Dutch-speaking), Belgium (French-speaking), Denmark, Finland, Greece, Iceland, Norway, Spain (Andalusia), Spain (Aragon), Spain (Asturias), Spain (Basque country), Spain (Cantabria), Spain (Castile and León), Spain (Catalonia), Spain (Extremadura), Spain (Valencian region), Sweden, the Netherlands, United Kingdom (All countries)

1 year 2 year 5 year
73
Survival in % (95% CI) Survival in % (95% CI) Survival in % (95% CI)
ALL COUNTRIES *
A6 SURVIVAL PROBABILITYPatient Survival after First Transplant (deceased donor)
Table A.6.18One-, two- and five-year survival probabilities (cohort 2004-2008): First transplant patients (deceased donor), adjustedfrom day of transplant to one, two, and five years, adjusted for age, gender, and primary diagnosis
0-19 98.2 (97.1-99.4) 97.7 (96.4-99.0) 95.5 (93.7-97.3)
20-44 98.1 (97.8-98.4) 97.2 (96.8-97.6) 94.5 (94.0-95.1)
45-64 95.7 (95.3-96.1) 93.5 (93.0-94.0) 86.1 (85.4-86.9)
65+ 90.1 (88.7-91.4) 86.0 (84.4-87.6) 73.0 (70.9-75.1)
Men 97.2 (96.9-97.4) 95.9 (95.5-96.2) 91.3 (90.8-91.9)
Women 97.7 (97.4-98.0) 96.5 (96.1-96.9) 92.4 (91.8-93.0)
Diabetes 95.8 (95.1-96.4) 93.8 (93.1-94.6) 86.5 (85.4-87.7)
Hypertension / renal vascular disease 96.6 (96.0-97.2) 94.9 (94.1-95.7) 89.7 (88.6-90.9)
Glomerulonephritis 97.8 (97.4-98.2) 96.7 (96.2-97.2) 93.1 (92.4-93.8)
Other cause 97.5 (97.2-97.8) 96.3 (95.9-96.6) 92.1 (91.6-92.7)
All 97.4 (97.2-97.6) 96.1 (95.9-96.4) 91.8 (91.4-92.2)
* Based on data from Austria, Belgium (Dutch-speaking), Belgium (French-speaking), Denmark, Finland, Greece, Iceland, Norway, Spain (Andalusia), Spain (Aragon), Spain (Asturias), Spain (Basque country), Spain (Cantabria), Spain (Castile and León), Spain (Catalonia), Spain (Extremadura), Spain (Valencian region), Sweden, the Netherlands, United Kingdom (All countries)
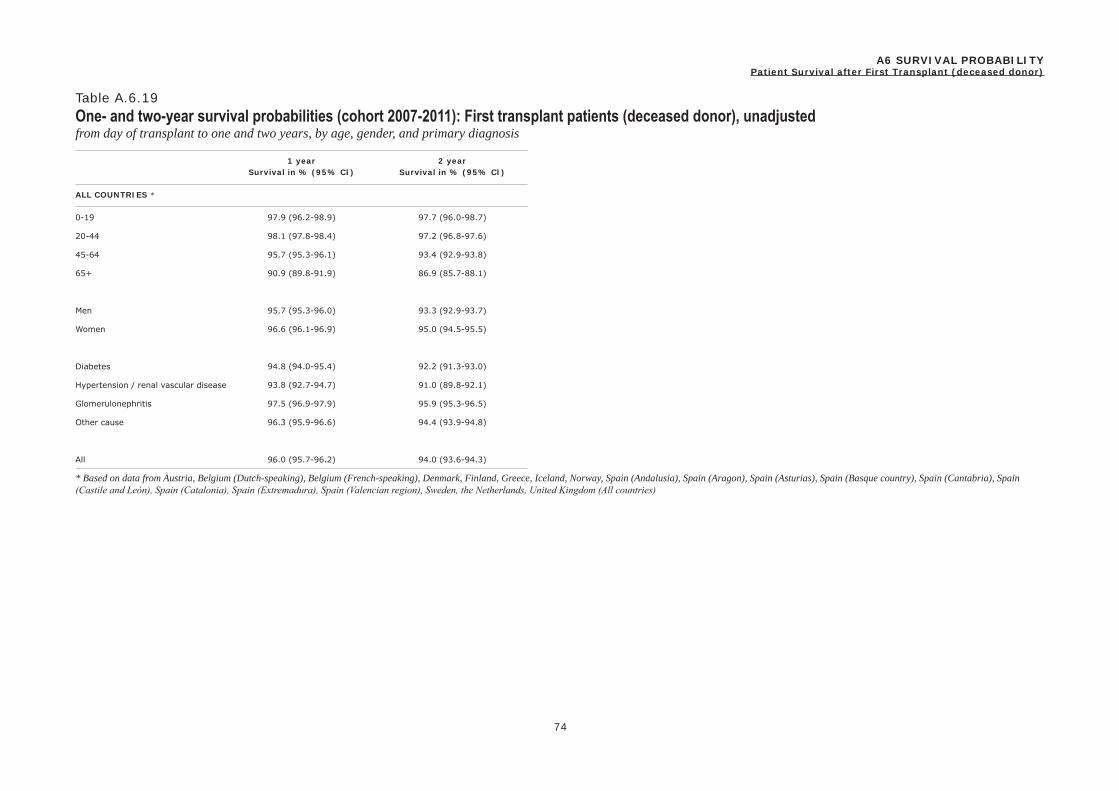
1 year 2 year
74
Survival in % (95% CI) Survival in % (95% CI)
ALL COUNTRIES *
A6 SURVIVAL PROBABILITYPatient Survival after First Transplant (deceased donor)
Table A.6.19One- and two-year survival probabilities (cohort 2007-2011): First transplant patients (deceased donor), unadjustedfrom day of transplant to one and two years, by age, gender, and primary diagnosis
0-19 97.9 (96.2-98.9) 97.7 (96.0-98.7)
20-44 98.1 (97.8-98.4) 97.2 (96.8-97.6)
45-64 95.7 (95.3-96.1) 93.4 (92.9-93.8)
65+ 90.9 (89.8-91.9) 86.9 (85.7-88.1)
Men 95.7 (95.3-96.0) 93.3 (92.9-93.7)
Women 96.6 (96.1-96.9) 95.0 (94.5-95.5)
Diabetes 94.8 (94.0-95.4) 92.2 (91.3-93.0)
Hypertension / renal vascular disease 93.8 (92.7-94.7) 91.0 (89.8-92.1)
Glomerulonephritis 97.5 (96.9-97.9) 95.9 (95.3-96.5)
Other cause 96.3 (95.9-96.6) 94.4 (93.9-94.8)
All 96.0 (95.7-96.2) 94.0 (93.6-94.3)
* Based on data from Austria, Belgium (Dutch-speaking), Belgium (French-speaking), Denmark, Finland, Greece, Iceland, Norway, Spain (Andalusia), Spain (Aragon), Spain (Asturias), Spain (Basque country), Spain (Cantabria), Spain (Castile and León), Spain (Catalonia), Spain (Extremadura), Spain (Valencian region), Sweden, the Netherlands, United Kingdom (All countries)

1 year 2 year
75
Survival in % (95% CI) Survival in % (95% CI)
ALL COUNTRIES *
A6 SURVIVAL PROBABILITYPatient Survival after First Transplant (deceased donor)
Table A.6.20One- and two-year survival probabilities (cohort 2007-2011): First transplant patients (deceased donor), adjustedfrom day of transplant to one and two years, adjusted for age, gender, and primary diagnosis
0-19
20-44 98.3 (98.0-98.6) 97.4 (97.0-97.8)
45-64 96.1 (95.7-96.4) 93.9 (93.4-94.4)
65+ 91.9 (90.9-93.0) 88.2 (87.0-89.5)
Men 97.5 (97.2-97.7) 96.0 (95.7-96.4)
Women 97.8 (97.5-98.1) 96.8 (96.5-97.2)
Diabetes 96.5 (95.9-97.0) 94.7 (94.0-95.4)
Hypertension / renal vascular disease 96.9 (96.3-97.5) 95.4 (94.7-96.1)
Glomerulonephritis 98.3 (98.0-98.6) 97.3 (96.9-97.7)
Other cause 97.5 (97.2-97.8) 96.3 (95.9-96.6)
All 97.6 (97.4-97.8) 96.4 (96.1-96.6)
* Based on data from Austria, Belgium (Dutch-speaking), Belgium (French-speaking), Denmark, Finland, Greece, Iceland, Norway, Spain (Andalusia), Spain (Aragon), Spain (Asturias), Spain (Basque country), Spain (Cantabria), Spain (Castile and León), Spain (Catalonia), Spain (Extremadura), Spain (Valencian region), Sweden, the Netherlands, United Kingdom (All countries)

1 year 2 year 5 year
76
Survival in % (95% CI) Survival in % (95% CI) Survival in % (95% CI)
ALL COUNTRIES *
A6 SURVIVAL PROBABILITYPatient Survival after First Transplant (living donor)
Table A.6.21One-, two- and five-year survival probabilities (cohort 2004-2008): First transplant patients (living donor), unadjustedfrom day of transplant to one, two, and five years, by age, gender, and primary diagnosis
0-19 98.3 (96.5-99.2) 98.3 (96.5-99.2) 97.3 (95.2-98.5)
20-44 99.3 (98.9-99.5) 98.9 (98.4-99.2) 97.7 (97.0-98.1)
45-64 97.8 (97.1-98.3) 96.4 (95.5-97.0) 91.6 (90.5-92.6)
65+ 93.6 (90.5-95.7) 90.7 (87.3-93.2) 78.5 (74.7-81.8)
Men 98.1 (97.6-98.5) 97.2 (96.6-97.6) 93.5 (92.8-94.3)
Women 98.6 (98.1-99.0) 97.9 (97.2-98.4) 95.4 (94.5-96.2)
Diabetes 96.3 (94.2-97.6) 93.4 (90.9-95.2) 85.3 (82.3-87.8)
Hypertension / renal vascular disease 95.9 (93.7-97.4) 94.8 (92.4-96.4) 90.2 (87.4-92.4)
Glomerulonephritis 99.2 (98.6-99.5) 98.5 (97.8-99.0) 96.7 (95.7-97.4)
Other cause 98.6 (98.1-98.9) 97.9 (97.4-98.4) 95.1 (94.4-95.8)
All 98.3 (98.0-98.6) 97.4 (97.0-97.8) 94.3 (93.7-94.8)
* Based on data from Austria, Belgium (Dutch-speaking), Belgium (French-speaking), Denmark, Finland, Greece, Iceland, Norway, Spain (Andalusia), Spain (Aragon), Spain (Asturias), Spain (Basque country), Spain (Cantabria), Spain (Castile and León), Spain (Catalonia), Spain (Extremadura), Spain (Valencian region), Sweden, the Netherlands, United Kingdom (All countries)

1 year 2 year 5 year
77
Survival in % (95% CI) Survival in % (95% CI) Survival in % (95% CI)
ALL COUNTRIES *
A6 SURVIVAL PROBABILITYPatient Survival after First Transplant (living donor)
Table A.6.22One-, two- and five-year survival probabilities (cohort 2004-2008): First transplant patients (living donor), adjustedfrom day of transplant to one, two, and five years, adjusted for age, gender, and primary diagnosis
0-19
20-44 99.3 (99.0-99.6) 98.9 (98.5-99.3) 97.7 (97.2-98.3)
45-64 98.0 (97.4-98.6) 96.7 (96.0-97.4) 92.5 (91.4-93.6)
65+ 94.8 (92.4-97.2) 93.0 (90.3-95.8) 82.1 (78.0-86.5)
Men 98.6 (98.3-99.0) 97.9 (97.5-98.3) 95.1 (94.3-95.8)
Women 98.8 (98.4-99.2) 98.2 (97.7-98.7) 96.3 (95.5-97.0)
Diabetes 97.5 (96.4-98.7) 95.6 (94.0-97.2) 89.8 (87.5-92.3)
Hypertension / renal vascular disease 97.8 (96.7-98.8) 97.1 (95.9-98.3) 94.4 (92.7-96.2)
Glomerulonephritis 99.2 (98.8-99.6) 98.6 (98.1-99.2) 96.9 (96.1-97.8)
Other cause 98.7 (98.4-99.1) 98.2 (97.7-98.6) 95.6 (94.9-96.3)
All 98.7 (98.4-99.0) 98.1 (97.7-98.4) 95.6 (95.0-96.1)
* Based on data from Austria, Belgium (Dutch-speaking), Belgium (French-speaking), Denmark, Finland, Greece, Iceland, Norway, Spain (Andalusia), Spain (Aragon), Spain (Asturias), Spain (Basque country), Spain (Cantabria), Spain (Castile and León), Spain (Catalonia), Spain (Extremadura), Spain (Valencian region), Sweden, the Netherlands, United Kingdom (All countries)

1 year 2 year
78
Survival in % (95% CI) Survival in % (95% CI)
ALL COUNTRIES *
A6 SURVIVAL PROBABILITYPatient Survival after First Transplant (living donor)
Table A.6.23One- and two-year survival probabilities (cohort 2007-2011): First transplant patients (living donor), unadjustedfrom day of transplant to one and two years, by age, gender, and primary diagnosis
0-19 99.3 (97.8-99.8) 99.3 (97.8-99.8)
20-44 99.5 (99.2-99.7) 99.2 (98.8-99.4)
45-64 98.1 (97.6-98.5) 96.8 (96.2-97.3)
65+ 95.7 (93.9-97.1) 92.1 (89.9-93.9)
Men 98.6 (98.2-98.9) 97.7 (97.2-98.0)
Women 98.6 (98.2-99.0) 97.5 (96.9-98.0)
Diabetes 96.8 (95.3-97.9) 94.9 (93.0-96.2)
Hypertension / renal vascular disease 97.0 (95.3-98.0) 95.2 (93.3-96.6)
Glomerulonephritis 99.2 (98.7-99.5) 98.5 (97.9-99.0)
Other cause 98.9 (98.5-99.1) 98.0 (97.6-98.4)
All 98.6 (98.3-98.8) 97.6 (97.3-97.9)
* Based on data from Austria, Belgium (Dutch-speaking), Belgium (French-speaking), Denmark, Finland, Greece, Iceland, Norway, Spain (Andalusia), Spain (Aragon), Spain (Asturias), Spain (Basque country), Spain (Cantabria), Spain (Castile and León), Spain (Catalonia), Spain (Extremadura), Spain (Valencian region), Sweden, the Netherlands, United Kingdom (All countries)
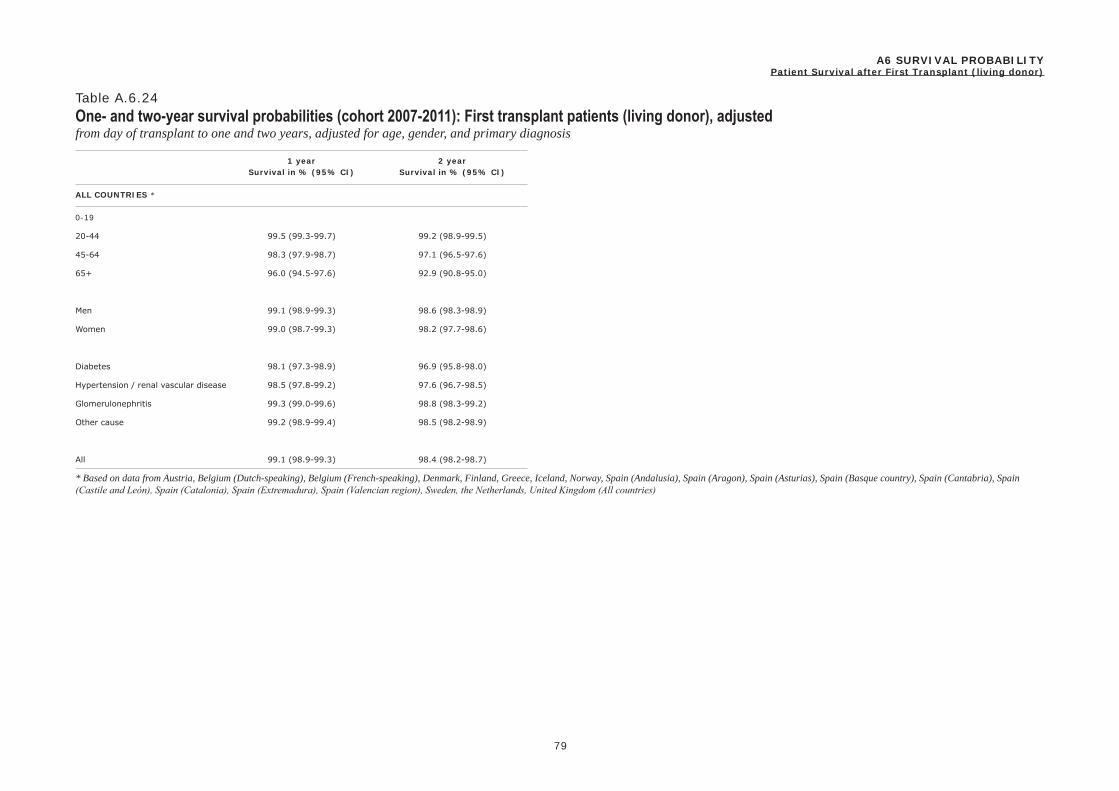
1 year 2 year
79
Survival in % (95% CI) Survival in % (95% CI)
ALL COUNTRIES *
A6 SURVIVAL PROBABILITYPatient Survival after First Transplant (living donor)
Table A.6.24One- and two-year survival probabilities (cohort 2007-2011): First transplant patients (living donor), adjustedfrom day of transplant to one and two years, adjusted for age, gender, and primary diagnosis
0-19
20-44 99.5 (99.3-99.7) 99.2 (98.9-99.5)
45-64 98.3 (97.9-98.7) 97.1 (96.5-97.6)
65+ 96.0 (94.5-97.6) 92.9 (90.8-95.0)
Men 99.1 (98.9-99.3) 98.6 (98.3-98.9)
Women 99.0 (98.7-99.3) 98.2 (97.7-98.6)
Diabetes 98.1 (97.3-98.9) 96.9 (95.8-98.0)
Hypertension / renal vascular disease 98.5 (97.8-99.2) 97.6 (96.7-98.5)
Glomerulonephritis 99.3 (99.0-99.6) 98.8 (98.3-99.2)
Other cause 99.2 (98.9-99.4) 98.5 (98.2-98.9)
All 99.1 (98.9-99.3) 98.4 (98.2-98.7)
* Based on data from Austria, Belgium (Dutch-speaking), Belgium (French-speaking), Denmark, Finland, Greece, Iceland, Norway, Spain (Andalusia), Spain (Aragon), Spain (Asturias), Spain (Basque country), Spain (Cantabria), Spain (Castile and León), Spain (Catalonia), Spain (Extremadura), Spain (Valencian region), Sweden, the Netherlands, United Kingdom (All countries)
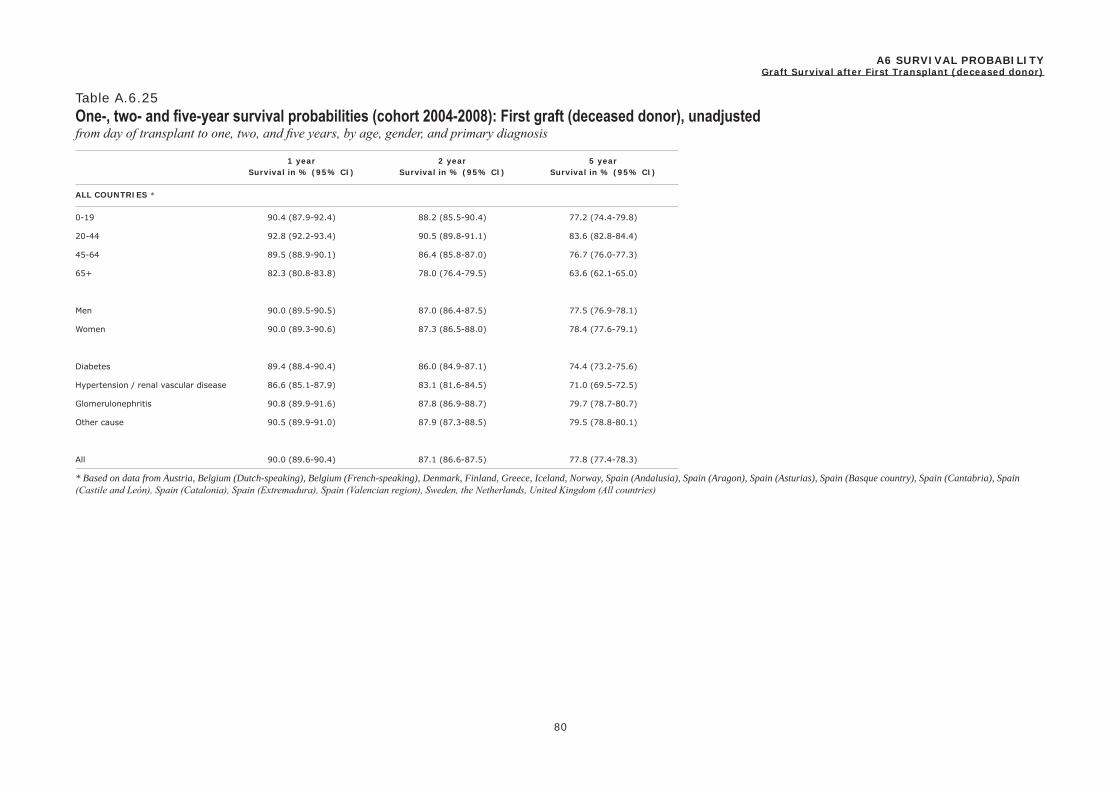
1 year 2 year 5 year
80
Survival in % (95% CI) Survival in % (95% CI) Survival in % (95% CI)
ALL COUNTRIES *
A6 SURVIVAL PROBABILITYGraft Survival after First Transplant (deceased donor)
Table A.6.25One-, two- and five-year survival probabilities (cohort 2004-2008): First graft (deceased donor), unadjustedfrom day of transplant to one, two, and five years, by age, gender, and primary diagnosis
0-19 90.4 (87.9-92.4) 88.2 (85.5-90.4) 77.2 (74.4-79.8)
20-44 92.8 (92.2-93.4) 90.5 (89.8-91.1) 83.6 (82.8-84.4)
45-64 89.5 (88.9-90.1) 86.4 (85.8-87.0) 76.7 (76.0-77.3)
65+ 82.3 (80.8-83.8) 78.0 (76.4-79.5) 63.6 (62.1-65.0)
Men 90.0 (89.5-90.5) 87.0 (86.4-87.5) 77.5 (76.9-78.1)
Women 90.0 (89.3-90.6) 87.3 (86.5-88.0) 78.4 (77.6-79.1)
Diabetes 89.4 (88.4-90.4) 86.0 (84.9-87.1) 74.4 (73.2-75.6)
Hypertension / renal vascular disease 86.6 (85.1-87.9) 83.1 (81.6-84.5) 71.0 (69.5-72.5)
Glomerulonephritis 90.8 (89.9-91.6) 87.8 (86.9-88.7) 79.7 (78.7-80.7)
Other cause 90.5 (89.9-91.0) 87.9 (87.3-88.5) 79.5 (78.8-80.1)
All 90.0 (89.6-90.4) 87.1 (86.6-87.5) 77.8 (77.4-78.3)
* Based on data from Austria, Belgium (Dutch-speaking), Belgium (French-speaking), Denmark, Finland, Greece, Iceland, Norway, Spain (Andalusia), Spain (Aragon), Spain (Asturias), Spain (Basque country), Spain (Cantabria), Spain (Castile and León), Spain (Catalonia), Spain (Extremadura), Spain (Valencian region), Sweden, the Netherlands, United Kingdom (All countries)

1 year 2 year 5 year
81
Survival in % (95% CI) Survival in % (95% CI) Survival in % (95% CI)
ALL COUNTRIES *
A6 SURVIVAL PROBABILITYGraft Survival after First Transplant (deceased donor)
Table A.6.26One-, two- and five-year survival probabilities (cohort 2004-2008): First graft (deceased donor), adjustedfrom day of transplant to one, two, and five years, adjusted for age, gender, and primary diagnosis
0-19 90.0 (87.5-92.6) 87.7 (84.9-90.6) 76.3 (72.7-80.1)
20-44 93.0 (92.4-93.7) 90.8 (90.1-91.5) 84.2 (83.3-85.2)
45-64 89.8 (89.2-90.5) 86.9 (86.2-87.6) 77.3 (76.5-78.2)
65+ 83.1 (81.4-84.9) 78.9 (77.0-80.9) 64.8 (62.6-67.1)
Men 91.4 (90.9-91.9) 88.8 (88.2-89.4) 80.4 (79.6-81.2)
Women 91.1 (90.4-91.8) 88.7 (87.9-89.4) 80.6 (79.6-81.5)
Diabetes 90.4 (89.3-91.4) 87.2 (86.0-88.5) 76.3 (74.8-77.9)
Hypertension / renal vascular disease 89.3 (88.0-90.6) 86.6 (85.1-88.0) 76.4 (74.5-78.3)
Glomerulonephritis 91.5 (90.6-92.3) 88.8 (87.8-89.7) 81.1 (80.0-82.4)
Other cause 91.4 (90.9-92.0) 89.0 (88.4-89.7) 81.3 (80.4-82.1)
All 91.3 (90.9-91.7) 88.7 (88.3-89.2) 80.5 (79.8-81.1)
* Based on data from Austria, Belgium (Dutch-speaking), Belgium (French-speaking), Denmark, Finland, Greece, Iceland, Norway, Spain (Andalusia), Spain (Aragon), Spain (Asturias), Spain (Basque country), Spain (Cantabria), Spain (Castile and León), Spain (Catalonia), Spain (Extremadura), Spain (Valencian region), Sweden, the Netherlands, United Kingdom (All countries)

1 year 2 year
82
Survival in % (95% CI) Survival in % (95% CI)
ALL COUNTRIES *
A6 SURVIVAL PROBABILITYGraft Survival after First Transplant (deceased donor)
Table A.6.27One- and two-year survival probabilities (cohort 2007-2011): First graft (deceased donor), unadjustedfrom day of transplant to one and two years, by age, gender, and primary diagnosis
0-19 91.3 (88.7-93.4) 88.2 (85.4-90.5)
20-44 93.3 (92.8-93.9) 91.2 (90.6-91.8)
45-64 90.4 (89.8-90.9) 87.2 (86.6-87.8)
65+ 85.1 (83.9-86.3) 81.4 (80.0-82.6)
Men 90.6 (90.2-91.1) 87.6 (87.1-88.1)
Women 90.9 (90.3-91.5) 88.3 (87.6-88.9)
Diabetes 90.4 (89.5-91.3) 87.2 (86.2-88.2)
Hypertension / renal vascular disease 87.8 (86.5-89.0) 84.9 (83.5-86.1)
Glomerulonephritis 92.0 (91.2-92.8) 89.2 (88.3-90.0)
Other cause 90.9 (90.3-91.4) 88.1 (87.5-88.6)
All 90.7 (90.4-91.1) 87.9 (87.4-88.2)
* Based on data from Austria, Belgium (Dutch-speaking), Belgium (French-speaking), Denmark, Finland, Greece, Iceland, Norway, Spain (Andalusia), Spain (Aragon), Spain (Asturias), Spain (Basque country), Spain (Cantabria), Spain (Castile and León), Spain (Catalonia), Spain (Extremadura), Spain (Valencian region), Sweden, the Netherlands, United Kingdom (All countries)
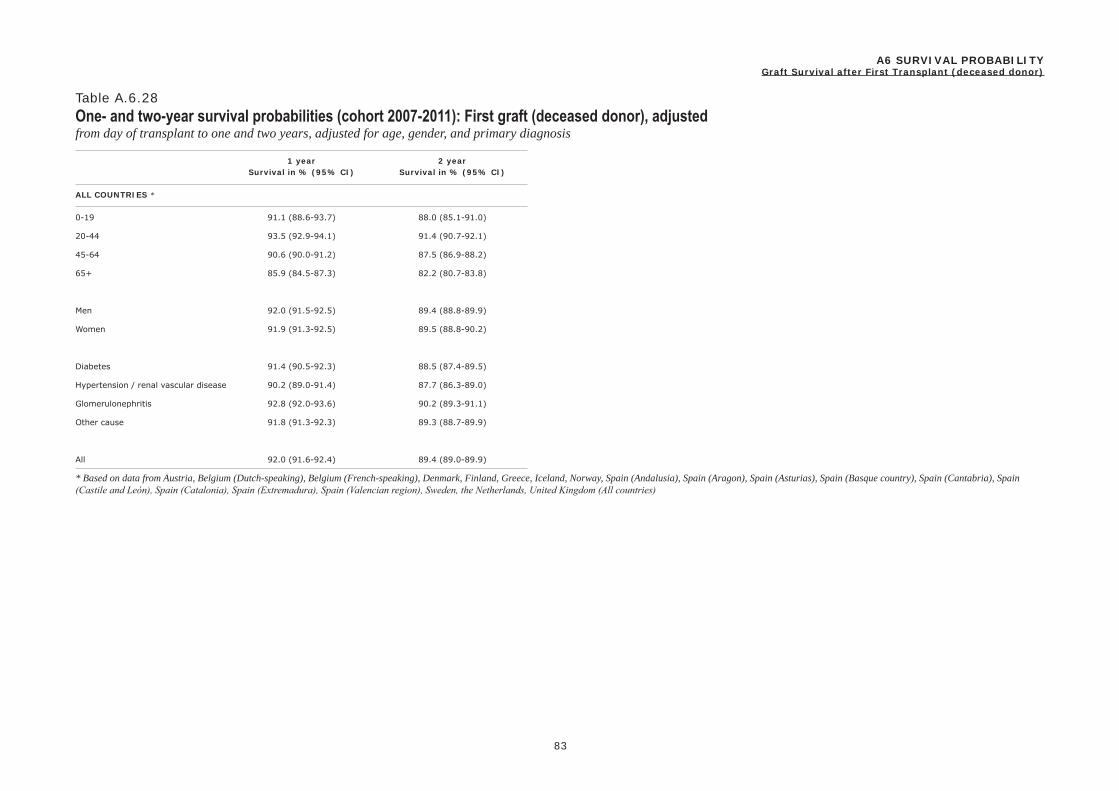
1 year 2 year
83
Survival in % (95% CI) Survival in % (95% CI)
ALL COUNTRIES *
A6 SURVIVAL PROBABILITYGraft Survival after First Transplant (deceased donor)
Table A.6.28One- and two-year survival probabilities (cohort 2007-2011): First graft (deceased donor), adjustedfrom day of transplant to one and two years, adjusted for age, gender, and primary diagnosis
0-19 91.1 (88.6-93.7) 88.0 (85.1-91.0)
20-44 93.5 (92.9-94.1) 91.4 (90.7-92.1)
45-64 90.6 (90.0-91.2) 87.5 (86.9-88.2)
65+ 85.9 (84.5-87.3) 82.2 (80.7-83.8)
Men 92.0 (91.5-92.5) 89.4 (88.8-89.9)
Women 91.9 (91.3-92.5) 89.5 (88.8-90.2)
Diabetes 91.4 (90.5-92.3) 88.5 (87.4-89.5)
Hypertension / renal vascular disease 90.2 (89.0-91.4) 87.7 (86.3-89.0)
Glomerulonephritis 92.8 (92.0-93.6) 90.2 (89.3-91.1)
Other cause 91.8 (91.3-92.3) 89.3 (88.7-89.9)
All 92.0 (91.6-92.4) 89.4 (89.0-89.9)
* Based on data from Austria, Belgium (Dutch-speaking), Belgium (French-speaking), Denmark, Finland, Greece, Iceland, Norway, Spain (Andalusia), Spain (Aragon), Spain (Asturias), Spain (Basque country), Spain (Cantabria), Spain (Castile and León), Spain (Catalonia), Spain (Extremadura), Spain (Valencian region), Sweden, the Netherlands, United Kingdom (All countries)

1 year 2 year 5 year
84
Survival in % (95% CI) Survival in % (95% CI) Survival in % (95% CI)
ALL COUNTRIES *
A6 SURVIVAL PROBABILITYGraft Survival after First Transplant (living donor)
Table A.6.29One-, two- and five-year survival probabilities (cohort 2004-2008): First graft (living donor), unadjustedfrom day of transplant to one, two, and five years, by age, gender, and primary diagnosis
0-19 94.9 (92.4-96.5) 92.9 (90.2-94.9) 84.0 (80.8-86.8)
20-44 95.5 (94.8-96.2) 93.9 (93.0-94.7) 88.8 (87.7-89.8)
45-64 95.6 (94.7-96.3) 93.5 (92.4-94.3) 86.6 (85.4-87.8)
65+ 91.7 (88.4-94.1) 88.1 (84.6-90.9) 75.9 (72.1-79.3)
Men 95.1 (94.4-95.8) 93.4 (92.6-94.1) 86.4 (85.5-87.4)
Women 95.6 (94.7-96.4) 93.3 (92.3-94.2) 87.7 (86.5-88.9)
Diabetes 93.4 (90.9-95.3) 89.9 (87.1-92.1) 80.0 (76.9-82.8)
Hypertension / renal vascular disease 92.5 (89.9-94.5) 89.8 (86.9-92.0) 81.1 (77.9-83.9)
Glomerulonephritis 95.8 (94.7-96.6) 93.4 (92.2-94.5) 87.1 (85.6-88.5)
Other cause 95.7 (94.9-96.3) 94.2 (93.4-94.9) 88.6 (87.6-89.5)
All 95.3 (94.8-95.8) 93.3 (92.7-93.9) 86.9 (86.2-87.7)
* Based on data from Austria, Belgium (Dutch-speaking), Belgium (French-speaking), Denmark, Finland, Greece, Iceland, Norway, Spain (Andalusia), Spain (Aragon), Spain (Asturias), Spain (Basque country), Spain (Cantabria), Spain (Castile and León), Spain (Catalonia), Spain (Extremadura), Spain (Valencian region), Sweden, the Netherlands, United Kingdom (All countries)
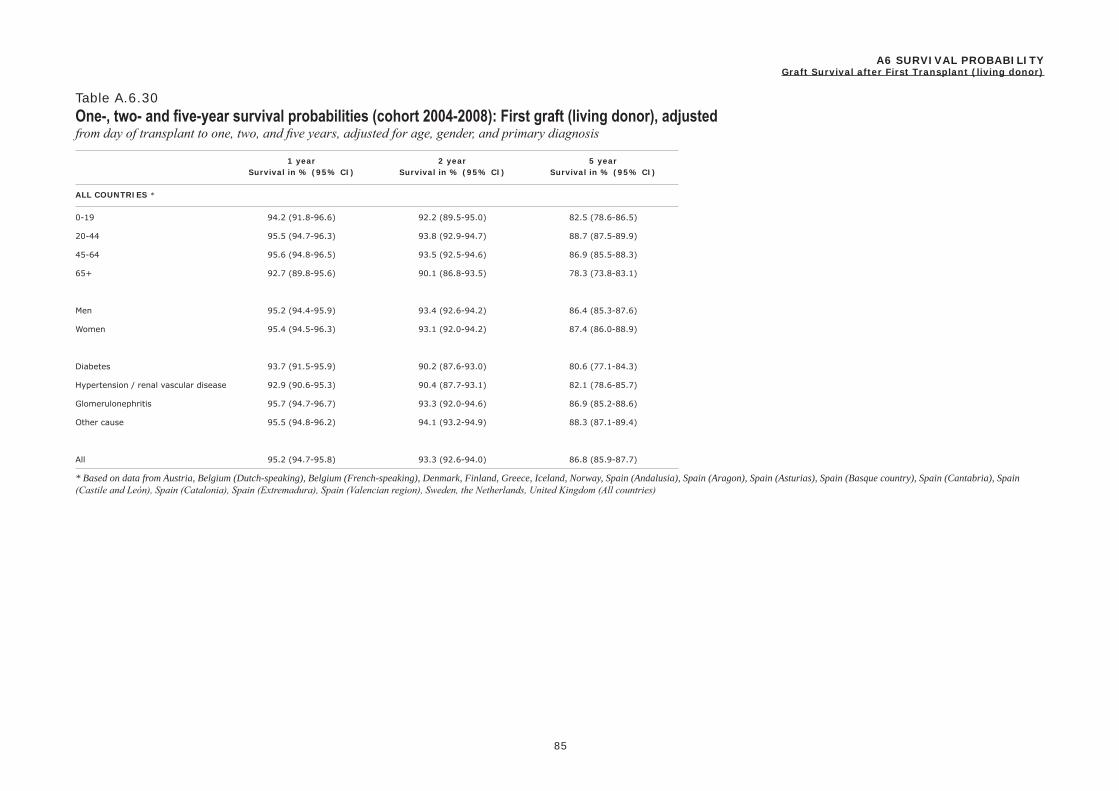
1 year 2 year 5 year
85
Survival in % (95% CI) Survival in % (95% CI) Survival in % (95% CI)
ALL COUNTRIES *
A6 SURVIVAL PROBABILITYGraft Survival after First Transplant (living donor)
Table A.6.30One-, two- and five-year survival probabilities (cohort 2004-2008): First graft (living donor), adjustedfrom day of transplant to one, two, and five years, adjusted for age, gender, and primary diagnosis
0-19 94.2 (91.8-96.6) 92.2 (89.5-95.0) 82.5 (78.6-86.5)
20-44 95.5 (94.7-96.3) 93.8 (92.9-94.7) 88.7 (87.5-89.9)
45-64 95.6 (94.8-96.5) 93.5 (92.5-94.6) 86.9 (85.5-88.3)
65+ 92.7 (89.8-95.6) 90.1 (86.8-93.5) 78.3 (73.8-83.1)
Men 95.2 (94.4-95.9) 93.4 (92.6-94.2) 86.4 (85.3-87.6)
Women 95.4 (94.5-96.3) 93.1 (92.0-94.2) 87.4 (86.0-88.9)
Diabetes 93.7 (91.5-95.9) 90.2 (87.6-93.0) 80.6 (77.1-84.3)
Hypertension / renal vascular disease 92.9 (90.6-95.3) 90.4 (87.7-93.1) 82.1 (78.6-85.7)
Glomerulonephritis 95.7 (94.7-96.7) 93.3 (92.0-94.6) 86.9 (85.2-88.6)
Other cause 95.5 (94.8-96.2) 94.1 (93.2-94.9) 88.3 (87.1-89.4)
All 95.2 (94.7-95.8) 93.3 (92.6-94.0) 86.8 (85.9-87.7)
* Based on data from Austria, Belgium (Dutch-speaking), Belgium (French-speaking), Denmark, Finland, Greece, Iceland, Norway, Spain (Andalusia), Spain (Aragon), Spain (Asturias), Spain (Basque country), Spain (Cantabria), Spain (Castile and León), Spain (Catalonia), Spain (Extremadura), Spain (Valencian region), Sweden, the Netherlands, United Kingdom (All countries)
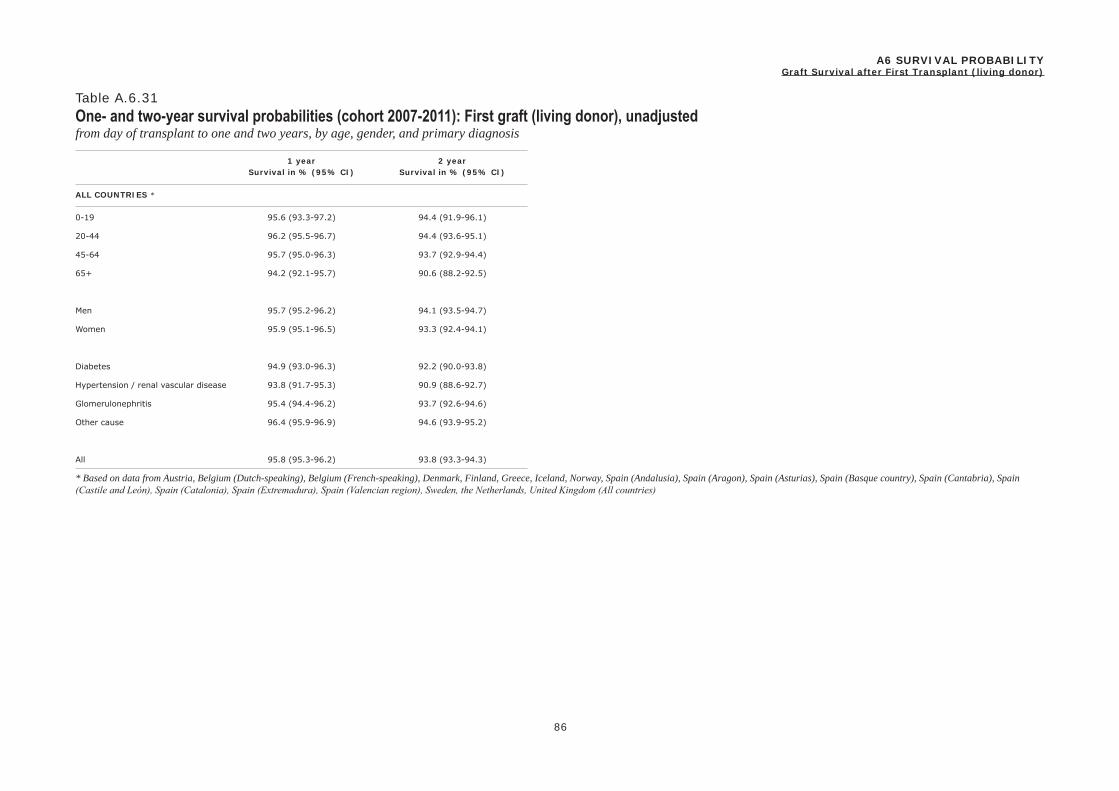
1 year 2 year
86
Survival in % (95% CI) Survival in % (95% CI)
ALL COUNTRIES *
A6 SURVIVAL PROBABILITYGraft Survival after First Transplant (living donor)
Table A.6.31One- and two-year survival probabilities (cohort 2007-2011): First graft (living donor), unadjustedfrom day of transplant to one and two years, by age, gender, and primary diagnosis
0-19 95.6 (93.3-97.2) 94.4 (91.9-96.1)
20-44 96.2 (95.5-96.7) 94.4 (93.6-95.1)
45-64 95.7 (95.0-96.3) 93.7 (92.9-94.4)
65+ 94.2 (92.1-95.7) 90.6 (88.2-92.5)
Men 95.7 (95.2-96.2) 94.1 (93.5-94.7)
Women 95.9 (95.1-96.5) 93.3 (92.4-94.1)
Diabetes 94.9 (93.0-96.3) 92.2 (90.0-93.8)
Hypertension / renal vascular disease 93.8 (91.7-95.3) 90.9 (88.6-92.7)
Glomerulonephritis 95.4 (94.4-96.2) 93.7 (92.6-94.6)
Other cause 96.4 (95.9-96.9) 94.6 (93.9-95.2)
All 95.8 (95.3-96.2) 93.8 (93.3-94.3)
* Based on data from Austria, Belgium (Dutch-speaking), Belgium (French-speaking), Denmark, Finland, Greece, Iceland, Norway, Spain (Andalusia), Spain (Aragon), Spain (Asturias), Spain (Basque country), Spain (Cantabria), Spain (Castile and León), Spain (Catalonia), Spain (Extremadura), Spain (Valencian region), Sweden, the Netherlands, United Kingdom (All countries)

1 year 2 year
87
Survival in % (95% CI) Survival in % (95% CI)
ALL COUNTRIES *
A6 SURVIVAL PROBABILITYGraft Survival after First Transplant (living donor)
Table A.6.32One- and two-year survival probabilities (cohort 2007-2011): First graft (living donor), adjustedfrom day of transplant to one and two years, adjusted for age, gender, and primary diagnosis
0-19 95.0 (92.8-97.3) 93.9 (91.5-96.4)
20-44 96.2 (95.5-96.8) 94.5 (93.7-95.2)
45-64 95.7 (95.1-96.4) 93.8 (93.0-94.6)
65+ 94.3 (92.4-96.3) 90.9 (88.6-93.4)
Men 95.9 (95.3-96.5) 94.4 (93.8-95.1)
Women 95.8 (95.0-96.5) 93.1 (92.2-94.0)
Diabetes 95.1 (93.6-96.8) 92.5 (90.6-94.5)
Hypertension / renal vascular disease 94.2 (92.4-96.0) 91.5 (89.4-93.7)
Glomerulonephritis 95.2 (94.3-96.2) 93.5 (92.4-94.6)
Other cause 96.4 (95.8-96.9) 94.6 (93.9-95.3)
All 95.8 (95.4-96.3) 93.9 (93.4-94.5)
* Based on data from Austria, Belgium (Dutch-speaking), Belgium (French-speaking), Denmark, Finland, Greece, Iceland, Norway, Spain (Andalusia), Spain (Aragon), Spain (Asturias), Spain (Basque country), Spain (Cantabria), Spain (Castile and León), Spain (Catalonia), Spain (Extremadura), Spain (Valencian region), Sweden, the Netherlands, United Kingdom (All countries)
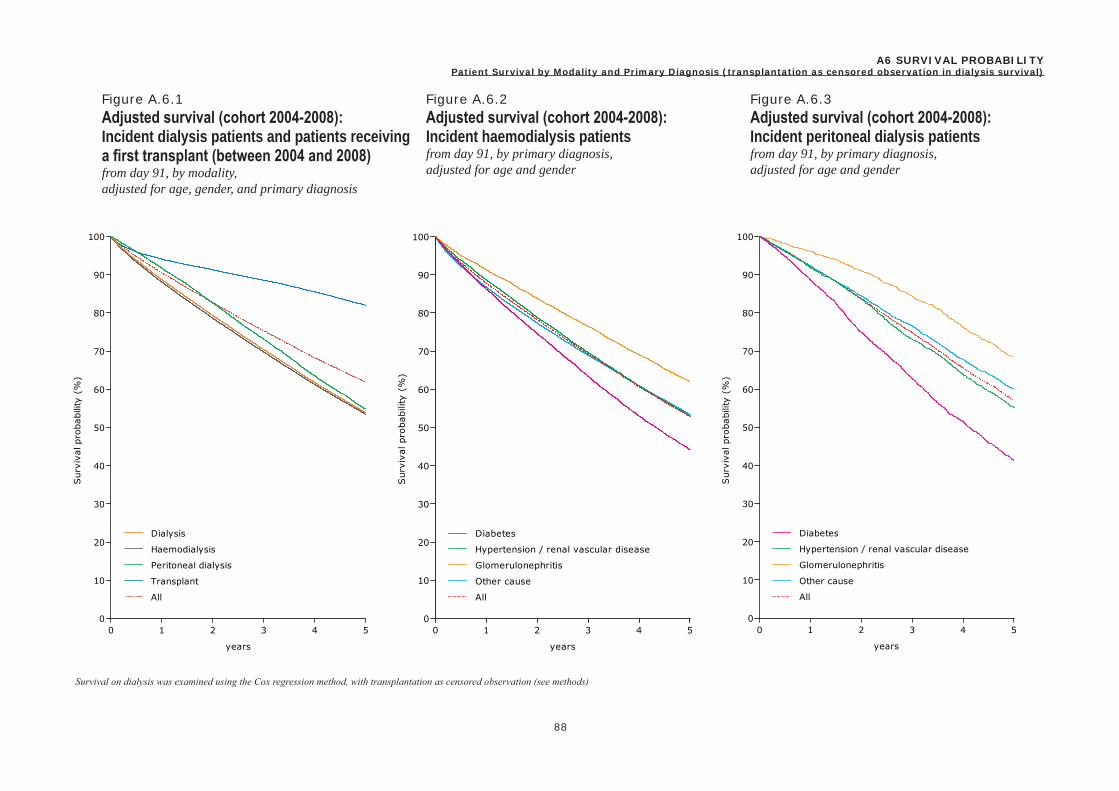
88
Figure A.6.1Adjusted survival (cohort 2004-2008): Incident dialysis patients and patients receiving a first transplant (between 2004 and 2008)from day 91, by modality, adjusted for age, gender, and primary diagnosis
A6 SURVIVAL PROBABILITYPatient Survival by Modality and Primary Diagnosis (transplantation as censored observation in dialysis survival)
Figure A.6.2Adjusted survival (cohort 2004-2008): Incident haemodialysis patientsfrom day 91, by primary diagnosis, adjusted for age and gender
Figure A.6.3Adjusted survival (cohort 2004-2008): Incident peritoneal dialysis patientsfrom day 91, by primary diagnosis, adjusted for age and gender
Survival on dialysis was examined using the Cox regression method, with transplantation as censored observation (see methods)
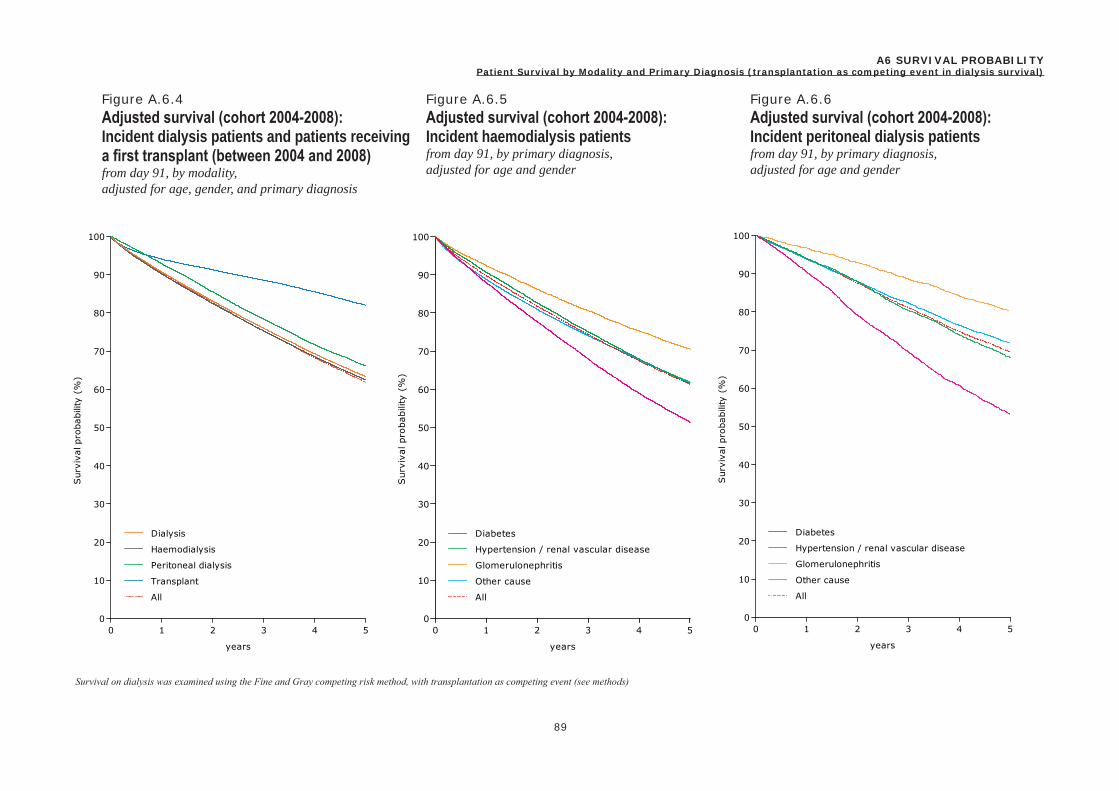
89
Figure A.6.4Adjusted survival (cohort 2004-2008): Incident dialysis patients and patients receiving a first transplant (between 2004 and 2008)from day 91, by modality, adjusted for age, gender, and primary diagnosis
A6 SURVIVAL PROBABILITYPatient Survival by Modality and Primary Diagnosis (transplantation as competing event in dialysis survival)
Figure A.6.5Adjusted survival (cohort 2004-2008): Incident haemodialysis patientsfrom day 91, by primary diagnosis, adjusted for age and gender
Figure A.6.6Adjusted survival (cohort 2004-2008): Incident peritoneal dialysis patientsfrom day 91, by primary diagnosis, adjusted for age and gender
Survival on dialysis was examined using the Fine and Gray competing risk method, with transplantation as competing event (see methods)
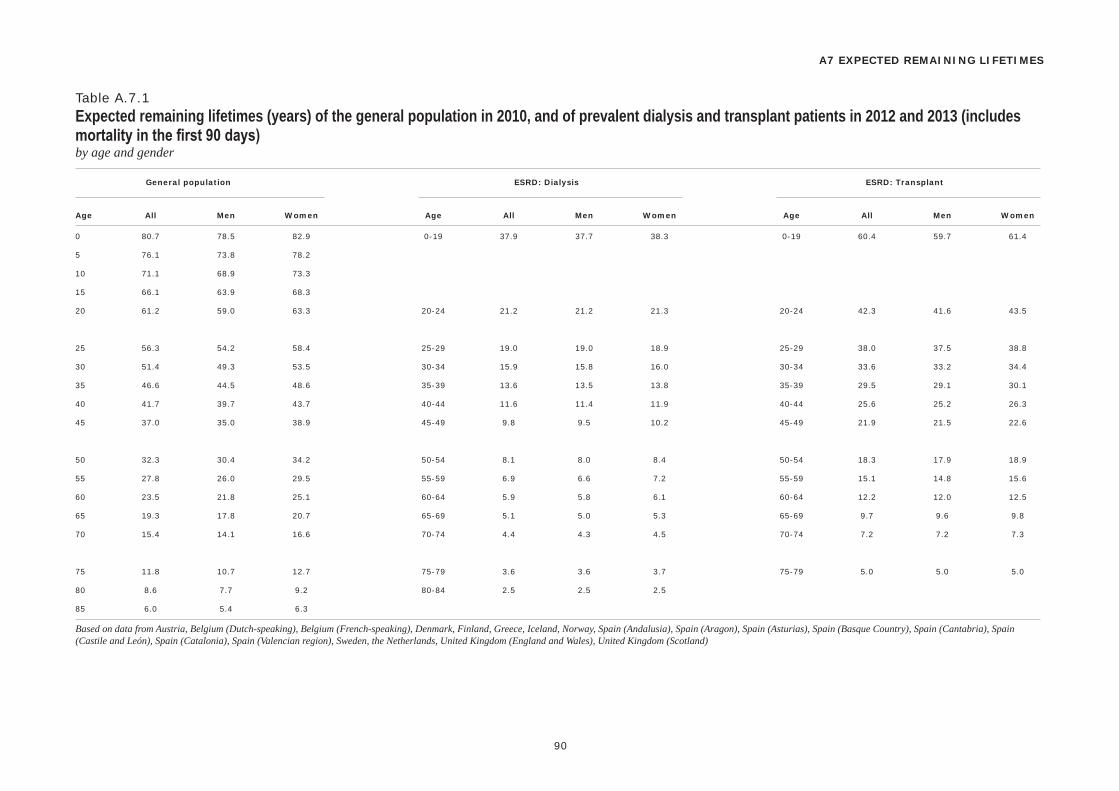
Age All Men Women Age All Men Women Age All Men Women
General population ESRD: Dialysis ESRD: Transplant
90
A7 EXPECTED REMAINING LIFETIMES
Table A.7.1Expected remaining lifetimes (years) of the general population in 2010, and of prevalent dialysis and transplant patients in 2012 and 2013 (includes mortality in the first 90 days)by age and gender
0 80.7 78.5 82.9 0-19 37.9 37.7 38.3 0-19 60.4 59.7 61.4
5 76.1 73.8 78.2
10 71.1 68.9 73.3
15 66.1 63.9 68.3
20 61.2 59.0 63.3 20-24 21.2 21.2 21.3 20-24 42.3 41.6 43.5
25 56.3 54.2 58.4 25-29 19.0 19.0 18.9 25-29 38.0 37.5 38.8
30 51.4 49.3 53.5 30-34 15.9 15.8 16.0 30-34 33.6 33.2 34.4
35 46.6 44.5 48.6 35-39 13.6 13.5 13.8 35-39 29.5 29.1 30.1
40 41.7 39.7 43.7 40-44 11.6 11.4 11.9 40-44 25.6 25.2 26.3
45 37.0 35.0 38.9 45-49 9.8 9.5 10.2 45-49 21.9 21.5 22.6
50 32.3 30.4 34.2 50-54 8.1 8.0 8.4 50-54 18.3 17.9 18.9
55 27.8 26.0 29.5 55-59 6.9 6.6 7.2 55-59 15.1 14.8 15.6
60 23.5 21.8 25.1 60-64 5.9 5.8 6.1 60-64 12.2 12.0 12.5
65 19.3 17.8 20.7 65-69 5.1 5.0 5.3 65-69 9.7 9.6 9.8
70 15.4 14.1 16.6 70-74 4.4 4.3 4.5 70-74 7.2 7.2 7.3
75 11.8 10.7 12.7 75-79 3.6 3.6 3.7 75-79 5.0 5.0 5.0
80 8.6 7.7 9.2 80-84 2.5 2.5 2.5
85 6.0 5.4 6.3
Based on data from Austria, Belgium (Dutch-speaking), Belgium (French-speaking), Denmark, Finland, Greece, Iceland, Norway, Spain (Andalusia), Spain (Aragon), Spain (Asturias), Spain (Basque Country), Spain (Cantabria), Spain (Castile and León), Spain (Catalonia), Spain (Valencian region), Sweden, the Netherlands, United Kingdom (England and Wales), United Kingdom (Scotland)

III Reference Tables - Section B
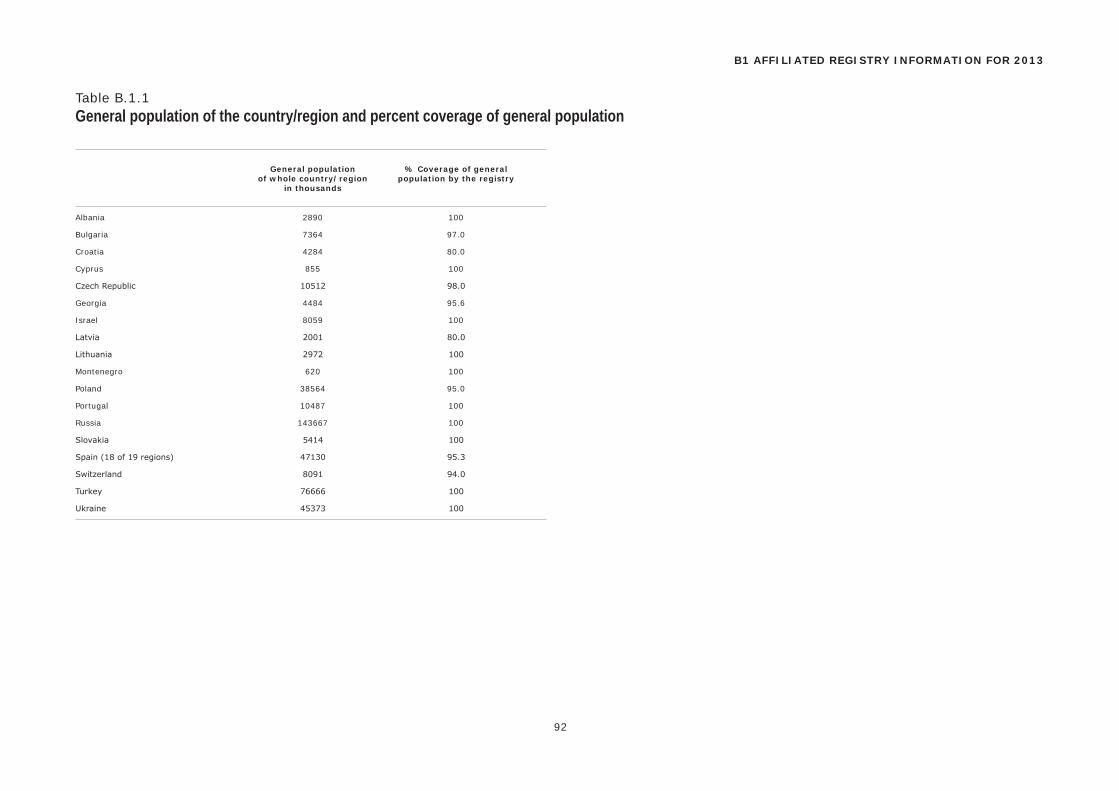
92
General population % Coverage of general of whole country/region population by the registry in thousands
B1 AFFILIATED REGISTRY INFORMATION FOR 2013
Table B.1.1General population of the country/region and percent coverage of general population
Albania 2890 100
Bulgaria 7364 97.0
Croatia 4284 80.0
Cyprus 855 100
Czech Republic 10512 98.0
Georgia 4484 95.6
Israel 8059 100
Latvia 2001 80.0
Lithuania 2972 100
Montenegro 620 100
Poland 38564 95.0
Portugal 10487 100
Russia 143667 100
Slovakia 5414 100
Spain (18 of 19 regions) 47130 95.3
Switzerland 8091 94.0
Turkey 76666 100
Ukraine 45373 100
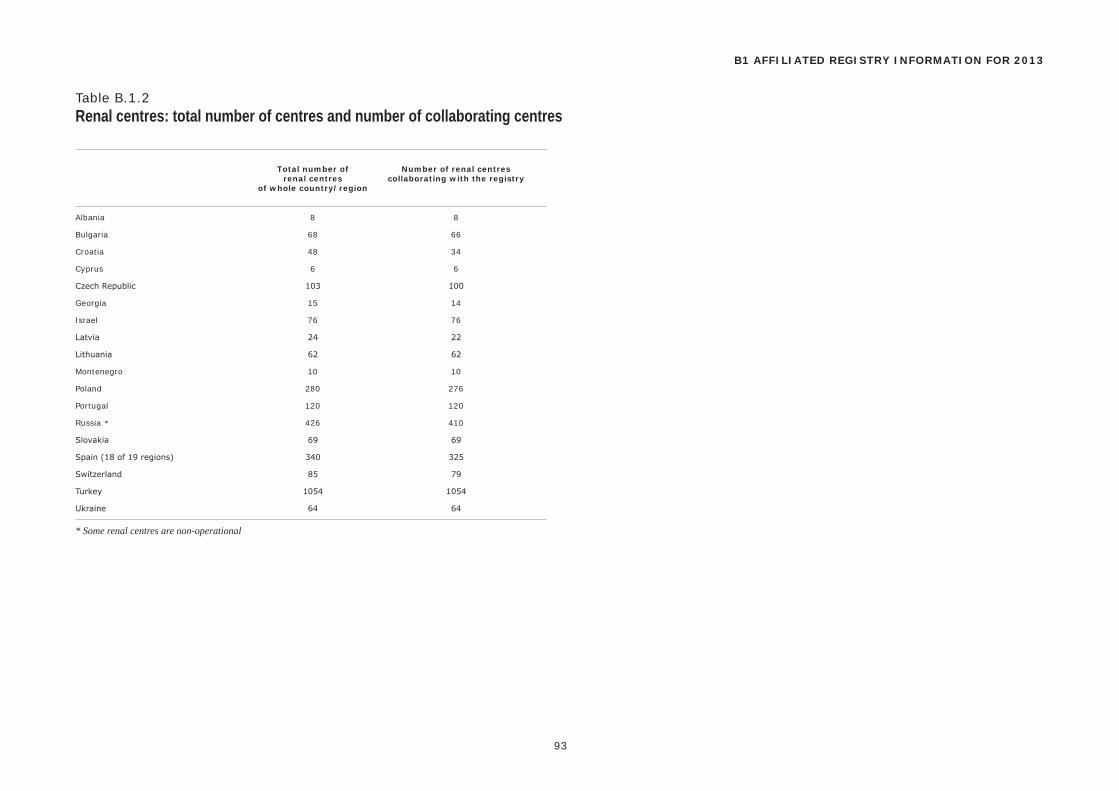
93
Total number of Number of renal centres renal centres collaborating with the registry of whole country/region
B1 AFFILIATED REGISTRY INFORMATION FOR 2013
Table B.1.2Renal centres: total number of centres and number of collaborating centres
Albania 8 8
Bulgaria 68 66
Croatia 48 34
Cyprus 6 6
Czech Republic 103 100
Georgia 15 14
Israel 76 76
Latvia 24 22
Lithuania 62 62
Montenegro 10 10
Poland 280 276
Portugal 120 120
Russia * 426 410
Slovakia 69 69
Spain (18 of 19 regions) 340 325
Switzerland 85 79
Turkey 1054 1054
Ukraine 64 64
* Some renal centres are non-operational
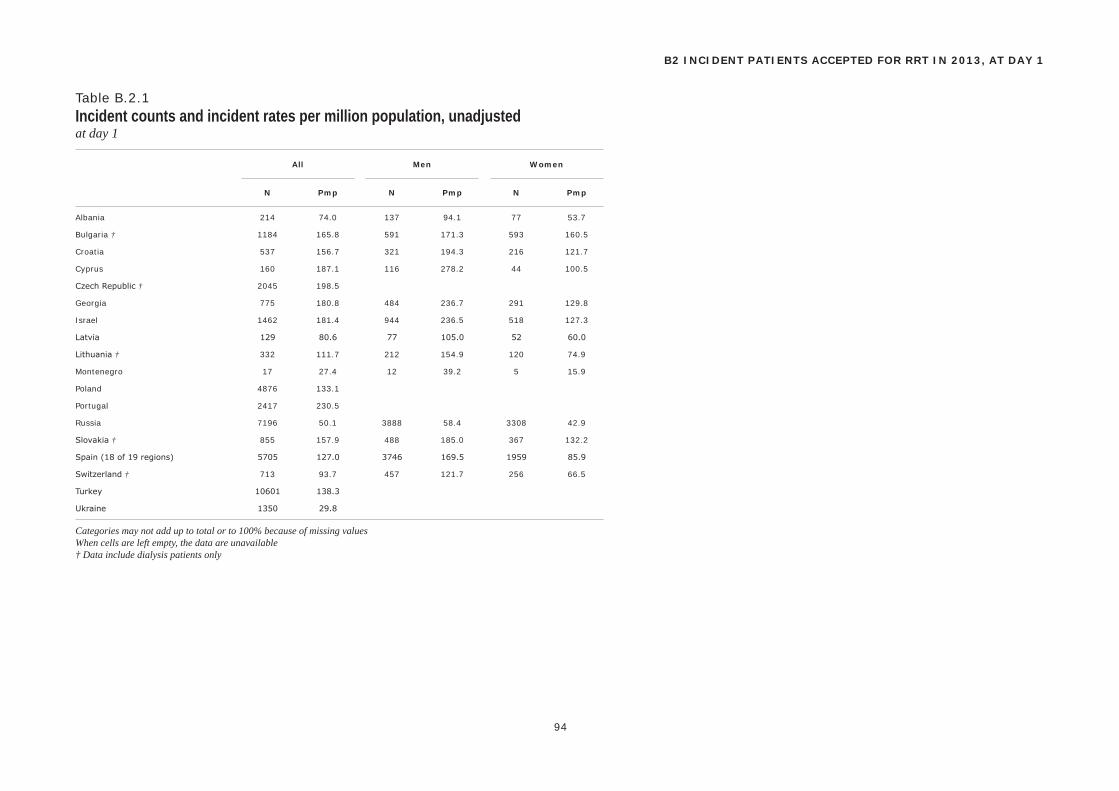
N Pmp N Pmp N Pmp
All Men Women
94
B2 INCIDENT PATIENTS ACCEPTED FOR RRT IN 2013, AT DAY 1
Table B.2.1Incident counts and incident rates per million population, unadjustedat day 1
Albania 214 74.0 137 94.1 77 53.7
Bulgaria † 1184 165.8 591 171.3 593 160.5
Croatia 537 156.7 321 194.3 216 121.7
Cyprus 160 187.1 116 278.2 44 100.5
Czech Republic † 2045 198.5
Georgia 775 180.8 484 236.7 291 129.8
Israel 1462 181.4 944 236.5 518 127.3
Latvia 129 80.6 77 105.0 52 60.0
Lithuania † 332 111.7 212 154.9 120 74.9
Montenegro 17 27.4 12 39.2 5 15.9
Poland 4876 133.1
Portugal 2417 230.5
Russia 7196 50.1 3888 58.4 3308 42.9
Slovakia † 855 157.9 488 185.0 367 132.2
Spain (18 of 19 regions) 5705 127.0 3746 169.5 1959 85.9
Switzerland † 713 93.7 457 121.7 256 66.5
Turkey 10601 138.3
Ukraine 1350 29.8
Categories may not add up to total or to 100% because of missing valuesWhen cells are left empty, the data are unavailable† Data include dialysis patients only
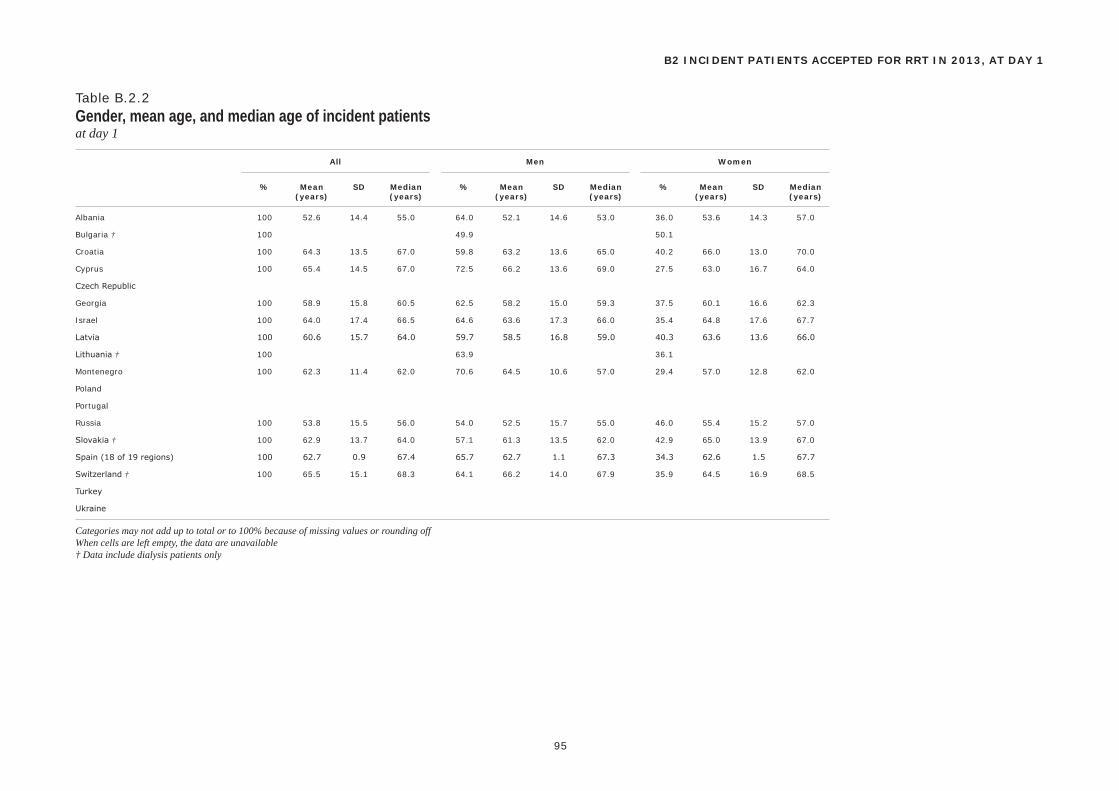
% Mean SD Median % Mean SD Median % Mean SD Median (years) (years) (years) (years) (years) (years)
All Men Women
95
B2 INCIDENT PATIENTS ACCEPTED FOR RRT IN 2013, AT DAY 1
Table B.2.2Gender, mean age, and median age of incident patientsat day 1
Albania 100 52.6 14.4 55.0 64.0 52.1 14.6 53.0 36.0 53.6 14.3 57.0
Bulgaria † 100 49.9 50.1
Croatia 100 64.3 13.5 67.0 59.8 63.2 13.6 65.0 40.2 66.0 13.0 70.0
Cyprus 100 65.4 14.5 67.0 72.5 66.2 13.6 69.0 27.5 63.0 16.7 64.0
Czech Republic
Georgia 100 58.9 15.8 60.5 62.5 58.2 15.0 59.3 37.5 60.1 16.6 62.3
Israel 100 64.0 17.4 66.5 64.6 63.6 17.3 66.0 35.4 64.8 17.6 67.7
Latvia 100 60.6 15.7 64.0 59.7 58.5 16.8 59.0 40.3 63.6 13.6 66.0
Lithuania † 100 63.9 36.1
Montenegro 100 62.3 11.4 62.0 70.6 64.5 10.6 57.0 29.4 57.0 12.8 62.0
Poland
Portugal
Russia 100 53.8 15.5 56.0 54.0 52.5 15.7 55.0 46.0 55.4 15.2 57.0
Slovakia † 100 62.9 13.7 64.0 57.1 61.3 13.5 62.0 42.9 65.0 13.9 67.0
Spain (18 of 19 regions) 100 62.7 0.9 67.4 65.7 62.7 1.1 67.3 34.3 62.6 1.5 67.7
Switzerland † 100 65.5 15.1 68.3 64.1 66.2 14.0 67.9 35.9 64.5 16.9 68.5
Turkey
Ukraine
Categories may not add up to total or to 100% because of missing values or rounding offWhen cells are left empty, the data are unavailable† Data include dialysis patients only
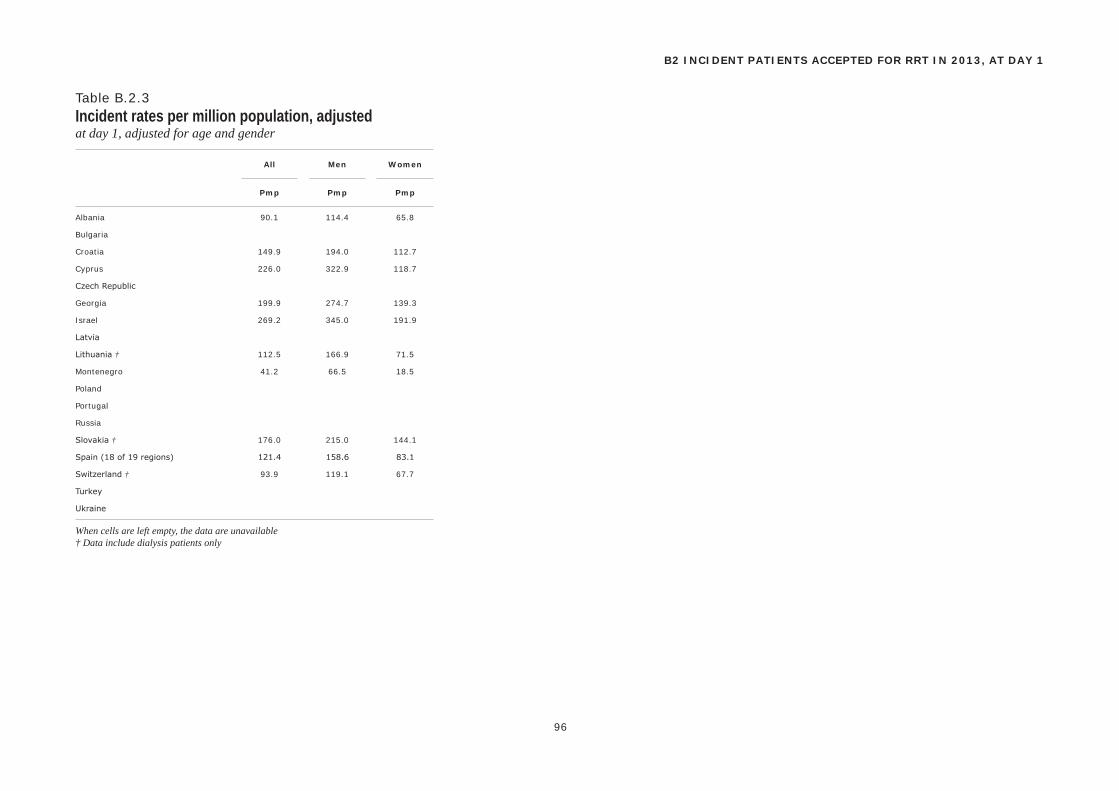
Pmp Pmp Pmp
All Men Women
96
B2 INCIDENT PATIENTS ACCEPTED FOR RRT IN 2013, AT DAY 1
Table B.2.3Incident rates per million population, adjustedat day 1, adjusted for age and gender
Albania 90.1 114.4 65.8
Bulgaria
Croatia 149.9 194.0 112.7
Cyprus 226.0 322.9 118.7
Czech Republic
Georgia 199.9 274.7 139.3
Israel 269.2 345.0 191.9
Latvia
Lithuania † 112.5 166.9 71.5
Montenegro 41.2 66.5 18.5
Poland
Portugal
Russia
Slovakia † 176.0 215.0 144.1
Spain (18 of 19 regions) 121.4 158.6 83.1
Switzerland † 93.9 119.1 67.7
Turkey
Ukraine
When cells are left empty, the data are unavailable† Data include dialysis patients only
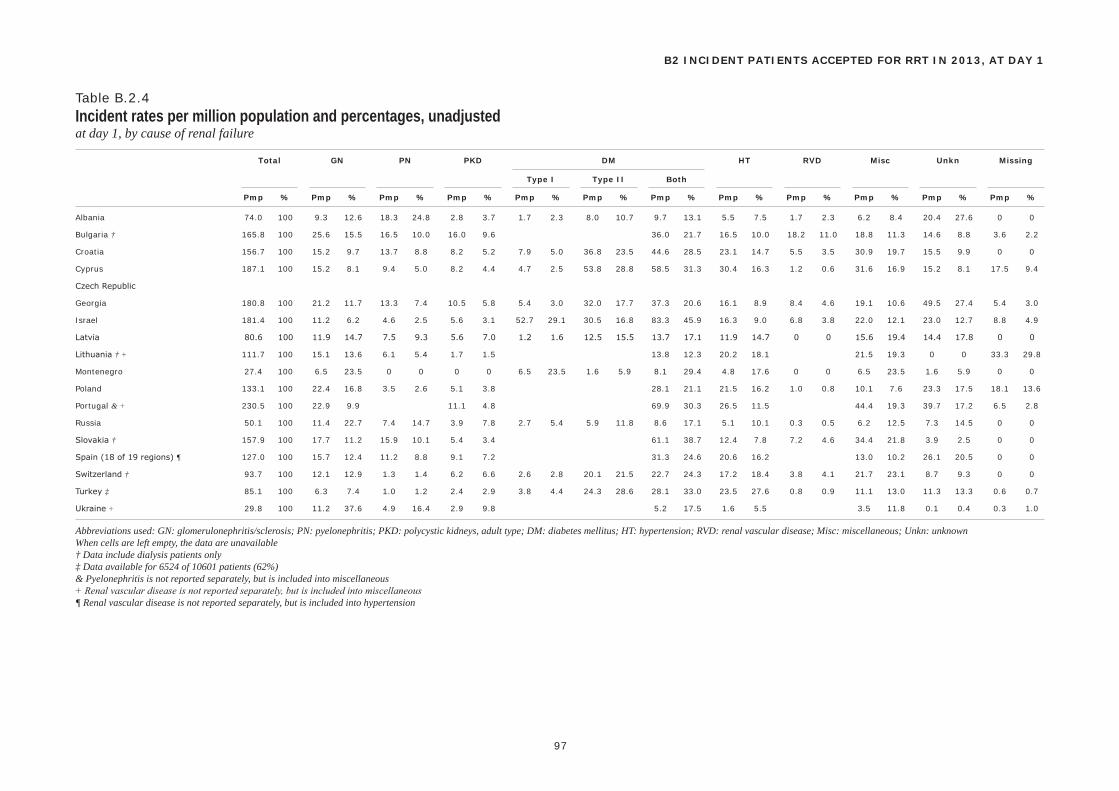
Total GN PN PKD DM HT RVD Misc Unkn Missing
Type I Type II Both
Pmp % Pmp % Pmp % Pmp % Pmp % Pmp % Pmp % Pmp % Pmp % Pmp % Pmp % Pmp %
97
B2 INCIDENT PATIENTS ACCEPTED FOR RRT IN 2013, AT DAY 1
Table B.2.4Incident rates per million population and percentages, unadjustedat day 1, by cause of renal failure
Albania 74.0 100 9.3 12.6 18.3 24.8 2.8 3.7 1.7 2.3 8.0 10.7 9.7 13.1 5.5 7.5 1.7 2.3 6.2 8.4 20.4 27.6 0 0
Bulgaria † 165.8 100 25.6 15.5 16.5 10.0 16.0 9.6 36.0 21.7 16.5 10.0 18.2 11.0 18.8 11.3 14.6 8.8 3.6 2.2
Croatia 156.7 100 15.2 9.7 13.7 8.8 8.2 5.2 7.9 5.0 36.8 23.5 44.6 28.5 23.1 14.7 5.5 3.5 30.9 19.7 15.5 9.9 0 0
Cyprus 187.1 100 15.2 8.1 9.4 5.0 8.2 4.4 4.7 2.5 53.8 28.8 58.5 31.3 30.4 16.3 1.2 0.6 31.6 16.9 15.2 8.1 17.5 9.4
Czech Republic
Georgia 180.8 100 21.2 11.7 13.3 7.4 10.5 5.8 5.4 3.0 32.0 17.7 37.3 20.6 16.1 8.9 8.4 4.6 19.1 10.6 49.5 27.4 5.4 3.0
Israel 181.4 100 11.2 6.2 4.6 2.5 5.6 3.1 52.7 29.1 30.5 16.8 83.3 45.9 16.3 9.0 6.8 3.8 22.0 12.1 23.0 12.7 8.8 4.9
Latvia 80.6 100 11.9 14.7 7.5 9.3 5.6 7.0 1.2 1.6 12.5 15.5 13.7 17.1 11.9 14.7 0 0 15.6 19.4 14.4 17.8 0 0
Lithuania † + 111.7 100 15.1 13.6 6.1 5.4 1.7 1.5 13.8 12.3 20.2 18.1 21.5 19.3 0 0 33.3 29.8
Montenegro 27.4 100 6.5 23.5 0 0 0 0 6.5 23.5 1.6 5.9 8.1 29.4 4.8 17.6 0 0 6.5 23.5 1.6 5.9 0 0
Poland 133.1 100 22.4 16.8 3.5 2.6 5.1 3.8 28.1 21.1 21.5 16.2 1.0 0.8 10.1 7.6 23.3 17.5 18.1 13.6
Portugal & + 230.5 100 22.9 9.9 11.1 4.8 69.9 30.3 26.5 11.5 44.4 19.3 39.7 17.2 6.5 2.8
Russia 50.1 100 11.4 22.7 7.4 14.7 3.9 7.8 2.7 5.4 5.9 11.8 8.6 17.1 5.1 10.1 0.3 0.5 6.2 12.5 7.3 14.5 0 0
Slovakia † 157.9 100 17.7 11.2 15.9 10.1 5.4 3.4 61.1 38.7 12.4 7.8 7.2 4.6 34.4 21.8 3.9 2.5 0 0
Spain (18 of 19 regions) ¶ 127.0 100 15.7 12.4 11.2 8.8 9.1 7.2 31.3 24.6 20.6 16.2 13.0 10.2 26.1 20.5 0 0
Switzerland † 93.7 100 12.1 12.9 1.3 1.4 6.2 6.6 2.6 2.8 20.1 21.5 22.7 24.3 17.2 18.4 3.8 4.1 21.7 23.1 8.7 9.3 0 0
Turkey ‡ 85.1 100 6.3 7.4 1.0 1.2 2.4 2.9 3.8 4.4 24.3 28.6 28.1 33.0 23.5 27.6 0.8 0.9 11.1 13.0 11.3 13.3 0.6 0.7
Ukraine + 29.8 100 11.2 37.6 4.9 16.4 2.9 9.8 5.2 17.5 1.6 5.5 3.5 11.8 0.1 0.4 0.3 1.0
Abbreviations used: GN: glomerulonephritis/sclerosis; PN: pyelonephritis; PKD: polycystic kidneys, adult type; DM: diabetes mellitus; HT: hypertension; RVD: renal vascular disease; Misc: miscellaneous; Unkn: unknownWhen cells are left empty, the data are unavailable† Data include dialysis patients only‡ Data available for 6524 of 10601 patients (62%)& Pyelonephritis is not reported separately, but is included into miscellaneous+ Renal vascular disease is not reported separately, but is included into miscellaneous¶ Renal vascular disease is not reported separately, but is included into hypertension
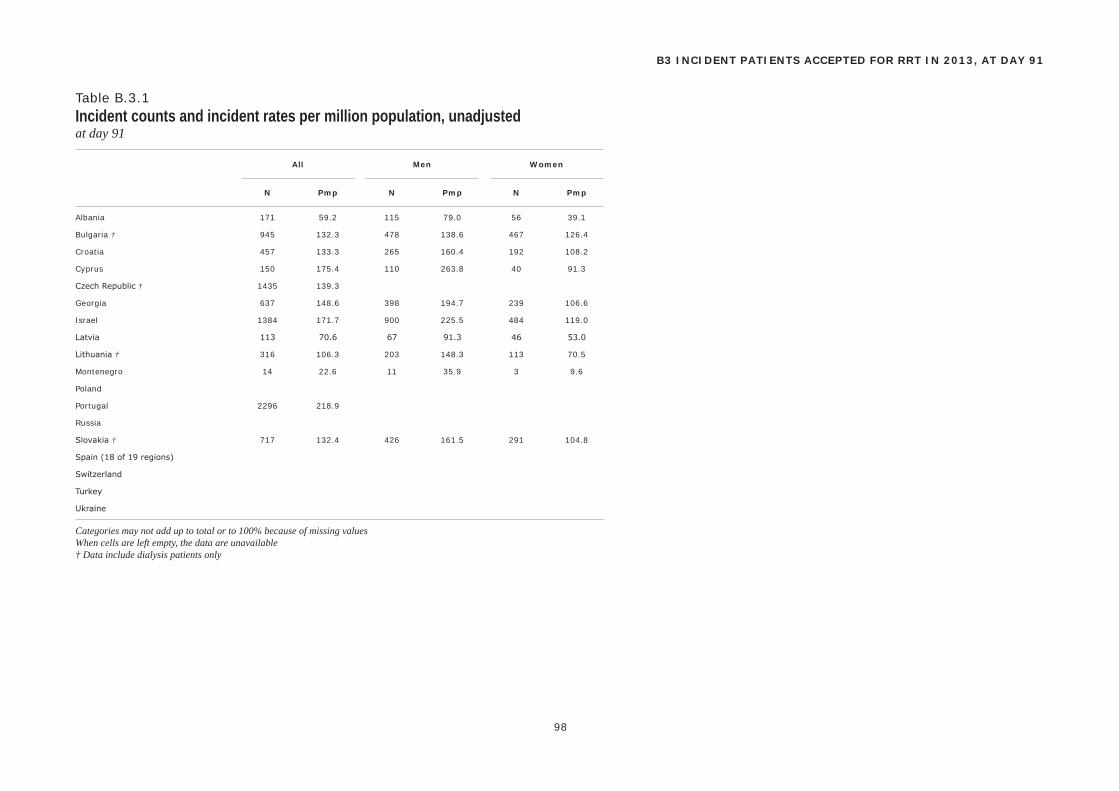
N Pmp N Pmp N Pmp
All Men Women
98
B3 INCIDENT PATIENTS ACCEPTED FOR RRT IN 2013, AT DAY 91
Table B.3.1Incident counts and incident rates per million population, unadjustedat day 91
Albania 171 59.2 115 79.0 56 39.1
Bulgaria † 945 132.3 478 138.6 467 126.4
Croatia 457 133.3 265 160.4 192 108.2
Cyprus 150 175.4 110 263.8 40 91.3
Czech Republic † 1435 139.3
Georgia 637 148.6 398 194.7 239 106.6
Israel 1384 171.7 900 225.5 484 119.0
Latvia 113 70.6 67 91.3 46 53.0
Lithuania † 316 106.3 203 148.3 113 70.5
Montenegro 14 22.6 11 35.9 3 9.6
Poland
Portugal 2296 218.9
Russia
Slovakia † 717 132.4 426 161.5 291 104.8
Spain (18 of 19 regions)
Switzerland
Turkey
Ukraine
Categories may not add up to total or to 100% because of missing valuesWhen cells are left empty, the data are unavailable† Data include dialysis patients only
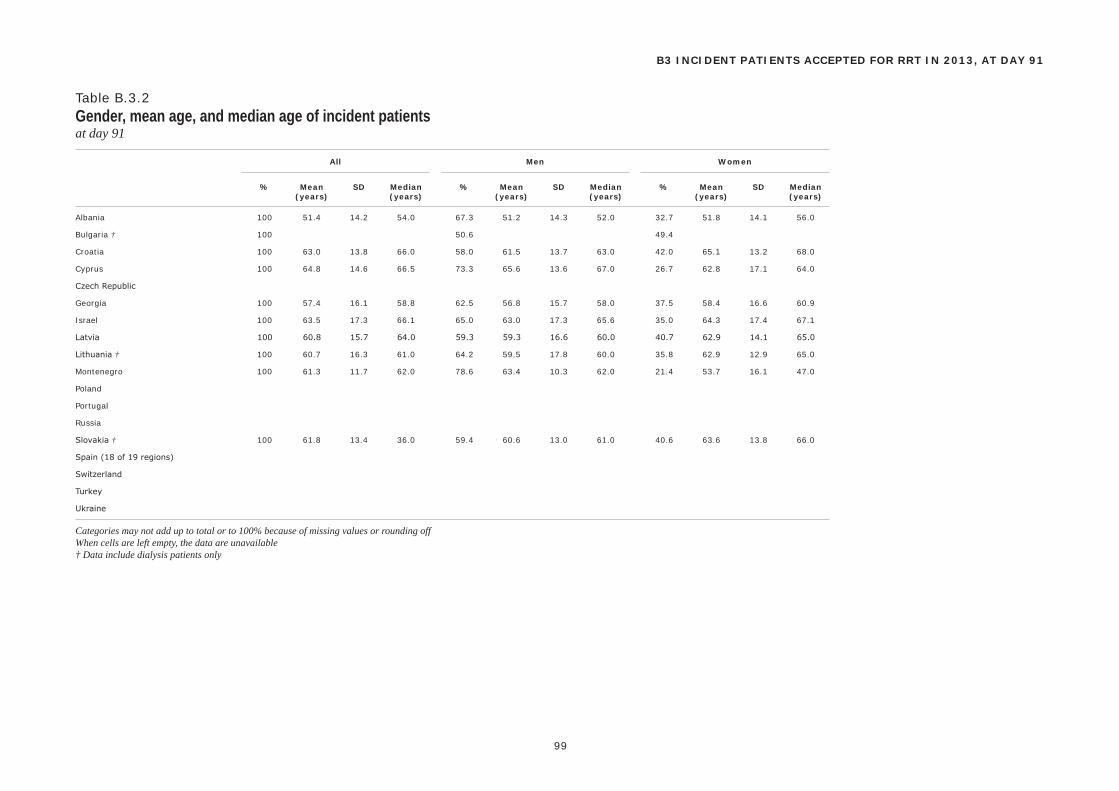
% Mean SD Median % Mean SD Median % Mean SD Median (years) (years) (years) (years) (years) (years)
All Men Women
99
B3 INCIDENT PATIENTS ACCEPTED FOR RRT IN 2013, AT DAY 91
Table B.3.2Gender, mean age, and median age of incident patientsat day 91
Albania 100 51.4 14.2 54.0 67.3 51.2 14.3 52.0 32.7 51.8 14.1 56.0
Bulgaria † 100 50.6 49.4
Croatia 100 63.0 13.8 66.0 58.0 61.5 13.7 63.0 42.0 65.1 13.2 68.0
Cyprus 100 64.8 14.6 66.5 73.3 65.6 13.6 67.0 26.7 62.8 17.1 64.0
Czech Republic
Georgia 100 57.4 16.1 58.8 62.5 56.8 15.7 58.0 37.5 58.4 16.6 60.9
Israel 100 63.5 17.3 66.1 65.0 63.0 17.3 65.6 35.0 64.3 17.4 67.1
Latvia 100 60.8 15.7 64.0 59.3 59.3 16.6 60.0 40.7 62.9 14.1 65.0
Lithuania † 100 60.7 16.3 61.0 64.2 59.5 17.8 60.0 35.8 62.9 12.9 65.0
Montenegro 100 61.3 11.7 62.0 78.6 63.4 10.3 62.0 21.4 53.7 16.1 47.0
Poland
Portugal
Russia
Slovakia † 100 61.8 13.4 36.0 59.4 60.6 13.0 61.0 40.6 63.6 13.8 66.0
Spain (18 of 19 regions)
Switzerland
Turkey
Ukraine
Categories may not add up to total or to 100% because of missing values or rounding offWhen cells are left empty, the data are unavailable† Data include dialysis patients only

Pmp Pmp Pmp
All Men Women
100
B3 INCIDENT PATIENTS ACCEPTED FOR RRT IN 2013, AT DAY 91
Table B.3.3Incident rates per million population, adjustedat day 91, adjusted for age and gender
Albania 65.1 87.1 43.2
Bulgaria
Croatia 127.2 158.8 100.1
Cyprus 212.9 304.2 113.2
Czech Republic
Georgia 163.1 224.9 112.8
Israel 254.0 328.6 178.6
Latvia
Lithuania † 107.0 159.8 67.3
Montenegro 33.9 58.9 11.3
Poland
Portugal
Russia
Slovakia † 144.9 184.4 112.0
Spain (18 of 19 regions)
Switzerland
Turkey
Ukraine
When cells are left empty, the data are unavailable† Data include dialysis patients only
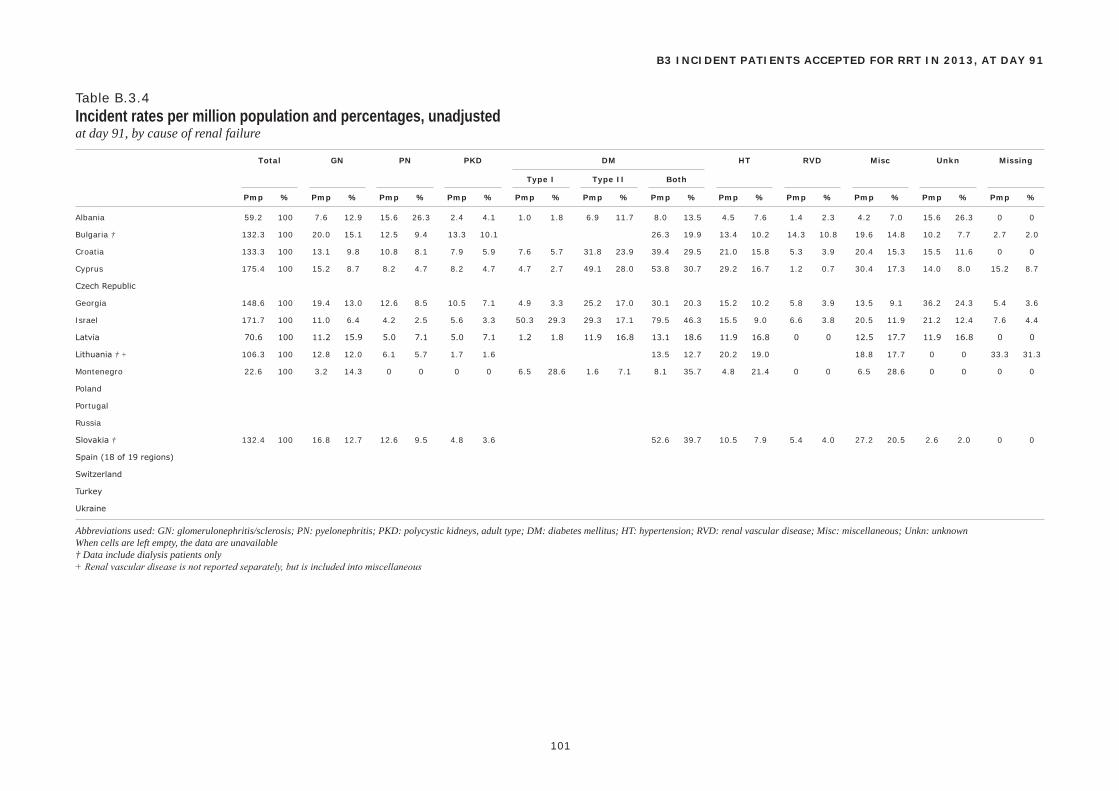
Total GN PN PKD DM HT RVD Misc Unkn Missing
Type I Type II Both
Pmp % Pmp % Pmp % Pmp % Pmp % Pmp % Pmp % Pmp % Pmp % Pmp % Pmp % Pmp %
101
B3 INCIDENT PATIENTS ACCEPTED FOR RRT IN 2013, AT DAY 91
Table B.3.4Incident rates per million population and percentages, unadjustedat day 91, by cause of renal failure
Albania 59.2 100 7.6 12.9 15.6 26.3 2.4 4.1 1.0 1.8 6.9 11.7 8.0 13.5 4.5 7.6 1.4 2.3 4.2 7.0 15.6 26.3 0 0
Bulgaria † 132.3 100 20.0 15.1 12.5 9.4 13.3 10.1 26.3 19.9 13.4 10.2 14.3 10.8 19.6 14.8 10.2 7.7 2.7 2.0
Croatia 133.3 100 13.1 9.8 10.8 8.1 7.9 5.9 7.6 5.7 31.8 23.9 39.4 29.5 21.0 15.8 5.3 3.9 20.4 15.3 15.5 11.6 0 0
Cyprus 175.4 100 15.2 8.7 8.2 4.7 8.2 4.7 4.7 2.7 49.1 28.0 53.8 30.7 29.2 16.7 1.2 0.7 30.4 17.3 14.0 8.0 15.2 8.7
Czech Republic
Georgia 148.6 100 19.4 13.0 12.6 8.5 10.5 7.1 4.9 3.3 25.2 17.0 30.1 20.3 15.2 10.2 5.8 3.9 13.5 9.1 36.2 24.3 5.4 3.6
Israel 171.7 100 11.0 6.4 4.2 2.5 5.6 3.3 50.3 29.3 29.3 17.1 79.5 46.3 15.5 9.0 6.6 3.8 20.5 11.9 21.2 12.4 7.6 4.4
Latvia 70.6 100 11.2 15.9 5.0 7.1 5.0 7.1 1.2 1.8 11.9 16.8 13.1 18.6 11.9 16.8 0 0 12.5 17.7 11.9 16.8 0 0
Lithuania † + 106.3 100 12.8 12.0 6.1 5.7 1.7 1.6 13.5 12.7 20.2 19.0 18.8 17.7 0 0 33.3 31.3
Montenegro 22.6 100 3.2 14.3 0 0 0 0 6.5 28.6 1.6 7.1 8.1 35.7 4.8 21.4 0 0 6.5 28.6 0 0 0 0
Poland
Portugal
Russia
Slovakia † 132.4 100 16.8 12.7 12.6 9.5 4.8 3.6 52.6 39.7 10.5 7.9 5.4 4.0 27.2 20.5 2.6 2.0 0 0
Spain (18 of 19 regions)
Switzerland
Turkey
Ukraine
Abbreviations used: GN: glomerulonephritis/sclerosis; PN: pyelonephritis; PKD: polycystic kidneys, adult type; DM: diabetes mellitus; HT: hypertension; RVD: renal vascular disease; Misc: miscellaneous; Unkn: unknownWhen cells are left empty, the data are unavailable† Data include dialysis patients only+ Renal vascular disease is not reported separately, but is included into miscellaneous
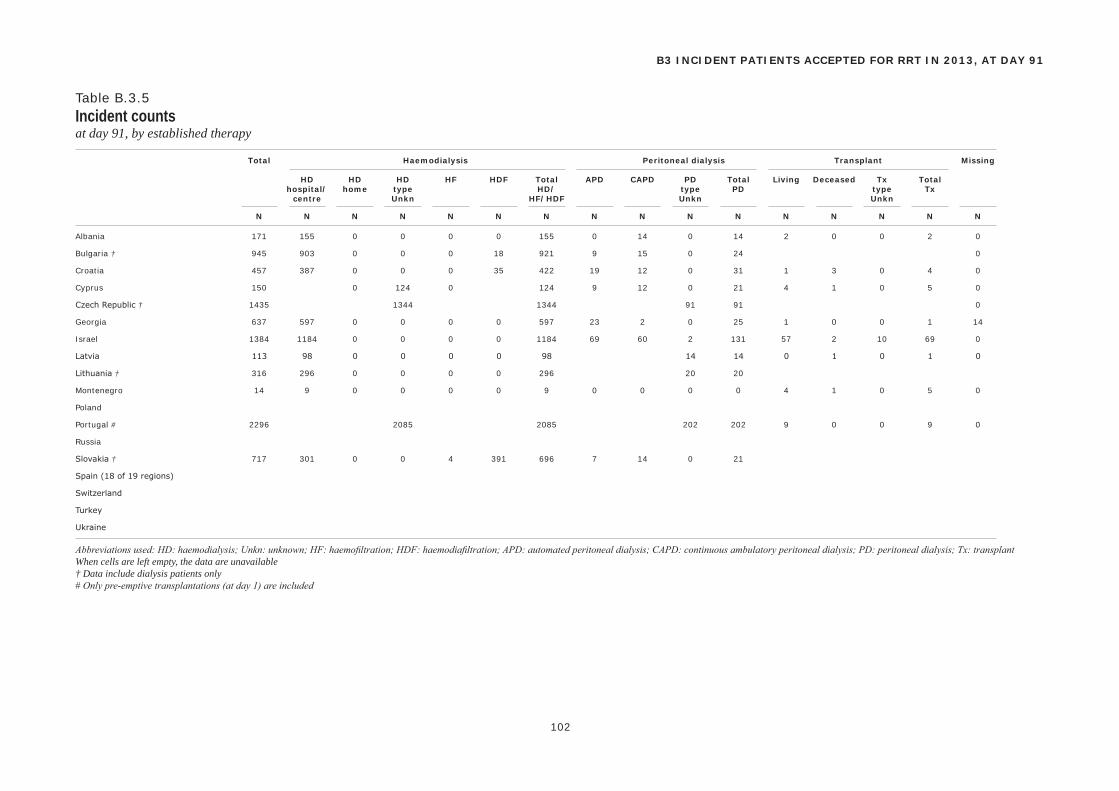
Total Haemodialysis Peritoneal dialysis Transplant Missing
HD HD HD HF HDF Total APD CAPD PD Total Living Deceased Tx Total hospital/ home type HD/ type PD type Tx centre Unkn HF/HDF Unkn Unkn
N N N N N N N N N N N N N N N N
102
B3 INCIDENT PATIENTS ACCEPTED FOR RRT IN 2013, AT DAY 91
Table B.3.5Incident countsat day 91, by established therapy
Albania 171 155 0 0 0 0 155 0 14 0 14 2 0 0 2 0
Bulgaria † 945 903 0 0 0 18 921 9 15 0 24 0
Croatia 457 387 0 0 0 35 422 19 12 0 31 1 3 0 4 0
Cyprus 150 0 124 0 124 9 12 0 21 4 1 0 5 0
Czech Republic † 1435 1344 1344 91 91 0
Georgia 637 597 0 0 0 0 597 23 2 0 25 1 0 0 1 14
Israel 1384 1184 0 0 0 0 1184 69 60 2 131 57 2 10 69 0
Latvia 113 98 0 0 0 0 98 14 14 0 1 0 1 0
Lithuania † 316 296 0 0 0 0 296 20 20
Montenegro 14 9 0 0 0 0 9 0 0 0 0 4 1 0 5 0
Poland
Portugal # 2296 2085 2085 202 202 9 0 0 9 0
Russia
Slovakia † 717 301 0 0 4 391 696 7 14 0 21
Spain (18 of 19 regions)
Switzerland
Turkey
Ukraine
Abbreviations used: HD: haemodialysis; Unkn: unknown; HF: haemofiltration; HDF: haemodiafiltration; APD: automated peritoneal dialysis; CAPD: continuous ambulatory peritoneal dialysis; PD: peritoneal dialysis; Tx: transplantWhen cells are left empty, the data are unavailable† Data include dialysis patients only# Only pre-emptive transplantations (at day 1) are included
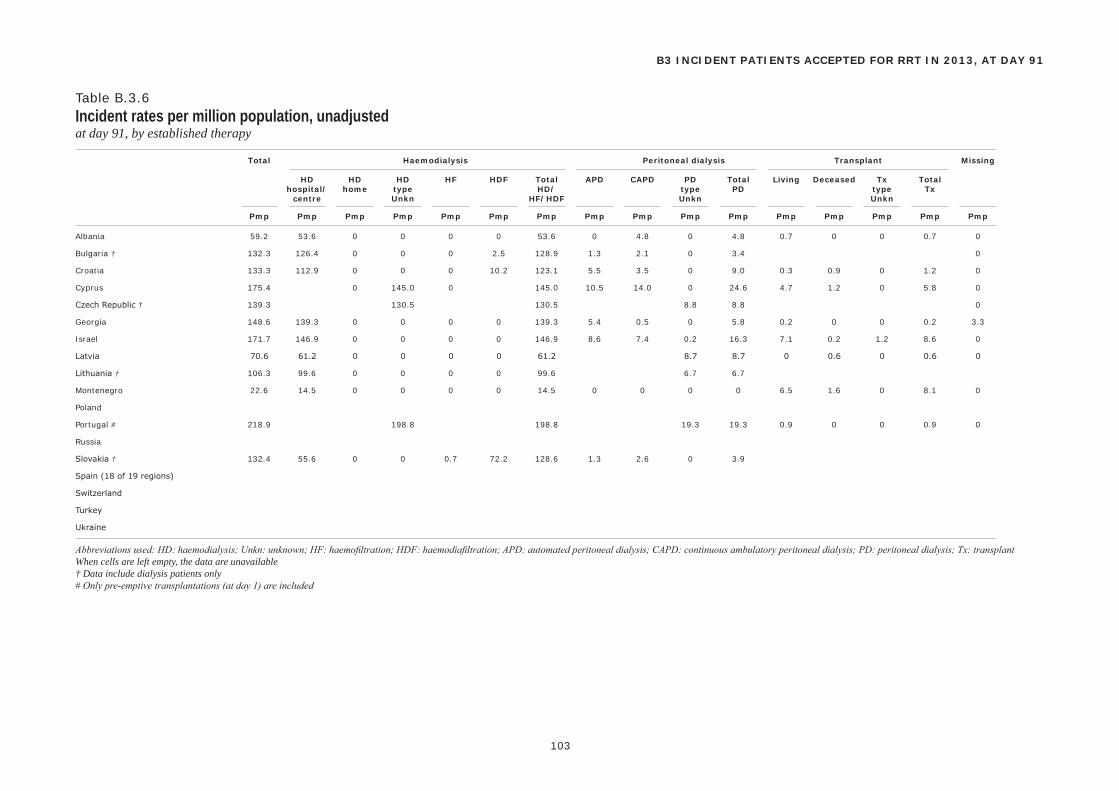
Total Haemodialysis Peritoneal dialysis Transplant Missing
HD HD HD HF HDF Total APD CAPD PD Total Living Deceased Tx Total hospital/ home type HD/ type PD type Tx centre Unkn HF/HDF Unkn Unkn
Pmp Pmp Pmp Pmp Pmp Pmp Pmp Pmp Pmp Pmp Pmp Pmp Pmp Pmp Pmp Pmp
103
B3 INCIDENT PATIENTS ACCEPTED FOR RRT IN 2013, AT DAY 91
Table B.3.6Incident rates per million population, unadjustedat day 91, by established therapy
Albania 59.2 53.6 0 0 0 0 53.6 0 4.8 0 4.8 0.7 0 0 0.7 0
Bulgaria † 132.3 126.4 0 0 0 2.5 128.9 1.3 2.1 0 3.4 0
Croatia 133.3 112.9 0 0 0 10.2 123.1 5.5 3.5 0 9.0 0.3 0.9 0 1.2 0
Cyprus 175.4 0 145.0 0 145.0 10.5 14.0 0 24.6 4.7 1.2 0 5.8 0
Czech Republic † 139.3 130.5 130.5 8.8 8.8 0
Georgia 148.6 139.3 0 0 0 0 139.3 5.4 0.5 0 5.8 0.2 0 0 0.2 3.3
Israel 171.7 146.9 0 0 0 0 146.9 8.6 7.4 0.2 16.3 7.1 0.2 1.2 8.6 0
Latvia 70.6 61.2 0 0 0 0 61.2 8.7 8.7 0 0.6 0 0.6 0
Lithuania † 106.3 99.6 0 0 0 0 99.6 6.7 6.7
Montenegro 22.6 14.5 0 0 0 0 14.5 0 0 0 0 6.5 1.6 0 8.1 0
Poland
Portugal # 218.9 198.8 198.8 19.3 19.3 0.9 0 0 0.9 0
Russia
Slovakia † 132.4 55.6 0 0 0.7 72.2 128.6 1.3 2.6 0 3.9
Spain (18 of 19 regions)
Switzerland
Turkey
Ukraine
Abbreviations used: HD: haemodialysis; Unkn: unknown; HF: haemofiltration; HDF: haemodiafiltration; APD: automated peritoneal dialysis; CAPD: continuous ambulatory peritoneal dialysis; PD: peritoneal dialysis; Tx: transplantWhen cells are left empty, the data are unavailable† Data include dialysis patients only# Only pre-emptive transplantations (at day 1) are included
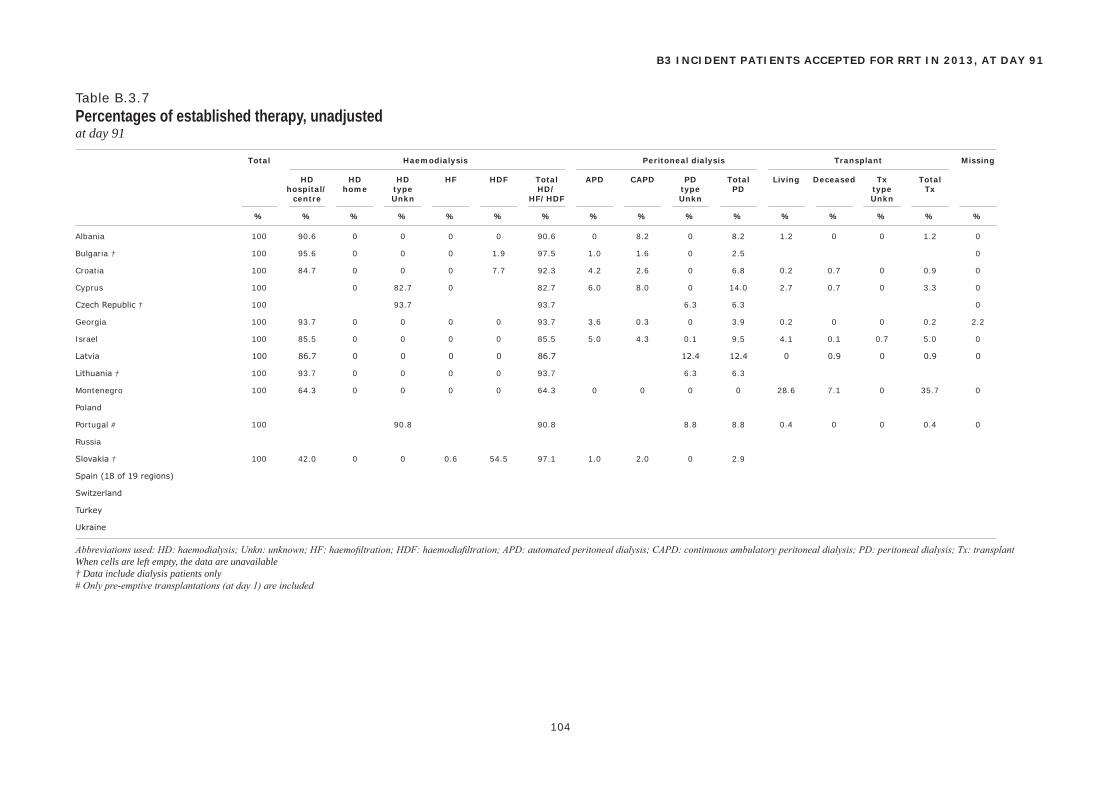
Total Haemodialysis Peritoneal dialysis Transplant Missing
HD HD HD HF HDF Total APD CAPD PD Total Living Deceased Tx Total hospital/ home type HD/ type PD type Tx centre Unkn HF/HDF Unkn Unkn
% % % % % % % % % % % % % % % %
104
B3 INCIDENT PATIENTS ACCEPTED FOR RRT IN 2013, AT DAY 91
Table B.3.7Percentages of established therapy, unadjustedat day 91
Albania 100 90.6 0 0 0 0 90.6 0 8.2 0 8.2 1.2 0 0 1.2 0
Bulgaria † 100 95.6 0 0 0 1.9 97.5 1.0 1.6 0 2.5 0
Croatia 100 84.7 0 0 0 7.7 92.3 4.2 2.6 0 6.8 0.2 0.7 0 0.9 0
Cyprus 100 0 82.7 0 82.7 6.0 8.0 0 14.0 2.7 0.7 0 3.3 0
Czech Republic † 100 93.7 93.7 6.3 6.3 0
Georgia 100 93.7 0 0 0 0 93.7 3.6 0.3 0 3.9 0.2 0 0 0.2 2.2
Israel 100 85.5 0 0 0 0 85.5 5.0 4.3 0.1 9.5 4.1 0.1 0.7 5.0 0
Latvia 100 86.7 0 0 0 0 86.7 12.4 12.4 0 0.9 0 0.9 0
Lithuania † 100 93.7 0 0 0 0 93.7 6.3 6.3
Montenegro 100 64.3 0 0 0 0 64.3 0 0 0 0 28.6 7.1 0 35.7 0
Poland
Portugal # 100 90.8 90.8 8.8 8.8 0.4 0 0 0.4 0
Russia
Slovakia † 100 42.0 0 0 0.6 54.5 97.1 1.0 2.0 0 2.9
Spain (18 of 19 regions)
Switzerland
Turkey
Ukraine
Abbreviations used: HD: haemodialysis; Unkn: unknown; HF: haemofiltration; HDF: haemodiafiltration; APD: automated peritoneal dialysis; CAPD: continuous ambulatory peritoneal dialysis; PD: peritoneal dialysis; Tx: transplantWhen cells are left empty, the data are unavailable† Data include dialysis patients only# Only pre-emptive transplantations (at day 1) are included
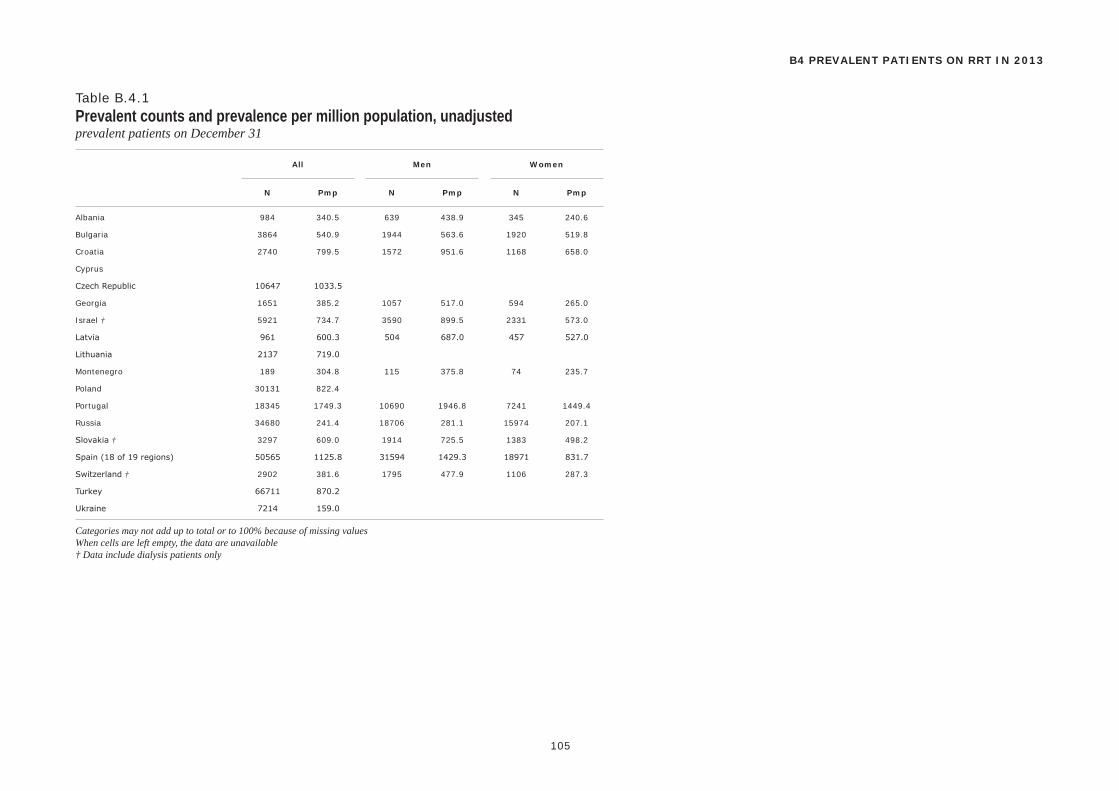
N Pmp N Pmp N Pmp
All Men Women
105
B4 PREVALENT PATIENTS ON RRT IN 2013
Table B.4.1Prevalent counts and prevalence per million population, unadjustedprevalent patients on December 31
Albania 984 340.5 639 438.9 345 240.6
Bulgaria 3864 540.9 1944 563.6 1920 519.8
Croatia 2740 799.5 1572 951.6 1168 658.0
Cyprus
Czech Republic 10647 1033.5
Georgia 1651 385.2 1057 517.0 594 265.0
Israel † 5921 734.7 3590 899.5 2331 573.0
Latvia 961 600.3 504 687.0 457 527.0
Lithuania 2137 719.0
Montenegro 189 304.8 115 375.8 74 235.7
Poland 30131 822.4
Portugal 18345 1749.3 10690 1946.8 7241 1449.4
Russia 34680 241.4 18706 281.1 15974 207.1
Slovakia † 3297 609.0 1914 725.5 1383 498.2
Spain (18 of 19 regions) 50565 1125.8 31594 1429.3 18971 831.7
Switzerland † 2902 381.6 1795 477.9 1106 287.3
Turkey 66711 870.2
Ukraine 7214 159.0
Categories may not add up to total or to 100% because of missing valuesWhen cells are left empty, the data are unavailable† Data include dialysis patients only
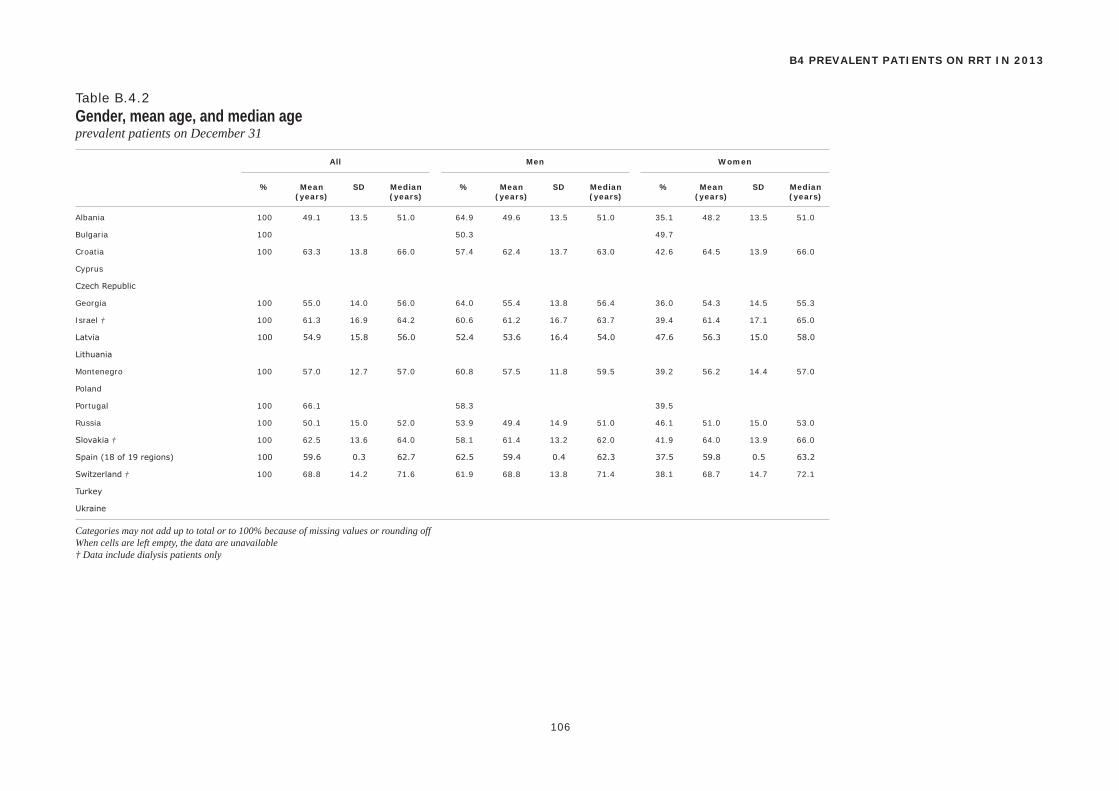
% Mean SD Median % Mean SD Median % Mean SD Median (years) (years) (years) (years) (years) (years)
All Men Women
106
B4 PREVALENT PATIENTS ON RRT IN 2013
Table B.4.2Gender, mean age, and median ageprevalent patients on December 31
Albania 100 49.1 13.5 51.0 64.9 49.6 13.5 51.0 35.1 48.2 13.5 51.0
Bulgaria 100 50.3 49.7
Croatia 100 63.3 13.8 66.0 57.4 62.4 13.7 63.0 42.6 64.5 13.9 66.0
Cyprus
Czech Republic
Georgia 100 55.0 14.0 56.0 64.0 55.4 13.8 56.4 36.0 54.3 14.5 55.3
Israel † 100 61.3 16.9 64.2 60.6 61.2 16.7 63.7 39.4 61.4 17.1 65.0
Latvia 100 54.9 15.8 56.0 52.4 53.6 16.4 54.0 47.6 56.3 15.0 58.0
Lithuania
Montenegro 100 57.0 12.7 57.0 60.8 57.5 11.8 59.5 39.2 56.2 14.4 57.0
Poland
Portugal 100 66.1 58.3 39.5
Russia 100 50.1 15.0 52.0 53.9 49.4 14.9 51.0 46.1 51.0 15.0 53.0
Slovakia † 100 62.5 13.6 64.0 58.1 61.4 13.2 62.0 41.9 64.0 13.9 66.0
Spain (18 of 19 regions) 100 59.6 0.3 62.7 62.5 59.4 0.4 62.3 37.5 59.8 0.5 63.2
Switzerland † 100 68.8 14.2 71.6 61.9 68.8 13.8 71.4 38.1 68.7 14.7 72.1
Turkey
Ukraine
Categories may not add up to total or to 100% because of missing values or rounding offWhen cells are left empty, the data are unavailable† Data include dialysis patients only
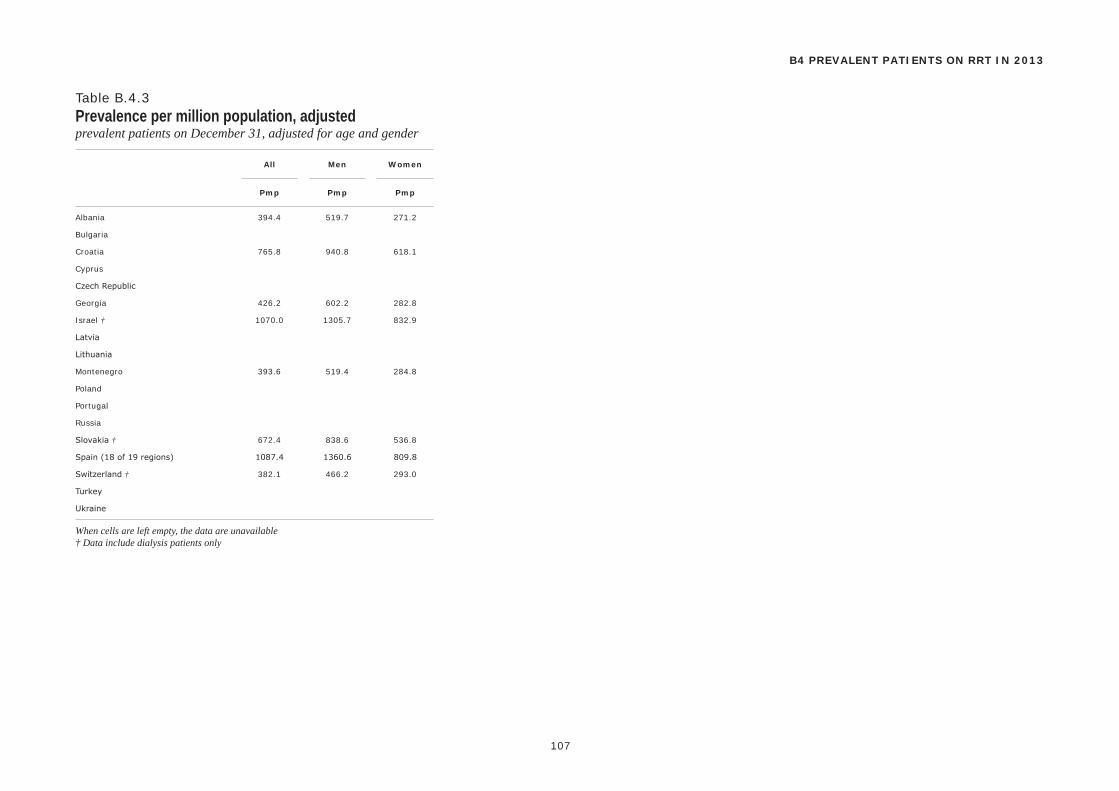
Pmp Pmp Pmp
All Men Women
107
B4 PREVALENT PATIENTS ON RRT IN 2013
Table B.4.3Prevalence per million population, adjustedprevalent patients on December 31, adjusted for age and gender
Albania 394.4 519.7 271.2
Bulgaria
Croatia 765.8 940.8 618.1
Cyprus
Czech Republic
Georgia 426.2 602.2 282.8
Israel † 1070.0 1305.7 832.9
Latvia
Lithuania
Montenegro 393.6 519.4 284.8
Poland
Portugal
Russia
Slovakia † 672.4 838.6 536.8
Spain (18 of 19 regions) 1087.4 1360.6 809.8
Switzerland † 382.1 466.2 293.0
Turkey
Ukraine
When cells are left empty, the data are unavailable† Data include dialysis patients only
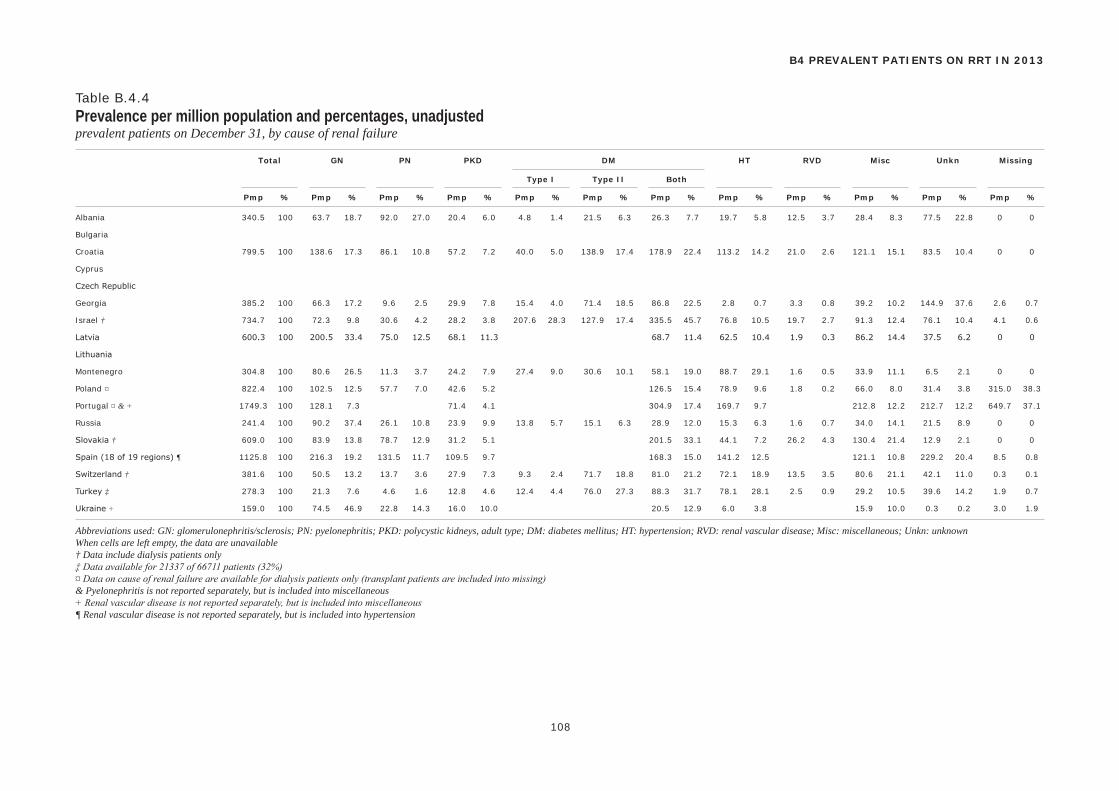
Total GN PN PKD DM HT RVD Misc Unkn Missing
Type I Type II Both
Pmp % Pmp % Pmp % Pmp % Pmp % Pmp % Pmp % Pmp % Pmp % Pmp % Pmp % Pmp %
108
B4 PREVALENT PATIENTS ON RRT IN 2013
Table B.4.4Prevalence per million population and percentages, unadjustedprevalent patients on December 31, by cause of renal failure
Albania 340.5 100 63.7 18.7 92.0 27.0 20.4 6.0 4.8 1.4 21.5 6.3 26.3 7.7 19.7 5.8 12.5 3.7 28.4 8.3 77.5 22.8 0 0
Bulgaria
Croatia 799.5 100 138.6 17.3 86.1 10.8 57.2 7.2 40.0 5.0 138.9 17.4 178.9 22.4 113.2 14.2 21.0 2.6 121.1 15.1 83.5 10.4 0 0
Cyprus
Czech Republic
Georgia 385.2 100 66.3 17.2 9.6 2.5 29.9 7.8 15.4 4.0 71.4 18.5 86.8 22.5 2.8 0.7 3.3 0.8 39.2 10.2 144.9 37.6 2.6 0.7
Israel † 734.7 100 72.3 9.8 30.6 4.2 28.2 3.8 207.6 28.3 127.9 17.4 335.5 45.7 76.8 10.5 19.7 2.7 91.3 12.4 76.1 10.4 4.1 0.6
Latvia 600.3 100 200.5 33.4 75.0 12.5 68.1 11.3 68.7 11.4 62.5 10.4 1.9 0.3 86.2 14.4 37.5 6.2 0 0
Lithuania
Montenegro 304.8 100 80.6 26.5 11.3 3.7 24.2 7.9 27.4 9.0 30.6 10.1 58.1 19.0 88.7 29.1 1.6 0.5 33.9 11.1 6.5 2.1 0 0
Poland ¤ 822.4 100 102.5 12.5 57.7 7.0 42.6 5.2 126.5 15.4 78.9 9.6 1.8 0.2 66.0 8.0 31.4 3.8 315.0 38.3
Portugal ¤ & + 1749.3 100 128.1 7.3 71.4 4.1 304.9 17.4 169.7 9.7 212.8 12.2 212.7 12.2 649.7 37.1
Russia 241.4 100 90.2 37.4 26.1 10.8 23.9 9.9 13.8 5.7 15.1 6.3 28.9 12.0 15.3 6.3 1.6 0.7 34.0 14.1 21.5 8.9 0 0
Slovakia † 609.0 100 83.9 13.8 78.7 12.9 31.2 5.1 201.5 33.1 44.1 7.2 26.2 4.3 130.4 21.4 12.9 2.1 0 0
Spain (18 of 19 regions) ¶ 1125.8 100 216.3 19.2 131.5 11.7 109.5 9.7 168.3 15.0 141.2 12.5 121.1 10.8 229.2 20.4 8.5 0.8
Switzerland † 381.6 100 50.5 13.2 13.7 3.6 27.9 7.3 9.3 2.4 71.7 18.8 81.0 21.2 72.1 18.9 13.5 3.5 80.6 21.1 42.1 11.0 0.3 0.1
Turkey ‡ 278.3 100 21.3 7.6 4.6 1.6 12.8 4.6 12.4 4.4 76.0 27.3 88.3 31.7 78.1 28.1 2.5 0.9 29.2 10.5 39.6 14.2 1.9 0.7
Ukraine + 159.0 100 74.5 46.9 22.8 14.3 16.0 10.0 20.5 12.9 6.0 3.8 15.9 10.0 0.3 0.2 3.0 1.9
Abbreviations used: GN: glomerulonephritis/sclerosis; PN: pyelonephritis; PKD: polycystic kidneys, adult type; DM: diabetes mellitus; HT: hypertension; RVD: renal vascular disease; Misc: miscellaneous; Unkn: unknownWhen cells are left empty, the data are unavailable† Data include dialysis patients only‡ Data available for 21337 of 66711 patients (32%)¤ Data on cause of renal failure are available for dialysis patients only (transplant patients are included into missing)& Pyelonephritis is not reported separately, but is included into miscellaneous+ Renal vascular disease is not reported separately, but is included into miscellaneous¶ Renal vascular disease is not reported separately, but is included into hypertension
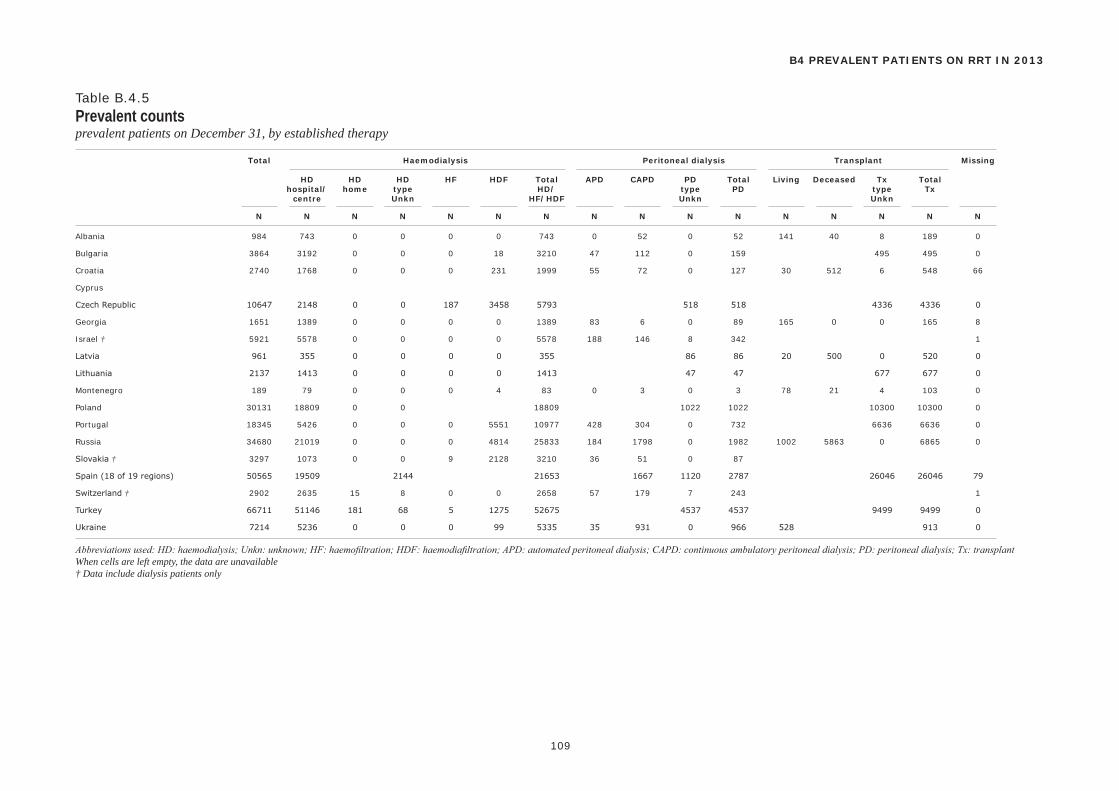
Total Haemodialysis Peritoneal dialysis Transplant Missing
HD HD HD HF HDF Total APD CAPD PD Total Living Deceased Tx Total hospital/ home type HD/ type PD type Tx centre Unkn HF/HDF Unkn Unkn
N N N N N N N N N N N N N N N N
109
B4 PREVALENT PATIENTS ON RRT IN 2013
Table B.4.5Prevalent countsprevalent patients on December 31, by established therapy
Albania 984 743 0 0 0 0 743 0 52 0 52 141 40 8 189 0
Bulgaria 3864 3192 0 0 0 18 3210 47 112 0 159 495 495 0
Croatia 2740 1768 0 0 0 231 1999 55 72 0 127 30 512 6 548 66
Cyprus
Czech Republic 10647 2148 0 0 187 3458 5793 518 518 4336 4336 0
Georgia 1651 1389 0 0 0 0 1389 83 6 0 89 165 0 0 165 8
Israel † 5921 5578 0 0 0 0 5578 188 146 8 342 1
Latvia 961 355 0 0 0 0 355 86 86 20 500 0 520 0
Lithuania 2137 1413 0 0 0 0 1413 47 47 677 677 0
Montenegro 189 79 0 0 0 4 83 0 3 0 3 78 21 4 103 0
Poland 30131 18809 0 0 18809 1022 1022 10300 10300 0
Portugal 18345 5426 0 0 0 5551 10977 428 304 0 732 6636 6636 0
Russia 34680 21019 0 0 0 4814 25833 184 1798 0 1982 1002 5863 0 6865 0
Slovakia † 3297 1073 0 0 9 2128 3210 36 51 0 87
Spain (18 of 19 regions) 50565 19509 2144 21653 1667 1120 2787 26046 26046 79
Switzerland † 2902 2635 15 8 0 0 2658 57 179 7 243 1
Turkey 66711 51146 181 68 5 1275 52675 4537 4537 9499 9499 0
Ukraine 7214 5236 0 0 0 99 5335 35 931 0 966 528 913 0
Abbreviations used: HD: haemodialysis; Unkn: unknown; HF: haemofiltration; HDF: haemodiafiltration; APD: automated peritoneal dialysis; CAPD: continuous ambulatory peritoneal dialysis; PD: peritoneal dialysis; Tx: transplantWhen cells are left empty, the data are unavailable† Data include dialysis patients only
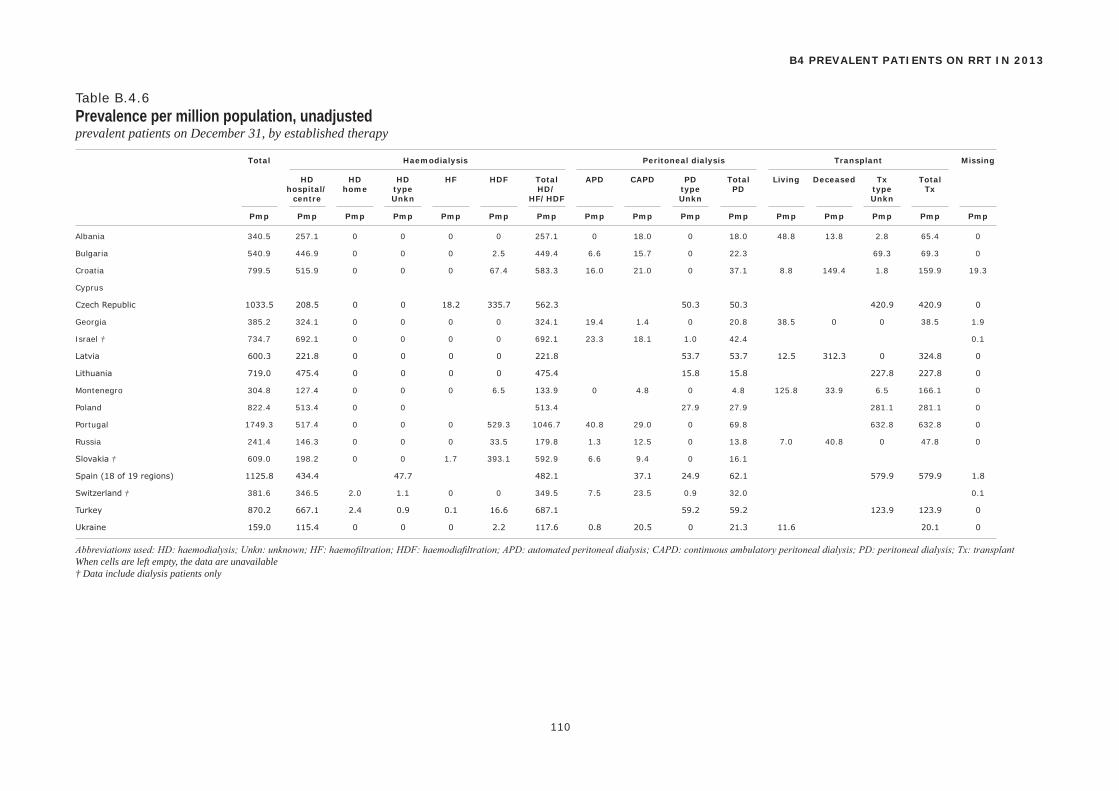
Total Haemodialysis Peritoneal dialysis Transplant Missing
HD HD HD HF HDF Total APD CAPD PD Total Living Deceased Tx Total hospital/ home type HD/ type PD type Tx centre Unkn HF/HDF Unkn Unkn
Pmp Pmp Pmp Pmp Pmp Pmp Pmp Pmp Pmp Pmp Pmp Pmp Pmp Pmp Pmp Pmp
110
B4 PREVALENT PATIENTS ON RRT IN 2013
Table B.4.6Prevalence per million population, unadjustedprevalent patients on December 31, by established therapy
Albania 340.5 257.1 0 0 0 0 257.1 0 18.0 0 18.0 48.8 13.8 2.8 65.4 0
Bulgaria 540.9 446.9 0 0 0 2.5 449.4 6.6 15.7 0 22.3 69.3 69.3 0
Croatia 799.5 515.9 0 0 0 67.4 583.3 16.0 21.0 0 37.1 8.8 149.4 1.8 159.9 19.3
Cyprus
Czech Republic 1033.5 208.5 0 0 18.2 335.7 562.3 50.3 50.3 420.9 420.9 0
Georgia 385.2 324.1 0 0 0 0 324.1 19.4 1.4 0 20.8 38.5 0 0 38.5 1.9
Israel † 734.7 692.1 0 0 0 0 692.1 23.3 18.1 1.0 42.4 0.1
Latvia 600.3 221.8 0 0 0 0 221.8 53.7 53.7 12.5 312.3 0 324.8 0
Lithuania 719.0 475.4 0 0 0 0 475.4 15.8 15.8 227.8 227.8 0
Montenegro 304.8 127.4 0 0 0 6.5 133.9 0 4.8 0 4.8 125.8 33.9 6.5 166.1 0
Poland 822.4 513.4 0 0 513.4 27.9 27.9 281.1 281.1 0
Portugal 1749.3 517.4 0 0 0 529.3 1046.7 40.8 29.0 0 69.8 632.8 632.8 0
Russia 241.4 146.3 0 0 0 33.5 179.8 1.3 12.5 0 13.8 7.0 40.8 0 47.8 0
Slovakia † 609.0 198.2 0 0 1.7 393.1 592.9 6.6 9.4 0 16.1
Spain (18 of 19 regions) 1125.8 434.4 47.7 482.1 37.1 24.9 62.1 579.9 579.9 1.8
Switzerland † 381.6 346.5 2.0 1.1 0 0 349.5 7.5 23.5 0.9 32.0 0.1
Turkey 870.2 667.1 2.4 0.9 0.1 16.6 687.1 59.2 59.2 123.9 123.9 0
Ukraine 159.0 115.4 0 0 0 2.2 117.6 0.8 20.5 0 21.3 11.6 20.1 0
Abbreviations used: HD: haemodialysis; Unkn: unknown; HF: haemofiltration; HDF: haemodiafiltration; APD: automated peritoneal dialysis; CAPD: continuous ambulatory peritoneal dialysis; PD: peritoneal dialysis; Tx: transplantWhen cells are left empty, the data are unavailable† Data include dialysis patients only
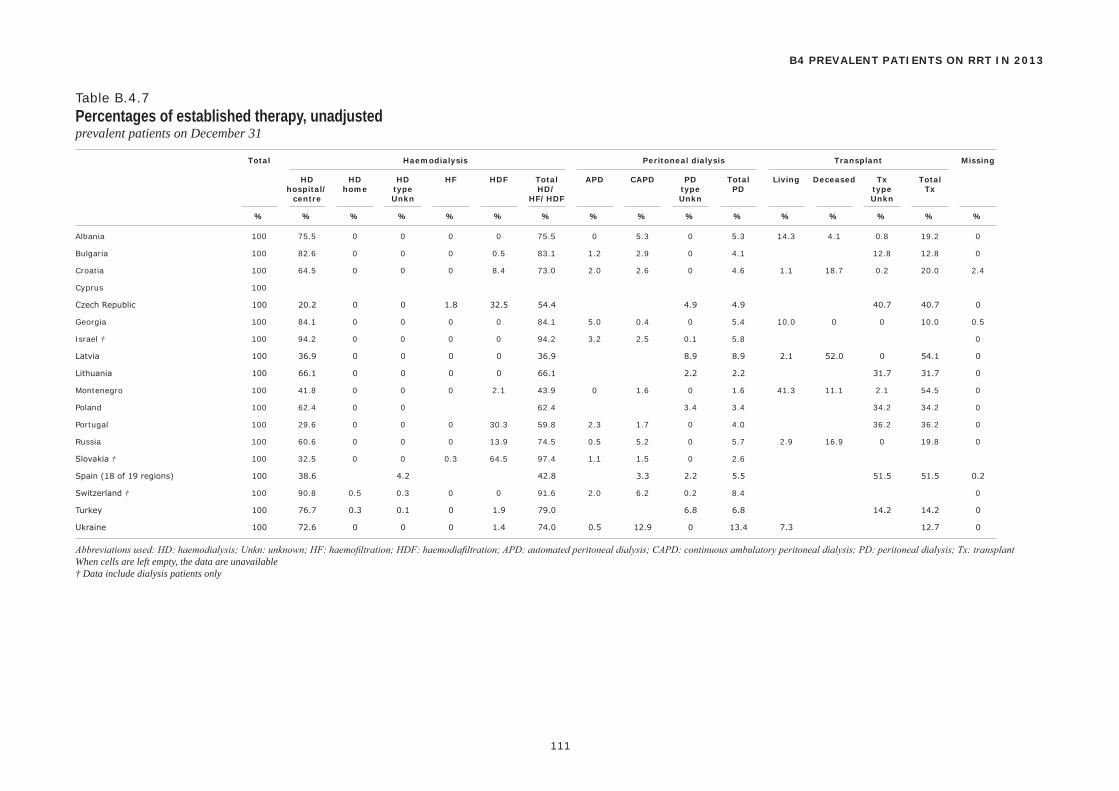
Total Haemodialysis Peritoneal dialysis Transplant Missing
HD HD HD HF HDF Total APD CAPD PD Total Living Deceased Tx Total hospital/ home type HD/ type PD type Tx centre Unkn HF/HDF Unkn Unkn
% % % % % % % % % % % % % % % %
111
B4 PREVALENT PATIENTS ON RRT IN 2013
Table B.4.7Percentages of established therapy, unadjustedprevalent patients on December 31
Albania 100 75.5 0 0 0 0 75.5 0 5.3 0 5.3 14.3 4.1 0.8 19.2 0
Bulgaria 100 82.6 0 0 0 0.5 83.1 1.2 2.9 0 4.1 12.8 12.8 0
Croatia 100 64.5 0 0 0 8.4 73.0 2.0 2.6 0 4.6 1.1 18.7 0.2 20.0 2.4
Cyprus 100
Czech Republic 100 20.2 0 0 1.8 32.5 54.4 4.9 4.9 40.7 40.7 0
Georgia 100 84.1 0 0 0 0 84.1 5.0 0.4 0 5.4 10.0 0 0 10.0 0.5
Israel † 100 94.2 0 0 0 0 94.2 3.2 2.5 0.1 5.8 0
Latvia 100 36.9 0 0 0 0 36.9 8.9 8.9 2.1 52.0 0 54.1 0
Lithuania 100 66.1 0 0 0 0 66.1 2.2 2.2 31.7 31.7 0
Montenegro 100 41.8 0 0 0 2.1 43.9 0 1.6 0 1.6 41.3 11.1 2.1 54.5 0
Poland 100 62.4 0 0 62.4 3.4 3.4 34.2 34.2 0
Portugal 100 29.6 0 0 0 30.3 59.8 2.3 1.7 0 4.0 36.2 36.2 0
Russia 100 60.6 0 0 0 13.9 74.5 0.5 5.2 0 5.7 2.9 16.9 0 19.8 0
Slovakia † 100 32.5 0 0 0.3 64.5 97.4 1.1 1.5 0 2.6
Spain (18 of 19 regions) 100 38.6 4.2 42.8 3.3 2.2 5.5 51.5 51.5 0.2
Switzerland † 100 90.8 0.5 0.3 0 0 91.6 2.0 6.2 0.2 8.4 0
Turkey 100 76.7 0.3 0.1 0 1.9 79.0 6.8 6.8 14.2 14.2 0
Ukraine 100 72.6 0 0 0 1.4 74.0 0.5 12.9 0 13.4 7.3 12.7 0
Abbreviations used: HD: haemodialysis; Unkn: unknown; HF: haemofiltration; HDF: haemodiafiltration; APD: automated peritoneal dialysis; CAPD: continuous ambulatory peritoneal dialysis; PD: peritoneal dialysis; Tx: transplantWhen cells are left empty, the data are unavailable† Data include dialysis patients only
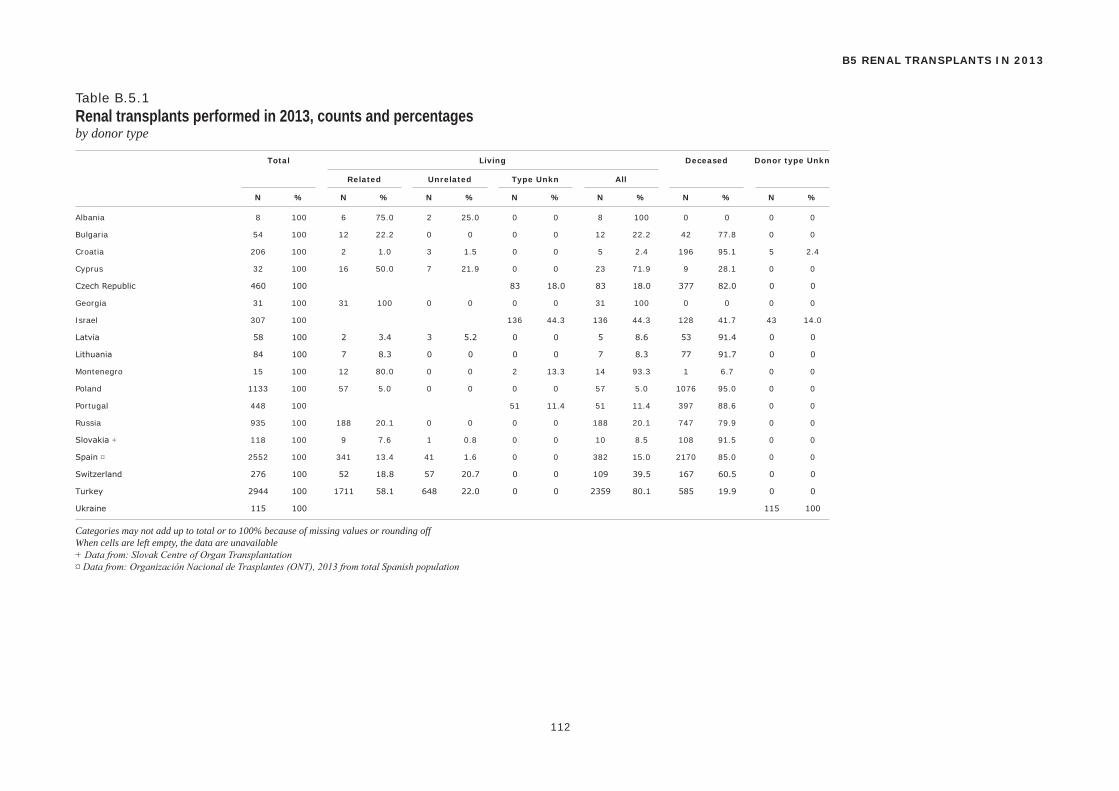
Total Living Deceased Donor type Unkn
Related Unrelated Type Unkn All
N % N % N % N % N % N % N %
112
B5 RENAL TRANSPLANTS IN 2013
Table B.5.1Renal transplants performed in 2013, counts and percentagesby donor type
8 100 6 75.0 2 25.0 0 0 8 100 0 0 0 0
54 100 12 22.2 0 0 0 0 12 22.2 42 77.8 0 0
206 100 2 1.0 3 1.5 0 0 5 2.4 196 95.1 5 2.4
32 100 16 50.0 7 21.9 0 0 23 71.9 9 28.1 0 0
460 100 83 18.0 83 18.0 377 82.0 0 0
31 100 31 100 0 0 0 0 31 100 0 0 0 0
307 100 136 44.3 136 44.3 128 41.7 43 14.0
58 100 2 3.4 3 5.2 0 0 5 8.6 53 91.4 0 0
84 100 7 8.3 0 0 0 0 7 8.3 77 91.7 0 0
15 100 12 80.0 0 0 2 13.3 14 93.3 1 6.7 0 0
1133 100 57 5.0 0 0 0 0 57 5.0 1076 95.0 0 0
448 100 51 11.4 51 11.4 397 88.6 0 0
935 100 188 20.1 0 0 0 0 188 20.1 747 79.9 0 0
118 100 9 7.6 1 0.8 0 0 10 8.5 108 91.5 0 0
2552 100 341 13.4 41 1.6 0 0 382 15.0 2170 85.0 0 0
276 100 52 18.8 57 20.7 0 0 109 39.5 167 60.5 0 0
2944 100 1711 58.1 648 22.0 0 0 2359 80.1 585 19.9 0 0
Albania
Bulgaria
Croatia
Cyprus
Czech Republic
Georgia
Israel
Latvia
Lithuania
Montenegro
Poland
Portugal
Russia
Slovakia +
Spain ¤
Switzerland
Turkey
Ukraine 115 100 115 100
Categories may not add up to total or to 100% because of missing values or rounding offWhen cells are left empty, the data are unavailable+ Data from: Slovak Centre of Organ Transplantation¤ Data from: Organización Nacional de Trasplantes (ONT), 2013 from total Spanish population
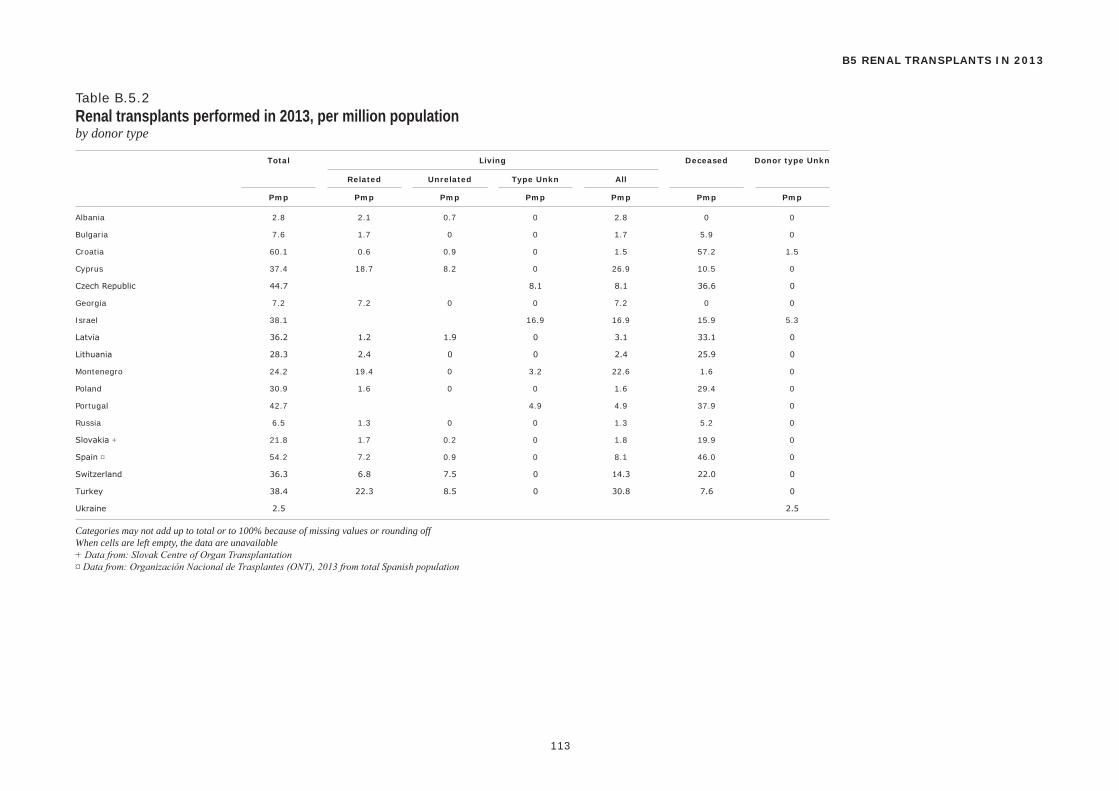
Total Living Deceased Donor type Unkn
Related Unrelated Type Unkn All
Pmp Pmp Pmp Pmp Pmp Pmp Pmp
113
B5 RENAL TRANSPLANTS IN 2013
Table B.5.2Renal transplants performed in 2013, per million populationby donor type
2.8 2.1 0.7 0 2.8 0 0
7.6 1.7 0 0 1.7 5.9 0
60.1 0.6 0.9 0 1.5 57.2 1.5
37.4 18.7 8.2 0 26.9 10.5 0
44.7 8.1 8.1 36.6 0
7.2 7.2 0 0 7.2 0 0
38.1 16.9 16.9 15.9 5.3
36.2 1.2 1.9 0 3.1 33.1 0
28.3 2.4 0 0 2.4 25.9 0
24.2 19.4 0 3.2 22.6 1.6 0
30.9 1.6 0 0 1.6 29.4 0
42.7 4.9 4.9 37.9 0
6.5 1.3 0 0 1.3 5.2 0
21.8 1.7 0.2 0 1.8 19.9 0
54.2 7.2 0.9 0 8.1 46.0 0
36.3 6.8 7.5 0 14.3 22.0 0
38.4 22.3 8.5 0 30.8 7.6 0
Albania
Bulgaria
Croatia
Cyprus
Czech Republic
Georgia
Israel
Latvia
Lithuania
Montenegro
Poland
Portugal
Russia
Slovakia +
Spain ¤
Switzerland
Turkey
Ukraine 2.5 2.5
Categories may not add up to total or to 100% because of missing values or rounding offWhen cells are left empty, the data are unavailable+ Data from: Slovak Centre of Organ Transplantation¤ Data from: Organización Nacional de Trasplantes (ONT), 2013 from total Spanish population

IV Summary Data

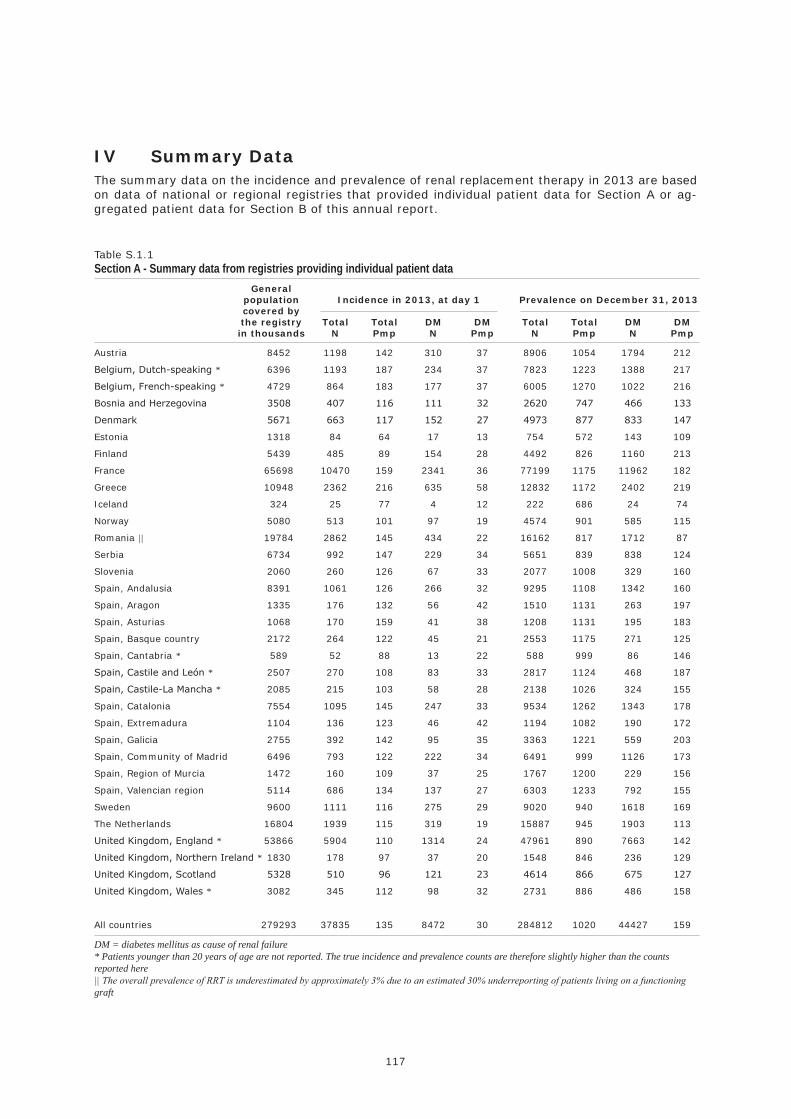
117
General population Incidence in 2013, at day 1 Prevalence on December 31, 2013 covered by the registry Total Total DM DM Total Total DM DM in thousands N Pmp N Pmp N Pmp N Pmp
IV Summary DataThe summary data on the incidence and prevalence of renal replacement therapy in 2013 are based on data of national or regional registries that provided individual patient data for Section A or ag-gregated patient data for Section B of this annual report.
Table S.1.1Section A - Summary data from registries providing individual patient data
Austria 8452 1198 142 310 37 8906 1054 1794 212
Belgium, Dutch-speaking * 6396 1193 187 234 37 7823 1223 1388 217
Belgium, French-speaking * 4729 864 183 177 37 6005 1270 1022 216
Bosnia and Herzegovina 3508 407 116 111 32 2620 747 466 133
Denmark 5671 663 117 152 27 4973 877 833 147
Estonia 1318 84 64 17 13 754 572 143 109
Finland 5439 485 89 154 28 4492 826 1160 213
France 65698 10470 159 2341 36 77199 1175 11962 182
Greece 10948 2362 216 635 58 12832 1172 2402 219
Iceland 324 25 77 4 12 222 686 24 74
Norway 5080 513 101 97 19 4574 901 585 115
Romania || 19784 2862 145 434 22 16162 817 1712 87
Serbia 6734 992 147 229 34 5651 839 838 124
Slovenia 2060 260 126 67 33 2077 1008 329 160
Spain, Andalusia 8391 1061 126 266 32 9295 1108 1342 160
Spain, Aragon 1335 176 132 56 42 1510 1131 263 197
Spain, Asturias 1068 170 159 41 38 1208 1131 195 183
Spain, Basque country 2172 264 122 45 21 2553 1175 271 125
Spain, Cantabria * 589 52 88 13 22 588 999 86 146
Spain, Castile and León * 2507 270 108 83 33 2817 1124 468 187
Spain, Castile-La Mancha * 2085 215 103 58 28 2138 1026 324 155
Spain, Catalonia 7554 1095 145 247 33 9534 1262 1343 178
Spain, Extremadura 1104 136 123 46 42 1194 1082 190 172
Spain, Galicia 2755 392 142 95 35 3363 1221 559 203
Spain, Community of Madrid 6496 793 122 222 34 6491 999 1126 173
Spain, Region of Murcia 1472 160 109 37 25 1767 1200 229 156
Spain, Valencian region 5114 686 134 137 27 6303 1233 792 155
Sweden 9600 1111 116 275 29 9020 940 1618 169
The Netherlands 16804 1939 115 319 19 15887 945 1903 113
United Kingdom, England * 53866 5904 110 1314 24 47961 890 7663 142
United Kingdom, Northern Ireland * 1830 178 97 37 20 1548 846 236 129
United Kingdom, Scotland 5328 510 96 121 23 4614 866 675 127
United Kingdom, Wales * 3082 345 112 98 32 2731 886 486 158
All countries 279293 37835 135 8472 30 284812 1020 44427 159
DM = diabetes mellitus as cause of renal failure* Patients younger than 20 years of age are not reported. The true incidence and prevalence counts are therefore slightly higher than the counts reported here|| The overall prevalence of RRT is underestimated by approximately 3% due to an estimated 30% underreporting of patients living on a functioning graft
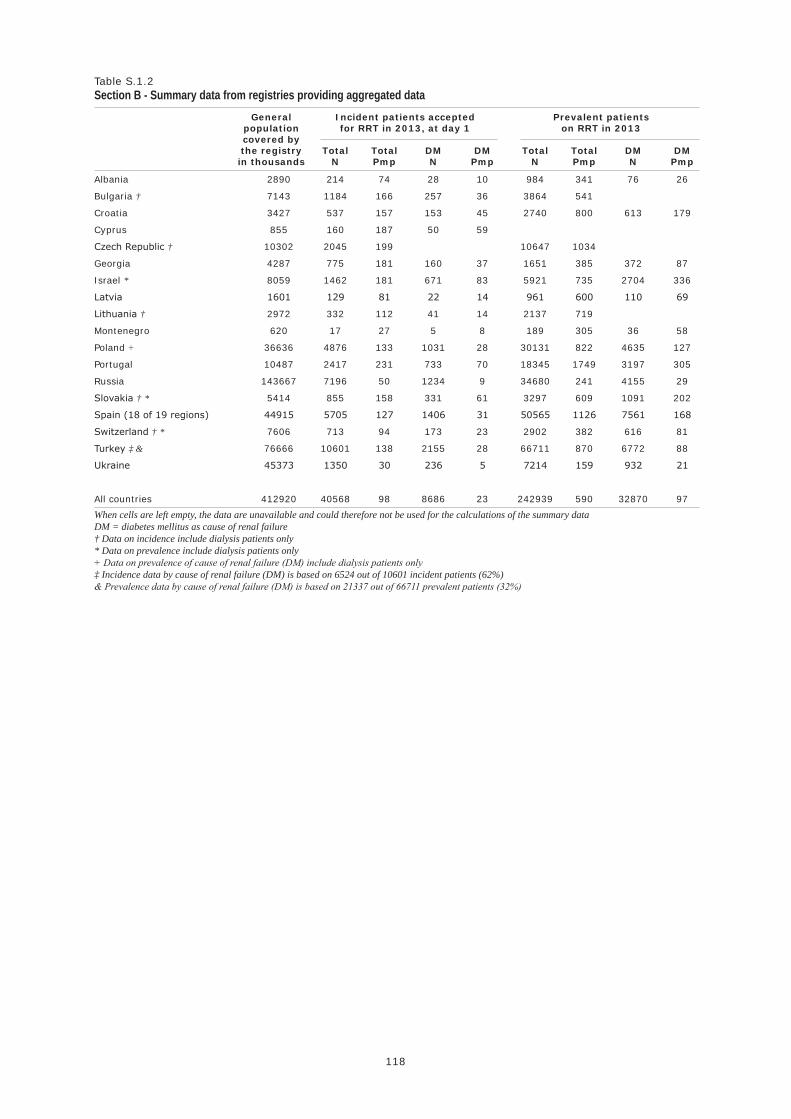
118
General Incident patients accepted Prevalent patients population for RRT in 2013, at day 1 on RRT in 2013 covered by the registry Total Total DM DM Total Total DM DM in thousands N Pmp N Pmp N Pmp N Pmp
Table S.1.2Section B - Summary data from registries providing aggregated data
Albania 2890 214 74 28 10 984 341 76 26
Bulgaria † 7143 1184 166 257 36 3864 541
Croatia 3427 537 157 153 45 2740 800 613 179
Cyprus 855 160 187 50 59
Czech Republic † 10302 2045 199 10647 1034
Georgia 4287 775 181 160 37 1651 385 372 87
Israel * 8059 1462 181 671 83 5921 735 2704 336
Latvia 1601 129 81 22 14 961 600 110 69
Lithuania † 2972 332 112 41 14 2137 719
Montenegro 620 17 27 5 8 189 305 36 58
Poland + 36636 4876 133 1031 28 30131 822 4635 127
Portugal 10487 2417 231 733 70 18345 1749 3197 305
Russia 143667 7196 50 1234 9 34680 241 4155 29
Slovakia † * 5414 855 158 331 61 3297 609 1091 202
Spain (18 of 19 regions) 44915 5705 127 1406 31 50565 1126 7561 168
Switzerland † * 7606 713 94 173 23 2902 382 616 81
Turkey ‡ & 76666 10601 138 2155 28 66711 870 6772 88
Ukraine 45373 1350 30 236 5 7214 159 932 21
All countries 412920 40568 98 8686 23 242939 590 32870 97
When cells are left empty, the data are unavailable and could therefore not be used for the calculations of the summary dataDM = diabetes mellitus as cause of renal failure† Data on incidence include dialysis patients only* Data on prevalence include dialysis patients only+ Data on prevalence of cause of renal failure (DM) include dialysis patients only‡ Incidence data by cause of renal failure (DM) is based on 6524 out of 10601 incident patients (62%)& Prevalence data by cause of renal failure (DM) is based on 21337 out of 66711 prevalent patients (32%)

V Reference Tables - Section Paediatric RRT

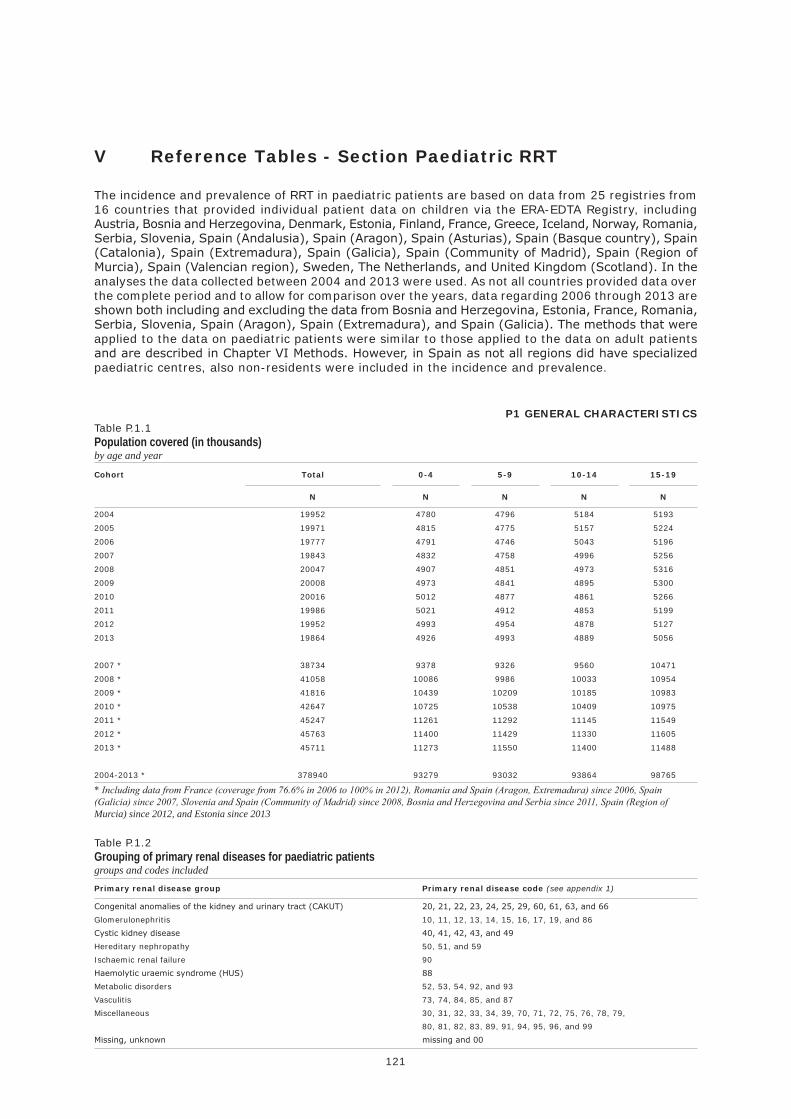
121
V Reference Tables - Section Paediatric RRT
The incidence and prevalence of RRT in paediatric patients are based on data from 25 registries from 16 countries that provided individual patient data on children via the ERA-EDTA Registry, including Austria, Bosnia and Herzegovina, Denmark, Estonia, Finland, France, Greece, Iceland, Norway, Romania, Serbia, Slovenia, Spain (Andalusia), Spain (Aragon), Spain (Asturias), Spain (Basque country), Spain (Catalonia), Spain (Extremadura), Spain (Galicia), Spain (Community of Madrid), Spain (Region of Murcia), Spain (Valencian region), Sweden, The Netherlands, and United Kingdom (Scotland). In the analyses the data collected between 2004 and 2013 were used. As not all countries provided data over the complete period and to allow for comparison over the years, data regarding 2006 through 2013 are shown both including and excluding the data from Bosnia and Herzegovina, Estonia, France, Romania, Serbia, Slovenia, Spain (Aragon), Spain (Extremadura), and Spain (Galicia). The methods that were applied to the data on paediatric patients were similar to those applied to the data on adult patients and are described in Chapter VI Methods. However, in Spain as not all regions did have specialized paediatric centres, also non-residents were included in the incidence and prevalence.
Congenital anomalies of the kidney and urinary tract (CAKUT) 20, 21, 22, 23, 24, 25, 29, 60, 61, 63, and 66
Glomerulonephritis 10, 11, 12, 13, 14, 15, 16, 17, 19, and 86
Cystic kidney disease 40, 41, 42, 43, and 49
Hereditary nephropathy 50, 51, and 59
Ischaemic renal failure 90
Haemolytic uraemic syndrome (HUS) 88
Metabolic disorders 52, 53, 54, 92, and 93
Vasculitis 73, 74, 84, 85, and 87
Miscellaneous 30, 31, 32, 33, 34, 39, 70, 71, 72, 75, 76, 78, 79,
80, 81, 82, 83, 89, 91, 94, 95, 96, and 99
Missing, unknown missing and 00
Cohort Total 0-4 5-9 10-14 15-19
N N N N N
Primary renal disease group Primary renal disease code (see appendix 1)
P1 GENERAL CHARACTERISTICSTable P.1.1Population covered (in thousands)by age and year
2004 19952 4780 4796 5184 5193
2005 19971 4815 4775 5157 5224
2006 19777 4791 4746 5043 5196
2007 19843 4832 4758 4996 5256
2008 20047 4907 4851 4973 5316
2009 20008 4973 4841 4895 5300
2010 20016 5012 4877 4861 5266
2011 19986 5021 4912 4853 5199
2012 19952 4993 4954 4878 5127
2013 19864 4926 4993 4889 5056
2007 * 38734 9378 9326 9560 10471
2008 * 41058 10086 9986 10033 10954
2009 * 41816 10439 10209 10185 10983
2010 * 42647 10725 10538 10409 10975
2011 * 45247 11261 11292 11145 11549
2012 * 45763 11400 11429 11330 11605
2013 * 45711 11273 11550 11400 11488
2004-2013 * 378940 93279 93032 93864 98765
* Including data from France (coverage from 76.6% in 2006 to 100% in 2012), Romania and Spain (Aragon, Extremadura) since 2006, Spain (Galicia) since 2007, Slovenia and Spain (Community of Madrid) since 2008, Bosnia and Herzegovina and Serbia since 2011, Spain (Region of Murcia) since 2012, and Estonia since 2013
Table P.1.2Grouping of primary renal diseases for paediatric patientsgroups and codes included
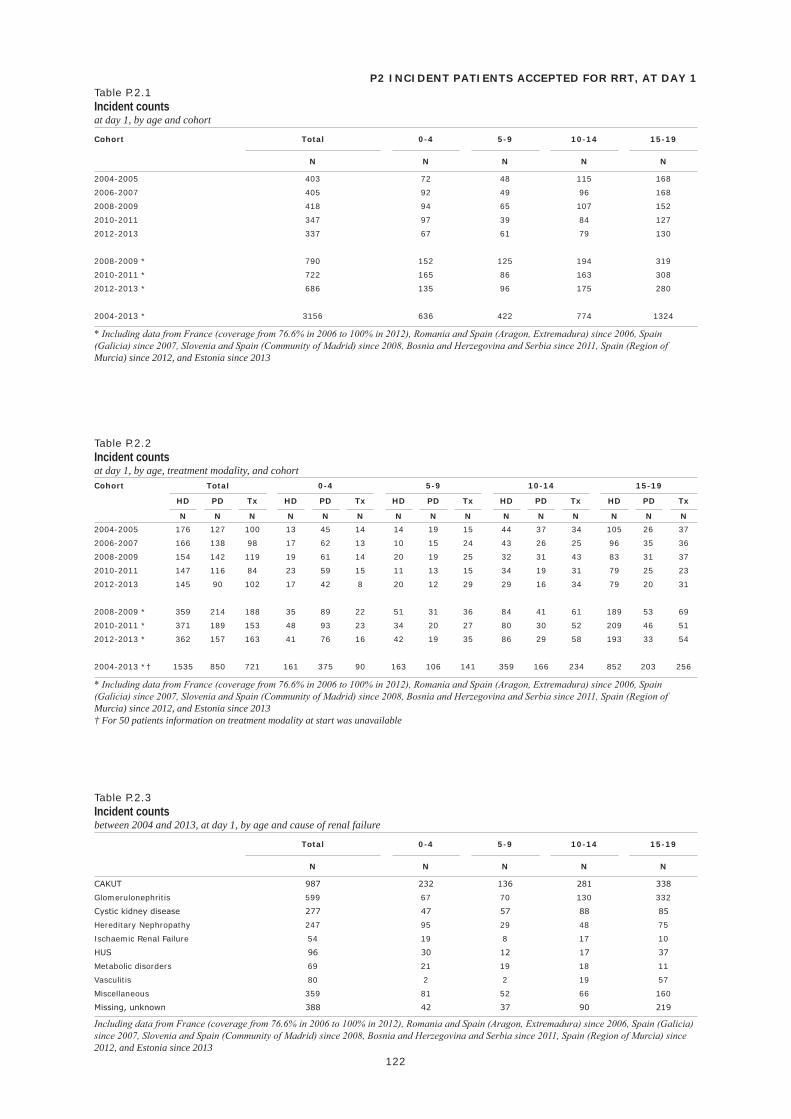
122
Cohort Total 0-4 5-9 10-14 15-19
N N N N N
Total 0-4 5-9 10-14 15-19
N N N N N
Cohort Total 0-4 5-9 10-14 15-19
HD PD Tx HD PD Tx HD PD Tx HD PD Tx HD PD Tx
N N N N N N N N N N N N N N N
P2 INCIDENT PATIENTS ACCEPTED FOR RRT, AT DAY 1Table P.2.1Incident countsat day 1, by age and cohort
2004-2005 403 72 48 115 168
2006-2007 405 92 49 96 168
2008-2009 418 94 65 107 152
2010-2011 347 97 39 84 127
2012-2013 337 67 61 79 130
2008-2009 * 790 152 125 194 319
2010-2011 * 722 165 86 163 308
2012-2013 * 686 135 96 175 280
2004-2013 * 3156 636 422 774 1324
* Including data from France (coverage from 76.6% in 2006 to 100% in 2012), Romania and Spain (Aragon, Extremadura) since 2006, Spain (Galicia) since 2007, Slovenia and Spain (Community of Madrid) since 2008, Bosnia and Herzegovina and Serbia since 2011, Spain (Region of Murcia) since 2012, and Estonia since 2013
Table P.2.3Incident countsbetween 2004 and 2013, at day 1, by age and cause of renal failure
CAKUT 987 232 136 281 338
Glomerulonephritis 599 67 70 130 332
Cystic kidney disease 277 47 57 88 85
Hereditary Nephropathy 247 95 29 48 75
Ischaemic Renal Failure 54 19 8 17 10
HUS 96 30 12 17 37
Metabolic disorders 69 21 19 18 11
Vasculitis 80 2 2 19 57
Miscellaneous 359 81 52 66 160
Missing, unknown 388 42 37 90 219
Including data from France (coverage from 76.6% in 2006 to 100% in 2012), Romania and Spain (Aragon, Extremadura) since 2006, Spain (Galicia) since 2007, Slovenia and Spain (Community of Madrid) since 2008, Bosnia and Herzegovina and Serbia since 2011, Spain (Region of Murcia) since 2012, and Estonia since 2013
Table P.2.2Incident countsat day 1, by age, treatment modality, and cohort
2004-2005 176 127 100 13 45 14 14 19 15 44 37 34 105 26 37
2006-2007 166 138 98 17 62 13 10 15 24 43 26 25 96 35 36
2008-2009 154 142 119 19 61 14 20 19 25 32 31 43 83 31 37
2010-2011 147 116 84 23 59 15 11 13 15 34 19 31 79 25 23
2012-2013 145 90 102 17 42 8 20 12 29 29 16 34 79 20 31
2008-2009 * 359 214 188 35 89 22 51 31 36 84 41 61 189 53 69
2010-2011 * 371 189 153 48 93 23 34 20 27 80 30 52 209 46 51
2012-2013 * 362 157 163 41 76 16 42 19 35 86 29 58 193 33 54
2004-2013 *† 1535 850 721 161 375 90 163 106 141 359 166 234 852 203 256
* Including data from France (coverage from 76.6% in 2006 to 100% in 2012), Romania and Spain (Aragon, Extremadura) since 2006, Spain (Galicia) since 2007, Slovenia and Spain (Community of Madrid) since 2008, Bosnia and Herzegovina and Serbia since 2011, Spain (Region of Murcia) since 2012, and Estonia since 2013† For 50 patients information on treatment modality at start was unavailable
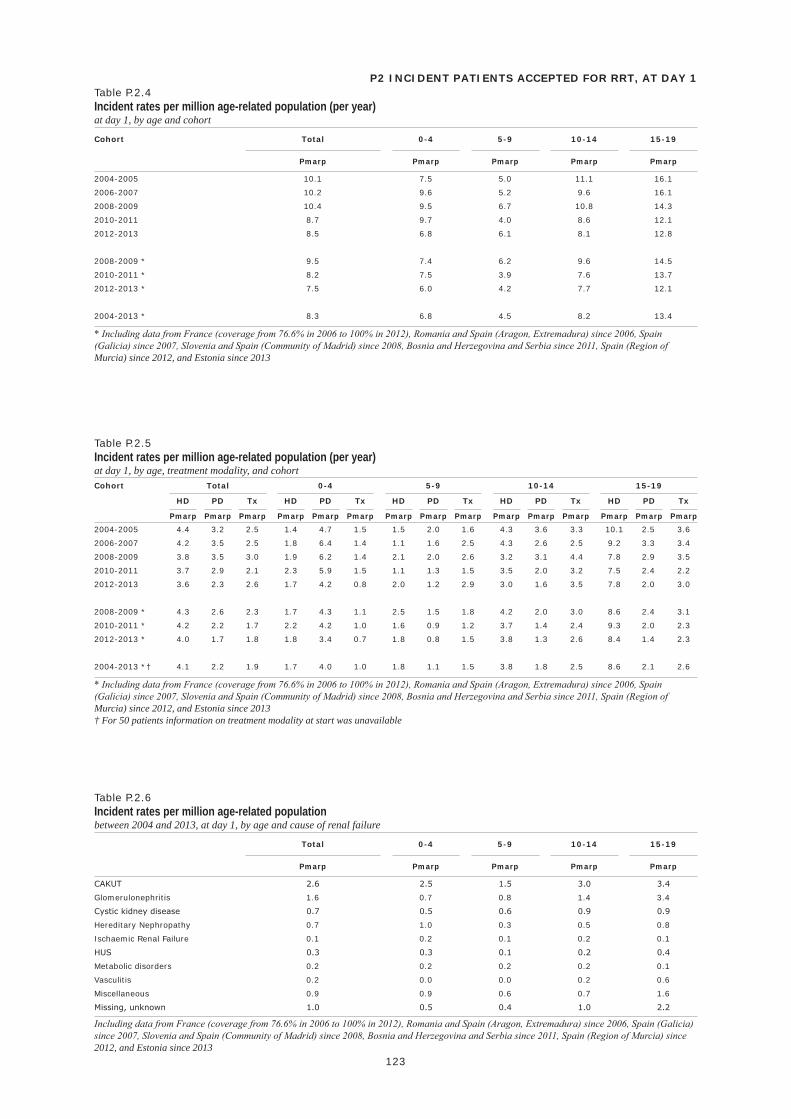
123
Cohort Total 0-4 5-9 10-14 15-19
HD PD Tx HD PD Tx HD PD Tx HD PD Tx HD PD Tx
Pmarp Pmarp Pmarp Pmarp Pmarp Pmarp Pmarp Pmarp Pmarp Pmarp Pmarp Pmarp Pmarp Pmarp Pmarp
Cohort Total 0-4 5-9 10-14 15-19
Pmarp Pmarp Pmarp Pmarp Pmarp
Total 0-4 5-9 10-14 15-19
Pmarp Pmarp Pmarp Pmarp Pmarp
P2 INCIDENT PATIENTS ACCEPTED FOR RRT, AT DAY 1Table P.2.4Incident rates per million age-related population (per year)at day 1, by age and cohort
2004-2005 10.1 7.5 5.0 11.1 16.1
2006-2007 10.2 9.6 5.2 9.6 16.1
2008-2009 10.4 9.5 6.7 10.8 14.3
2010-2011 8.7 9.7 4.0 8.6 12.1
2012-2013 8.5 6.8 6.1 8.1 12.8
2008-2009 * 9.5 7.4 6.2 9.6 14.5
2010-2011 * 8.2 7.5 3.9 7.6 13.7
2012-2013 * 7.5 6.0 4.2 7.7 12.1
2004-2013 * 8.3 6.8 4.5 8.2 13.4
* Including data from France (coverage from 76.6% in 2006 to 100% in 2012), Romania and Spain (Aragon, Extremadura) since 2006, Spain (Galicia) since 2007, Slovenia and Spain (Community of Madrid) since 2008, Bosnia and Herzegovina and Serbia since 2011, Spain (Region of Murcia) since 2012, and Estonia since 2013
Table P.2.6Incident rates per million age-related populationbetween 2004 and 2013, at day 1, by age and cause of renal failure
CAKUT 2.6 2.5 1.5 3.0 3.4
Glomerulonephritis 1.6 0.7 0.8 1.4 3.4
Cystic kidney disease 0.7 0.5 0.6 0.9 0.9
Hereditary Nephropathy 0.7 1.0 0.3 0.5 0.8
Ischaemic Renal Failure 0.1 0.2 0.1 0.2 0.1
HUS 0.3 0.3 0.1 0.2 0.4
Metabolic disorders 0.2 0.2 0.2 0.2 0.1
Vasculitis 0.2 0.0 0.0 0.2 0.6
Miscellaneous 0.9 0.9 0.6 0.7 1.6
Missing, unknown 1.0 0.5 0.4 1.0 2.2
Including data from France (coverage from 76.6% in 2006 to 100% in 2012), Romania and Spain (Aragon, Extremadura) since 2006, Spain (Galicia) since 2007, Slovenia and Spain (Community of Madrid) since 2008, Bosnia and Herzegovina and Serbia since 2011, Spain (Region of Murcia) since 2012, and Estonia since 2013
Table P.2.5Incident rates per million age-related population (per year)at day 1, by age, treatment modality, and cohort
2004-2005 4.4 3.2 2.5 1.4 4.7 1.5 1.5 2.0 1.6 4.3 3.6 3.3 10.1 2.5 3.6
2006-2007 4.2 3.5 2.5 1.8 6.4 1.4 1.1 1.6 2.5 4.3 2.6 2.5 9.2 3.3 3.4
2008-2009 3.8 3.5 3.0 1.9 6.2 1.4 2.1 2.0 2.6 3.2 3.1 4.4 7.8 2.9 3.5
2010-2011 3.7 2.9 2.1 2.3 5.9 1.5 1.1 1.3 1.5 3.5 2.0 3.2 7.5 2.4 2.2
2012-2013 3.6 2.3 2.6 1.7 4.2 0.8 2.0 1.2 2.9 3.0 1.6 3.5 7.8 2.0 3.0
2008-2009 * 4.3 2.6 2.3 1.7 4.3 1.1 2.5 1.5 1.8 4.2 2.0 3.0 8.6 2.4 3.1
2010-2011 * 4.2 2.2 1.7 2.2 4.2 1.0 1.6 0.9 1.2 3.7 1.4 2.4 9.3 2.0 2.3
2012-2013 * 4.0 1.7 1.8 1.8 3.4 0.7 1.8 0.8 1.5 3.8 1.3 2.6 8.4 1.4 2.3
2004-2013 *† 4.1 2.2 1.9 1.7 4.0 1.0 1.8 1.1 1.5 3.8 1.8 2.5 8.6 2.1 2.6
* Including data from France (coverage from 76.6% in 2006 to 100% in 2012), Romania and Spain (Aragon, Extremadura) since 2006, Spain (Galicia) since 2007, Slovenia and Spain (Community of Madrid) since 2008, Bosnia and Herzegovina and Serbia since 2011, Spain (Region of Murcia) since 2012, and Estonia since 2013† For 50 patients information on treatment modality at start was unavailable
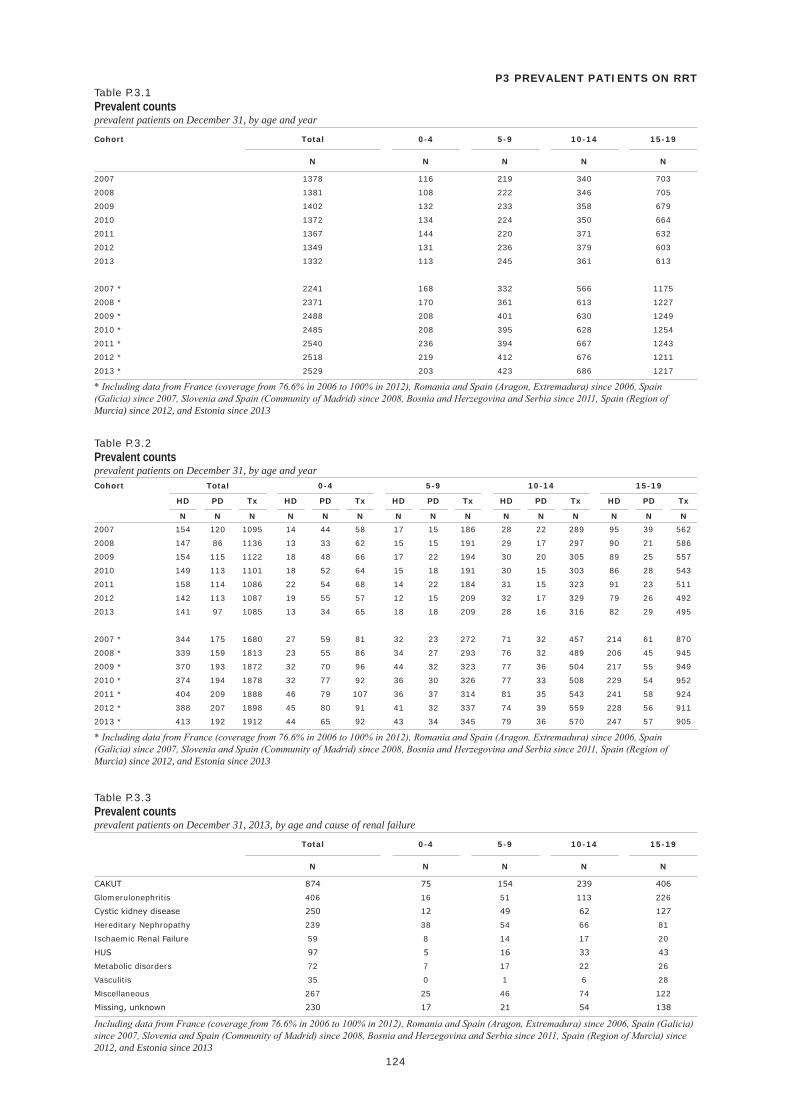
124
Cohort Total 0-4 5-9 10-14 15-19
N N N N N
Total 0-4 5-9 10-14 15-19
N N N N N
Cohort Total 0-4 5-9 10-14 15-19
HD PD Tx HD PD Tx HD PD Tx HD PD Tx HD PD Tx
N N N N N N N N N N N N N N N
P3 PREVALENT PATIENTS ON RRTTable P.3.1Prevalent countsprevalent patients on December 31, by age and year
2007 1378 116 219 340 703
2008 1381 108 222 346 705
2009 1402 132 233 358 679
2010 1372 134 224 350 664
2011 1367 144 220 371 632
2012 1349 131 236 379 603
2013 1332 113 245 361 613
2007 * 2241 168 332 566 1175
2008 * 2371 170 361 613 1227
2009 * 2488 208 401 630 1249
2010 * 2485 208 395 628 1254
2011 * 2540 236 394 667 1243
2012 * 2518 219 412 676 1211
2013 * 2529 203 423 686 1217
* Including data from France (coverage from 76.6% in 2006 to 100% in 2012), Romania and Spain (Aragon, Extremadura) since 2006, Spain (Galicia) since 2007, Slovenia and Spain (Community of Madrid) since 2008, Bosnia and Herzegovina and Serbia since 2011, Spain (Region of Murcia) since 2012, and Estonia since 2013
Table P.3.2Prevalent countsprevalent patients on December 31, by age and year
2007 154 120 1095 14 44 58 17 15 186 28 22 289 95 39 562
2008 147 86 1136 13 33 62 15 15 191 29 17 297 90 21 586
2009 154 115 1122 18 48 66 17 22 194 30 20 305 89 25 557
2010 149 113 1101 18 52 64 15 18 191 30 15 303 86 28 543
2011 158 114 1086 22 54 68 14 22 184 31 15 323 91 23 511
2012 142 113 1087 19 55 57 12 15 209 32 17 329 79 26 492
2013 141 97 1085 13 34 65 18 18 209 28 16 316 82 29 495
2007 * 344 175 1680 27 59 81 32 23 272 71 32 457 214 61 870
2008 * 339 159 1813 23 55 86 34 27 293 76 32 489 206 45 945
2009 * 370 193 1872 32 70 96 44 32 323 77 36 504 217 55 949
2010 * 374 194 1878 32 77 92 36 30 326 77 33 508 229 54 952
2011 * 404 209 1888 46 79 107 36 37 314 81 35 543 241 58 924
2012 * 388 207 1898 45 80 91 41 32 337 74 39 559 228 56 911
2013 * 413 192 1912 44 65 92 43 34 345 79 36 570 247 57 905
* Including data from France (coverage from 76.6% in 2006 to 100% in 2012), Romania and Spain (Aragon, Extremadura) since 2006, Spain (Galicia) since 2007, Slovenia and Spain (Community of Madrid) since 2008, Bosnia and Herzegovina and Serbia since 2011, Spain (Region of Murcia) since 2012, and Estonia since 2013
Table P.3.3Prevalent countsprevalent patients on December 31, 2013, by age and cause of renal failure
CAKUT 874 75 154 239 406
Glomerulonephritis 406 16 51 113 226
Cystic kidney disease 250 12 49 62 127
Hereditary Nephropathy 239 38 54 66 81
Ischaemic Renal Failure 59 8 14 17 20
HUS 97 5 16 33 43
Metabolic disorders 72 7 17 22 26
Vasculitis 35 0 1 6 28
Miscellaneous 267 25 46 74 122
Missing, unknown 230 17 21 54 138
Including data from France (coverage from 76.6% in 2006 to 100% in 2012), Romania and Spain (Aragon, Extremadura) since 2006, Spain (Galicia) since 2007, Slovenia and Spain (Community of Madrid) since 2008, Bosnia and Herzegovina and Serbia since 2011, Spain (Region of Murcia) since 2012, and Estonia since 2013
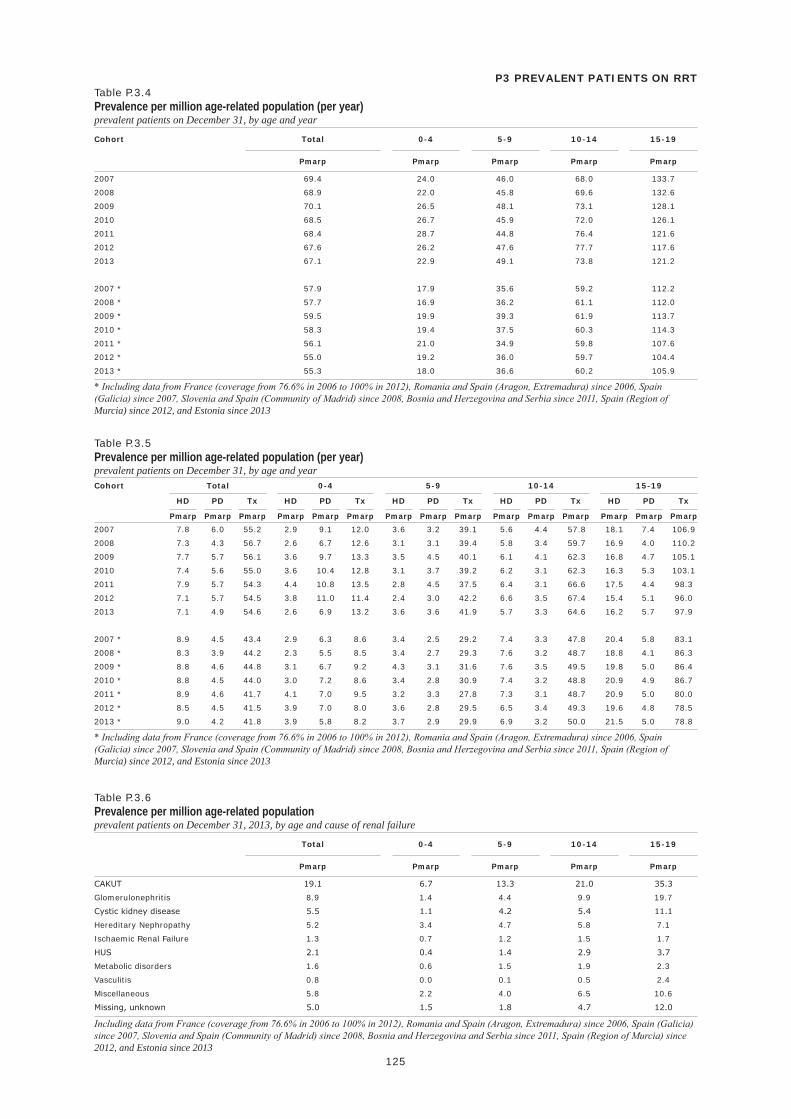
125
Cohort Total 0-4 5-9 10-14 15-19
HD PD Tx HD PD Tx HD PD Tx HD PD Tx HD PD Tx
Pmarp Pmarp Pmarp Pmarp Pmarp Pmarp Pmarp Pmarp Pmarp Pmarp Pmarp Pmarp Pmarp Pmarp Pmarp
Total 0-4 5-9 10-14 15-19
Pmarp Pmarp Pmarp Pmarp Pmarp
Cohort Total 0-4 5-9 10-14 15-19
Pmarp Pmarp Pmarp Pmarp Pmarp
P3 PREVALENT PATIENTS ON RRTTable P.3.4Prevalence per million age-related population (per year)prevalent patients on December 31, by age and year
2007 69.4 24.0 46.0 68.0 133.7
2008 68.9 22.0 45.8 69.6 132.6
2009 70.1 26.5 48.1 73.1 128.1
2010 68.5 26.7 45.9 72.0 126.1
2011 68.4 28.7 44.8 76.4 121.6
2012 67.6 26.2 47.6 77.7 117.6
2013 67.1 22.9 49.1 73.8 121.2
2007 * 57.9 17.9 35.6 59.2 112.2
2008 * 57.7 16.9 36.2 61.1 112.0
2009 * 59.5 19.9 39.3 61.9 113.7
2010 * 58.3 19.4 37.5 60.3 114.3
2011 * 56.1 21.0 34.9 59.8 107.6
2012 * 55.0 19.2 36.0 59.7 104.4
2013 * 55.3 18.0 36.6 60.2 105.9
* Including data from France (coverage from 76.6% in 2006 to 100% in 2012), Romania and Spain (Aragon, Extremadura) since 2006, Spain (Galicia) since 2007, Slovenia and Spain (Community of Madrid) since 2008, Bosnia and Herzegovina and Serbia since 2011, Spain (Region of Murcia) since 2012, and Estonia since 2013
Table P.3.5Prevalence per million age-related population (per year)prevalent patients on December 31, by age and year
2007 7.8 6.0 55.2 2.9 9.1 12.0 3.6 3.2 39.1 5.6 4.4 57.8 18.1 7.4 106.9
2008 7.3 4.3 56.7 2.6 6.7 12.6 3.1 3.1 39.4 5.8 3.4 59.7 16.9 4.0 110.2
2009 7.7 5.7 56.1 3.6 9.7 13.3 3.5 4.5 40.1 6.1 4.1 62.3 16.8 4.7 105.1
2010 7.4 5.6 55.0 3.6 10.4 12.8 3.1 3.7 39.2 6.2 3.1 62.3 16.3 5.3 103.1
2011 7.9 5.7 54.3 4.4 10.8 13.5 2.8 4.5 37.5 6.4 3.1 66.6 17.5 4.4 98.3
2012 7.1 5.7 54.5 3.8 11.0 11.4 2.4 3.0 42.2 6.6 3.5 67.4 15.4 5.1 96.0
2013 7.1 4.9 54.6 2.6 6.9 13.2 3.6 3.6 41.9 5.7 3.3 64.6 16.2 5.7 97.9
2007 * 8.9 4.5 43.4 2.9 6.3 8.6 3.4 2.5 29.2 7.4 3.3 47.8 20.4 5.8 83.1
2008 * 8.3 3.9 44.2 2.3 5.5 8.5 3.4 2.7 29.3 7.6 3.2 48.7 18.8 4.1 86.3
2009 * 8.8 4.6 44.8 3.1 6.7 9.2 4.3 3.1 31.6 7.6 3.5 49.5 19.8 5.0 86.4
2010 * 8.8 4.5 44.0 3.0 7.2 8.6 3.4 2.8 30.9 7.4 3.2 48.8 20.9 4.9 86.7
2011 * 8.9 4.6 41.7 4.1 7.0 9.5 3.2 3.3 27.8 7.3 3.1 48.7 20.9 5.0 80.0
2012 * 8.5 4.5 41.5 3.9 7.0 8.0 3.6 2.8 29.5 6.5 3.4 49.3 19.6 4.8 78.5
2013 * 9.0 4.2 41.8 3.9 5.8 8.2 3.7 2.9 29.9 6.9 3.2 50.0 21.5 5.0 78.8
* Including data from France (coverage from 76.6% in 2006 to 100% in 2012), Romania and Spain (Aragon, Extremadura) since 2006, Spain (Galicia) since 2007, Slovenia and Spain (Community of Madrid) since 2008, Bosnia and Herzegovina and Serbia since 2011, Spain (Region of Murcia) since 2012, and Estonia since 2013
Table P.3.6Prevalence per million age-related populationprevalent patients on December 31, 2013, by age and cause of renal failure
CAKUT 19.1 6.7 13.3 21.0 35.3
Glomerulonephritis 8.9 1.4 4.4 9.9 19.7
Cystic kidney disease 5.5 1.1 4.2 5.4 11.1
Hereditary Nephropathy 5.2 3.4 4.7 5.8 7.1
Ischaemic Renal Failure 1.3 0.7 1.2 1.5 1.7
HUS 2.1 0.4 1.4 2.9 3.7
Metabolic disorders 1.6 0.6 1.5 1.9 2.3
Vasculitis 0.8 0.0 0.1 0.5 2.4
Miscellaneous 5.8 2.2 4.0 6.5 10.6
Missing, unknown 5.0 1.5 1.8 4.7 12.0
Including data from France (coverage from 76.6% in 2006 to 100% in 2012), Romania and Spain (Aragon, Extremadura) since 2006, Spain (Galicia) since 2007, Slovenia and Spain (Community of Madrid) since 2008, Bosnia and Herzegovina and Serbia since 2011, Spain (Region of Murcia) since 2012, and Estonia since 2013


VI Methods


129
VI Methods
The ERA-EDTA Registry is located at the Department of Medical Informatics of the Academic Medical Center in Amsterdam, The Netherlands. This department hosts several clinical registries which share a quality management system with Standard Operating Procedures (SOPs) for data collection, data storage, data analysis, and the production of the annual report. The quality management system has been certified according to the ISO 9001:2000 norm since 2004 and according to the ISO 9001:2008 norm since September 2010.
Data collection and preparation
Section A
Data collectionOnce a year data sets containing individual patient data are sent to the office of the ERA-EDTA Registry in Amsterdam. Data delivery takes place in one of the Open Data Base Connectivity (ODBC) compatible file formats, like Microsoft Access and Microsoft Excel, or in other formats like text, SPSS or SAS. Collaborating registries send data by e-mail and most data sets are received in PGP encrypted format.
Variables
The ERA-EDTA Registry asks national and regional registries for the data in Table 1.
Table 1: Variables collected for Section A
Patient data Transaction data
Patient identifier Patient identifierCountry of registry Date of eventDate of birth Type of event / treatmentGender Cause of deathPrimary Renal Disease Treatment centreDate of first RRT Source registry Destination registry
Collaborating registries and participating countries
Individual patient data of 31 national and regional registries from 17 countries were used to create the tables in Section A of this annual report (see Figure 1).
Registry data are subject to continuous alteration and improvement. Small differences between ERA-EDTA Registry data and the data presented in the national and regional registry’s own annual reports may result from different times of data extraction. Minor differences between the numbers reported by the UK Renal Registry and this annual report may occur because the prevalence as reported in the UK Renal Registry Report is based on quarterly data returns, whereas the prevalence as reported in this annual report is based on data derived from the modality timeline.
The data on Spain presented in Section A of this report are based on separate datasets from 13 of 19 regions, including Andalusia, Aragon, Asturias, Basque country, Cantabria, Castile and León, Castile-La Mancha, Catalonia, Extremadura, Galicia, Community of Madrid, Region of Murcia and Valencian region.
130
Differences between collaborating registries
Definitions and collection of data
In the comparison of data between registries it should be recognized that there may be small differences between registries in definitions and in the collection of their data. For example, the different registries do not collect data at the same level of detail, especially with regard to the various subtypes of the treatment modalities.
Patient population
The data from Belgium (Dutch-speaking), Belgium (French-speaking), Spain (Cantabria), Spain (Castile and León), Spain (Castile-La Mancha), and United Kingdom (England/Northern Ireland/Wales) only comprised patients older than 20 years of age. It has been estimated that inclusion of data on children would add about 2 per million population (Pmp) to the incidence rate and about 13 Pmp to the prevalence.
For the calculation of the incidence of those alive and on RRT on day 91, registries were asked to provide data with follow-up until 31 March 2014. For the following registries data were only available until 31 December 2013: Austria, Spain (Asturias), Spain (Catalonia), Spain (Extremadura), and UK (England, Wales and Northern Ireland). For these registries the incidence on day 91 was estimated as explained in the paragraph on statistical analyses.
For Romania, the kidney transplantation activity reported reflects 70% of the total kidney transplantation activity in the country because there is an underreporting of pre-emptive transplantations. As a consequence, the overall incidence and prevalence of RRT were underestimated by approximately 1% and 3%, respectively.
Data loading and cleaningThe registry data were imported using an in-house developed import utility. This program first uniforms the data and then translates any non-standard codes. Consistency checks were performed, and thereafter the data were converted to the desired format in order to make storage in the relational and event-driven database possible. The new data, annually provided by national and regional registries, replaced all existing data in the ERA-EDTA Registry database. Changes in the data sets made by the national and regional registries were in this way adopted by the ERA-EDTA Registry. The import utility performed extensive logging and the logging-results were used to provide the national and regional registries with feedback concerning inconsistencies or other problems in the data.
After data analysis, the results were compared to the annual reports published by the national and regional registries as a first check for errors. In case of discrepancies the registry was contacted and potential problems regarding (the interpretation of) their data set were solved. Thereafter, more detailed reports were produced which needed the approval from the registries before publication in this ERA-EDTA Registry Annual Report.
ERA-EDTA Registry databaseMicrosoft SQL Server (a database management system) was used to manage the ERA-EDTA Registry database. This relational and event-driven database consists of a patient and a transaction table which can be extended according to future needs.
General population dataMidyear population data of the contributing countries were provided by Eurostat, the national bureau of statistics or the national or regional registry. The sources of the population data used for the analyses in Section A are shown in Table 2.
Reference populationIn this year’s Annual Report, the age and gender distribution of the EU27 of 2010 as provided by Eurostat is used for the adjustment of incidence rates and prevalence for age and gender [1]. The age and gender distribution of EU27 in 2010 is shown in Table 3.
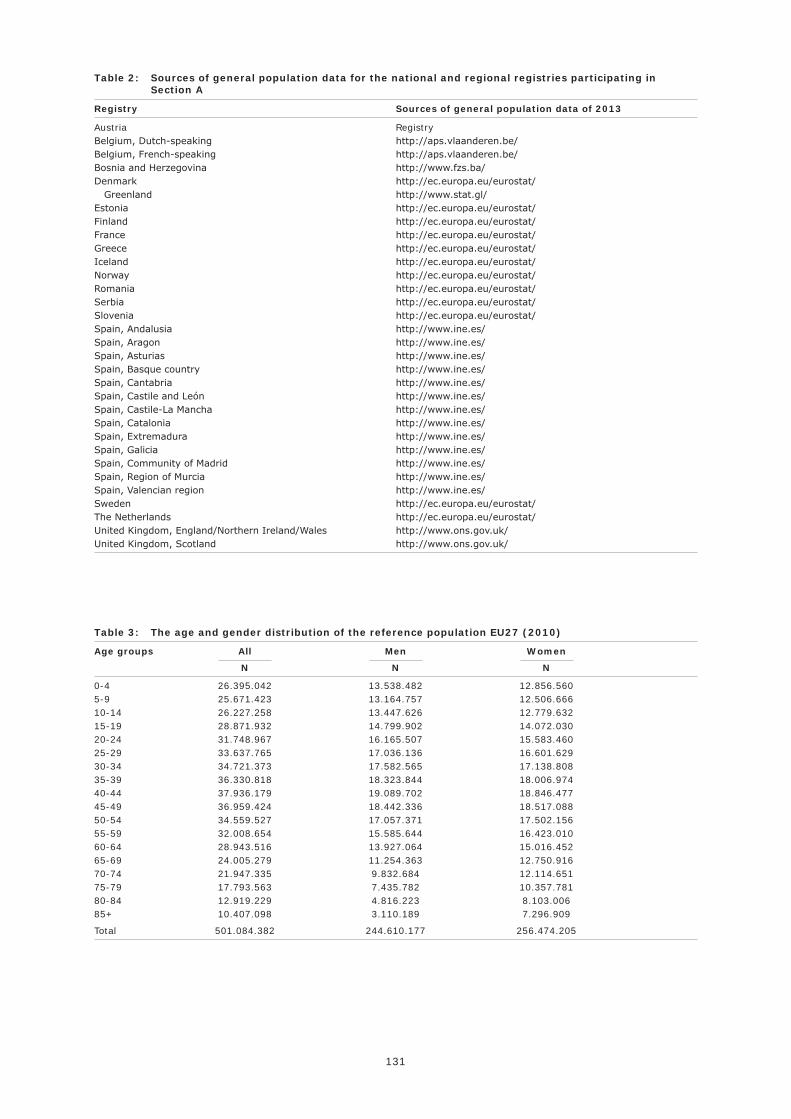
131
Table 2: Sources of general population data for the national and regional registries participating in Section A
Registry Sources of general population data of 2013
Austria RegistryBelgium, Dutch-speaking http://aps.vlaanderen.be/Belgium, French-speaking http://aps.vlaanderen.be/Bosnia and Herzegovina http://www.fzs.ba/Denmark http://ec.europa.eu/eurostat/ Greenland http://www.stat.gl/Estonia http://ec.europa.eu/eurostat/Finland http://ec.europa.eu/eurostat/France http://ec.europa.eu/eurostat/Greece http://ec.europa.eu/eurostat/Iceland http://ec.europa.eu/eurostat/Norway http://ec.europa.eu/eurostat/Romania http://ec.europa.eu/eurostat/Serbia http://ec.europa.eu/eurostat/Slovenia http://ec.europa.eu/eurostat/Spain, Andalusia http://www.ine.es/Spain, Aragon http://www.ine.es/Spain, Asturias http://www.ine.es/Spain, Basque country http://www.ine.es/Spain, Cantabria http://www.ine.es/Spain, Castile and León http://www.ine.es/Spain, Castile-La Mancha http://www.ine.es/Spain, Catalonia http://www.ine.es/Spain, Extremadura http://www.ine.es/Spain, Galicia http://www.ine.es/Spain, Community of Madrid http://www.ine.es/Spain, Region of Murcia http://www.ine.es/Spain, Valencian region http://www.ine.es/Sweden http://ec.europa.eu/eurostat/The Netherlands http://ec.europa.eu/eurostat/United Kingdom, England/Northern Ireland/Wales http://www.ons.gov.uk/United Kingdom, Scotland http://www.ons.gov.uk/
Table 3: The age and gender distribution of the reference population EU27 (2010)
Age groups All Men Women
N N N
0-4 26.395.042 13.538.482 12.856.5605-9 25.671.423 13.164.757 12.506.66610-14 26.227.258 13.447.626 12.779.63215-19 28.871.932 14.799.902 14.072.03020-24 31.748.967 16.165.507 15.583.46025-29 33.637.765 17.036.136 16.601.62930-34 34.721.373 17.582.565 17.138.80835-39 36.330.818 18.323.844 18.006.97440-44 37.936.179 19.089.702 18.846.47745-49 36.959.424 18.442.336 18.517.08850-54 34.559.527 17.057.371 17.502.15655-59 32.008.654 15.585.644 16.423.01060-64 28.943.516 13.927.064 15.016.45265-69 24.005.279 11.254.363 12.750.91670-74 21.947.335 9.832.684 12.114.65175-79 17.793.563 7.435.782 10.357.78180-84 12.919.229 4.816.223 8.103.00685+ 10.407.098 3.110.189 7.296.909
Total 501.084.382 244.610.177 256.474.205
132
Section B
Data collectionSection B relates to national registries from countries providing the ERA-EDTA Registry with aggregated data. Data were provided via a Microsoft Excel template and imported for inclusion in this annual report.
Collaborating registries
Aggregated data from 18 national registries are used for the preparation of the tables in Section B (see Figure 1). The following countries participated in Section B of this year’s annual report: Albania, Bulgaria, Croatia, Cyprus, Czech Republic, Georgia, Israel, Latvia, Lithuania, Montenegro, Poland, Portugal, Russia, Slovakia, Spain, Switzerland, Turkey, and Ukraine.
Data from Spain are based on 18 of the 19 regions, including Andalusia, Aragon, Asturias, Balearic Islands, Basque country, Cantabria, Castile and León, Castile-La Mancha, Catalonia, Extremadura, Galicia, La Rioja, Community of Madrid, Region of Murcia, Navarre, Valencian region, and the overseas cities Ceuta and Melilla.
Data loading and cleaningThe Microsoft Excel templates used for data collection included automated consistency checks. Additional checks were performed manually.
General population dataThe population data needed for the calculation of incidence rates and prevalence Pmp were reported by the collaborating registries.
Reference populationAs in Section A, we used the age and gender distribution of the EU27 of 2010 (see Table 3) as provided by Eurostat for the adjustment of incidence rates and prevalence [1].
Definitions and coding systems
The definitions given below apply to both Section A and B.
Incidence and prevalenceIncidence is the number of new cases of a condition during a specific period of time which, in this annual report, is a year (2013). Prevalence is the number of people in a given population with a particular disease at a given time, in this annual report at December 31, 2013.
Primary cause of renal failureRenal diseases were defined according to both the old and new (2012) ERA-EDTA coding systems and subsequently classified into groups (Appendix 1 and 2). When 2012 PRD codes were provided, those were categorized into the old groups, which resulted in a somewhat different distribution of PRD groups.
Causes of deathCauses of death were defined according to the ERA-EDTA coding systems and subsequently classified into groups (Appendix 3).
Treatment modalitiesAppendix 4 provides an overview of the coding currently used for treatment modalities in the ERA-EDTA database.
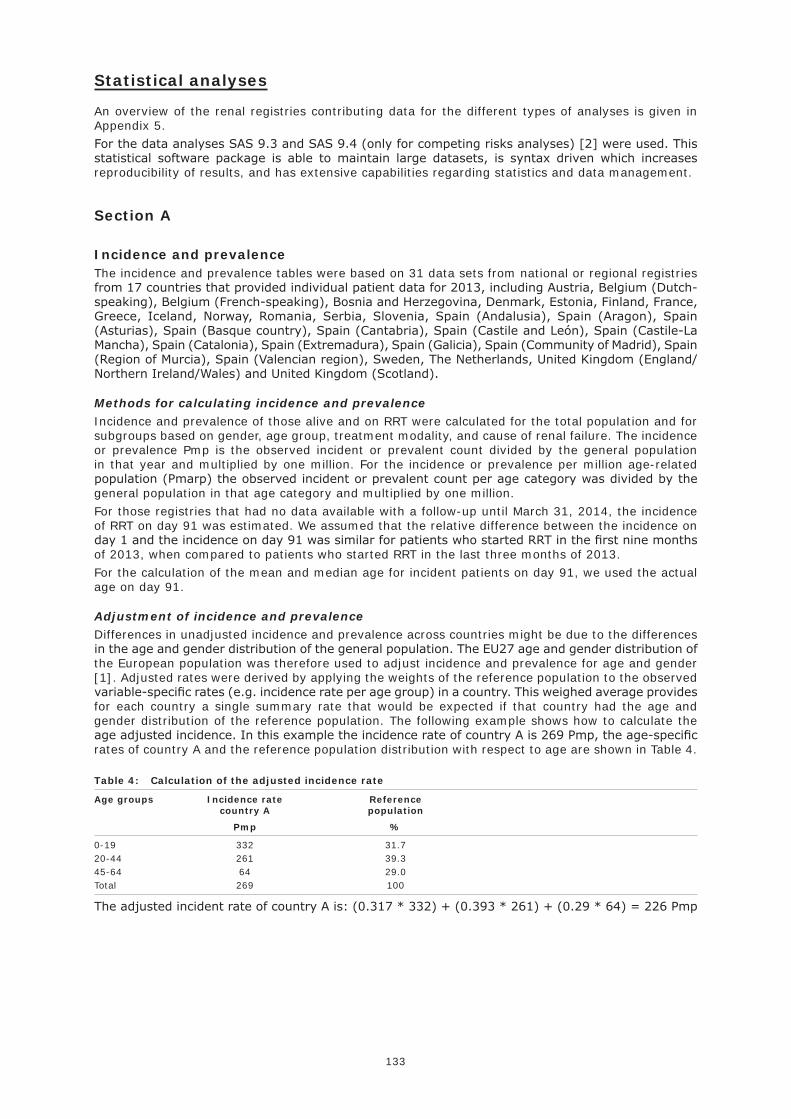
133
Statistical analyses
An overview of the renal registries contributing data for the different types of analyses is given in Appendix 5.
For the data analyses SAS 9.3 and SAS 9.4 (only for competing risks analyses) [2] were used. This statistical software package is able to maintain large datasets, is syntax driven which increases reproducibility of results, and has extensive capabilities regarding statistics and data management.
Section A
Incidence and prevalenceThe incidence and prevalence tables were based on 31 data sets from national or regional registries from 17 countries that provided individual patient data for 2013, including Austria, Belgium (Dutch-speaking), Belgium (French-speaking), Bosnia and Herzegovina, Denmark, Estonia, Finland, France, Greece, Iceland, Norway, Romania, Serbia, Slovenia, Spain (Andalusia), Spain (Aragon), Spain (Asturias), Spain (Basque country), Spain (Cantabria), Spain (Castile and León), Spain (Castile-La Mancha), Spain (Catalonia), Spain (Extremadura), Spain (Galicia), Spain (Community of Madrid), Spain (Region of Murcia), Spain (Valencian region), Sweden, The Netherlands, United Kingdom (England/Northern Ireland/Wales) and United Kingdom (Scotland).
Methods for calculating incidence and prevalence
Incidence and prevalence of those alive and on RRT were calculated for the total population and for subgroups based on gender, age group, treatment modality, and cause of renal failure. The incidence or prevalence Pmp is the observed incident or prevalent count divided by the general population in that year and multiplied by one million. For the incidence or prevalence per million age-related population (Pmarp) the observed incident or prevalent count per age category was divided by the general population in that age category and multiplied by one million.
For those registries that had no data available with a follow-up until March 31, 2014, the incidence of RRT on day 91 was estimated. We assumed that the relative difference between the incidence on day 1 and the incidence on day 91 was similar for patients who started RRT in the first nine months of 2013, when compared to patients who started RRT in the last three months of 2013.
For the calculation of the mean and median age for incident patients on day 91, we used the actual age on day 91.
Adjustment of incidence and prevalence
Differences in unadjusted incidence and prevalence across countries might be due to the differences in the age and gender distribution of the general population. The EU27 age and gender distribution of the European population was therefore used to adjust incidence and prevalence for age and gender [1]. Adjusted rates were derived by applying the weights of the reference population to the observed variable-specific rates (e.g. incidence rate per age group) in a country. This weighed average provides for each country a single summary rate that would be expected if that country had the age and gender distribution of the reference population. The following example shows how to calculate the age adjusted incidence. In this example the incidence rate of country A is 269 Pmp, the age-specific rates of country A and the reference population distribution with respect to age are shown in Table 4.
Table 4: Calculation of the adjusted incidence rate
Age groups Incidence rate Reference country A population
Pmp %
0-19 332 31.720-44 261 39.345-64 64 29.0Total 269 100
The adjusted incident rate of country A is: (0.317 * 332) + (0.393 * 261) + (0.29 * 64) = 226 Pmp
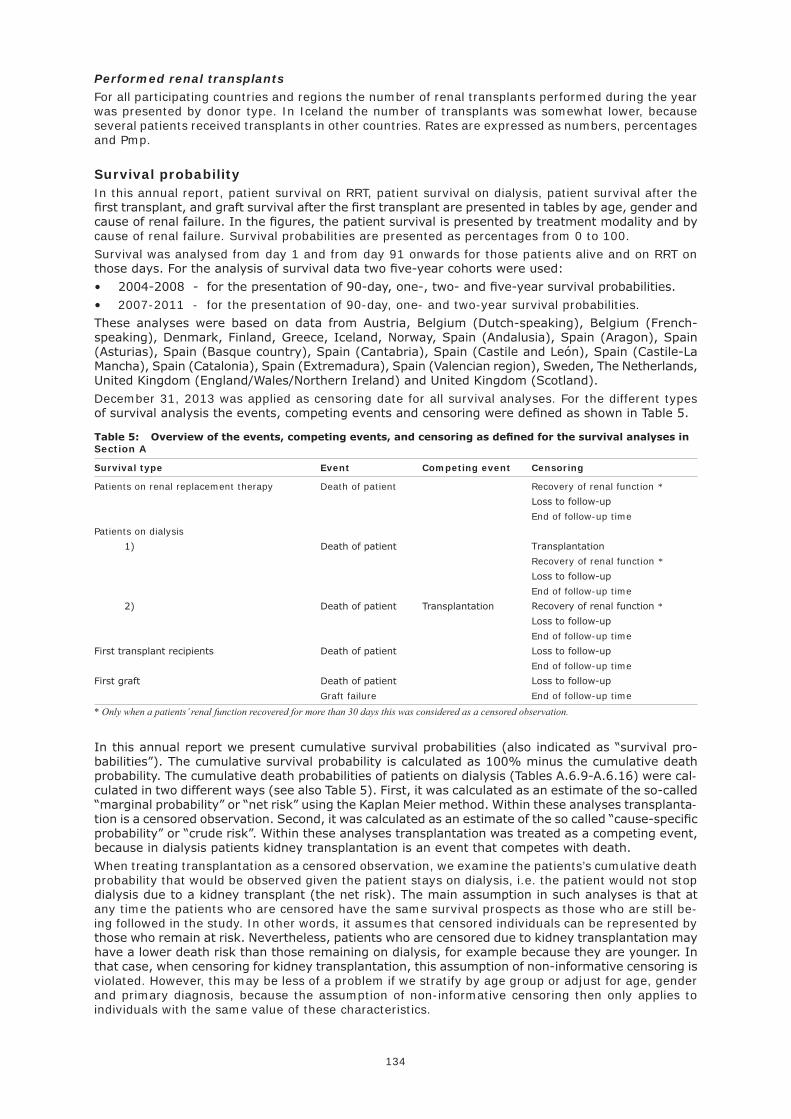
134
Performed renal transplants
For all participating countries and regions the number of renal transplants performed during the year was presented by donor type. In Iceland the number of transplants was somewhat lower, because several patients received transplants in other countries. Rates are expressed as numbers, percentages and Pmp.
Survival probabilityIn this annual report, patient survival on RRT, patient survival on dialysis, patient survival after the first transplant, and graft survival after the first transplant are presented in tables by age, gender and cause of renal failure. In the figures, the patient survival is presented by treatment modality and by cause of renal failure. Survival probabilities are presented as percentages from 0 to 100.
Survival was analysed from day 1 and from day 91 onwards for those patients alive and on RRT on those days. For the analysis of survival data two five-year cohorts were used:
• 2004-2008 - for the presentation of 90-day, one-, two- and five-year survival probabilities.
• 2007-2011 - for the presentation of 90-day, one- and two-year survival probabilities.
These analyses were based on data from Austria, Belgium (Dutch-speaking), Belgium (French-speaking), Denmark, Finland, Greece, Iceland, Norway, Spain (Andalusia), Spain (Aragon), Spain (Asturias), Spain (Basque country), Spain (Cantabria), Spain (Castile and León), Spain (Castile-La Mancha), Spain (Catalonia), Spain (Extremadura), Spain (Valencian region), Sweden, The Netherlands, United Kingdom (England/Wales/Northern Ireland) and United Kingdom (Scotland).
December 31, 2013 was applied as censoring date for all survival analyses. For the different types of survival analysis the events, competing events and censoring were defined as shown in Table 5.
Table 5: Overview of the events, competing events, and censoring as defined for the survival analyses in Section A
Survival type Event Competing event Censoring
Patients on renal replacement therapy Death of patient Recovery of renal function * Loss to follow-up
End of follow-up time
Patients on dialysis
1) Death of patient
2) Death of patient Transplantation
First transplant recipients Death of patient
First graft Death of patient
Graft failure
Transplantation
Recovery of renal function * Loss to follow-up
End of follow-up time
Recovery of renal function * Loss to follow-up
End of follow-up time
Loss to follow-up
End of follow-up time
Loss to follow-up
End of follow-up time
* Only when a patients’ renal function recovered for more than 30 days this was considered as a censored observation.
In this annual report we present cumulative survival probabilities (also indicated as “survival pro-babilities”). The cumulative survival probability is calculated as 100% minus the cumulative death probability. The cumulative death probabilities of patients on dialysis (Tables A.6.9-A.6.16) were cal-culated in two different ways (see also Table 5). First, it was calculated as an estimate of the so-called “marginal probability” or “net risk” using the Kaplan Meier method. Within these analyses transplanta-tion is a censored observation. Second, it was calculated as an estimate of the so called “cause-specific probability” or “crude risk”. Within these analyses transplantation was treated as a competing event, because in dialysis patients kidney transplantation is an event that competes with death.
When treating transplantation as a censored observation, we examine the patients’s cumulative death probability that would be observed given the patient stays on dialysis, i.e. the patient would not stop dialysis due to a kidney transplant (the net risk). The main assumption in such analyses is that at any time the patients who are censored have the same survival prospects as those who are still be-ing followed in the study. In other words, it assumes that censored individuals can be represented by those who remain at risk. Nevertheless, patients who are censored due to kidney transplantation may have a lower death risk than those remaining on dialysis, for example because they are younger. In that case, when censoring for kidney transplantation, this assumption of non-informative censoring is violated. However, this may be less of a problem if we stratify by age group or adjust for age, gender and primary diagnosis, because the assumption of non-informative censoring then only applies to individuals with the same value of these characteristics.
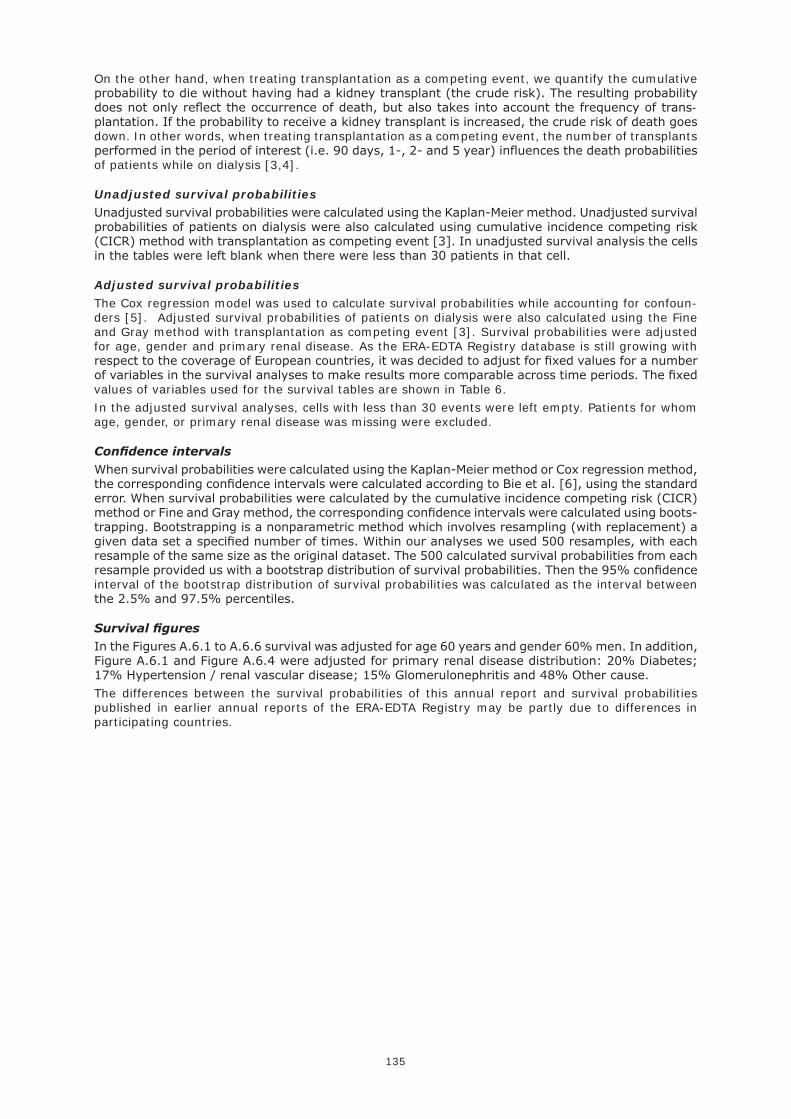
135
On the other hand, when treating transplantation as a competing event, we quantify the cumulative probability to die without having had a kidney transplant (the crude risk). The resulting probability does not only reflect the occurrence of death, but also takes into account the frequency of trans-plantation. If the probability to receive a kidney transplant is increased, the crude risk of death goes down. In other words, when treating transplantation as a competing event, the number of transplants performed in the period of interest (i.e. 90 days, 1-, 2- and 5 year) influences the death probabilities of patients while on dialysis [3,4].
Unadjusted survival probabilities
Unadjusted survival probabilities were calculated using the Kaplan-Meier method. Unadjusted survival probabilities of patients on dialysis were also calculated using cumulative incidence competing risk (CICR) method with transplantation as competing event [3]. In unadjusted survival analysis the cells in the tables were left blank when there were less than 30 patients in that cell.
Adjusted survival probabilities
The Cox regression model was used to calculate survival probabilities while accounting for confoun-ders [5]. Adjusted survival probabilities of patients on dialysis were also calculated using the Fine and Gray method with transplantation as competing event [3]. Survival probabilities were adjusted for age, gender and primary renal disease. As the ERA-EDTA Registry database is still growing with respect to the coverage of European countries, it was decided to adjust for fixed values for a number of variables in the survival analyses to make results more comparable across time periods. The fixed values of variables used for the survival tables are shown in Table 6.
In the adjusted survival analyses, cells with less than 30 events were left empty. Patients for whom age, gender, or primary renal disease was missing were excluded.
Confidence intervals
When survival probabilities were calculated using the Kaplan-Meier method or Cox regression method, the corresponding confidence intervals were calculated according to Bie et al. [6], using the standard error. When survival probabilities were calculated by the cumulative incidence competing risk (CICR) method or Fine and Gray method, the corresponding confidence intervals were calculated using boots-trapping. Bootstrapping is a nonparametric method which involves resampling (with replacement) a given data set a specified number of times. Within our analyses we used 500 resamples, with each resample of the same size as the original dataset. The 500 calculated survival probabilities from each resample provided us with a bootstrap distribution of survival probabilities. Then the 95% confidence interval of the bootstrap distribution of survival probabilities was calculated as the interval between the 2.5% and 97.5% percentiles.
Survival figures
In the Figures A.6.1 to A.6.6 survival was adjusted for age 60 years and gender 60% men. In addition, Figure A.6.1 and Figure A.6.4 were adjusted for primary renal disease distribution: 20% Diabetes; 17% Hypertension / renal vascular disease; 15% Glomerulonephritis and 48% Other cause.
The differences between the survival probabilities of this annual report and survival probabilities published in earlier annual reports of the ERA-EDTA Registry may be partly due to differences in participating countries.
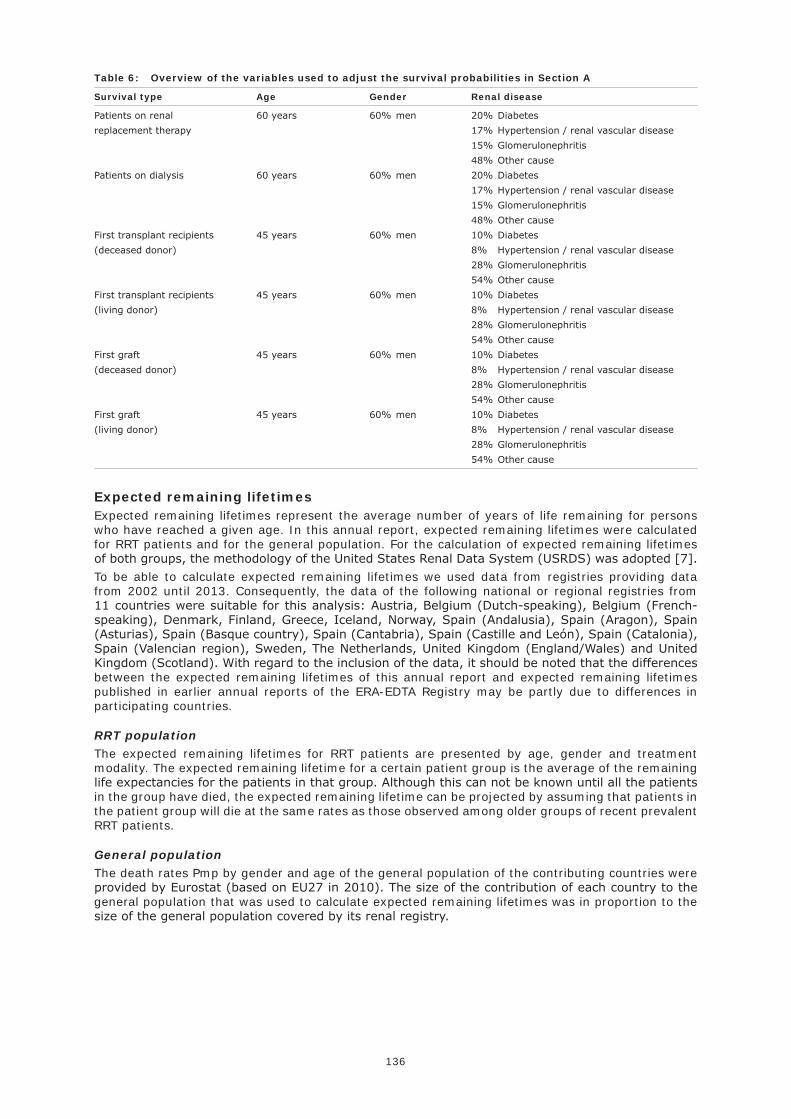
136
Table 6: Overview of the variables used to adjust the survival probabilities in Section A
Survival type Age Gender Renal disease
Patients on renal 60 years 60% men 20% Diabetes
replacement therapy 17% Hypertension / renal vascular disease
15% Glomerulonephritis
48% Other cause
Patients on dialysis 60 years 60% men 20% Diabetes
17% Hypertension / renal vascular disease
15% Glomerulonephritis
48% Other cause
First transplant recipients 45 years 60% men 10% Diabetes
(deceased donor) 8% Hypertension / renal vascular disease
28% Glomerulonephritis
54% Other cause
First transplant recipients 45 years 60% men 10% Diabetes
(living donor) 8% Hypertension / renal vascular disease
28% Glomerulonephritis
54% Other cause
First graft 45 years 60% men 10% Diabetes
(deceased donor) 8% Hypertension / renal vascular disease
28% Glomerulonephritis
54% Other cause
First graft 45 years 60% men 10% Diabetes
(living donor) 8% Hypertension / renal vascular disease
28% Glomerulonephritis
54% Other cause
Expected remaining lifetimesExpected remaining lifetimes represent the average number of years of life remaining for persons who have reached a given age. In this annual report, expected remaining lifetimes were calculated for RRT patients and for the general population. For the calculation of expected remaining lifetimes of both groups, the methodology of the United States Renal Data System (USRDS) was adopted [7].
To be able to calculate expected remaining lifetimes we used data from registries providing data from 2002 until 2013. Consequently, the data of the following national or regional registries from 11 countries were suitable for this analysis: Austria, Belgium (Dutch-speaking), Belgium (French-speaking), Denmark, Finland, Greece, Iceland, Norway, Spain (Andalusia), Spain (Aragon), Spain (Asturias), Spain (Basque country), Spain (Cantabria), Spain (Castille and León), Spain (Catalonia), Spain (Valencian region), Sweden, The Netherlands, United Kingdom (England/Wales) and United Kingdom (Scotland). With regard to the inclusion of the data, it should be noted that the differences between the expected remaining lifetimes of this annual report and expected remaining lifetimes published in earlier annual reports of the ERA-EDTA Registry may be partly due to differences in participating countries.
RRT population
The expected remaining lifetimes for RRT patients are presented by age, gender and treatment modality. The expected remaining lifetime for a certain patient group is the average of the remaining life expectancies for the patients in that group. Although this can not be known until all the patients in the group have died, the expected remaining lifetime can be projected by assuming that patients in the patient group will die at the same rates as those observed among older groups of recent prevalent RRT patients.
General population
The death rates Pmp by gender and age of the general population of the contributing countries were provided by Eurostat (based on EU27 in 2010). The size of the contribution of each country to the general population that was used to calculate expected remaining lifetimes was in proportion to the size of the general population covered by its renal registry.
137
Section BIncidence and prevalence counts were provided by the contributing registries themselves. To increase the consistency of the data, general explanations of how to complete the Microsoft Excel template and how to calculate adjusted incidence and prevalence counts were provided to support the participating registries.
Paediatric SectionThe incidence and prevalence tables were based on data from 25 national or regional registries from 16 countries that provided complete individual patient data in their paediatric population for 2004 to 2013, including Austria, Bosnia and Herzegovina, Denmark, Estonia, Finland, France, Greece, Iceland, Norway, Romania, Serbia, Slovenia, Spain (Andalusia), Spain (Aragon), Spain (Asturias), Spain (Basque country), Spain (Catalonia), Spain (Extremadura), Spain (Galicia), Spain (community of Madrid), Spain (Region of Murcia), Spain (Valencian region), Sweden, The Netherlands, and United Kingdom (Scotland). France (coverage from 76.6% in 2006 to 100% in 2012), Romania and Spain (Aragon, Extremadura) provided data since 2006, Spain (Galicia) since 2007, Slovenia and Spain (Community of Madrid) since 2008, Bosnia and Herzegovina and Serbia since 2011, Spain (Region of Murcia) since 2012, and Estonia since 2013. Furthermore, as not every region in Spain had a specialised paediatric centre, paediatric patients could be treated in other regions than their resident region. This would result in an underestimation of the incidence and prevalence in these regions. To adjust for this, non-resident paediatric patients were not excluded in the paediatric section.
Incidence (on day 1) and prevalence on RRT were calculated for subgroups based on age, treatment modality, and cause of renal failure. Incidence on RRT by 2-year cohorts was presented for paediatric patients who started RRT between 2004 and 2013. The cohorts 2008-2009, 2010-2011 and 2012-2013 were presented twice, once including and once excluding the countries with a limited follow-up to allow for a comparison over time. The incidence on RRT Pmarp was the observed incident count in that particular time period divided by the age-related general population in that time period (for example the total population in 2012 + the total population in 2013) multiplied by one million. The grouping of primary renal disease codes for the paediatric population is described in Table P.1.2 as it differs from the grouping in the adult population.
The prevalence on RRT was presented at December 31 of each year from 2007 to 2013 and were presented twice, once including and once excluding the above mentioned countries and periods to allow for a comparison over time. The prevalence on RRT by cause of renal failure was calculated for patients prevalent on December 31, 2013.
Bibliography
1) Eurostat: http://ec.europa.eu/eurostat/data/database.
2) SAS Institute Inc., Cary, NC, USA.
3) Noordzij M, Leffondré K, van Stralen KJ, Zoccali C, Dekker FW, Jager KJ. When do we need competing risks methods for survival analysis in nephrology? Nephrol Dial Transplant. 2013 Nov; 28 :2670-2677.
4) Wolbers M, Koller MT, Stel VS, Schaer B, Jager KJ, Leffondré K, Heinze G. Competing risks analyses: objec-tives and approaches.
5) Altman, D. Practical statistics for medical research. second ed. 1999, London: Chapman & Hall.
6) Bie O, Borgan O and Liestol K. Confidence intervals and confidence bands for the cumulative hazard rate function and their small sample properties. Scandinavian Journal of Statistics 1987; 14: 221-233.
7) U.S. Renal Data System, USRDS 2012 Annual Data Report: Atlas of End-Stage Renal Disease in the United States, National Institutes of Health, National Institute of Diabetes and Digestive and Kidney Diseases, Bethesda, MD, 2012.


VII Appendices
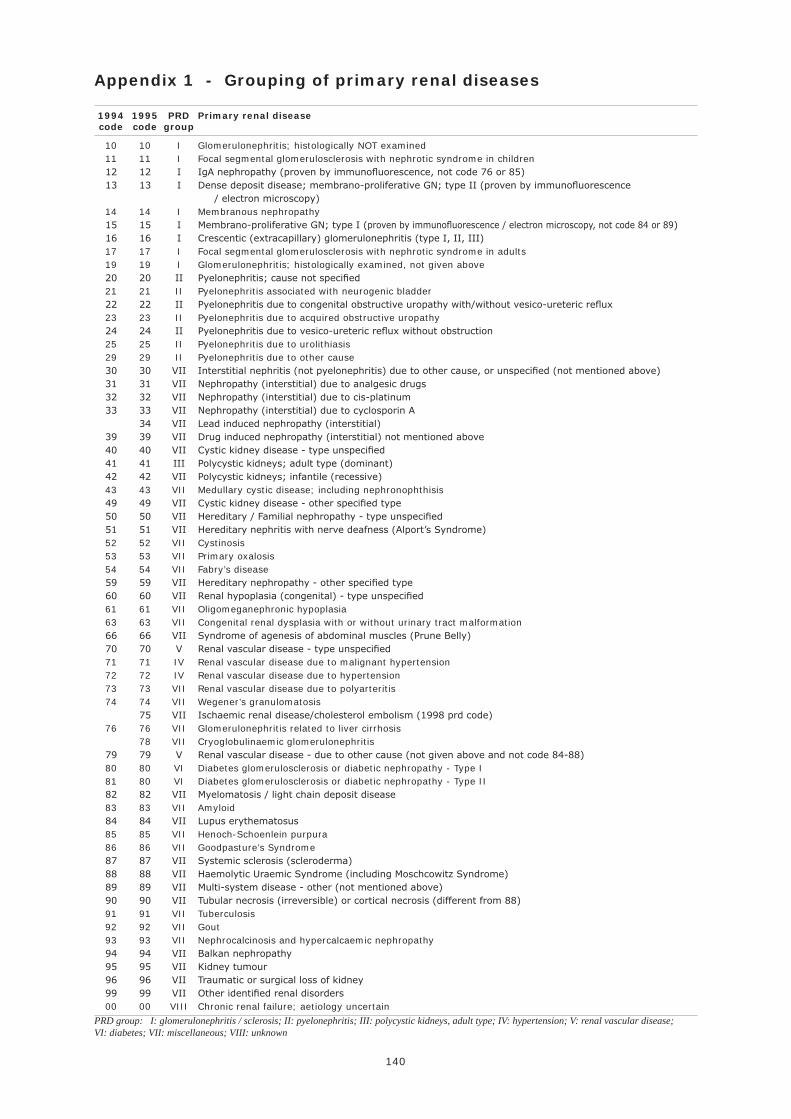
140
Appendix 1 - Grouping of primary renal diseases
1994 1995 PRD Primary renal disease code code group
10 10 I Glomerulonephritis; histologically NOT examined 11 11 I Focal segmental glomerulosclerosis with nephrotic syndrome in children 12 12 I IgA nephropathy (proven by immunofluorescence, not code 76 or 85) 13 13 I Dense deposit disease; membrano-proliferative GN; type II (proven by immunofluorescence / electron microscopy) 14 14 I Membranous nephropathy 15 15 I Membrano-proliferative GN; type I (proven by immunofluorescence / electron microscopy, not code 84 or 89) 16 16 I Crescentic (extracapillary) glomerulonephritis (type I, II, III) 17 17 I Focal segmental glomerulosclerosis with nephrotic syndrome in adults 19 19 I Glomerulonephritis; histologically examined, not given above 20 20 II Pyelonephritis; cause not specified 21 21 II Pyelonephritis associated with neurogenic bladder 22 22 II Pyelonephritis due to congenital obstructive uropathy with/without vesico-ureteric reflux 23 23 II Pyelonephritis due to acquired obstructive uropathy 24 24 II Pyelonephritis due to vesico-ureteric reflux without obstruction 25 25 II Pyelonephritis due to urolithiasis 29 29 II Pyelonephritis due to other cause 30 30 VII Interstitial nephritis (not pyelonephritis) due to other cause, or unspecified (not mentioned above) 31 31 VII Nephropathy (interstitial) due to analgesic drugs 32 32 VII Nephropathy (interstitial) due to cis-platinum 33 33 VII Nephropathy (interstitial) due to cyclosporin A 34 VII Lead induced nephropathy (interstitial) 39 39 VII Drug induced nephropathy (interstitial) not mentioned above 40 40 VII Cystic kidney disease - type unspecified 41 41 III Polycystic kidneys; adult type (dominant) 42 42 VII Polycystic kidneys; infantile (recessive) 43 43 VII Medullary cystic disease; including nephronophthisis 49 49 VII Cystic kidney disease - other specified type 50 50 VII Hereditary / Familial nephropathy - type unspecified 51 51 VII Hereditary nephritis with nerve deafness (Alport’s Syndrome) 52 52 VII Cystinosis 53 53 VII Primary oxalosis 54 54 VII Fabry’s disease 59 59 VII Hereditary nephropathy - other specified type 60 60 VII Renal hypoplasia (congenital) - type unspecified 61 61 VII Oligomeganephronic hypoplasia 63 63 VII Congenital renal dysplasia with or without urinary tract malformation 66 66 VII Syndrome of agenesis of abdominal muscles (Prune Belly) 70 70 V Renal vascular disease - type unspecified 71 71 IV Renal vascular disease due to malignant hypertension 72 72 IV Renal vascular disease due to hypertension 73 73 VII Renal vascular disease due to polyarteritis 74 74 VII Wegener’s granulomatosis 75 VII Ischaemic renal disease/cholesterol embolism (1998 prd code) 76 76 VII Glomerulonephritis related to liver cirrhosis 78 VII Cryoglobulinaemic glomerulonephritis 79 79 V Renal vascular disease - due to other cause (not given above and not code 84-88) 80 80 VI Diabetes glomerulosclerosis or diabetic nephropathy - Type I 81 80 VI Diabetes glomerulosclerosis or diabetic nephropathy - Type II 82 82 VII Myelomatosis / light chain deposit disease 83 83 VII Amyloid 84 84 VII Lupus erythematosus 85 85 VII Henoch-Schoenlein purpura 86 86 VII Goodpasture’s Syndrome 87 87 VII Systemic sclerosis (scleroderma) 88 88 VII Haemolytic Uraemic Syndrome (including Moschcowitz Syndrome) 89 89 VII Multi-system disease - other (not mentioned above) 90 90 VII Tubular necrosis (irreversible) or cortical necrosis (different from 88) 91 91 VII Tuberculosis 92 92 VII Gout 93 93 VII Nephrocalcinosis and hypercalcaemic nephropathy 94 94 VII Balkan nephropathy 95 95 VII Kidney tumour 96 96 VII Traumatic or surgical loss of kidney 99 99 VII Other identified renal disorders 00 00 VIII Chronic renal failure; aetiology uncertain
PRD group: I: glomerulonephritis / sclerosis; II: pyelonephritis; III: polycystic kidneys, adult type; IV: hypertension; V: renal vascular disease; VI: diabetes; VII: miscellaneous; VIII: unknown
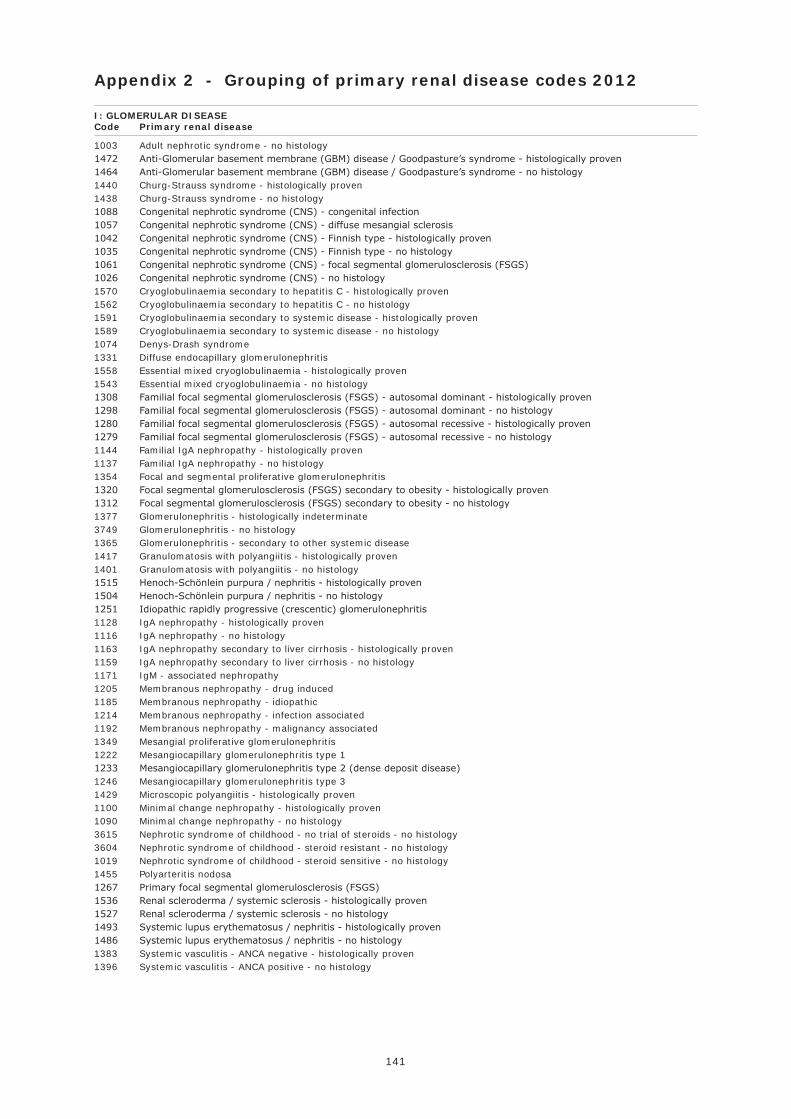
141
Appendix 2 - Grouping of primary renal disease codes 2012
I: GLOMERULAR DISEASE Code Primary renal disease
1003 Adult nephrotic syndrome - no histology1472 Anti-Glomerular basement membrane (GBM) disease / Goodpasture’s syndrome - histologically proven1464 Anti-Glomerular basement membrane (GBM) disease / Goodpasture’s syndrome - no histology1440 Churg-Strauss syndrome - histologically proven1438 Churg-Strauss syndrome - no histology1088 Congenital nephrotic syndrome (CNS) - congenital infection1057 Congenital nephrotic syndrome (CNS) - diffuse mesangial sclerosis1042 Congenital nephrotic syndrome (CNS) - Finnish type - histologically proven1035 Congenital nephrotic syndrome (CNS) - Finnish type - no histology1061 Congenital nephrotic syndrome (CNS) - focal segmental glomerulosclerosis (FSGS)1026 Congenital nephrotic syndrome (CNS) - no histology1570 Cryoglobulinaemia secondary to hepatitis C - histologically proven1562 Cryoglobulinaemia secondary to hepatitis C - no histology1591 Cryoglobulinaemia secondary to systemic disease - histologically proven1589 Cryoglobulinaemia secondary to systemic disease - no histology1074 Denys-Drash syndrome1331 Diffuse endocapillary glomerulonephritis1558 Essential mixed cryoglobulinaemia - histologically proven1543 Essential mixed cryoglobulinaemia - no histology1308 Familial focal segmental glomerulosclerosis (FSGS) - autosomal dominant - histologically proven1298 Familial focal segmental glomerulosclerosis (FSGS) - autosomal dominant - no histology1280 Familial focal segmental glomerulosclerosis (FSGS) - autosomal recessive - histologically proven1279 Familial focal segmental glomerulosclerosis (FSGS) - autosomal recessive - no histology1144 Familial IgA nephropathy - histologically proven1137 Familial IgA nephropathy - no histology1354 Focal and segmental proliferative glomerulonephritis1320 Focal segmental glomerulosclerosis (FSGS) secondary to obesity - histologically proven1312 Focal segmental glomerulosclerosis (FSGS) secondary to obesity - no histology1377 Glomerulonephritis - histologically indeterminate3749 Glomerulonephritis - no histology1365 Glomerulonephritis - secondary to other systemic disease1417 Granulomatosis with polyangiitis - histologically proven1401 Granulomatosis with polyangiitis - no histology1515 Henoch-Schönlein purpura / nephritis - histologically proven1504 Henoch-Schönlein purpura / nephritis - no histology1251 Idiopathic rapidly progressive (crescentic) glomerulonephritis1128 IgA nephropathy - histologically proven1116 IgA nephropathy - no histology1163 IgA nephropathy secondary to liver cirrhosis - histologically proven1159 IgA nephropathy secondary to liver cirrhosis - no histology1171 IgM - associated nephropathy1205 Membranous nephropathy - drug induced1185 Membranous nephropathy - idiopathic1214 Membranous nephropathy - infection associated1192 Membranous nephropathy - malignancy associated1349 Mesangial proliferative glomerulonephritis 1222 Mesangiocapillary glomerulonephritis type 11233 Mesangiocapillary glomerulonephritis type 2 (dense deposit disease)1246 Mesangiocapillary glomerulonephritis type 31429 Microscopic polyangiitis - histologically proven1100 Minimal change nephropathy - histologically proven1090 Minimal change nephropathy - no histology3615 Nephrotic syndrome of childhood - no trial of steroids - no histology3604 Nephrotic syndrome of childhood - steroid resistant - no histology1019 Nephrotic syndrome of childhood - steroid sensitive - no histology1455 Polyarteritis nodosa1267 Primary focal segmental glomerulosclerosis (FSGS)1536 Renal scleroderma / systemic sclerosis - histologically proven1527 Renal scleroderma / systemic sclerosis - no histology1493 Systemic lupus erythematosus / nephritis - histologically proven1486 Systemic lupus erythematosus / nephritis - no histology1383 Systemic vasculitis - ANCA negative - histologically proven1396 Systemic vasculitis - ANCA positive - no histology
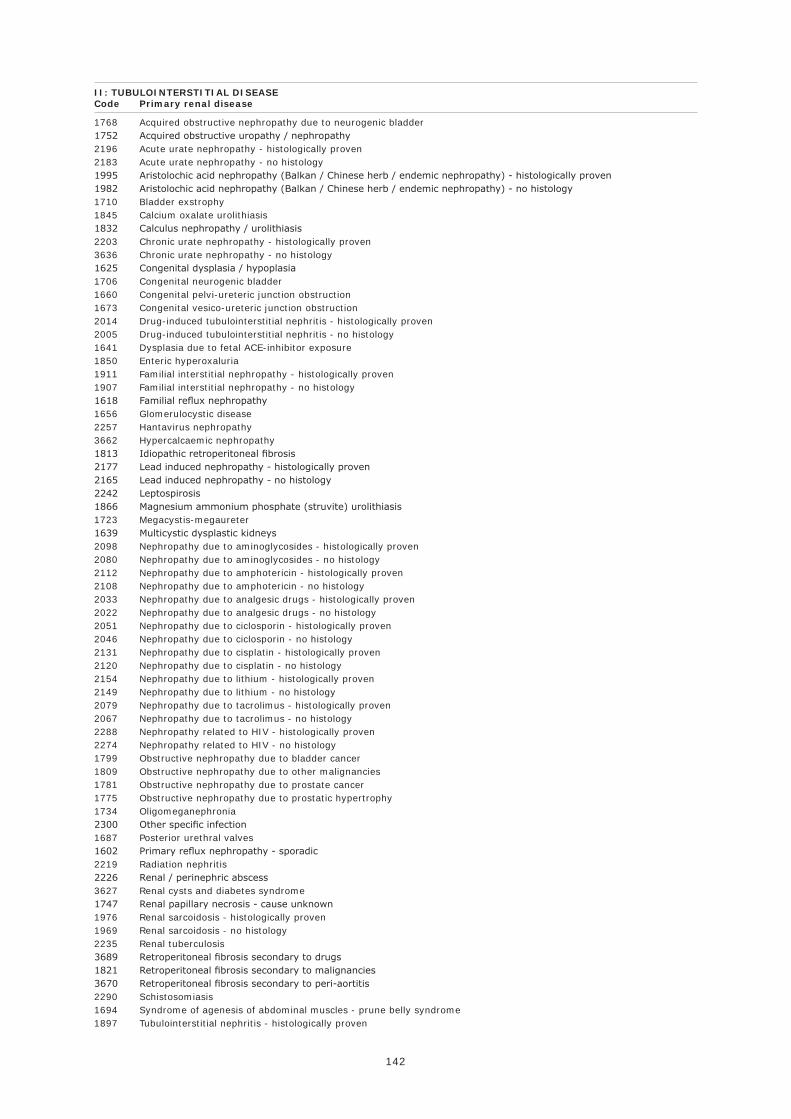
142
II: TUBULOINTERSTITIAL DISEASE Code Primary renal disease
1768 Acquired obstructive nephropathy due to neurogenic bladder1752 Acquired obstructive uropathy / nephropathy2196 Acute urate nephropathy - histologically proven2183 Acute urate nephropathy - no histology1995 Aristolochic acid nephropathy (Balkan / Chinese herb / endemic nephropathy) - histologically proven1982 Aristolochic acid nephropathy (Balkan / Chinese herb / endemic nephropathy) - no histology1710 Bladder exstrophy1845 Calcium oxalate urolithiasis1832 Calculus nephropathy / urolithiasis2203 Chronic urate nephropathy - histologically proven3636 Chronic urate nephropathy - no histology1625 Congenital dysplasia / hypoplasia1706 Congenital neurogenic bladder1660 Congenital pelvi-ureteric junction obstruction1673 Congenital vesico-ureteric junction obstruction2014 Drug-induced tubulointerstitial nephritis - histologically proven2005 Drug-induced tubulointerstitial nephritis - no histology1641 Dysplasia due to fetal ACE-inhibitor exposure1850 Enteric hyperoxaluria 1911 Familial interstitial nephropathy - histologically proven1907 Familial interstitial nephropathy - no histology1618 Familial reflux nephropathy1656 Glomerulocystic disease2257 Hantavirus nephropathy3662 Hypercalcaemic nephropathy 1813 Idiopathic retroperitoneal fibrosis2177 Lead induced nephropathy - histologically proven2165 Lead induced nephropathy - no histology2242 Leptospirosis1866 Magnesium ammonium phosphate (struvite) urolithiasis1723 Megacystis-megaureter1639 Multicystic dysplastic kidneys2098 Nephropathy due to aminoglycosides - histologically proven2080 Nephropathy due to aminoglycosides - no histology2112 Nephropathy due to amphotericin - histologically proven2108 Nephropathy due to amphotericin - no histology2033 Nephropathy due to analgesic drugs - histologically proven2022 Nephropathy due to analgesic drugs - no histology2051 Nephropathy due to ciclosporin - histologically proven2046 Nephropathy due to ciclosporin - no histology2131 Nephropathy due to cisplatin - histologically proven2120 Nephropathy due to cisplatin - no histology2154 Nephropathy due to lithium - histologically proven2149 Nephropathy due to lithium - no histology2079 Nephropathy due to tacrolimus - histologically proven2067 Nephropathy due to tacrolimus - no histology2288 Nephropathy related to HIV - histologically proven2274 Nephropathy related to HIV - no histology1799 Obstructive nephropathy due to bladder cancer1809 Obstructive nephropathy due to other malignancies1781 Obstructive nephropathy due to prostate cancer1775 Obstructive nephropathy due to prostatic hypertrophy1734 Oligomeganephronia2300 Other specific infection1687 Posterior urethral valves1602 Primary reflux nephropathy - sporadic2219 Radiation nephritis2226 Renal / perinephric abscess3627 Renal cysts and diabetes syndrome1747 Renal papillary necrosis - cause unknown1976 Renal sarcoidosis - histologically proven1969 Renal sarcoidosis - no histology2235 Renal tuberculosis3689 Retroperitoneal fibrosis secondary to drugs1821 Retroperitoneal fibrosis secondary to malignancies3670 Retroperitoneal fibrosis secondary to peri-aortitis2290 Schistosomiasis1694 Syndrome of agenesis of abdominal muscles - prune belly syndrome1897 Tubulointerstitial nephritis - histologically proven
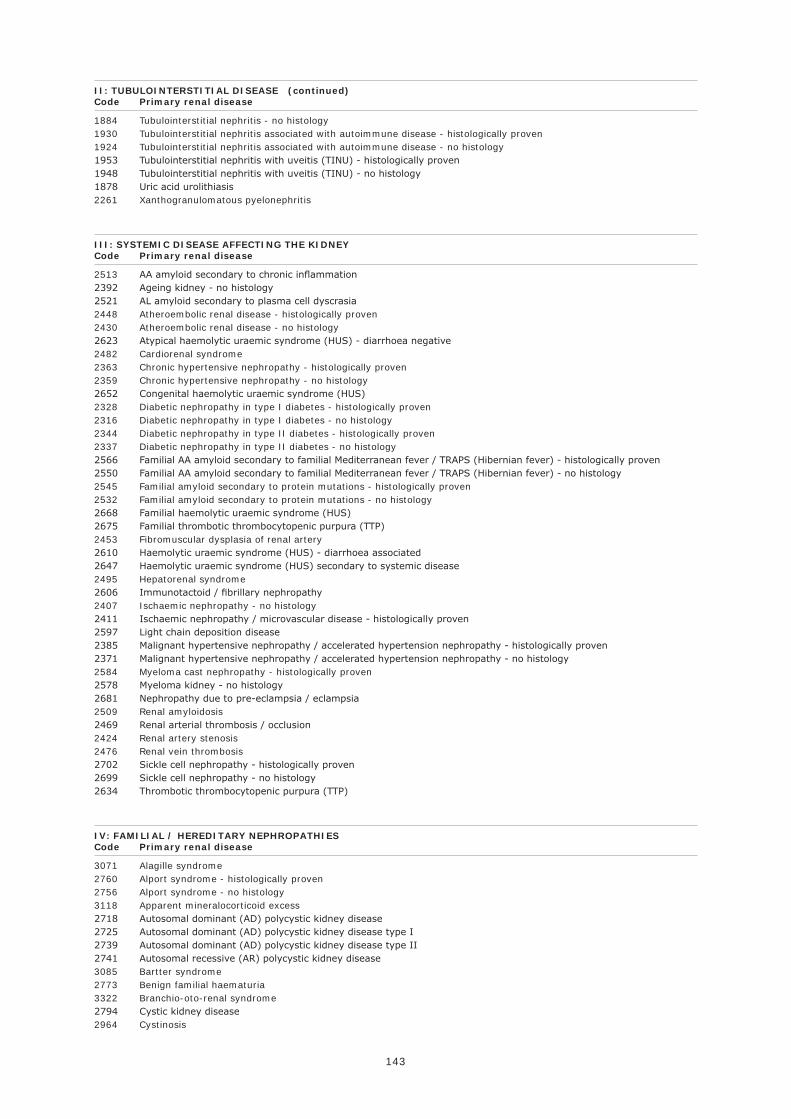
143
II: TUBULOINTERSTITIAL DISEASE (continued) Code Primary renal disease
1884 Tubulointerstitial nephritis - no histology1930 Tubulointerstitial nephritis associated with autoimmune disease - histologically proven1924 Tubulointerstitial nephritis associated with autoimmune disease - no histology1953 Tubulointerstitial nephritis with uveitis (TINU) - histologically proven1948 Tubulointerstitial nephritis with uveitis (TINU) - no histology1878 Uric acid urolithiasis2261 Xanthogranulomatous pyelonephritis
III: SYSTEMIC DISEASE AFFECTING THE KIDNEY Code Primary renal disease
2513 AA amyloid secondary to chronic inflammation2392 Ageing kidney - no histology2521 AL amyloid secondary to plasma cell dyscrasia2448 Atheroembolic renal disease - histologically proven2430 Atheroembolic renal disease - no histology2623 Atypical haemolytic uraemic syndrome (HUS) - diarrhoea negative2482 Cardiorenal syndrome2363 Chronic hypertensive nephropathy - histologically proven2359 Chronic hypertensive nephropathy - no histology2652 Congenital haemolytic uraemic syndrome (HUS) 2328 Diabetic nephropathy in type I diabetes - histologically proven2316 Diabetic nephropathy in type I diabetes - no histology2344 Diabetic nephropathy in type II diabetes - histologically proven2337 Diabetic nephropathy in type II diabetes - no histology2566 Familial AA amyloid secondary to familial Mediterranean fever / TRAPS (Hibernian fever) - histologically proven2550 Familial AA amyloid secondary to familial Mediterranean fever / TRAPS (Hibernian fever) - no histology2545 Familial amyloid secondary to protein mutations - histologically proven2532 Familial amyloid secondary to protein mutations - no histology2668 Familial haemolytic uraemic syndrome (HUS)2675 Familial thrombotic thrombocytopenic purpura (TTP)2453 Fibromuscular dysplasia of renal artery2610 Haemolytic uraemic syndrome (HUS) - diarrhoea associated2647 Haemolytic uraemic syndrome (HUS) secondary to systemic disease2495 Hepatorenal syndrome2606 Immunotactoid / fibrillary nephropathy2407 Ischaemic nephropathy - no histology2411 Ischaemic nephropathy / microvascular disease - histologically proven2597 Light chain deposition disease2385 Malignant hypertensive nephropathy / accelerated hypertension nephropathy - histologically proven2371 Malignant hypertensive nephropathy / accelerated hypertension nephropathy - no histology2584 Myeloma cast nephropathy - histologically proven2578 Myeloma kidney - no histology2681 Nephropathy due to pre-eclampsia / eclampsia2509 Renal amyloidosis2469 Renal arterial thrombosis / occlusion2424 Renal artery stenosis2476 Renal vein thrombosis2702 Sickle cell nephropathy - histologically proven2699 Sickle cell nephropathy - no histology2634 Thrombotic thrombocytopenic purpura (TTP)
IV: FAMILIAL / HEREDITARY NEPHROPATHIES Code Primary renal disease
3071 Alagille syndrome2760 Alport syndrome - histologically proven2756 Alport syndrome - no histology3118 Apparent mineralocorticoid excess2718 Autosomal dominant (AD) polycystic kidney disease2725 Autosomal dominant (AD) polycystic kidney disease type I2739 Autosomal dominant (AD) polycystic kidney disease type II2741 Autosomal recessive (AR) polycystic kidney disease3085 Bartter syndrome2773 Benign familial haematuria3322 Branchio-oto-renal syndrome2794 Cystic kidney disease2964 Cystinosis
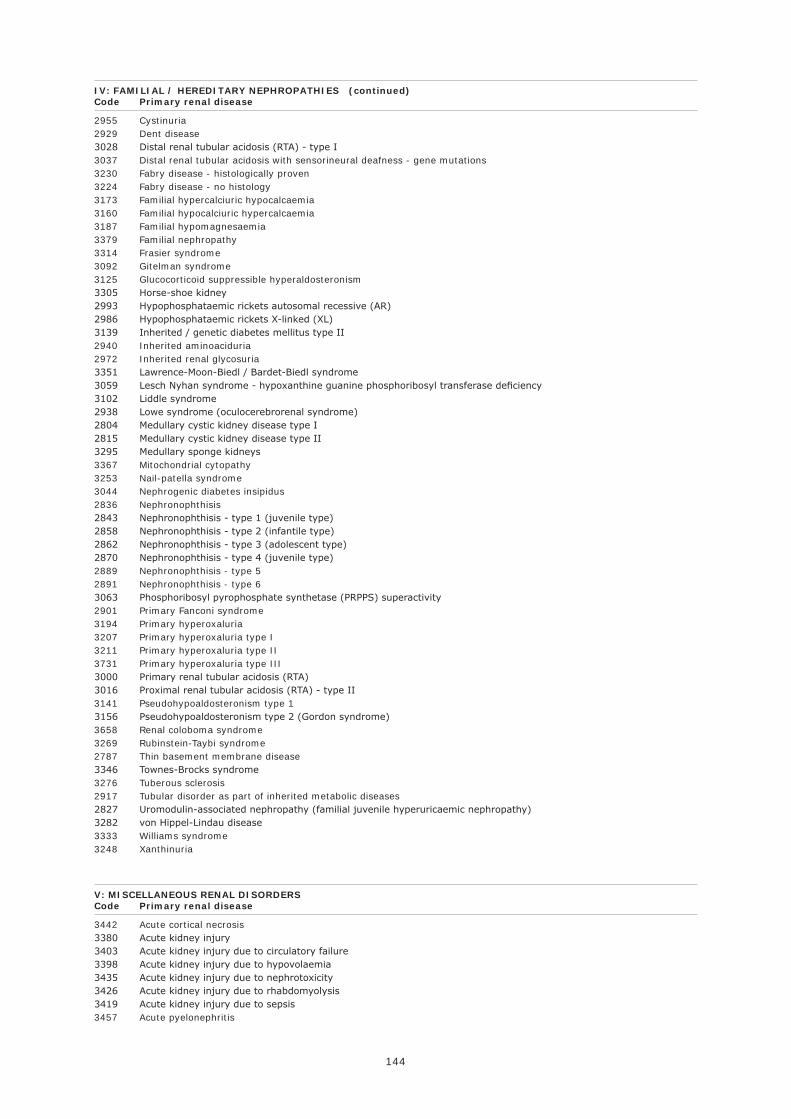
144
IV: FAMILIAL / HEREDITARY NEPHROPATHIES (continued) Code Primary renal disease
2955 Cystinuria2929 Dent disease3028 Distal renal tubular acidosis (RTA) - type I3037 Distal renal tubular acidosis with sensorineural deafness - gene mutations3230 Fabry disease - histologically proven3224 Fabry disease - no histology3173 Familial hypercalciuric hypocalcaemia3160 Familial hypocalciuric hypercalcaemia3187 Familial hypomagnesaemia3379 Familial nephropathy3314 Frasier syndrome3092 Gitelman syndrome3125 Glucocorticoid suppressible hyperaldosteronism3305 Horse-shoe kidney2993 Hypophosphataemic rickets autosomal recessive (AR)2986 Hypophosphataemic rickets X-linked (XL)3139 Inherited / genetic diabetes mellitus type II2940 Inherited aminoaciduria2972 Inherited renal glycosuria3351 Lawrence-Moon-Biedl / Bardet-Biedl syndrome3059 Lesch Nyhan syndrome - hypoxanthine guanine phosphoribosyl transferase deficiency 3102 Liddle syndrome2938 Lowe syndrome (oculocerebrorenal syndrome)2804 Medullary cystic kidney disease type I2815 Medullary cystic kidney disease type II3295 Medullary sponge kidneys3367 Mitochondrial cytopathy3253 Nail-patella syndrome3044 Nephrogenic diabetes insipidus2836 Nephronophthisis2843 Nephronophthisis - type 1 (juvenile type)2858 Nephronophthisis - type 2 (infantile type)2862 Nephronophthisis - type 3 (adolescent type)2870 Nephronophthisis - type 4 (juvenile type)2889 Nephronophthisis - type 52891 Nephronophthisis - type 63063 Phosphoribosyl pyrophosphate synthetase (PRPPS) superactivity2901 Primary Fanconi syndrome3194 Primary hyperoxaluria3207 Primary hyperoxaluria type I3211 Primary hyperoxaluria type II3731 Primary hyperoxaluria type III3000 Primary renal tubular acidosis (RTA)3016 Proximal renal tubular acidosis (RTA) - type II3141 Pseudohypoaldosteronism type 13156 Pseudohypoaldosteronism type 2 (Gordon syndrome)3658 Renal coloboma syndrome3269 Rubinstein-Taybi syndrome2787 Thin basement membrane disease3346 Townes-Brocks syndrome3276 Tuberous sclerosis2917 Tubular disorder as part of inherited metabolic diseases2827 Uromodulin-associated nephropathy (familial juvenile hyperuricaemic nephropathy)3282 von Hippel-Lindau disease3333 Williams syndrome3248 Xanthinuria
V: MISCELLANEOUS RENAL DISORDERS Code Primary renal disease
3442 Acute cortical necrosis3380 Acute kidney injury3403 Acute kidney injury due to circulatory failure3398 Acute kidney injury due to hypovolaemia 3435 Acute kidney injury due to nephrotoxicity3426 Acute kidney injury due to rhabdomyolysis3419 Acute kidney injury due to sepsis3457 Acute pyelonephritis
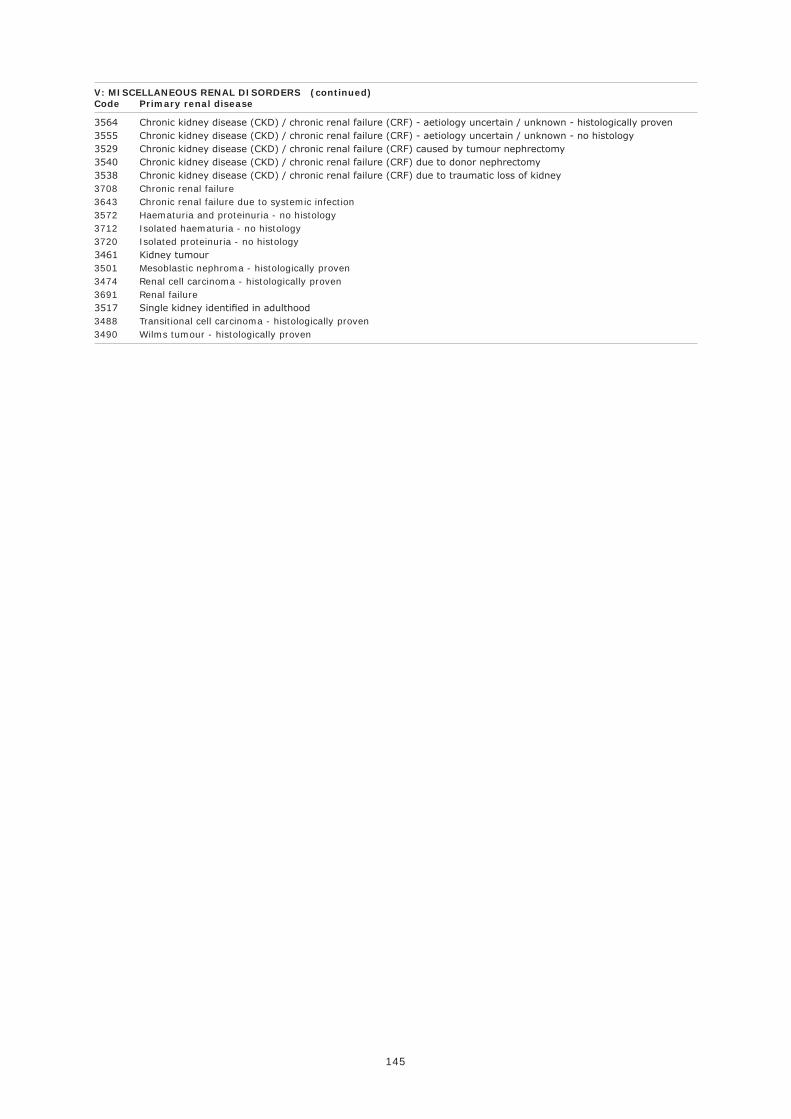
145
V: MISCELLANEOUS RENAL DISORDERS (continued) Code Primary renal disease
3564 Chronic kidney disease (CKD) / chronic renal failure (CRF) - aetiology uncertain / unknown - histologically proven3555 Chronic kidney disease (CKD) / chronic renal failure (CRF) - aetiology uncertain / unknown - no histology3529 Chronic kidney disease (CKD) / chronic renal failure (CRF) caused by tumour nephrectomy3540 Chronic kidney disease (CKD) / chronic renal failure (CRF) due to donor nephrectomy3538 Chronic kidney disease (CKD) / chronic renal failure (CRF) due to traumatic loss of kidney3708 Chronic renal failure3643 Chronic renal failure due to systemic infection3572 Haematuria and proteinuria - no histology3712 Isolated haematuria - no histology3720 Isolated proteinuria - no histology3461 Kidney tumour3501 Mesoblastic nephroma - histologically proven3474 Renal cell carcinoma - histologically proven3691 Renal failure3517 Single kidney identified in adulthood3488 Transitional cell carcinoma - histologically proven3490 Wilms tumour - histologically proven
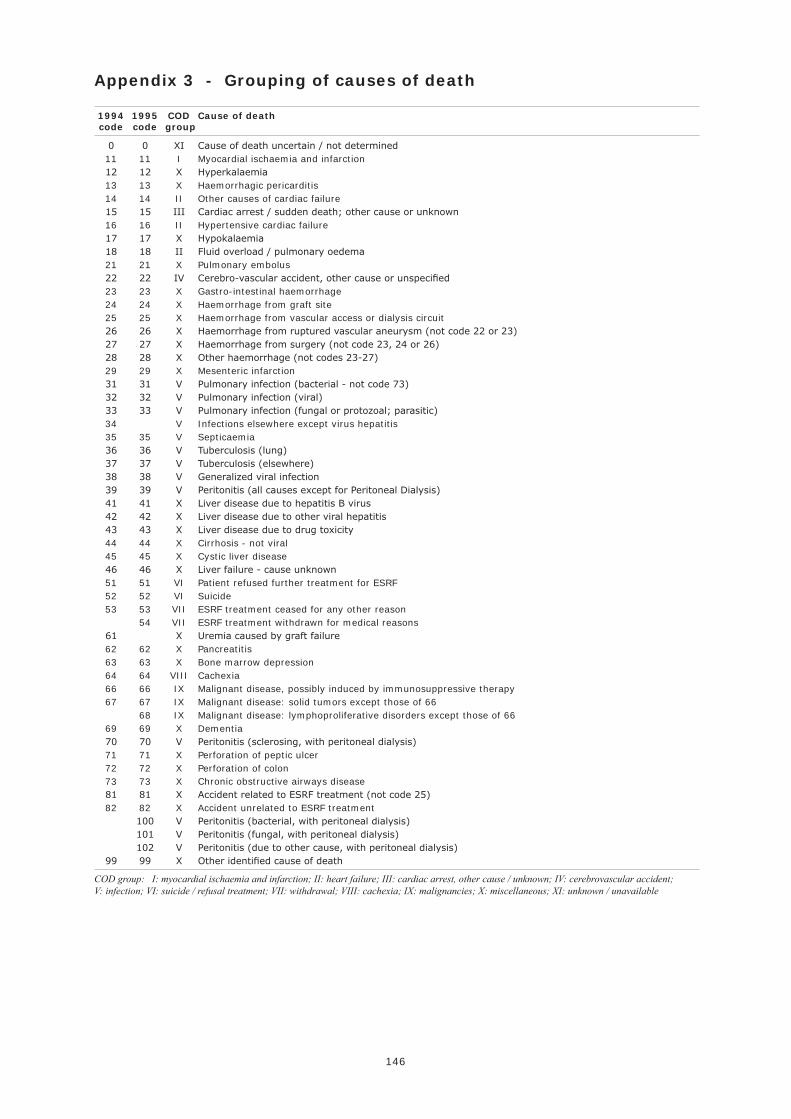
146
Appendix 3 - Grouping of causes of death
1994 1995 COD Cause of death code code group
0 0 XI Cause of death uncertain / not determined 11 11 I Myocardial ischaemia and infarction 12 12 X Hyperkalaemia 13 13 X Haemorrhagic pericarditis 14 14 II Other causes of cardiac failure 15 15 III Cardiac arrest / sudden death; other cause or unknown 16 16 II Hypertensive cardiac failure 17 17 X Hypokalaemia 18 18 II Fluid overload / pulmonary oedema 21 21 X Pulmonary embolus 22 22 IV Cerebro-vascular accident, other cause or unspecified 23 23 X Gastro-intestinal haemorrhage 24 24 X Haemorrhage from graft site 25 25 X Haemorrhage from vascular access or dialysis circuit 26 26 X Haemorrhage from ruptured vascular aneurysm (not code 22 or 23) 27 27 X Haemorrhage from surgery (not code 23, 24 or 26) 28 28 X Other haemorrhage (not codes 23-27) 29 29 X Mesenteric infarction 31 31 V Pulmonary infection (bacterial - not code 73) 32 32 V Pulmonary infection (viral) 33 33 V Pulmonary infection (fungal or protozoal; parasitic) 34 V Infections elsewhere except virus hepatitis 35 35 V Septicaemia 36 36 V Tuberculosis (lung) 37 37 V Tuberculosis (elsewhere) 38 38 V Generalized viral infection 39 39 V Peritonitis (all causes except for Peritoneal Dialysis) 41 41 X Liver disease due to hepatitis B virus 42 42 X Liver disease due to other viral hepatitis 43 43 X Liver disease due to drug toxicity 44 44 X Cirrhosis - not viral 45 45 X Cystic liver disease 46 46 X Liver failure - cause unknown 51 51 VI Patient refused further treatment for ESRF 52 52 VI Suicide 53 53 VII ESRF treatment ceased for any other reason 54 VII ESRF treatment withdrawn for medical reasons 61 X Uremia caused by graft failure 62 62 X Pancreatitis 63 63 X Bone marrow depression 64 64 VIII Cachexia 66 66 IX Malignant disease, possibly induced by immunosuppressive therapy 67 67 IX Malignant disease: solid tumors except those of 66 68 IX Malignant disease: lymphoproliferative disorders except those of 66 69 69 X Dementia 70 70 V Peritonitis (sclerosing, with peritoneal dialysis) 71 71 X Perforation of peptic ulcer 72 72 X Perforation of colon 73 73 X Chronic obstructive airways disease 81 81 X Accident related to ESRF treatment (not code 25) 82 82 X Accident unrelated to ESRF treatment 100 V Peritonitis (bacterial, with peritoneal dialysis) 101 V Peritonitis (fungal, with peritoneal dialysis) 102 V Peritonitis (due to other cause, with peritoneal dialysis) 99 99 X Other identified cause of death
COD group: I: myocardial ischaemia and infarction; II: heart failure; III: cardiac arrest, other cause / unknown; IV: cerebrovascular accident;V: infection; VI: suicide / refusal treatment; VII: withdrawal; VIII: cachexia; IX: malignancies; X: miscellaneous; XI: unknown / unavailable
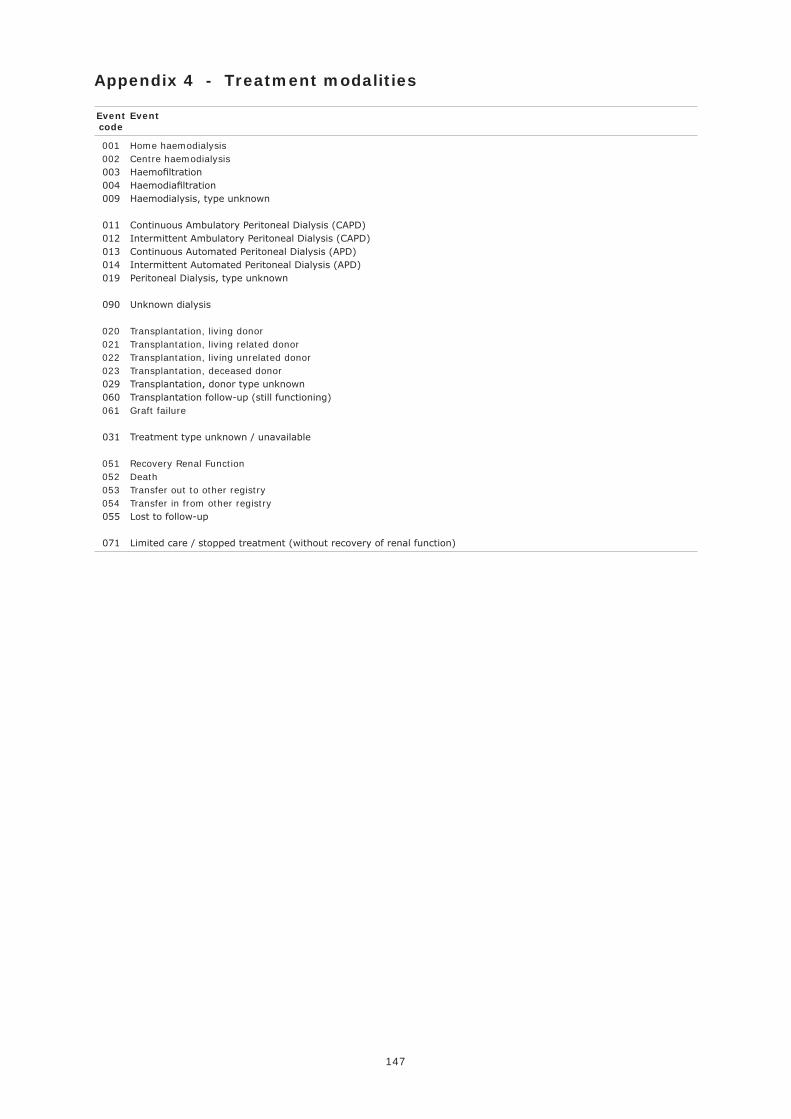
147
Appendix 4 - Treatment modalities
Event Event code
001 Home haemodialysis 002 Centre haemodialysis 003 Haemofiltration 004 Haemodiafiltration 009 Haemodialysis, type unknown
011 Continuous Ambulatory Peritoneal Dialysis (CAPD) 012 Intermittent Ambulatory Peritoneal Dialysis (CAPD) 013 Continuous Automated Peritoneal Dialysis (APD) 014 Intermittent Automated Peritoneal Dialysis (APD) 019 Peritoneal Dialysis, type unknown
090 Unknown dialysis 020 Transplantation, living donor 021 Transplantation, living related donor 022 Transplantation, living unrelated donor 023 Transplantation, deceased donor 029 Transplantation, donor type unknown 060 Transplantation follow-up (still functioning) 061 Graft failure 031 Treatment type unknown / unavailable 051 Recovery Renal Function 052 Death 053 Transfer out to other registry 054 Transfer in from other registry 055 Lost to follow-up
071 Limited care / stopped treatment (without recovery of renal function)
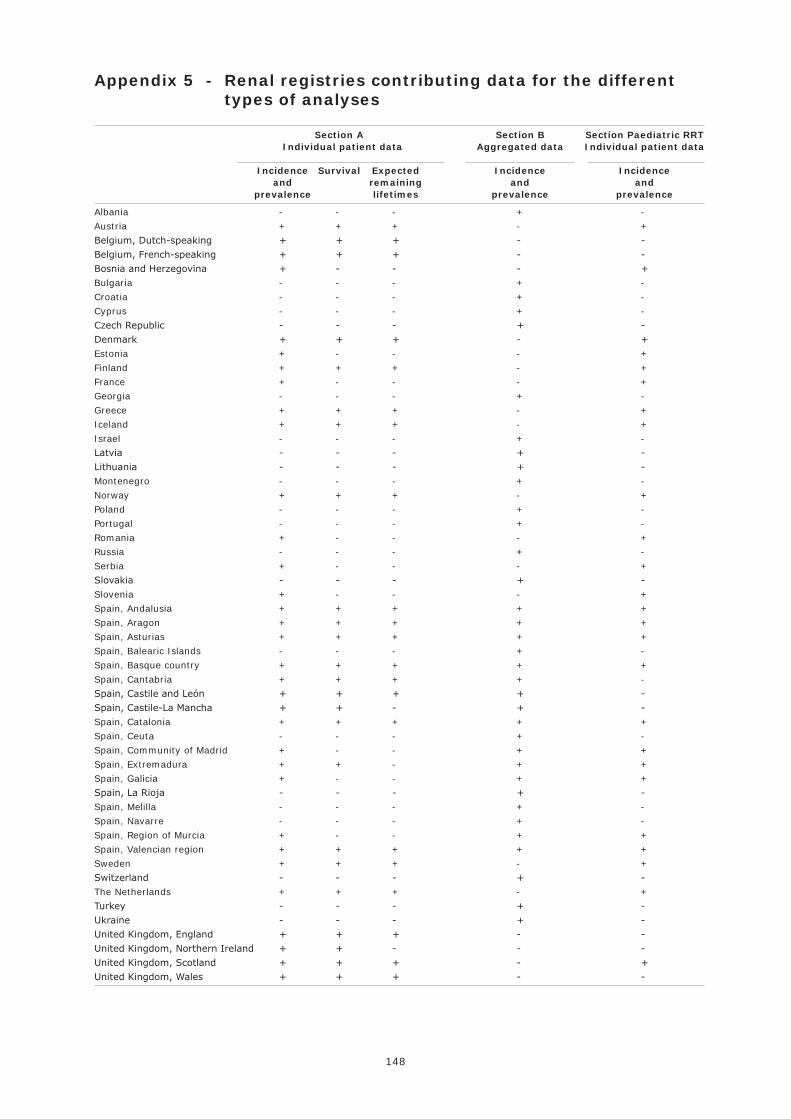
148
Appendix 5 - Renal registries contributing data for the different types of analyses
Section A Section B Section Paediatric RRT Individual patient data Aggregated data Individual patient data
Incidence Survival Expected Incidence Incidence and remaining and and prevalence lifetimes prevalence prevalence
Albania - - - + -
Austria + + + - +
Belgium, Dutch-speaking + + + - -
Belgium, French-speaking + + + - -
Bosnia and Herzegovina + - - - +
Bulgaria - - - + -
Croatia - - - + -
Cyprus - - - + -
Czech Republic - - - + -
Denmark + + + - +
Estonia + - - - +
Finland + + + - +
France + - - - +
Georgia - - - + -
Greece + + + - +
Iceland + + + - +
Israel - - - + -
Latvia - - - + -
Lithuania - - - + -
Montenegro - - - + -
Norway + + + - +
Poland - - - + -
Portugal - - - + -
Romania + - - - +
Russia - - - + -
Serbia + - - - +
Slovakia - - - + -
Slovenia + - - - +
Spain, Andalusia + + + + +
Spain, Aragon + + + + +
Spain, Asturias + + + + +
Spain, Balearic Islands - - - + -
Spain, Basque country + + + + +
Spain, Cantabria + + + + -
Spain, Castile and León + + + + -
Spain, Castile-La Mancha + + - + -
Spain, Catalonia + + + + +
Spain, Ceuta - - - + -
Spain, Community of Madrid + - - + +
Spain, Extremadura + + - + +
Spain, Galicia + - - + +
Spain, La Rioja - - - + -
Spain, Melilla - - - + -
Spain, Navarre - - - + -
Spain, Region of Murcia + - - + +
Spain, Valencian region + + + + +
Sweden + + + - +
Switzerland - - - + -
The Netherlands + + + - +
Turkey - - - + -
Ukraine - - - + -
United Kingdom, England + + + - -
United Kingdom, Northern Ireland + + - - -
United Kingdom, Scotland + + + - +
United Kingdom, Wales + + + - -

ERA-EDTA RegistryAcademic Medical CenterDepartment of Medical InformaticsPO Box 227001100 DE AmsterdamThe Netherlands
ISBN 978-90-817480-5-6
June 2015
Annual Report 2013
ERA-ED
TA Registry
AnnualReport
2013
ERA-EDTA Registry
www.era-edta-reg.org