Embed Size (px)
Citation preview
8/6/2019 Metals and Metal Lo Ids
http://slidepdf.com/reader/full/metals-and-metal-lo-ids 1/139
Metals and Metalloids
Department for Environment, Food and Rural Affairs,
Scottish Executive, National Assembly of Wales,
Department of the Environment in Northern Ireland
Expert Panel onAir Quality Standards
8/6/2019 Metals and Metal Lo Ids
http://slidepdf.com/reader/full/metals-and-metal-lo-ids 2/139
Department for Environment, Food and Rural Affairs
Nobel House
17 Smith Square
London SW1P 3JR
Telephone: 020 7238 6000
Website: www.defra.gov.uk
© Crown copyright 2009
Any queries relating to the copyright in this document should be addressed to
The Licensing Division, HMSO, St Clements House, 2-16 Colegate, Norwich, NR3 1BQ.
Fax 01603 7233000 or email [email protected]
The text in this document (excluding the Royal Arms and departmental logos) may be
reproduced free of charge in any format or medium provided that it is reproduced accurately
and not used in a misleading context. The material must me acknowledged as Crown
copyright and the title of the document specified.
Further copies of this publication are available from:
Defra Publications
Admail 6000London
SW1A 2XX
Tel: 08459 556000
This document is also available on the Defra website
Published by the Department for Environment, Food and Rural Affairs. Printed in the UK,
May 2009, on material that contains 100% recycled fibre for uncoated paper and a
minimum of 75% recycled fibre for coated paper.
Product code PB13263
8/6/2019 Metals and Metal Lo Ids
http://slidepdf.com/reader/full/metals-and-metal-lo-ids 3/139
i
Department for Environment, Food and Rural Affairs,
Scottish Executive, National Assembly of Wales,
Department of the Environment in Northern Ireland
Expert Panel on Air QualityStandards
Guidelines for metalsand metalloids in
ambient air for theprotection of humanhealth
i
8/6/2019 Metals and Metal Lo Ids
http://slidepdf.com/reader/full/metals-and-metal-lo-ids 4/139
ii
Previous reports by the Expert Panel on Air Quality Standards (available on
http://www.defra.gov.uk/environment/airquality/aqs/index.htm)
1st report Benzene February 1994 ISBN 011 752859 5
2nd report Ozone May 1994 ISBN 011 752873 03rd report 1,3-Butadiene December 1994 ISBN 011 753034 4
4th report Carbon Monoxide December 1994 ISBN 011 753035 2
5th report Sulphur Dioxide September 1995 ISBN 011 753135 9
6th report Particles November 1995 ISBN 011 753199 5
7th report Nitrogen Dioxide December 1996 ISBN 011 753352 1
8th report Lead May 1998 ISBN 011 753447 1
9th report Polycyclic Aromatic July 1999 ISBN 011 753503 6
Hydrocarbons
10th report Airborne Particles April 2001 ISBN 011 753599 011th report Second Report on 1, February 2002 ISBN 0 85521 010 9
3-Butadiene
12th report Halogens and January 2006 ISBN 0 85521 169 5
Hydrogen Halides
13th report Addendum to May 2009 ISBN 978-085521-185-1
Halogens and Hydrogen
Halides Report
United Kingdom air quality information received from the automatic
monitoring sites and forecasts may be accessed via the following media:
Freephone Helpline 0800 556677
TELETEXT page 156
Internet http://www.airquality.co.uk
http://www.defra.gov.uk/environment/airquality/
The cover photograph is reproduced by kind permission of Professor
Stephen Holgate
8/6/2019 Metals and Metal Lo Ids
http://slidepdf.com/reader/full/metals-and-metal-lo-ids 5/139
iii
Contents
Contents iii
Terms of Reference vii
Membership of the Panel viii
Chairman viii
Members viii
Observers ix
Assessors ix
Secretariat x
Acknowledgments xii
Summary of recommendations xiii
1 Introduction 1
1.1 Background to the report 1
1.2 General issues 2
1.2.1 Approaches to setting standards 2
1.2.2 Additional uncertainties 41.2.3 Exposure to multiple pollutants 4
1.2.4 Susceptible and vulnerable groups 6
1.2.5 Units of concentration and choice of averaging times 7
1.2.6 Development of the report 9
1.3 How the Environment Agencies will use the guideline values 9
1.4 Introduction to the metals and metalloids 11
1.4.1 Physio chemical characteristics 11
1.4.2 Key human health effects and their influence on
safety factors 121.4.2.1 Lung cancer 12
1.4.2.2 Irritation/inflammation 13
1.4.2.3 Hypersensitivity 14
References 15
8/6/2019 Metals and Metal Lo Ids
http://slidepdf.com/reader/full/metals-and-metal-lo-ids 6/139
iv
2 Arsenic 17
2.1 Background 17
2.1.1 Basic chemical information 17
2.1.2 Sources of arsenic in the UK atmosphere 18
2.1.3 Ambient concentrations 19
2.1.4 Human exposures 20
2.2 Animal toxicology 21
2.2.1 Pulmonary absorption 21
2.2.2 Metabolism 21
2.2.3 Tissue distribution and excretion 23
2.3 Health effects 23
2.3.1 Acute effects 23
2.3.1.1 Animals 23
2.3.1.2 Humans 242.3.2 Chronic effects 25
2.3.2.1 Animals 25
2.3.2.2 Humans 25
2.3.3 Genotoxic and carcinogenic effects 26
2.3.3.1 Animals 26
2.3.3.2 Humans 27
2.3.4 Reproductive and developmental toxicity 28
2.4 Evaluations and recommendations by other organisations 29
2.5 Justification for air quality guideline 302.6 Recommendation 32
References 32
3 Nickel 39
3.1 Background 39
3.1.1 Basic chemical information 39
3.1.2 Sources of nickel in the UK atmosphere 40
3.1.3 Ambient concentrations 41
3.1.4 Human exposures 423.2 Absorption and excretion 43
3.2.1 Pulmonary absorption 43
3.2.2 Metabolism 43
3.2.3 Tissue distribution and excretion 44
3.3 Health effects/Toxicology 44
3.3.1 Acute and chronic effects 44
3.3.1.1 Hypersensitivity 45
3.3.1.2 Mechanism(s) of acute toxicity 45
3.3.2 Genotoxicity 48
3.3.3 Carcinogenicity 48
3.3.3.1 Animal studies 48
3.3.3.2 Human studies 49
3.3.4 Reproductive and developmental toxicity 49
3.4 Evaluations and recommendations by other organisations 50
8/6/2019 Metals and Metal Lo Ids
http://slidepdf.com/reader/full/metals-and-metal-lo-ids 7/139
v
3.5 Justification for air quality guideline 52
3.6 Recommendation 54
References 54
4 Beryllium 63
4.1 Background 63
4.1.1 Basic chemical information 63
4.1.2 Sources and concentrations of beryllium in the
UK atmosphere 64
4.1.3 Human exposures 65
4.2 Toxicokinetics 66
4.2.1 Absorption 66
4.2.2 Distribution 67
4.2.3 Metabolism 674.2.4 Elimination 67
4.3 Health effects 68
4.3.1 Acute health effects 68
4.3.2 Sub-chronic effects – beryllium sensitisation 68
4.3.3 Chronic effects 69
4.3.4 Genotoxicity 71
4.3.5 Carcinogenicity 71
4.3.6 Reproductive and development toxicity 73
4.4. Evaluations and recommendations by other organisations 734.4.1 Chronic beryllium disease 73
4.4.2 Lung cancer 75
4.5. Justification for air quality guideline 75
4.6. Recommendation 76
References 76
5 Chromium 83
5.1 Background 83
5.1.1 Basic chemical information 835.1.2 Sources of chromium in the UK atmosphere 84
5.1.3 Ambient concentrations 84
5.1.4 Human exposures 86
5.2 Toxicology 87
5.2.1 Pulmonary absorption 87
5.2.2 Metabolism 88
5.2.3 Tissue distribution and excretion 89
5.3 Health effects 89
5.3.1 Acute effects 89
5.3.1.1 Animal studies 89
5.3.1.2 Human studies 90
5.3.2 Chronic and sub chronic effects 90
5.3.2.1 Animal studies 90
5.3.2.2 Non malignant effects 90
8/6/2019 Metals and Metal Lo Ids
http://slidepdf.com/reader/full/metals-and-metal-lo-ids 8/139
vi
5.3.3 Genotoxicity 92
5.3.3.1 in vitro studies 92
5.3.3.2 animal/bacterial studies 92
5.3.4 Malignant effects 92
5.3.4.1 animal studies 92
5.3.4.2 human studies 93
5.3.5 Reproductive and developmental toxicity 94
5.4 Evaluations and recommendations by other organisations 94
5.5 Justification for air quality guideline 97
5.5.1 Sensitivity to the method of derivation 98
5.6 Recommendation 99
References 99
Abbreviations 107
Glossary 109
Appendix 1 117
8/6/2019 Metals and Metal Lo Ids
http://slidepdf.com/reader/full/metals-and-metal-lo-ids 9/139
vii
Terms of Reference
The Expert Panel on Air Quality Standards was established in 1991.
The terms of reference of the Panel are:
“To advise the Secretary of State for Environment, Food and Rural Affairs,Scottish Ministers, the National Assembly for Wales and the Department of
the Environment (Northern Ireland) as required, on non-occupational
ambient air quality standards, with particular reference to the levels of
airborne pollutants at which no or minimal effects on human health are likely
to occur;
i. taking account of the best available evidence of the effects of air pollution
on human health and of progressive development of the air quality
monitoring network; but
ii. without reference to the practicality of abatement or mitigation measures,
the economic costs and economic benefits of pollution control measures or
other factors pertinent to the management rather than the assessment of risk;
Where appropriate, for example for pollutants where no threshold for adverse
effects can be determined, the Panel may wish to recommend exposure-
response relationships or other information Government might use to setpolicy objectives.
to identify gaps in the knowledge needed for standard setting and suggest
potential priority areas for future research;
to advise on other aspects of air quality and air pollution referred to it;
for the purpose of informing the development of policy on the improvement
of air quality and increasing public knowledge and understanding of airquality issues.”
EPAQS does not give approval for products or equipment.
8/6/2019 Metals and Metal Lo Ids
http://slidepdf.com/reader/full/metals-and-metal-lo-ids 10/139
viii
Membership of the Panel
Chairman
Professor Stephen Holgate BSc, MD, DSc, FRCP, FRCPath, FRCPE,FIBiol, FmedSci, FRSA
University of Southampton
Members
Professor H Ross Anderson MD, MSc, FFPH, FRCP, FmedSCI
St George’s, University of London
Dr Peter Baxter MD, MSc, FRCP, FFOM
University of Cambridge
Dr Paul Cullinan MD, MSc, FRCP, FFOM
Imperial College (National Heart and Lung Institute)
Professor Dick Derwent OBE, MA, PhD
rdscientific
Dr Jonathan Grigg BSc, MD, MRCP, FRCPCH
Barts and the London School of Medicine and Dentistry
Professor Roy Harrison OBE, BSc, PhD, DSc, FRSC, CChem, FRMetS,
Hon MFPH, Hon FFOM
University of Birmingham
Professor Frank J Kelly BSc, PhD
King’s College London
Dr Geoffrey H Pigott BSc, PhD
AH Marks & Co Ltd
8/6/2019 Metals and Metal Lo Ids
http://slidepdf.com/reader/full/metals-and-metal-lo-ids 11/139
ix
Dr Alison Searl BSc, MSc, PhD
Institute of Occupational Medicine, Edinburgh
Mr John Stedman BA
NETCEN (part of AEA Technology plc)
Ex officio member – Chairman of the Committee on the Medical Effects of
Air Pollutants
Professor Jonathan G Ayres BSc, MB BS, MD, FRCP, FRCPE, FFOM
University of Aberdeen
Ex officio members – Committee on Carcinogenicity of Chemicals in Food,
Consumer Products and the Environment
Professor Peter Blain PhDNewcastle University
Lay member
Ms Ann Davison BA
Observers
Mrs Elanor Ball BSc, MSc
Health and Safety Executive
Ms Joan Forteath BEng, MSc, MPhil
Scottish Environment Protection Agency
Mr Colin Gillespie
Scottish Environment Protection Agency
Dr Colin Powlesland BSc, MSc, PhDEnvironment Agency
Assessors
Mr Ross Hunter
Welsh Assembly Government
Mr Barry McAuley
Department of the Environment in Northern Ireland
Dr Geeta Wonnacott
Scottish Executive
8/6/2019 Metals and Metal Lo Ids
http://slidepdf.com/reader/full/metals-and-metal-lo-ids 12/139
x
Secretariat
Dr Clare Bayley MChem, PhD
Department for Environment, Food and Rural Affairs
Ms Ingrid Holmes BSc, MSc
Department for Environment, Food and Rural Affairs
Dr Sarah Honour BSc, MSc, PhD
Department for Environment, Food and Rural Affairs
Professor Robert L Maynard CBE, BSc, MB, BCh, MRCP, FRCPath,
FFOM
Department of Health
Dr Martin Meadows BSc, PhD, Cbiol, MIBiol
Department for Environment, Food and Rural Affairs
Dr Heather Walton BSc, Dphil
Department of Health
Dr Martin Williams BSc, PhD, FRSA
Department for Environment, Food and Rural Affairs
Mr Tim Williamson BSc, MSc, MIScienv
Department for Environment, Food and Rural Affairs
Ms Rachel Yardley, BSc
AEA

8/6/2019 Metals and Metal Lo Ids
http://slidepdf.com/reader/full/metals-and-metal-lo-ids 13/139
xi
8/6/2019 Metals and Metal Lo Ids
http://slidepdf.com/reader/full/metals-and-metal-lo-ids 14/139
xii
Acknowledgments
We thank the following individuals for their help:
Professor Lee Newman, University of Colorado, for his help on beryllium
8/6/2019 Metals and Metal Lo Ids
http://slidepdf.com/reader/full/metals-and-metal-lo-ids 15/139
xiii
Summary of Recommendations
The Expert Panel on Air Quality Standards has considered arsenic, nickel,
beryllium and chromium to set air quality guideline values based on the
available published literature. For each we describe the physicochemical,
properties of each of these, sources in the UK atmosphere, ambientconcentrations, human exposures, metabolism and human and animal health
effects. We also looked at evaluations and recommendations by other
organisations, justification for an air quality guideline and concluded with
our recommendations which are summarised below:
• Arsenic – 3 ng/m3 total inorganic arsenic in the PM10 fraction, as an
annual mean.
• Nickel – 20ng/m3 total nickel compounds in the PM10 fraction, as an
annual mean.
• Beryllium – 0.2 ng/m3 total beryllium in the PM10 fraction, as an
annual average.
• Chromium – 0.2ng/m3 in the Cr(VI) oxidation state in the PM10 as an
annual average.

8/6/2019 Metals and Metal Lo Ids
http://slidepdf.com/reader/full/metals-and-metal-lo-ids 16/139
xiv
8/6/2019 Metals and Metal Lo Ids
http://slidepdf.com/reader/full/metals-and-metal-lo-ids 17/139
1
Chapter 1
Introduction
1.1 Background to the report
1. This is the second report by the Expert Panel on Air Quality Standards
(EPAQS) as part of a work programme in which the Panel is advising
the Environment Agency (EA) on some of the priority substances that
it is responsible for regulating. These reports differ from previous
EPAQS reports in that the guideline values they recommend are not
intended for use in national air pollutant standard setting.
2. In the past, EPAQS has made recommendations to Government onnon-occupational ambient air quality standards for pollutants of
national occurrence and importance. Pollutants considered under this
new work programme warrant special consideration for their emissions
from a small number of point industrial sources and the guideline
values are intended to protect local populations around these sites.
3. These guideline values represent a level in ambient air at which no or
minimal effects on human health are likely to occur. They are intended
for use in the risk assessment of emissions arising from normaloperating conditions. Separate guidelines are in place to deal with large
releases during chemical incidents. Further information on the control
and assessment of major accidental releases can be found on the Health
and Safety Executive website at http://www.hse.gov.uk/hid/index.htm.
4. In this report EPAQS recommend guideline values for arsenic,
beryllium, chromium and nickel. In the environment chromium can
occur in two forms, known as chromium (III) and chromium (VI) and
it is chromium (VI) that is most toxic and is of concern here. Thesemetals are all human or suspected human carcinogens and have been
shown to affect human health through the inhalation route. They are
also amongst the substances most frequently encountered by the EA
when determining permits for major industrial activities.
5. The World Health Organisation (WHO) have proposed unit risk
coefficients for all these substances except beryllium. Indeed there are
8/6/2019 Metals and Metal Lo Ids
http://slidepdf.com/reader/full/metals-and-metal-lo-ids 18/139
2
Expert Panel on Air Quality Standards
no national or internationally recognised air quality standards for
beryllium. In the past the EA has not used air quality standards derived
from unit risk coefficients such as those proposed by the WHO because
of the inherent uncertainty involved in extrapolating from observed
effects at high levels of exposure to responses at the much lower
concentrations commonly associated with environmental exposure.
6. The 4th Air Quality Daughter Directive2 sets target (non-mandatory) air
quality standards for arsenic and nickel to be met by 31st December 2012.
However, these target values have been through a process of decision
making between member states and it is not clear to what extent they
represent a level at which no or minimal effects on human health are
likely to occur. In the light of these uncertainties EPAQS were asked to
consider setting air quality guideline values for these four metals.
1.2 General issues
1.2.1 Approaches to setting standards
7. The section below outlines the general approach taken by EPAQS
when setting standards. It is intended only as a summary. The EPAQS
has published a more detailed paper on the standards setting process
on its website and the reader is referred to this document (EPAQS,
2003) and to Appendix 1 of this report for more detail.
8. The EPAQS is asked to recommend standards for air pollutants in
ambient air that, if met, would be expected to protect the great
majority of exposed individuals from adverse effects. Ideally anybody
exposed, even for a long period, to air containing pollutants at or
below the levels recommended by the standards should be completely
protected, i.e., should not experience any ill effects to their health. Sucha high level of protection is, in practice, difficult to provide. People
vary in their sensitivity to air pollutants: some individuals are
particularly sensitive and only very low levels of pollutants would be
entirely without effect on them (see Section 1.2.4 for a discussion of
susceptible groups).
9. For most substances a standard is set by first identifying a level of
exposure at which no adverse health effects have been identified. This
is termed a no observed adverse effects level or NOAEL. In caseswhere there is insufficient data to set a NOAEL, a lowest observed
adverse effects level (LOAEL) can be identified instead and a safety
factor applied to account for the additional uncertainty in using this as
a starting point.
2 Directive 2004/107/EC relating to arsenic, cadmium, mercury, nickel and polycyclic
aromatic hydrocarbons in ambient air. Official Journal of the European Union L23/3
– 16. 26.1.2005.
8/6/2019 Metals and Metal Lo Ids
http://slidepdf.com/reader/full/metals-and-metal-lo-ids 19/139
3
Introduction
10. Once a NOAEL (or LOAEL) has been identified, safety factors,
also termed uncertainty factors, are used to account for inter species
differences and susceptible groups in humans in the data from which
the air quality standard or guideline is set. These provide a margin of
safety between the NOAEL / LOAEL derived from measurements of a
small number of humans or animals and permissible levels of exposure
for the whole population. Expert judgement is used to determine the
number and size of safety factors to be applied. For the metals covered
in this report, three human health end points (lung cancer, irritation /
inflammation and hypersensitivity) were thought to have specific
implication for the applications of safety factors. These considerations
are outlined in Section 1.4.2.
11. Where effects arise as a result of prolonged exposure, it is appropriateto adjust the exposure data to allow for continuous exposure in
ambient air. An additional factor may therefore need to be applied
where the original study from which the NOAEL / LOAEL was
derived was not for an entire lifetime, for example from occupational
data where people were only exposed at work.
12. The idea that complete protection can be offered by a standard implies
that there is a threshold of effect for the pollutant being considered –
a level below which normal health is not affected. Although for manysubstances the concept of a threshold seems to be broadly true, there
are some chemicals for which no threshold of effect exists. This group
includes genotoxic carcinogens. These compounds are known to cause
cancer as a result of interacting with DNA – the material inside the
nucleus of cells that carries genetic information.
13. For substances, such as genotoxic carcinogens, where no threshold has
been observed for adverse effects, EPAQS uses a similar approach to
that it has taken to substances with a threshold. The Panel identifies astarting point at which it believes the risks associated with that
exposure are exceedingly small. Safety factors are then applied to this
value in the usual way. A broader discussion of the approach used by
EPAQS and other organisations in setting air quality guidelines for
chemical carcinogens can be found at Appendix 1.
14. An alternative approach to that adopted by EPAQS, and one used by
the WHO and some other countries is based on quantitative risk
assessment. This approach seeks to extrapolate the occupational data
to lower concentrations and therefore to quantify the additional risk of
cancer at concentrations likely to occur in the environment. There are
many ways in which this extrapolation can be made depending upon
the assumed mechanism of carcinogenesis. It should be noted that
quantitative risk estimates should not be regarded as being equivalent
to the true cancer risk, but represent plausible upper bounds which
may vary widely according to the assumptions on which they are based
8/6/2019 Metals and Metal Lo Ids
http://slidepdf.com/reader/full/metals-and-metal-lo-ids 20/139
4
Expert Panel on Air Quality Standards
(WHO, 2000). Quantitative risk assessment gives a unit risk factor
which can be used to calculate the concentrations of an airborne
pollutant associated with a particular level of excess lifetime risk.
15. The quantitative risk assessment method uses the same occupational
cancer data as a starting point and inherently very similar assumptions
to the EPAQS method. However, unlike the EPAQS method it does not
arrive at a single concentration as a guideline. Rather, it is necessary for
the standard setting agency to specify a maximum tolerable level of
risk which can then be converted to a guideline concentration using the
unit risk factor.
1.2.2 Additional uncertainties
16. There are a number of uncertainties in the standards setting process that
are not formally accounted for in the use of safety factors. An example
is the uncertainty associated with the assessments of exposure to a
pollutant in the original occupational or epidemiological study,
which may not have been well measured. Extrapolation from
occupational workers to the general population has other uncertainties
due to possible differences in the chemical or physical form of the
pollutant and/or the pattern of exposure. These uncertainties can lead to
either an over- or an under-estimate of the overall toxicity of asubstance, however, given the uncertainties of, for example extrapolating
from animals to humans, the additional uncertainty is likely to be small.
17. Although not formally assessed through the use of safety factors,
these additional uncertainties are taken into account when evaluating
the overall quality of the evidence on which a NOAEL / LOAEL is
based and the precautionary way in which safety factors are applied.
1.2.3 Exposure to multiple pollutants
18. Individual industrial processes may release a wide variety of
pollutants, which can include a number of the metals and metalloids
considered in this report. Of these substances, chromium and nickel
are the two main metals released. In the case of chromium the metals
industry is the major source, whereas nickel arises mainly from the
burning of fossil fuels, although a substantial proportion does also
come from the metals industry. Table 1.1 shows the releases of these
metals from different industrial sectors regulated by the EA in England
and Wales. It should be noted that the EA's Pollution Inventory does
not distinguish between the two different forms of chromium
(chromium (III) and chromium (VI)).
8/6/2019 Metals and Metal Lo Ids
http://slidepdf.com/reader/full/metals-and-metal-lo-ids 21/139
5
Introduction
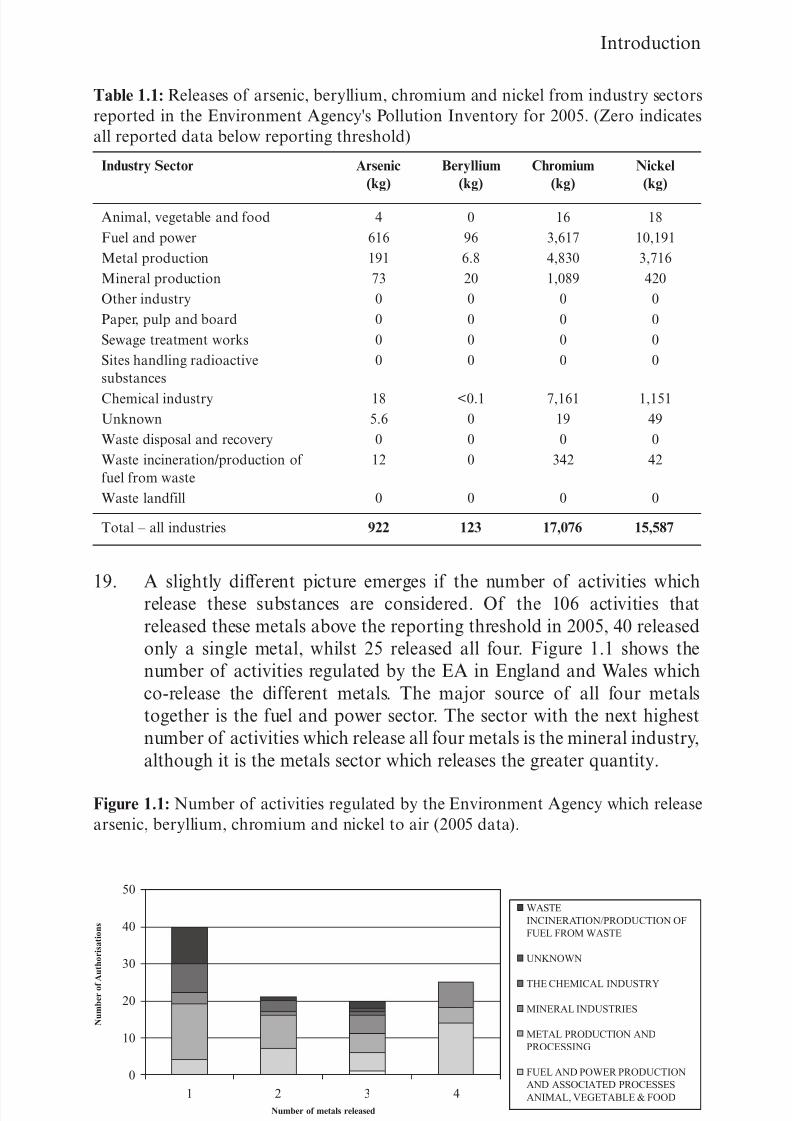
Table 1.1: Releases of arsenic, beryllium, chromium and nickel from industry sectors
reported in the Environment Agency's Pollution Inventory for 2005. (Zero indicates
all reported data below reporting threshold)
19. A slightly different picture emerges if the number of activities whichrelease these substances are considered. Of the 106 activities that
released these metals above the reporting threshold in 2005, 40 released
only a single metal, whilst 25 released all four. Figure 1.1 shows the
number of activities regulated by the EA in England and Wales which
co-release the different metals. The major source of all four metals
together is the fuel and power sector. The sector with the next highest
number of activities which release all four metals is the mineral industry,
although it is the metals sector which releases the greater quantity.
Figure 1.1: Number of activities regulated by the Environment Agency which release
arsenic, beryllium, chromium and nickel to air (2005 data).
Industry Sector Arsenic
(kg)
Beryllium
(kg)
Chromium
(kg)
Nickel
(kg)
Animal, vegetable and food
Fuel and power
Metal production
Mineral production
Other industry
Paper, pulp and board
Sewage treatment works
Sites handling radioactive
substances
Chemical industry
Unknown
Waste disposal and recovery
Waste incineration/production of
fuel from waste
Waste landfill
4
616
191
73
0
0
0
0
18
5.6
0
12
0
0
96
6.8
20
0
0
0
0
<0.1
0
0
0
0
16
3,617
4,830
1,089
0
0
0
0
7,161
19
0
342
0
18
10,191
3,716
420
0
0
0
0
1,151
49
0
42
0
Total – all industries 922 123 17,076 15,587
WASTE
INCINERATION/PRODUCTION OF
FUEL FROM WASTE
UNKNOWN
THE CHEMICAL INDUSTRY
MINERAL INDUSTRIES
METAL PRODUCTION AND
PROCESSING
FUEL AND POWER PRODUCTION
AND ASSOCIATED PROCESSES
ANIMAL, VEGETABLE & FOOD1 2
Number of metals released
N u m b e r o f A
u t h o r i s a t i o n s
3 4
50
40
30
20
10
0
8/6/2019 Metals and Metal Lo Ids
http://slidepdf.com/reader/full/metals-and-metal-lo-ids 22/139
6
Expert Panel on Air Quality Standards
20. In this report, the effects of individual pollutants have been considered
separately. However, the Panel recognises that ambient air in the
vicinity of industrial plant contains a complex mixture of pollutants at
differing concentrations. The effects of exposure to more than one
pollutant may be additive (i.e., the sum of the individual pollutant
effects), synergistic (i.e., greater than the sum of the individual
pollutant effects) or antagonistic (i.e., less than the sum of the
individual pollutant effects).
21. There is a paucity of information on the patterns of exposure of
populations to various mixtures of pollutants and on the effects of
these mixtures. Whether effects are additive, synergistic or antagonistic
will depend on the pollutants involved, their likely mechanisms of
effect and their concentrations.
22. In general, the default assumption is that the effects of multiple
pollutants are additive unless there is evidence to the contrary.
23. Much of the information on the harmful effects of metals on humans
comes from studies of populations whose exposures have occurred at
work. Where there is exposure to more than one toxic metal then it
may be difficult to distinguish the effects of one from the other; the
same is true for simultaneous exposures to other harmful substancessuch as noxious fumes at work or, commonly, cigarette smoke. Failure
to account for such ‘confounding’ exposures may lead to an
overestimate of the risk attributed to the metal under study.
24. The application of guideline values is outside the scope of the Panel’s
remit. However Agencies making use of these recommendations
should be aware that in deriving recommended values, the Panel
considered each of the pollutants in isolation. It is recognised
that there are similarities in the range of effect seen for each of theindividual metals considered. For some responses, notably
hypersensitivity, the individual metals are unlikely to show
cross-reactivity but in other cases, for example when an irritant effect
is seen, responses can be anticipated to be additive. These factors
should be taken into account by external Agencies when applying
the values in environments where mixed exposures are likely.
The Panel recommends that in case of doubt a precautionary
approach is appropriate.
1.2.4 Susceptible and vulnerable groups
25. Children are at increased risk of adverse health effects from any inhaled
toxin. The factors that contribute to this increased vulnerability are
discussed in detail in Appendix I of the Halogens and Hydrogen
Halides report (EPAQS, 2006a). In general, children spending more
8/6/2019 Metals and Metal Lo Ids
http://slidepdf.com/reader/full/metals-and-metal-lo-ids 23/139
7
Introduction
time outdoors tend to be more active and have higher ventilation rates
than adults. All of these factors increase the lung dose of an inhaled
toxin. For the metals addressed in this report, the integrity of the lung’s
antioxidant defences may also be important. Whether lung antioxidant
defences in the paediatric lung are impaired remains unclear. Lung
tissue analysis shows that messenger RNA levels for the antioxidant
enzymes manganese and copper-zinc superoxide dismutase are lower in
children, but this does not appear to be associated with reduction in
function (Asikainen et al., 1998). At the other end of the age spectrum,
it has been hypothesised that an imbalance between oxidant and
antioxidants in the lung contributes to the development of chronic
obstructive pulmonary disease (COPD) (Macnee, 2007). Patients
with COPD, and other chronic lung conditions associated with airway
inflammation, may therefore be more susceptible to inhaled“pro-oxidant” metals. Since there is uncertainly whether healthy
children and patients with chronic respiratory diseases represent
susceptible groups for metals inhalation, a correction factor has been
applied to take this uncertainty into account.
1.2.5 Units of concentration and choice of averaging times
26. In this report pollutant concentrations are measured as the mass of a
pollutant in a standard volume of air, usually a cubic metre. This isbecause the metals and metalloids being considered are mainly found
as particulate matter suspended in the air (see paragraph 34) and not
as gases. Box 1 gives more information on units of mass, concentration
and particle size.
27. When recommending an averaging time for a guideline value, the Panel
takes into account a number of considerations (see EPAQS, 2006b).
The most important of these is the length of exposure thought to give
rise to the health effect of concern. For example, some substances, suchas sulphur dioxide, have irritant effects that are almost instantaneous
and for these chemicals a short averaging time of an hour or less are
recommended. For other pollutants where the effects on health are
thought to be due to longer-term, chronic exposure, an averaging
period of one year is generally chosen. This is the case for the metals
considered in this report, with the exception of beryllium, where the
human health endpoint thought to occur at the lowest concentrations
is carcinogenicity.
28. A further consideration in recommending averaging times for air
quality standards is the nature of the source of the air pollutant of
concern. Some sources of air pollutants are ubiquitous, particularly
vehicular traffic, and hence the associated pollutants are widely
distributed in the ambient atmosphere. Other pollutants may be emitted
from specific industrial installations or large combustion plant and
8/6/2019 Metals and Metal Lo Ids
http://slidepdf.com/reader/full/metals-and-metal-lo-ids 24/139
8
Expert Panel on Air Quality Standards
hence are highly localised in their spatial distribution. For these isolated
point sources, the ratio of short-term peak concentrations to the annual
mean concentration is likely to be higher than for the more widespread
sources, and the peaks may be more frequent. Further justification for
the choice of averaging time is given in the individual chapters.
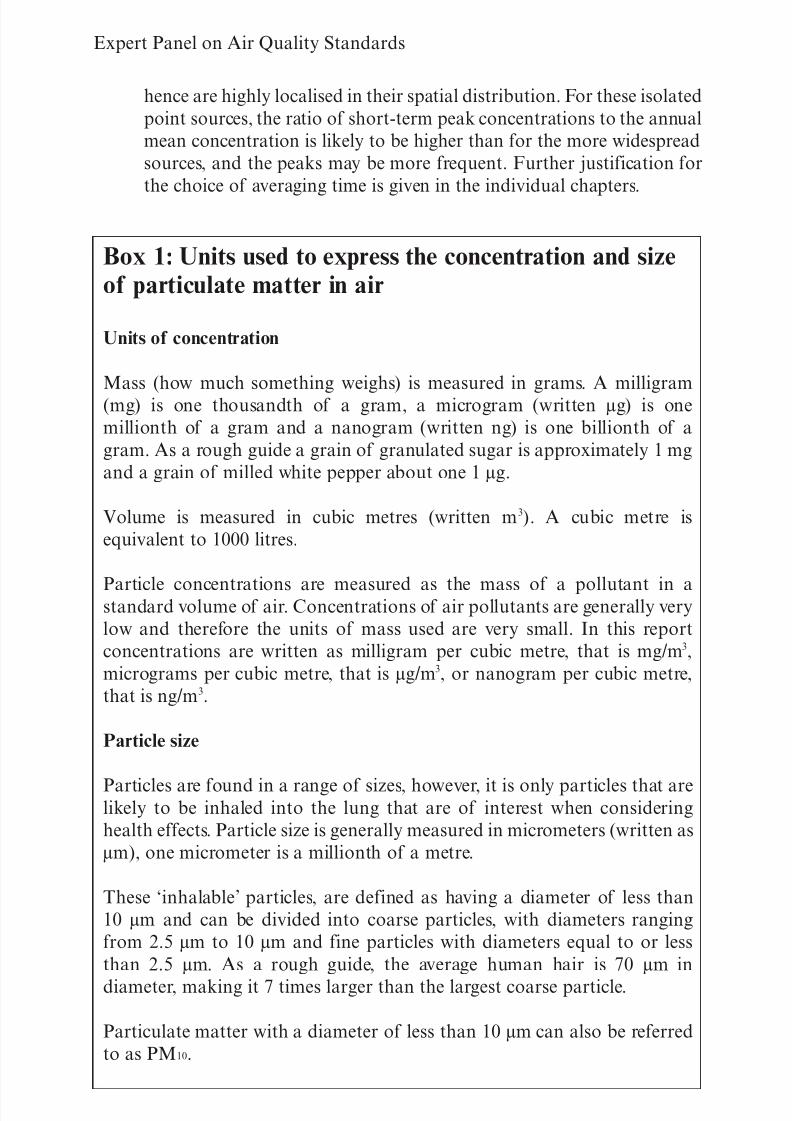
Box 1: Units used to express the concentration and sizeof particulate matter in air
Units of concentration
Mass (how much something weighs) is measured in grams. A milligram(mg) is one thousandth of a gram, a microgram (written µg) is one
millionth of a gram and a nanogram (written ng) is one billionth of a
gram. As a rough guide a grain of granulated sugar is approximately 1 mg
and a grain of milled white pepper about one 1 µg.
Volume is measured in cubic metres (written m3). A cubic metre is
equivalent to 1000 litres.
Particle concentrations are measured as the mass of a pollutant in astandard volume of air. Concentrations of air pollutants are generally very
low and therefore the units of mass used are very small. In this report
concentrations are written as milligram per cubic metre, that is mg/m3,
micrograms per cubic metre, that is µg/m3, or nanogram per cubic metre,
that is ng/m3.
Particle size
Particles are found in a range of sizes, however, it is only particles that arelikely to be inhaled into the lung that are of interest when considering
health effects. Particle size is generally measured in micrometers (written as
µm), one micrometer is a millionth of a metre.
These ‘inhalable’ particles, are defined as having a diameter of less than
10 µm and can be divided into coarse particles, with diameters ranging
from 2.5 µm to 10 µm and fine particles with diameters equal to or less
than 2.5 µm. As a rough guide, the average human hair is 70 µm in
diameter, making it 7 times larger than the largest coarse particle.
Particulate matter with a diameter of less than 10 µm can also be referred
to as PM10.
8/6/2019 Metals and Metal Lo Ids
http://slidepdf.com/reader/full/metals-and-metal-lo-ids 25/139
9
Introduction
1.2.6 Development of the report
29. In order to facilitate the development of guideline values for a large
number of compounds, the EA provided EPAQS with a dossier on
each of the substances under consideration. The dossiers included:
• a review of relevant animal toxicity data;
• a review and preliminary evaluation of existing literature on human
toxicology and health effects;
• a review of evaluations and recommendations by other
authoritative bodies.
30. These dossiers have been published as EA Research and Development
Reports and are available on the Agency publications website
(http://publications.environment-agency.gov.uk).
31. The EPAQS used the dossiers to provide background information and
as an aid to identifying the key studies on which to base their
recommendations. When appropriate, members of the Panel went
back to the original papers and supplemented these with additional
research of their own. Air quality guideline values were reached
through reviewing the available literature and the application of
expert judgement.
1.3 How the Environment Agencies will use theguideline values
32. The European Union Integrated Pollution Prevention and Control
Directive applies an integrated environmental approach to regulating
industrial emissions from specified installations. This has been
implemented in the UK through the Pollution Prevention and Control
Regime and from April 2008 will be taken forward by theEnvironmental Permitting regime.
33. Under this legal framework the EA regulates approximately 4,000 of
the potentially most complex and polluting industrial installations in
England and Wales with many smaller installations being regulated by
local authorities. The situation is slightly different in Scotland where
the regulator, the Scottish Environmental Protection Agency, regulates
all installations covered by the regime. The Northern Ireland
Environment and Heritage Service is the environmental regulator forNorthern Ireland.
34. The Environmental Permitting regime applies the principles of
Integrated Pollution Prevention and Control (IPPC), requiring the
regulator to ensure that ‘no significant pollution is caused’ and that
conditions are included in the permit, subject to the application of the
Best Available Techniques (BATs) that:
8/6/2019 Metals and Metal Lo Ids
http://slidepdf.com/reader/full/metals-and-metal-lo-ids 26/139
10
Expert Panel on Air Quality Standards
• ensure a high level of protection for the environment as a whole;
• have regard to the potential to transfer pollution from one
environmental medium to another;
• take account of an installation’s geographical location and local
environmental conditions;
• are aimed at minimising long distance and transboundary pollution;
• ensure appropriate protection of the soil and groundwater.
35. The Environmental Permitting regime uses some different terms, for
example, BAT is referred to as appropriate measures. This is
presentational as Environmental Permitting includes waste
management sites not subject to IPPC. For those sites subject to IPPC
all the requirements of this directive remain in place.
36. To gain a permit, operators will have to show that their proposals
represent the BAT to prevent and minimise pollution from their
installation. In order to assess the environmental impact of an
installation or identify the BAT from a range of options, the EA in
conjunction with the Scottish Environment Protection Agency and the
Environment and Heritage Service has developed an assessment
methodology known as H1: Guidance on Environmental Assessment
and Appraisal of BAT. Operators are not required to use the
methodology when making their application for a permit but it doesprovide a structured assessment process which addresses the specific
requirements of IPPC. Operators using an alternative approach would
need to ensure that an equivalent level of assessment is made.
37. The H1 methodology consists of the following basic steps:
• Define the objective and scope of assessment;
• Generate options of techniques to control pollution;
• Assess the environmental impacts of each option;
• Evaluate the costs to implement each option;• Identify the option which represents the best available technique.
38. Environmental criteria are used within H1 primarily to:
• assess the significance of releases to different environmental media
and to screen out insignificant effects;
• assess the relative effects of releases within and between different
environmental media.
39. However, there are relatively few established environmental criteria
that are suitable for use within the assessment methodology. For
example, EPAQS have published standards for nine of the major air
pollutants and six other pollutants. The WHO has set guideline values
for 14 organic and 15 inorganic pollutants, including some for which
standards have also been set by EPAQS. Overall, recognised air quality
standards are available for only approximately 37 different substances.
8/6/2019 Metals and Metal Lo Ids
http://slidepdf.com/reader/full/metals-and-metal-lo-ids 27/139
11
Introduction
This is to be compared with the 129 substances that are reported as
being released to the air from industrial installations on the EA’s
Pollution Inventory and on the Scottish Environment Protection
Agency’s Scottish Pollutant Release Inventory.
40. In order to fulfil its regulatory role, the EA has developed
environmental criteria known as Environmental Assessment Levels
(EALs) for different environmental media (air, water and land) for use
within the H1 framework. A hierarchical approach has been used to
develop EALs. For air, existing standards and guidelines are used as
EALs; however, as there are only a limited number of appropriate
values, EALs for most substances have been derived from occupational
exposure values by the application of a simple safety factor (EA,
2003). The air quality guidelines proposed by EPAQS in this report,and their previous report on halogens and hydrogen halides, will
replace these less robust values for use within the H1 methodology.
41. In using the guidelines, it is appropriate for the EA to take into account
particular public concern in the case of carcinogens. This is well
evidenced, for example by the fright or outrage factors published by
the Department of Health (1998).
1.4 Introduction to the metals and metalloids
1.4.1 Physio chemical characteristics
42. In this report EPAQS recommends air quality guideline values for four
metals and metalloids3: arsenic (As), nickel (Ni), chromium (Cr) and
Beryllium (Be).
43. Almost all of the metals and metalloids present in the atmosphere arepresent there as suspended particulate matter. The main exception to
this is mercury, of which the most abundant form in the atmosphere is
elemental mercury vapour. Arsenic forms a gaseous hydride, arsine,
but these such cases are relatively rare. Much of the atmospheric metal
and metalloid particulate matter derives from human activities and is
found in the fine and coarse particle size ranges.
44. Metals and metalloids in ambient air may be present in many different
chemical forms and these differences may affect not only theirbehaviour in the environment but also their behaviour once inhaled or
ingested. They may be present as their elemental forms, that is to say
not combined with other elements into simple compounds, or be
combined as oxides, carbonates or sulphates. They may be present as
3 An element which is intermediate of metals and nonmetals in terms of malleability,
ductility, conductivity and lustre.
8/6/2019 Metals and Metal Lo Ids
http://slidepdf.com/reader/full/metals-and-metal-lo-ids 28/139
12
Expert Panel on Air Quality Standards
single compounds or as mixtures of compounds. Many metals and
metalloids form a series of compounds with the same element. In that
case, the metal or metalloid would be said to exhibit different oxidation
states and arsenic is a good example of such a metalloid. Physico
chemical and toxicological properties may change markedly between
these different oxidation states.
45. Particulate metals and metalloids in the atmosphere show a wide
diversity of chemical forms because of their presence in different
compounds in different oxidation states. This diversity is generally
caused by the different emission sources which are often specific
sources of specific compounds. Coal combustion tends to produce
metal and metalloid oxides in their highest oxidation states.
Atmospheric chemical processes may also change the chemical natureof the metal or metalloid after emission to the atmosphere. It is
plausible for industrial and occupational exposures to involve different
chemical forms of metals and metalloids when compared with ambient
exposures, however this diversity of chemical forms is not apparent
from ambient measurements which almost always report the total
metal or metalloid content of the particulate matter independent of its
chemical form.
1.4.2 Key human health effects and their influence on safety factors
46. There are three effects which are common to some or all of the
pollutants considered: lung cancer, irritation / inflammation and
hypersensitivity (allergy). When considering each effect the Panel
applied the following principles in the application of safety factors.
1.4.2.1 Lung cancer
47. The panel considers that the mathematical extrapolations used bysome Agencies (particularly the USA Environmental Protection
Agency and WHO) to be insufficient as the sole determinants of
guideline values for the UK. This reflects concern over the high
uncertainty associated with extrapolation well beyond available data,
the high dependence of the derived value on the maximum
concentration tested/measured and the lack of public debate and
acceptance in Britain of the way in which risk values derived in this
way should be interpreted and applied. Thus, while these
extrapolations informed the decisions taken, they were not definitive.
The panel used the following approach.
48. Where good quality epidemiological data were available, these were
used as the primary source. If a clear no-effect level could be derived
then this was the starting point for extrapolation. In most cases this
was not available and residual doubt remained even at the lowest
8/6/2019 Metals and Metal Lo Ids
http://slidepdf.com/reader/full/metals-and-metal-lo-ids 29/139
13
Introduction
exposure levels. Also there were frequently fewer measurements at
lower than at higher exposure levels. It is recognised that the actual
exposures in these groups are often underestimated so that the
recorded level contains an inbuilt “safety” factor. Nevertheless, in these
circumstances the Panel applied an additional factor as a
precautionary measure. The size of the factor was determined by the
magnitude of potential “effect” at the exposure level selected, the
nature of the dose-relationship established at higher levels and the
measurement uncertainty in the value adopted, but the default was a
factor of ten.
49. In addition, a further factor was applied when the values were derived
from occupational exposures. The general public may be exposed to
polluted air for 24 hours a day, 365 days a year for a lifetime (taken as70 years) whilst the occupationally-exposed worker will be exposed
only for about 220 working days per year, 40 hours per week for a 40
year maximum working lifetime. This led to an exposure duration
safety factor of ten. A further factor of ten was applied as a
precautionary measure to reflect possible differences in susceptibility
in the population as a whole compared to workers. This is arguably not
applicable as not all workers exposed to carcinogens develop the
disease. It could be assumed that those who do contract the disease
represent a “susceptible population” and there is no reason to assumethat these individuals are differentially represented in workers
compared to the general public. Nevertheless as the Panel has
consistently adopted a precautionary approach to standard setting,
this factor was applied.
50. Where there are good animal models of disease and high quality
experiments on which to base a decision the approach adopted was
similar, except that an additional factor of ten was applied to allow for
possible differences in susceptibility between humans and experimentalanimals. The “exposure factor” was adjusted to reflect the regimen
used in the animal study (continuous exposures at constant
concentration are often used, with young animals exposed at the
beginning of the study so an additional factor may not be required).
1.4.2.2 Irritation/inflammation
51. This effect is usually modelled in animals as there is seldom significant
systematic histological evaluation of human tissue. However,
supplementary physiological information from human studies is used
when available and can be definitive when these reactions are known to
be the most sensitive index of response.
52. When animal data are used, the nature of the response determines the
“first” factor to be applied. When this is irritation of the respiratory
8/6/2019 Metals and Metal Lo Ids
http://slidepdf.com/reader/full/metals-and-metal-lo-ids 30/139
14
Expert Panel on Air Quality Standards
tract with no (or marginal) histological reaction then a factor of two
to four may be applied to a NOAEL as a precautionary measure. This
reflects the high level of confidence that these effects are unlikely to be
more severe in humans than in animals. Where a minimal effect level is
used for extrapolation an additional factor is applied as described in
the “lung cancer” section. For respiratory irritation this factor may be
at the level of two to four, again reflecting the significant information
available to model this response and the relatively minor nature of the
response in humans (ranging from “a tickle in the throat” to a cough
at levels just above the no-effect threshold). For more severe effects
such as chronic inflammation, a factor of ten would be more usual.
53. A further factor of ten is applied to animal data or to the NOAEL
derived from human responses to reflect possible differences insusceptibility in the population as a whole. This factor may be reduced
or eliminated if the data were derived from a susceptible group, for
example, asthmatics.
1.4.2.3 Hypersensitivity
54. This response is usually induced by intermittent contact at high level.
In contrast, continuous exposures, even at high levels, may protect
against the development of allergy through the induction of immunological tolerance. Once sensitised an individual may respond
to concentrations very much lower than those necessary to induce the
initial reaction. There is only limited evidence for cross-reactivity
between dermal and inhalation exposures, but it is reasonable to
assume that this may be possible for soluble materials in sensitised
individuals.
55. The Panel considered that the guideline values adopted for pollutants
should prevent the development of hypersensitivity. The Panel did notconsider it realistic to allow for idiosyncratic responses which could
nonetheless be possible in a few individuals with extreme sensitivity.
However, where available, literature values for the threshold of
response were examined to assure that guideline values would not
provoke a reaction in sensitised individuals. The values derived are
considered to fulfil this requirement, with values well below those
known to provoke reactions.
8/6/2019 Metals and Metal Lo Ids
http://slidepdf.com/reader/full/metals-and-metal-lo-ids 31/139
15
Introduction
References
Asikainen, T.M., Raivio, K.O., Saksela, M., and Kinnula, V.L. (1998).
Expression and developmental profile of antioxidant enzymes in human lung
and liver. Am J Respir Cell Mol Biol ; 19(6):942-9.
EPAQS (2003). EPAQS statement on the use of an interim methodology for
setting guideline values for environmental assessment level. Expert Panel on
Air Quality Standards.
http://www.defra.gov.uk/environment/airquality/panels/aqs/publications/pdf/
epaqs-0314.pdf
Department of Health (1998). Communicating About Risks to Public Health
– Pointers to Good Practice, London, UK, The Stationery Office.
EPAQS (2006a). Halogens and Hydrogen Halides, Appendix 1, pp 67-69.
Expert Panel on Air Quality Standards.
http://www.defra.gov.uk/environment/airquality/publications/halogens/
index.htm
EPAQS (2006b). Halogens and Hydrogen Halides, Section 1.2.3, pp 7-8.
Expert Panel on Air Quality Standards.
http://www.defra.gov.uk/environment/airquality/publications/halogens/
index.htm
EA (2003). Integrated Pollution Prevention and Control. Environmental
Assessment and Appraisal of BAT: Horizontal Guidance Note H1.
Environment Agency. Draft July 2003.
Macnee, W. (2007). Pathogenesis of chronic obstructive pulmonary disease.
Clin Chest Med ; 28(3):479-513, v.
WHO (2000). Air Quality Guidelines for Europe (Second edition). World
Health Organisation, Geneva, Switzerland.

8/6/2019 Metals and Metal Lo Ids
http://slidepdf.com/reader/full/metals-and-metal-lo-ids 32/139
16
Expert Panel on Air Quality Standards
8/6/2019 Metals and Metal Lo Ids
http://slidepdf.com/reader/full/metals-and-metal-lo-ids 33/139
17
Chapter 2
Arsenic
2.1 Background
2.1.1 Basic chemical information
56. Arsenic is one of those chemical elements known as a metalloid, which
reflects the fact that it exhibits properties intermediate between those
of the metals and the non-metals. It occurs naturally in the
environment within the earth’s crust, having a relatively low average
abundance of around 5 mg/kg. Its distribution is, however, uneven and
there are some locations, most notably Bangladesh, where highnaturally occurring concentrations can leach into groundwater, posing
a serious human health risk.
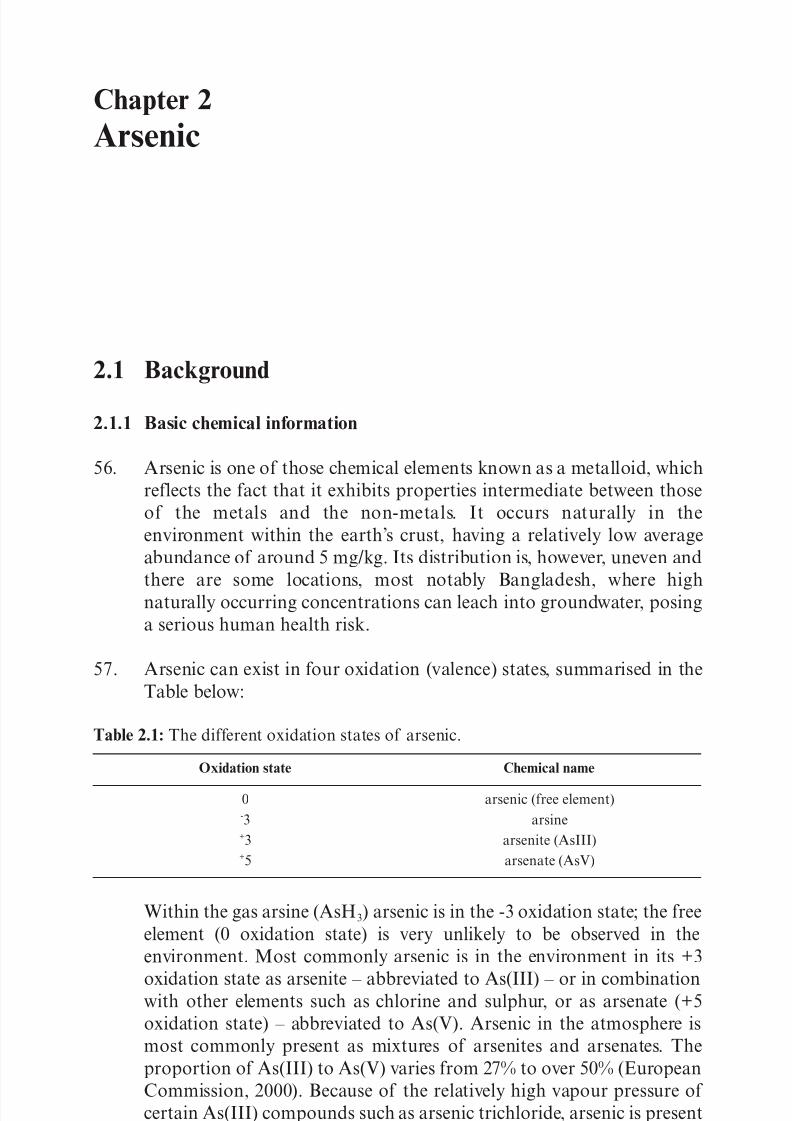
57. Arsenic can exist in four oxidation (valence) states, summarised in the
Table below:
Table 2.1: The different oxidation states of arsenic.
Within the gas arsine (AsH3) arsenic is in the -3 oxidation state; the free
element (0 oxidation state) is very unlikely to be observed in the
environment. Most commonly arsenic is in the environment in its +3
oxidation state as arsenite – abbreviated to As(III) – or in combinationwith other elements such as chlorine and sulphur, or as arsenate (+5
oxidation state) – abbreviated to As(V). Arsenic in the atmosphere is
most commonly present as mixtures of arsenites and arsenates. The
proportion of As(III) to As(V) varies from 27% to over 50% (European
Commission, 2000). Because of the relatively high vapour pressure of
certain As(III) compounds such as arsenic trichloride, arsenic is present
both as vapour and particulate matter in the atmosphere.
Oxidation state Chemical name
0-3+3+5
arsenic (free element)
arsine
arsenite (AsIII)
arsenate (AsV)
8/6/2019 Metals and Metal Lo Ids
http://slidepdf.com/reader/full/metals-and-metal-lo-ids 34/139
18
Expert Panel on Air Quality Standards
58. At one time there was major use of arsenic in pesticides and this
continues in the form of copper chrome arsenate used as a timber
treatment. Other uses include incorporation in metal alloys. Because of
its presence in the earth’s crust, arsenic exists in a range of crustal
materials including coal and metal ores and consequently can be
released to the atmosphere during their combustion or processing.
2.1.2 Sources of arsenic in the UK atmosphere
59. Arsenic is primarily emitted into the atmosphere by high-temperature
processes such as coal-fired power generation, smelting, burning
vegetation and volcanoes (WHO, 2000). Natural low-temperature
biomethylation and microbial reduction also release arsenic into the
atmosphere; microorganisms can form volatile methylated derivativesof arsenic under both aerobic and anaerobic conditions, and can
reduce arsenic compounds to release arsine gas (Cheng and Focht,
1979; Tamaki and Frankenberger, 1992).
60. Arsenic is released into the atmosphere primarily as arsenic trioxide
(As2O3) or, less frequently, as one of several volatile compounds,
arsines. Arsenic released to air exists mainly in the form of particulate
matter (Coles et al., 1979). These particulate matter have a lifetime of
up to 10 days before removal by wet and dry deposition and readilyundergo long-range transboundary transport (USEPA, 1984). Arsines
that are released from microbial sources in soils or sediments undergo
oxidation in the air, reconverting the arsenic to less volatile forms that
are removed by wet and dry deposition (Parris and Brinckman, 1976).
61. Historically, the main source of arsenic emissions to the air in the UK
has been the combustion of coal in power stations, industry and for
domestic heating (Dore et al., 2006). The main sources reported in the
UK National Atmospheric Emissions Inventory for 2004 includeemissions from the combustion of treated wood and combustion of
coal in industry and power stations. Combustion of coal in power
stations, industry and for domestic heating contributed 10% of the
national total in that year. Combustion of fuel oil at refineries, in
industry and from shipping contributed 7%. Emissions from the
combustion of wood treated with copper-chromium-arsenic
preservatives were estimated to contribute up to 50%, although this
estimate is uncertain. Emission from metal industry sources make up a
relatively small percentage of total UK emissions (7%) but may
constitute the most important source in the vicinity of specific
industrial plants.
62. UK emissions of arsenic are estimated to have declined by 78%
between 1970 and 2004 as a result of reductions in the combustion of
coal in power stations, industry and for domestic heating.
8/6/2019 Metals and Metal Lo Ids
http://slidepdf.com/reader/full/metals-and-metal-lo-ids 35/139
19
Arsenic
2.1.3 Ambient concentrations
63. Measured annual mean arsenic concentrations in air in 2005 ranged
from 0.1 to 0.4 ng/m3 at rural locations, 0.8 to 1.4 ng/m3 at urban
locations and 0.8 to 1.5 ng/m3 at monitoring sites close to metal
industries. Concentrations ranged from 0.3 to 8.4 ng/m3 in 2000, when
measurements were made at a larger number of sites (Vincent and
Passant, 2006). Concentrations at rural monitoring sites in the UK
have declined sharply, reflecting the changes in UK emissions
(Conolly, 2003).
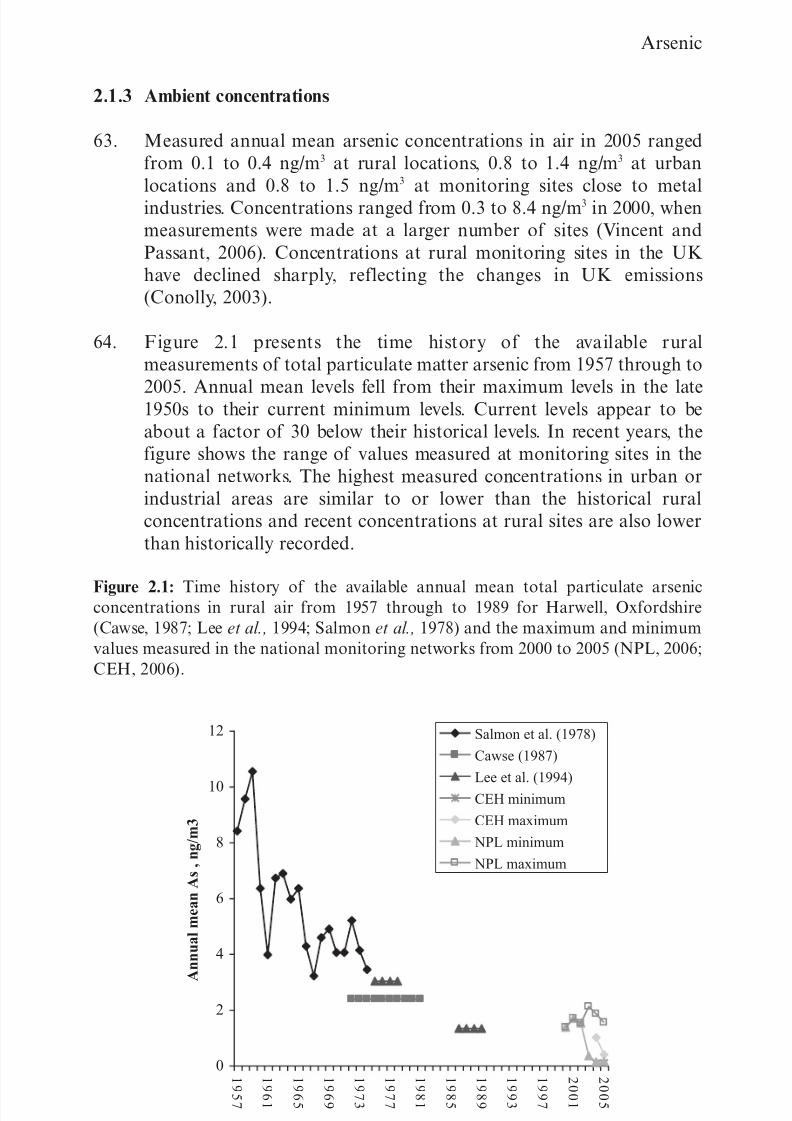
64. Figure 2.1 presents the time history of the available rural
measurements of total particulate matter arsenic from 1957 through to
2005. Annual mean levels fell from their maximum levels in the late1950s to their current minimum levels. Current levels appear to be
about a factor of 30 below their historical levels. In recent years, the
figure shows the range of values measured at monitoring sites in the
national networks. The highest measured concentrations in urban or
industrial areas are similar to or lower than the historical rural
concentrations and recent concentrations at rural sites are also lower
than historically recorded.
Figure 2.1: Time history of the available annual mean total particulate arsenicconcentrations in rural air from 1957 through to 1989 for Harwell, Oxfordshire
(Cawse, 1987; Lee et al., 1994; Salmon et al., 1978) and the maximum and minimum
values measured in the national monitoring networks from 2000 to 2005 (NPL, 2006;
CEH, 2006).
0
2
4
6
8
10
12
1
9
5
7
1
9
6
1
1
9
6
5
1
9
6
9
1
9
7
3
1
9
7
7
1
9
8
1
1
9
8
5
1
9
8
9
1
9
9
3
1
9
9
7
2
0
0
1
2
0
0
5
A
n n u a l m e a n A s , n g / m 3
Salmon et al. (1978)
Cawse (1987)
Lee et al. (1994)CEH minimum
CEH maximum
NPL minimum
NPL maximum
8/6/2019 Metals and Metal Lo Ids
http://slidepdf.com/reader/full/metals-and-metal-lo-ids 36/139
20
Expert Panel on Air Quality Standards
Measurements of the mass size distribution of arsenic in polluted urban and
rural air have typically shown a bimodal size distribution. The more abundant
proportion is present in fine particulate matter of less than 1 µm aerodynamic
diameter (Rabano et al., 1989; Waldman et al., 1991; Kelley et al., 1995)
consistent with a source in combustion processes (e.g. power stations) or
gas-to-particle conversion of arsenic-containing vapours. The less abundantproportion in the size distribution is in the range of 5-10 µm aerodynamic
diameter and probably arises from windblown soils and dusts. In urban
emissions the As(III)/As(V) ratio for both fine and coarse particulate matter is
approximately 1 (Rabano et al,. 1989).
2.1.4 Human exposures
65. Non-occupational, human exposures to arsenic are incurred through:
drinking (ground) water; eating fish (mainly low toxicity organicarsenic species) or food grown in contaminated soils; the use of
arsenic-containing compounds such as old types of pesticide, wood
preservatives or some medicines, including ‘herbal’ types; pica;
cigarette smoking; and residence in neighbourhoods with industrial
contamination. Most of these are no longer relevant to UK
populations. Only the last two sources of exposure involve respiratory
exposures. For the general population, inhalation of arsenic from
ambient air is a minor route of exposure. In the USA average daily
intakes from ambient air are estimated to range from 0.3 to 0.4 ng / kgof body weight / day (ATSDR, 2007), approximately 0.5% of total
daily exposure to inorganic arsenic.
66. Levels of arsenic in cigarettes have been greatly reduced by the
prohibition of arsenical pesticides in tobacco production. The inhaled
smoke from currently available cigarettes contains between 0 and 1.4
µg arsenic per cigarette; this wide range is believed to reflect variations
in the field history, soil, and fertilizer conditions under which the
tobacco is grown (Smith et al., 1997).
67. Occupational exposures to inorganic arsenic occur during the smelting
of non-ferrous ores, especially copper and lead which are frequently
contaminated by arsenic; work in some coal-burning power plants and
municipal incinerators; the production or use of pesticides or wood
preservers that contain the mineral or the sawing or burning of wood
preserved in the same way; work in the microelectronics industry
(gallium arsenide); and work in cotton harvesting or processing. Ineach case the primary route of exposure is probably inhalation
although oral and dermal routes may also be important.
68. Studies of patients with lung cancer (Holland et al., 1959) and of
workers with occupational exposure to inorganic arsenic trioxide
(Pinto et al., 1976) suggest that between 30 – 60% of inhaled arsenic is
absorbed. There are no human data on the body distribution of arsenic
8/6/2019 Metals and Metal Lo Ids
http://slidepdf.com/reader/full/metals-and-metal-lo-ids 37/139
21
Arsenic
after inhaled exposures, and none to indicate that the fate of inhaled
arsenic in children is different from that in adults, although this may not
be the case for arsenic imbibed in drinking water (Meza et al., 2005).
2.2 Animal toxicology
2.2.1 Pulmonary absorption
69. Most studies relating to the toxicokinetics of arsenic have been
performed in animals. Depending on the chemical form, particle size
and solubility, arsenic is readily absorbed from the lungs (Gochfeld,
1995). Absorption of arsenic from the respiratory tract is a two-part
process involving deposition of the particulate matter onto airway
surfaces and then absorption from deposited particulates. Afterinhalation of soluble arsenic compounds (for example, arsenic
trioxide), most of the deposited arsenic is absorbed into the
bloodstream from the digestive tract following respiratory clearance
(Marafante and Vahter, 1987). However, particulate matter of low
solubility (for example, arsenic trisulphide, calcium arsenate, lead
arsenate and gallium arsenide) are retained to a great extent in the
lungs (Pershagen et al., 1982; Webb et al., 1984; Marafante and Vahter,
1987). Dissolution of certain arsenic-containing particulate matter, for
example, lead arsenate, by alveolar macrophages may increase the rate
of absorption in the lungs (Marafante and Vahter, 1987). Data from
mice experiments indicate that continuous inhalation of arsenic causes
an increase in tissue levels for a couple of weeks, after which there may
be a decrease in spite of ongoing exposure (Bencko et al., 1973). No
explanation was provided for this observation.
2.2.2 Metabolism
70. The metabolism of arsenic has been extensively studied in animals.
It consists of two processes: reduction/oxidation reactions that
interconvert arsenate and arsenite and methylation (Figure 2.2).
These processes are similar whether exposure is by inhalation,
ingestion, or by injection with more than 75% of the absorbed arsenic
dose being excreted in the urine (Marcus and Rispin, 1988). Arsenic is
methylated in the body to monomethylarsonic acid (MMA) and
dimethylarsinic acid (DMA). Methylation takes place mainly in the
liver and may be considered a detoxification mechanism for arsenic,since the methylated metabolites have a lower affinity for tissue
constituents and lower toxicity than arsenic, especially the trivalent
form (Vahter et al., 1983).
8/6/2019 Metals and Metal Lo Ids
http://slidepdf.com/reader/full/metals-and-metal-lo-ids 38/139
22
Expert Panel on Air Quality Standards
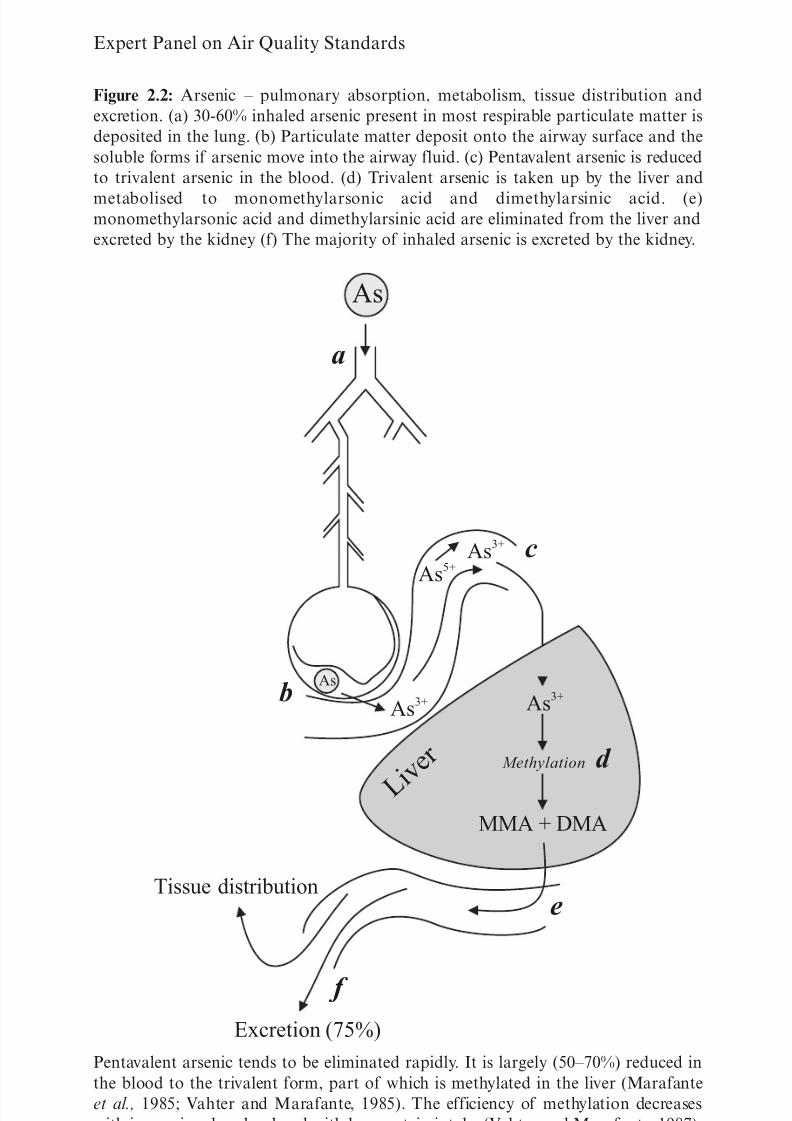
Figure 2.2: Arsenic – pulmonary absorption, metabolism, tissue distribution and
excretion. (a) 30-60% inhaled arsenic present in most respirable particulate matter is
deposited in the lung. (b) Particulate matter deposit onto the airway surface and the
soluble forms if arsenic move into the airway fluid. (c) Pentavalent arsenic is reduced
to trivalent arsenic in the blood. (d) Trivalent arsenic is taken up by the liver and
metabolised to monomethylarsonic acid and dimethylarsinic acid. (e)monomethylarsonic acid and dimethylarsinic acid are eliminated from the liver and
excreted by the kidney (f) The majority of inhaled arsenic is excreted by the kidney.
Pentavalent arsenic tends to be eliminated rapidly. It is largely (50–70%) reduced in
the blood to the trivalent form, part of which is methylated in the liver (Marafante
et al., 1985; Vahter and Marafante, 1985). The efficiency of methylation decreases
with increasing dose level and with low protein intake (Vahter and Marafante, 1987).
As
As
a
As3+
As3+ As
3+
MMA + DMA
Tissue distribution
Excretion (75%)
L i v e
r Methylation
As5+
c
b
d
e
f
8/6/2019 Metals and Metal Lo Ids
http://slidepdf.com/reader/full/metals-and-metal-lo-ids 39/139
23
Arsenic
2.2.3 Tissue distribution and excretion
71. Most forms of inhaled arsenic are excreted within a few days via the
kidney as MMA and DMA. Urinary excretion accounts for 30 – 60% of
the inhaled dose (Vahter, 1986). Since the deposition fraction of an
inhaled dose ranges from 30 – 60% for most respirable particulate
matter, this suggests that nearly all arsenic that is deposited in the lung
is excreted in the urine. The relative proportions of arsenic, MMA, and
DMA in urine vary depending upon the chemical administered, the time
after exposure, the route of exposure, the dose level, and the exposed
species of animal. Increased MMA/DMA ratios have also been
observed in mice, but only at much higher doses (Hughes et al., 1994).
72. Several pharmacokinetic models have been developed for evaluatingthe kinetic behaviour of arsenic (Clewell et al., 1999). However they
focus on the prediction of the urinary elimination of arsenic species
under different exposure conditions, rather than estimation of arsenic
species concentrations in the various target tissues associated with
arsenic’s adverse effects.
73. Although no studies on the distribution of organic arsenic in animals
after inhalation exposure were identified, DMA administered to rats
via the trachea was distributed throughout the body suggesting thatinhalation of organic arsenic compounds also leads to widespread
distribution. Where excretion of organic arsenic compounds is
concerned it appears to be prompt, rats exposed to DMA via the
trachea excreted 60% in the urine and about 8% in the faeces within
24 hours (Stevens et al., 1977).
2.3 Health effects
2.3.1 Acute effects
2.3.1.1 Animals
74. Aqueous solutions of arsenic are ten times more toxic than arsenic
administered dry by the same route. Rats appear more susceptible to
arsenic in solution than mice of a similar age, although no difference
in acute toxicity was found between males and females of the same
species. There are, however, considerable differences in arsenic toxicityamong different strains of mice. Following acute administration
marked haemorrhage of the stomach and intestine has been reported
(Satterlee, 1958) as well as fatty degeneration of the liver with cell
necrosis and reparative changes (Rossing, 1941). No reports have been
found showing that metallic arsenic has appreciable acute toxicity.
8/6/2019 Metals and Metal Lo Ids
http://slidepdf.com/reader/full/metals-and-metal-lo-ids 40/139
24
Expert Panel on Air Quality Standards
75. Arsenic inhibits the activity of many enzymes involved in energy
metabolism, specifically oxidative phosphorylation. This inhibition
results in reduced levels of the high energy phosphate molecules that
drive many essential reactions in the cell (Squibb and Fowler, 1983)
and is reversible. The toxicity of trivalent arsenic can be reduced by the
addition of a free thiol (such as glutathione), while thiol depletion
increases toxicity (Clewell et al., 1999). Binding of arsenic to dithiols
also inhibits energy metabolism and is more difficult to reverse.
Pyruvate oxidase, a critical enzyme in energy metabolism, needs a
dithiol (lipoic acid) cofactor to produce acetyl coenzyme A, the ‘fuel’
for oxidative phosphorylation. Pentavalent arsenic is less reactive with
tissue constituents, but the arsenate ions can substitute phosphate ions
in various enzyme catalysed reactions (Squibb and Fowler, 1983). The
similarity of arsenate to phosphate results in the formation of arsenateesters in place of phosphate. These are unstable, so the process leads to
an effective uncoupling of oxidative phosphorylation again inhibiting
energy metabolism.
2.3.1.2 Humans
76. All the available human evidence is based on occupational studies,
mostly among smelter workers exposed to arsenic trioxide. None
appear to relate acute health effects to exposure levels. Death fromacute inhalation appears to be unlikely even with exposures up to 100
mg/m3 (ATSDR, 2007). Exposure to arsenic dust causes irritation of
the conjunctivae and upper respiratory tract and there are reports of
perforation of the nasal septum occurring in a matter of days or weeks.
The mechanisms for these effects are unclear.
77. In extrapolating from this limited occupational evidence to the
ambient situation, it is important to consider to what extent symptoms
occurring in the occupational context are associated with a larger sizeof arsenic particulate matter than is found in ambient air. Pinto and
McGill state that “23% by particle count are greater than 5.5 µm”
(Pinto and McGill, 1953) whereas most ambient arsenic is in
particulate matter smaller than this. The irritant effects reported in
occupational studies may be due to larger size particulate matter
deposited in the upper respiratory tract. The European Community
(EC, 2000) and Institute for Environment and Health (IEH, 2000) also
refer to arsenic causing lower respiratory irritation (bronchitis), but no
primary sources for this observation are cited.
78. Published no observed adverse effects levels (NOAELs) for acute
exposure vary in size and their rationale. The Health and Safety
Commission (HSE, 1986), based on the HSE Toxicity Review 1986
cites a NOAEL of 0.4 to 2 mg/m3 for respiratory irritation. The EC
(2000) consider that acute irritant effects are likely to be minimal at
8/6/2019 Metals and Metal Lo Ids
http://slidepdf.com/reader/full/metals-and-metal-lo-ids 41/139
25
Arsenic
exposure levels of about 0.1-1.0 mg/m3. The same levels are suggested
by IEH (2000) and CSTEE (2001).
79. On the basis of meagre quantitative evidence from occupational
studies, there is a consensus that acute irritative effects on the upperrespiratory system and conjunctivae are unlikely at exposure levels
between 0.1 – 1 mg/m3 of arsenic. It is likely that a greater proportion
of ambient arsenic is in the respirable particle range, which might lead
to greater toxicity in the lower respiratory tract for a given mass
concentration; this needs to be taken into consideration in determining
an ambient standard.
2.3.2 Chronic effects
2.3.2.1 Animals
80. Animals appear to be considerably less sensitive than humans to the
toxic effects of arsenic. The basis of this difference is not well
understood but may involve the metabolic fate of arsenic. For example,
in rabbits exposure to inhaled arsenic at levels of 0.05, 0.1, 0.22 or
1.1 mg/m3 for 8 hours a day over 8 weeks led to a significant increase
in plasma inorganic arsenic concentrations at only the two higher
experimental exposures (Beck et al., 2002).
2.3.2.2 Humans
81. A large number of adverse human health effects have been
attributed to chronic arsenic exposure. In many cases these relate to
long-term oral exposures; there are fewer studies of the human toxicity
of inhaled arsenic, and almost all of them are of populations exposed
in the workplace.
82. Disease associations with arsenic exposure may not be causal if there
are simultaneous, confounding exposures to agents such as cigarette
smoke or other toxic dusts and fumes. Very few studies have
adequately controlled for these. Causal attribution is enhanced if a
consistent relationship between arsenic exposures and disease risk has
been observed.
83. Non-malignant, non-developmental effects that can potentially be
attributed to long-term arsenic exposures include upper airway
irritation and nasal septal perforation and conjunctivitis reported from
workforces with unquantified but probably very high exposures
incurred before 1950 (Lundgren, 1954; Pinto and McGill, 1953). The
contributions of potentially confounding exposures were not fully
considered. In the absence of control for smoking, reports of increased
risk of other non-malignant respiratory disease such as emphysema
8/6/2019 Metals and Metal Lo Ids
http://slidepdf.com/reader/full/metals-and-metal-lo-ids 42/139
26
Expert Panel on Air Quality Standards
are not easily interpreted. Peripheral neuropathy with decreased nerve
conduction velocities has been measured at cross-sectional survey of
employees of a Swedish copper smelter with an estimated average
exposure to arsenic of 310 µg/m3 for 28 years (Lagerkvist and
Zetterlund, 1994). Encephalopathy may occur at higher, unquantified
exposures. Vasospastic symptoms and Raynaud’s phenomenon have
been described among employees of the same smelter exposed to a
time–weighted average of 360 µg/m3.years for a mean of 23 years
(Lagerkvist et al., 1986 and 1988). In both Swedish studies the lowest
estimated intensity of exposure to arsenic was 50 µg/m3. Mild
hypertension has been attributed to unquantified occupational arsenic
exposures in a small Danish series (Jensen and Hansen, 1998).
Dermatitis, including hyperpigmentation and hyperkeratosis has been
described in two workforces; in one the estimated lowest observedadverse effects level (LOAEL) was 80 µg/m3 (Perry et al., 1948), but in
the other the NOAEL was ten-fold lower (Mohamed, 1998).
2.3.3 Genotoxic and carcinogenic effects
2.3.3.1 Animals
84. There is extensive evidence that oral exposure of animals to arsenic
leads to major chromosomal damage. There are no studies whichaddress cancer development in animals after inhalation exposure to
inorganic arsenic. However, intratracheal instillation studies in
hamsters have provided evidence that both arsenite and arsenate can
increase the incidence of lung adenomas and carcinomas. Although
several mechanisms of action have been proposed to explain the
carcinogenicity of arsenic, at present there is no hypothesis that has
received widespread support or that integrates the various clinical
observations and the experimental data (Clewell et al., 1999).
85. The primary hypotheses explaining the genotoxic and carcinogenic
effects of arsenic include its inhibition of DNA repair enzymes,
its ability to induce DNA amplification, especially oncogene
amplification (perhaps by interfering with DNA repair and/or by
inhibiting DNA synthesis) and its ability to cause hypomethylation of
DNA by competing for methyl groups (Rudel et al., 1996). However,
hypermethylation may also occur with arsenic exposure.
Hypermethylation of DNA, particularly in the promoter region,
can result in inactivation of tumour suppressor genes or genes involved
in DNA repair. Since these hypotheses involve types of damage that
arsenic has been shown to induce with a sublinear response, they are
consistent with the conclusion, drawn by some, that the dose–response
relationship of arsenic-induced carcinogenicity is probably sublinear.
8/6/2019 Metals and Metal Lo Ids
http://slidepdf.com/reader/full/metals-and-metal-lo-ids 43/139
27
Arsenic
86. Some toxicologists believe that arsenic does not act by direct reaction
with DNA but rather by interfering with DNA synthesis. Inhibition of
DNA replicative mechanisms and effects on repair mechanisms
could explain the chromosomal effects of arsenic and synergism with
DNA-reactive chemicals. Other mechanisms for the carcinogenicity of
arsenic have, on the basis of experimental evidence, been suggested;
they include clastogenicity (chromosomal breakage) and mutagenicity
(changes in the structure of genetic material). No single hypothesis has
attracted universal support.
87. Recent studies have also suggested that DMA, a major metabolite of
ingested inorganic arsenic in mammals, may initiate carcinogenesis in
a number of organs (Yamanaka et al., 2004; Wanibuchi et al., 2004).
The methylation of trivalent arsenic has been associated with DNAdamage and activation of AP-1 dependent gene transcription
(Styblo et al., 2002). However, it is unclear if these metabolites are
present in sufficient quantities or length of time to induce toxicity
(Schoen et al., 2004).
2.3.3.2 Humans
88. Human genotoxic effects, manifest as an increase in risk of
chromosomal abnormalities in peripheral leucocytes, have beenreported from one population, employed in a Swedish copper smelter.
No associated exposure estimates were presented (Beckman et al.,
1977) and it not clear that the effects were attributable to arsenic
exposure. Trivalent arsenic may be more genotoxic to human
lymphocytes than pentavalent arsenic (Nordenson et al., 1981).
89. Close attention has been paid to the carcinogenic effects of inhaled
arsenic in the workplace; and in particular to the risk of lung cancer.
This in part may reflect the relative ease with which secondary(mortality) data can be collected. Workers exposed to arsenic may also
be exposed to other carcinogens such as tobacco smoking or other
workplace toxins. These need to be accounted for although this is
commonly not the case in published studies.
90. There is some information suggesting that those who lived in the
vicinity of smelters had an increased risk of lung cancer (Pershagen,
1985). When taken together with the studies of developmental defects
mentioned below, these indicate a need to control non-occupational
airborne exposures but the available data on exposure levels would not
be helpful in standard setting.
91. Increased risks of lung cancer attributed to arsenic have been reported
in serial studies of the workforces of two US and one Swedish smelters
(Enterline et al., 1995; Lee-Feldstein, 1986; Jarup et al., 1989); and in
8/6/2019 Metals and Metal Lo Ids
http://slidepdf.com/reader/full/metals-and-metal-lo-ids 44/139
28
Expert Panel on Air Quality Standards
a case-referent study of employees in a Chilean copper mine and
smelter (Ferreccio et al., 1995). In each of the serial cohort studies
there have been increasingly careful attempts made to estimate
airborne exposures but limited adjustment for smoking and none for
other important occupational dust exposures. The lowest levels of
cumulative exposure to inorganic arsenic that have been associated in
these cohorts with statistically significant increases in lung cancer risk
range from less than 250 to 2000 µg/m3 years. An increased risk of lung
cancer in the Chilean workforce was found only for those working in
the smelter (average arsenic exposure 202 µg/m3). The only recent data
from the UK refer to the male employees of a tin smelter; since they
were likely exposed to a variety of carcinogens it is not clear that their
increased rate of death from lung cancer can be attributed to arsenic
exposure alone (Binkes et al., 2005).
92. It is likely that there are interactions between smoking and
arsenic inhalation in the development of lung cancer, but the extent of
this interaction may vary with the level of arsenic exposure
(Hertz-Picciotto and Smith, 1993).
93. Associations between occupational arsenic exposures and other
human cancers have been reported but the evidence for a causal
relationship in each case is very weak.
94. The International Programme on Chemical Safety reviewed a large
number of studies of the effects of long-term exposure to arsenic in
drinking water. They concluded that arsenic in drinking water is
causally related to increased risk of cancer in the skin, lungs, bladder
and kidney, and to skin changes especially hyperkeratosis and changes
in pigmentation (IPCS, 2001). Exposure–response relationships and
high risks had been observed for each of these end-points. Many of the
studies had been undertaken in Taiwan, but similar results have beenreported in studies undertaken in Bangladesh and South America.
Increased risks of lung and bladder cancer and of arsenic-associated
skin lesions have been reported to be associated with ingestion of
drinking-water at concentrations ≤50 µg arsenic/litre. For an adult
consuming 2 litres of water per day, this equates to a daily intake of
≤100 µg.
2.3.4 Reproductive and developmental toxicity
95. Adverse reproductive and developmental effects have been studied, by
a single research group, among the female workforce of a Swedish
copper smelter. Small increases in the risks of low birth weight
(Nordström et al., 1978), spontaneous abortion (Nordström et al.,
1979a) and congenital malformation (Nordström et al., 1979b) have
been reported. These have not been associated with direct estimates of
8/6/2019 Metals and Metal Lo Ids
http://slidepdf.com/reader/full/metals-and-metal-lo-ids 45/139
29
Arsenic
arsenic exposure and the effects of confounding exposures cannot be
ruled out. Increased risks of similar outcomes have been described in
the population living close to the same smelter; there are no useful
exposure data for this population. A small case-control study in a
population living in central Texas, suggested an increased risk of
stillbirth in Hispanic women estimated to have had high exposure to
arsenic from living near a pesticides factory (Ihrig et al., 1998).
Exposure estimates were based on current home address; ‘high’
exposures were those estimated to be greater than 100 ng/m3. However,
no effect was found in children of non-Hispanic mothers.
2.4 Evaluations and recommendations by other
organisations
96. Guidelines and limits on exposure to arsenic in ambient air have
been published by the WHO, the EC, Defra and the Environment
Agency (EA). The US Environmental Protection Agency (EPA) and
the US Agency for Toxic Substances and Disease Registry (ATSDR)
have considered arsenic but not published guidelines. The UK
HSE and the American Conference of Governmental Industrial
Hygienists (ACGIH) have published limits and guidelines on
workplace exposures.
97. The WHO (2000) classify arsenic compounds as human carcinogens by
inhalation exposure. The unit risk for lung cancer is 1.5 x 10⁻³ per µg/m3
in air based on the results of studies of three cohorts of smelter
workers (WHO, 2000). Concentrations of 66 ng/m3, 6.6 ng/m3 or 0.66
ng/m3 equate respectively to excess lifetime risks of 1 in 10,000, 1 in
100,000 and 1 in 1,000,000.
98. The US EPA has estimated that the lifetime lung cancer risk fromexposure to airborne arsenic is 4.3 in 1000 for every increase in
exposure by 1 µg/m3. Concentrations of 20 ng/m3, 2 ng/m3 and
0.2 ng/m3 are predicted to increase life-time cancer risks of 1:10 000,
1:100 000 and 1:1000 000, respectively (US EPA, 1984).
99. The EC Position Paper (2000) and CSTEE (2001) proposed a limit
value for arsenic for non-cancer effects of 100 ng/m3. The limit value
for cancer effects proposed by the EC was 4–13 ng/m3. Following
discussion of the genotoxicity of arsenic, however, the EuropeanEnvironment Bureau (EEB) has proposed a value of 3 ng/m3 as a
suitable future revision of the limit. Industry argued that a limit value
of 50 ng/m3 would provide sufficient protection. The target value for
arsenic, “to be attained as far as possible”, in the Fourth Daughter
Directive on Ambient Air Quality is 6 ng/m3 and is effective from
31 December 2012 (Directive 2004/107//EC).
8/6/2019 Metals and Metal Lo Ids
http://slidepdf.com/reader/full/metals-and-metal-lo-ids 46/139
30
Expert Panel on Air Quality Standards
100. Defra and the EA (2002) proposed an index dose for arsenic for the
purposes of deriving Soil Guideline Value for contaminated land. The
Index Dose represents a dose that poses a minimal risk level from
possible airborne exposure to arsenic, with the additional requirement
that exposure should be as low as reasonably practicable (ALARP).
There was clear evidence of carcinogenic and genotoxic potential for
inorganic arsenic with no threshold for effect. The index dose was
based on the concentration believed to be associated with a 1 in
100,000 excess lifetime lung cancer risk (6.6 ng/m3, WHO, 2000).
Assuming a 70 kg adult inhales 20 m3 air per day, the index dose was
calculated to be 0.002 µg/kg body weight/day.
101. The Health and Safety Commission has set a workplace exposure
limit, time-weighted over 8 hours, of 100 µg/m3
for arsenic and itsinorganic compounds (HSE, 2005). The concentration was considered
to be well below that level at which a raised incidence of respiratory
tract cancer had been observed and below the NOAEL for respiratory
tract irritation.
102. The ACGIH Threshold Limit Value (TLV) for inorganic arsenic, a
concentration to which nearly all workers may be repeatedly exposed over
a working lifetime without adverse effects, is 10 µg/m3 (8 hour average).
2.5 Justification for air quality guideline
103. Air quality guidelines for four different adverse human health
endpoints might be considered for acute respiratory irritation, chronic,
non-malignant disease adverse reproductive effects and cancer.
104. Workplace measurements suggest that acute irritant effects are unlikely
at short-term exposures of less than 100 µg/m3
. There are workplaceexposure data, albeit scanty, for several chronic non-malignant adverse
health endpoints: peripheral neuropathy and Raynaud’s phenomenon.
The lowest exposure at which any of these has been reliably reported is
50 µg/m3.
105. Adverse reproductive effects have been reported in a very small number
of studies. In none can the effects of confounding exposures be ruled
out. Only one study – of stillbirths – provides an estimate of (current)
exposure to arsenic; this is reported to be greater than 100 ng/m3.
106. There is sufficient evidence to classify arsenic as a human carcinogen.
The most important effect for inhaled arsenic appears to be the
induction of lung cancer. There are insufficient human data on issues
such as genotoxicity to know whether or not there is a threshold of
exposure and whether or not the relationship between dose and risk
(especially at low exposures) is linear or otherwise.
8/6/2019 Metals and Metal Lo Ids
http://slidepdf.com/reader/full/metals-and-metal-lo-ids 47/139
31
Arsenic
107. The approach adopted here for standard-setting is directly analogous
to that used by EPAQS in setting standards for other chemical
carcinogens such as benzene and polycyclic aromatic hydrocarbons. It
uses data from studies of occupationally exposed workforces in three
non-UK smelters. The Panel considered the data from these studies to
be of equal validity. The lowest range of cumulative exposure that was
associated with a statistically significant increase in lung cancer risk
was less than 250 µg/m3.years in a Swedish workforce and less than 833
µg/m3.years and 750-2000 µg/m3.years in two US workforces. The
Panel considered it appropriate to take the lowest of these in order to
provide maximum protection of the public from ambient exposures.
108. The mid-point of the exposure range from the Swedish study is 125
µg/m3
years which converts to an average concentration of 3 µg/m3
overa 40 year working lifetime. If this concentration is considered as a
LOAEL then, following the precedent set in our report on polycyclic
aromatic hydrocarbons, division by a factor of 10 giving a
concentration of 0.3 µg/m3 (300 ng/m3) provides a notional NOAEL.
This has further been divided by a factor of 10 to allow for the greater
exposure duration of the general public and a further factor of 10 to
allow for the presence of susceptible groups from within the general
population. This leads to a recommended guideline value of 3 ng/m3.
109. The sensitivity of the proposed guideline value was examined by
comparing it with alternative approaches. One of these was based on
the concept of unit risk, which is the risk of outcome associated with
a lifetime exposure to 1 µg/m3. This is estimated from relative risks
obtained from epidemiological studies and is justified if it is believed,
as in the case of genotoxic agents, that there is no threshold and that
there is a linear exposure-response relationship. Essentially, it is an
extrapolation beyond the data to very low concentrations. This makes
it subject to assumptions about the shape of the exposure responsecurve. This approach is used by the WHO and other authorities for
carcinogenic compounds. The WHO estimated a unit risk of 1.5x10⁻³
per µg/m3, based on data from three copper smelters. A concentration
of 1 ng/m3 would be associated with an excess life-time risk of 1.5 in a
million. This level is close to that of 3 ng/m3 proposed by EPAQS using
a different method. Thus, it appears that the derived guideline is robust
to the method of derivation.
8/6/2019 Metals and Metal Lo Ids
http://slidepdf.com/reader/full/metals-and-metal-lo-ids 48/139
32
Expert Panel on Air Quality Standards
2.6 Recommendation
110. 3 ng/m3 total inorganic arsenic in the PM10 size fraction, as an annual
mean.
111. The Panel proposes that a maximum level of 3 ng/m3 should offer a high
level of protection against the risk of lung cancer and other health
effects. For this, as other carcinogens, the Panel advocates a progressive
reduction in airborne concentrations below this guideline.
References
ATSDR (2007). Toxicological Profile: arsenic. Agency for Toxic Substancesand Disease Registry. http://www.atsdr.cdc.gov/toxprofiles/tp2.html.
Beck, D., Slayton, T.M., Farr, D.W., Sved, D.W., Crecelius, E.A. and Holson,
J.F. (2002). Systemic uptake of inhaled arsenic in rabbits. Human &
Experimental Toxicology, 21: 205-215.
Beckman, G., Beckman L. and Nordenson, I. (1977). Chromosome
aberrations in workers exposed to arsenic. Environ Health Perspect 19(5-
6):145-146.
Bencko, V., Dvorak, V. and Symon, K. (1973). Organ retention of parentally
administered arsenic (labelled with 74As) in mice preliminarily exposed to the
element in drinking water: A study of arsenic intolerance. J Hyg Epidemiol
Microbiol Immunol, 17, 165–168.
Binks, K., Doll, R., Gillies, M., Holroyd, C., Jones, S.R., McGeoghegan, D.,
Scott, L., Wakeford, R. and Walker, P. (2005). Mortality experience of male
workers at a UK tin smelter. Occup Med 55:215-26.
Cawse, P.A. (1987). Trace and major elements in the atmosphere at rural
locations in Great Britain, 1972-1981. In: Pollutant Transport and Fate in
Ecosystems. Special Publication Number 6 of The British Ecological Society.
Blackwell Scientific Publications, Oxford.
CEH (2006). Heavy Metal Monitoring Network. The Centre for Ecology &
Hydrology. www.heavymetals.ceh.ac.uk
Cheng, C.N. and Focht, D.D. (1979). Production of arsine and methylarsines
in soil and in culture. Appl Environ Microbiol. 38:494-498.
Clewell, H.J., Gentry, P.R., Barton, H.A., Shipp, A.M., Yager, J.W. and
Andersen, M.E. (1999). Requirements for a biologically realistic cancer risk
assessment for inorganic arsenic. Int J Toxicol, 18, 131–147.
8/6/2019 Metals and Metal Lo Ids
http://slidepdf.com/reader/full/metals-and-metal-lo-ids 49/139
33
Arsenic
Coles, D.G., Ragaini, R.C., Ondov, J.M., Fisher, G.L., Silberman, D. and
Prentice, B.A. (1979). Chemical studies of stack fly ash from a coal-fired
power plant. Environ Sci Technol, 13(4): 455 459.
Conolly, C.M. (2003). Trace and Major Elements in the Atmosphere at Rural
Locations in the United Kingdom: Summary 2002. Netcen.
AEAT/ENV/R/0804 Issue 1.
CSTEE (2001). Opinion on: Position Paper on Ambient Air Pollution by
Arsenic Compounds, Final version. EU Scientific Committee on Toxicity,
Ecotoxicity and the Environment. Opinion expressed at the 24th CSTEE
Plenary, Brussels, June 2001.
Dore, C.J., Watterson, J.D., Murrells, T.P., Passant, N.R., Hobson, M.M.,Baggott, S.L., Thistlethwaite, G., Goodwin, J.W.L., King, K.R., Adams, M.,
Walker, C., Downes, M.K., Coleman, P.J., Stewart, R.A., Wagner, A.,
Sturman, J., Conolly, C., Lawrence, H., Li, Y., Jackson, J., Bush, T., Grice, S.
and Brophy, N. (2006). UK Emissions of Air Pollutants 1970 to 2004.
National Atmospheric Emissions Inventory, AEA Energy & Environment.
AEAT/ENV/R/2359. ISBN 0-9554823-0-5.
Enterline, P.E., Day, R. and Marsh, G.M. (1995). Cancers related to exposure
to arsenic at a copper smelter. Occup Environ Med 52(1):28-32.
EA (2002). Soil guideline values for arsenic contamination. Environment
Agency, Bristol, UK.
EC (2000). Ambient Air Pollution by As, Cd and Ni compounds,
Position Paper, Final Version, October 2000. European Commission,
DG Environment, Working Group on Arsenic, Cadmium and
Nickel compounds.
Gochfeld, M. (1995). Chemical agents. In: Brook, S.M., Gochfeld, M.,
Jackson, R.J., Herzstein, J. and Schenker, M.B., eds, Environmental
Medicine, St Louis, USA, Mosby Publishers, 610–611.
Ferreccio, C., Gonzáles, C., Solari, J. and Noder, C. (1995). Cáncer
bronchopulmonar entre trabajadores expuestos a arsénico. Rev Med Chile
124:119-123.
HSE (1986). Toxicity review TR16: inorganic arsenic compounds. HSE
Books. ISBN 011 8838482.
HSE (2005) Environmental Hygiene Series. Guidance Note. Occupational
exposure limits EH 40 HSE Books. Health and Safety Executive.
8/6/2019 Metals and Metal Lo Ids
http://slidepdf.com/reader/full/metals-and-metal-lo-ids 50/139
34
Expert Panel on Air Quality Standards
Hertz-Picciotto, I. and Smith, A.H. (1993). Observations on the dose-
response curve for arsenic exposure and lung cancer. Scand J Work Environ
Health 19: 217-226.
Holland, R.H., McCall, M.S. and Lanz, H.C. (1959). A study of inhaled
arsenic in man. Cancer Res 19: 1154-1156.
Hughes, M.F., Menache, M. and Thompson, D.J. (1994). Dose-Dependent
Disposition of Sodium Arsenate in Mice Following Acute Oral Exposure.
Fundam Appl Toxicol. 22(1):80-89.
Ihrig, M.M., Shalat, S.L. and Baynes, C. (1998). A hospital-based case-
control study of stillbirths and environmental exposure to arsenic using and
atmospheric dispersion model linked to a geographical information system.Epidemiology 9(3):290-294.
IEH (2000). Arsenic In Air: A Baseline Review. MRC Institute for
Environment and Health.
IPCS (2001). Arsenic and arsenic compounds. International Programme on
Chemical Safety. Environmental Health Criteria 224, World Health
Organization, Geneva. (www.inchem.org/documents/ehc/ehc/ehc224.htm).
Järup, L., Pershagen, G. and Wall, S. (1989). Cumulative arsenic exposure
and lung cancer in smelter workers: a dose-response study. Am J Ind
Med 15:31-41.
Jensen, G.E. and Hansen, M.L. (1998). Occupational arsenic exposure and
glycosylated haemoglobin. Analyst123(1):77-80.
Kelley, J.A., Jaffe, D.A., Baklanov, A. and Mahura, A. (1995). Heavy metals
on the Kola Peninsula: aerosol size distribution. Sci Total Environ,160/161: 135–138.
Lagerkvist, B., Linderholm, H. and Nordberg, G.F. (1986). Vasospastic
tendency and Raynaud's phenomenon in smelter workers exposed to arsenic.
Environ Res 39:465-474.
Lagerkvist, B.E.A., Linderholm, H. and Nordberg, G.F. (1988). Arsenic and
Raynaud's phenomenon: vasospastic tendency and excretion of arsenic in
smelter workers before and after the summer vacation. Int Arch Occup
Environ Health 60:361-364.
Lagerkvist, B.J. and Zetterlund, B. (1994). Assessment of exposure to arsenic
among smelter workers: A five-year follow-up. Am J Ind Med 25(4):477-488.
8/6/2019 Metals and Metal Lo Ids
http://slidepdf.com/reader/full/metals-and-metal-lo-ids 51/139
35
Arsenic
Lee, D.S., Garland, J.A. and Fox, A.A. (1994). Atmospheric concentrations
of trace elements in urban areas of the United Kingdom. Atmospheric
Environment 28, 2691-2713.
Lee-Feldstein, A. (1986). Cumulative exposure to arsenic and its relationship
to respiratory cancer among copper smelter employees. J Occup Med
28(4):296-302.
Lundgren, K.D. (1954). Damage of respiratory organs in smelters. Nord Hyg
Tidskr. 3-4:66-82.
Marafante, E. and Vahter, M. (1987). Solubility, retention and metabolism of
intratracheally and orally administered inorganic arsenic compounds in the
hamster. Environ Res, 47, 72–78.
Marafante, E., Vahter, M. and Envall, J. (1985). The role of the methylation
in the detoxification of arsenate in the rabbit. Chem Biol Interact, 56, 25–238.
Marcus, W.L. and Rispin, A.S. (1988). Threshold carcinogenicity using
arsenic as an example. In: Cothern, C.R., Mehlmann, M.A. and Marcus,
W.L., eds, Risk Assessment and Risk Management of Industrial and
Environmental Chemicals, Princeton NJ, USA, Princeton Science &
Technology Co, 133–158.
Meza, M.M., Yu, L., Rodriguez, Y.Y., Guild, M., Thompson, D., Gandolfi,
A. and Klimecki, W.T. (2005). Developmentally Restricted Genetic
Determinants of Human Arsenic Metabolism: Association between Urinary
Methylated Arsenic and CYT19 Polymorphisms in Children Environ Health
Perspect 113:775-781.
Mohamed K.B. (1998). Occupational contact dermatitis from arsenic in a
tin-smelting factory. Contact Dermatitis 38:224-225.
Nordenson I., Sweins, A. and Beckman, L. (1981). Chromosome aberrations
in cultured human lymphocytes exposed to trivalent and pentavalent arsenic.
Scand J Work Environ Health 7:277-281.
Nordström, S., Beckman, L. and Nordenson, I. (1978). Occupational and
environmental risks in and around a smelter in northern Sweden. I.
Variations in birthweight. Hereditas 88:43-46.
Nordström, S., Beckman, L. and Nordenson, I. (1979a). Occupational and
environmental risks in and around a smelter in northern Sweden. V.
Spontaneous abortion among female employees and decreased birth weight
in their offspring. Hereditas 90:291-296.
8/6/2019 Metals and Metal Lo Ids
http://slidepdf.com/reader/full/metals-and-metal-lo-ids 52/139
36
Expert Panel on Air Quality Standards
Nordström, S., Beckman, L. and Nordenson, I. (1979b). Occupational and
environmental risks in and around a smelter in northern Sweden. VI.
Congenital malformations. Hereditas 90:297-302.
NPL (2006). Results available from the Air Quality Archive. National
Physical Laboratory. www.airquality.co.uk/archive/data_and_statistics.php
Parris, G.E. and Brinckman, F.E. (1976) Reactions which relate to
environmental mobility of arsenic and antimony. II. Oxidation of
trimethylarsine and trimethylstibine. Environ Sci Technol, 10(12): 1128–1134.
Perry, K., Bowler, R.G., Buckell, H.M., Druett, H.A. and Schilling, R.S.F.
(1948). Studies in the incidence of cancer in a factory handling inorganic
compounds of arsenic--II: clinical and environmental investigations. Br J IndMed 5:6-15.
Pershagen, G., Lind, B. and Bjorklund, N.E. (1982). Lung retention and
toxicity of some inorganic arsenic compounds. Environ Res, 29, 425–434.
Pershagen, G. (1985). Lung cancer mortality among men living near an
arsenic-emitting smelter. Am J Epidemiol 122:684-694.
Pinto, S.S. and McGill, C.M. (1953). Arsenic trioxide exposure in industry.Ind Med Surg 22(7):281-287
Pinto, S.S., Varner, M.O., Nelson, K.W., Labbe, A.L. and White, L.D. (1976).
Arsenic trioxide absorption and excretion in industry. J Occup Med
18(10):677-680.
Rabano, E.S., Castillo, N.T., Torre, K.J. and Solomon, P.A (1989). Speciation
of arsenic in ambient aerosols collected in Los Angeles. J Air Waste Manage
Assoc, 39(1): 76–80.
Rossing, P. (1941). Zur Frage der Leberschidigung, insbesondere der
Leberzirrhose nach Arsenvergiftung. Arch. Gewerbepathol Gewerbehyg., 11;
131-142.
Rudel, R., Slayton, T.M. and Beck, B.D. (1996). Implications of arsenic
genotoxicity for dose response of carcinogenic effects. Regul Toxicol
Pharmacol.23:87-105.
Salmon, L., Atkins, D.H.F., Fisher, E.M.R., Healy, C. and Law, D.V., (1978).
Retrospective trend analysis of the content of U.K. air particulate material
1957-1974. Science of the Total Environment 9, 161-200.
8/6/2019 Metals and Metal Lo Ids
http://slidepdf.com/reader/full/metals-and-metal-lo-ids 53/139
37
Arsenic
Satterlee, H.S. (1958). Sources of error in microdetermination of arsenic;
conditions which hinder studies of arsenic metabolism and which invalidate
estimates of arsenic in the atmospheric environment. AMA Arch Ind Health.
17:218-29.
Schoen, A., Beck, B., Sharma, R. and Dube, E. (2004). Arsenic toxicity at
low doses: epidemiological amd mode of action considerations. Toxicology
and Applied Pharmacology, 198: 253-267.
Squibb, K.S. and Fowler B.A. (1983). The toxicity of arsenic and its
compounds. In: Fowler, B.A., ed, Biological and Environmental Effects of
Arsenic: Topics in Environmental Health, Vol 6, Amsterdam, Holland, Elsevier.
Smith, C.J., Livingston, S.D. and Doolittle, D.J. (1997). An internationalliterature survey of “IARC group I carcinogens” reported in mainstream
cigarette smoke. Food Chem Toxicol 35(10-11):1107-1130.
Stevens, J.T., Hall, L.L. and Farmer, J.D. (1977). Disposition of 14C and/or
74As-cacodylic acid in rats after intravenous, intratracheal or per-oral
administration. Environ Health Perspect, 19, 151–157.
Styblo, M., Drobna, Z., Jaspers, I., Lin, S. and Thomas, D.J. (2002). The role
of biomethylation in toxicity and carcinogenicity of arsenic: a researchupdate. Environ Health Perspect, 110 (Suppl. 5): 767-771.
Tamaki, S. and Frankenberger, W.T. Jr. (1992). Environmental biochemistry
of arsenic. Rev Environ Contam Toxicol. 124:79-110.
US EPA. (1984). Health Assessment Document for Inorganic Arsenic.
Prepared by the Office of Research and Development, Environmental
Criteria and Assessment Office, Research Triangle Park, NC.
Vahter, M. (1986). Environmental and occupational exposure to Inorganic
arsenic. Acta Pharmacol Toxicol 59: 31-34.
Vahter, M., Marafante, .E and Dencker, L. (1983). Metabolism of
arsenobetaine in mice, rats and rabbits. Sci Total Environ, 30, 197–211.
Vahter, M. and Marafante, E. (1985). Reduction and binding of arsenate in
marmoset monkeys. Arch Toxicol 57:119-124.
Vahter, M., Friberg, L., Rahnster, B., Nygren, A. and Nolinder, P. (1986).
Airborne arsenic and urinary excretion of metabolites of inorganic arsenic
among smelter workers. Int Arch Occup Environ Health. 57:79-91.
8/6/2019 Metals and Metal Lo Ids
http://slidepdf.com/reader/full/metals-and-metal-lo-ids 54/139
38
Expert Panel on Air Quality Standards
Vahter, M. and Marafante, E. (1987). Effects of low dietary intake of
methionine, choline or proteins on the biotransformation of arsenite in the
rabbit. Toxicol Lett 37:41-46.
Vincent, K. and Passant, N. (2006). Assessment of Heavy Metal
Concentrations in the United Kingdom. AEA Technology, Netcen.
AEAT/ENV/R/2013.
Waldman, J.M., Lioy, P.J., Zelenka, M., Jing, L., Lin, Y.N., He, Q.C., Qian,
Z.M., Chapman, R. and Wilson, W.E. (1991). Wintertime measurements of
aerosol acidity and trace elements in Wuhan, a city in central China. Atmos
Environ, 25B(1): 113–120.
Wanibuchi, H., Salim, E.I., Kinoshita, A., Shen, J., Wei M., Morimura, K.,Yoshida, K., Kuroda, K., Endo, G. and Fukushima, S. (2004).
Understanding arsenic carcinogenicity by the use of animal models.
Toxicology and Applied Pharmacology, 198: 366-376.
Webb, D.R., Sipes, I.G. and Carter, D.E. (1984). In vitro solubility and in
vivo toxicity of gallium arsenide. Toxicol Appl Pharmacol, 76, 96–104.
WHO (2000). WHO Air quality guidelines for Europe, 2nd edition.
Copenhagen, World Health Organisation Regional Office for Europe.
Yamanaka, K., Kato, K., Mizoi, M., An, Y., Takabayashi, F., Nakano, M.,
Hoshina, M. and Okada, S. (2004). The role of active arsenic species
produced by metabolic reduction of dimethylarsinic acid in genotoxicity and
tumorigenesis. Toxicology and Applied Pharmacology, 198: 385-393.
8/6/2019 Metals and Metal Lo Ids
http://slidepdf.com/reader/full/metals-and-metal-lo-ids 55/139
39
Chapter 3
Nickel
3.1 Background
3.1.1 Basic chemical information
112. Nickel is a silvery white lustrous, hard metal, one of a group of
elements known as transition metals. It shares magnetic properties
with iron and cobalt and is the basis of several alloys, the most
important of which is stainless steel. Nickel metal is also used in its
own right in items such as jewellery and watch casings and as a plating
agent to give a bright corrosion-free finish. It also finds use in weldingrods, coinage, batteries and chemical catalysts. It occurs naturally in
the environment in air, water and soil. The principal commercial ores
are the sulphide and oxide/silicate.
113. Nickel can exist in several oxidation (valence) states, but the divalent
form is virtually ubiquitous in the environment. Salts can be water
soluble (nitrate, sulphate, chloride) or insoluble (oxides, sulphides).
Nickel salts and metal readily form complexes with the amino acid
histidine, both free and when combined into protein and this factorprobably accounts for the tendency to provoke hypersensitive (allergic)
reactions in some individuals.
114. Nickel is established as an essential trace element. In animals,
deficiency may affect reproduction (Yokoi et al., 2003) but this has not
been demonstrated in man, probably because the universal occurrence
in food precludes deficiency symptoms (WHO, 2000).
115. There are no data on the chemical forms of nickel from natural sourcesin the atmosphere (WHO, 1991). If likely sources are considered then
part of airborne nickel may exist as pentlandite ((FeNi)9S8) and
garnierite (a silicate mixture) (Schmidt and Andren, 1980). The chemical
composition of nickel compounds released from man-made sources
differs from that from natural sources because of the different processes
involved. Studies by Hansen and Fisher (1980) and Hansen et al. (1984)
indicated that most of the nickel present in fly ash particulate matter
8/6/2019 Metals and Metal Lo Ids
http://slidepdf.com/reader/full/metals-and-metal-lo-ids 56/139
40
Expert Panel on Air Quality Standards
(from coal combustion) was soluble and associated primarily with
sulphate. Thus, nickel emissions to atmosphere from coal and oil
combustion are likely to be composed mainly of (soluble) nickel
sulphate, with smaller amounts of nickel oxide and nickel combined
with other metals in complex oxides. Alterations in the chemical forms,
following distribution in the atmosphere, have not been investigated.
116. The distribution of nickel among suspended particulate matter in air
will determine the fraction that is inhalable. Data on the size
distribution of nickel particles are limited. Lee and von Lehmden
(1973) reported mass median diameters of nickel particles in urban air
in the range of 0.83-1.67 µm, 28-55% of the particulate matter being
<1 µm. A more recent summary of size distribution of trace elements
in different areas yielded a (similar) mass median diameter for nickelparticles of 0.98 µm (Milford and Davidson, 1985). Nickel was found
to be most concentrated in the smallest particulate matter emitted from
coal-fired power plants (Natusch et al., 1974). Particulate matter of
mass median diameter 0.65-1.1 µm contained 1600 mg nickel/kg while
4.7-11 µm particulate matter contained about 400 mg nickel/kg.
3.1.2 Sources of nickel in the UK atmosphere
117. The main source of nickel emissions to the air in the UK has been thecombustion of oil-based fuels in power stations, refineries, industry and
for domestic heating (Dore et al., 2005). The main sources reported in
the UK National Atmospheric Emissions Inventory for 2004 include
emissions from refineries, industry, shipping and non-road mobile
machinery. Combustion of fuel oil at refineries, in industry and for
shipping contributed 66% of the national total in 2004. Combustion of
petroleum coke at refineries contributed 17% and combustion of gas oil
for shipping and non-road mobile machinery contributed 7%. Emission
from metal industry sources make up a relatively small percentage of total UK emissions (4%) but may constitute the most important source
in the vicinity of specific industrial plant.
118. Nickel is emitted in many different forms. Approximately 55% of UK
emissions in 2004 were estimated to be soluble nickel salts such as
sulphates and chlorides and this constituted the highest percentage for
most combustion emission sources (combustion sources are assumed
to emit 58% as soluble nickel salts, 39% as nickel oxides, 3% as nickel
sulphides and 0.5% as nickel carbonyl). Approximately 40% of
emissions were estimated to be as nickel oxides, including the majority
of emissions from metal industry processes (100% from the iron and
steel industry and 50% of the emissions from non-ferrous metal
industries, the remaining 50% is assumed to be metallic nickel).
Emission of nickel sulphides contributed about 3%, metallic nickel
about 1.5% and emissions of nickel carbonyl contributed only 0.5%.
The speciation of emissions is subject to considerable uncertainty.
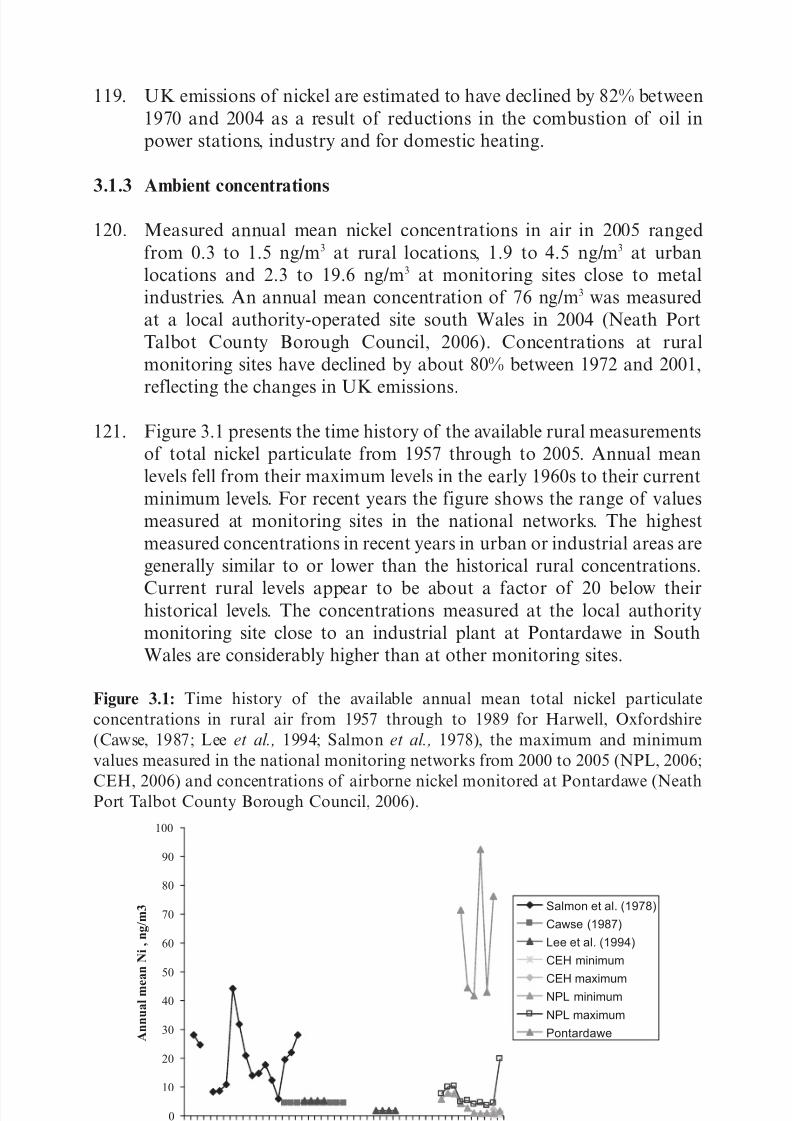
8/6/2019 Metals and Metal Lo Ids
http://slidepdf.com/reader/full/metals-and-metal-lo-ids 57/139
41
119. UK emissions of nickel are estimated to have declined by 82% between
1970 and 2004 as a result of reductions in the combustion of oil in
power stations, industry and for domestic heating.
3.1.3 Ambient concentrations
120. Measured annual mean nickel concentrations in air in 2005 ranged
from 0.3 to 1.5 ng/m3 at rural locations, 1.9 to 4.5 ng/m3 at urban
locations and 2.3 to 19.6 ng/m3 at monitoring sites close to metal
industries. An annual mean concentration of 76 ng/m3 was measured
at a local authority-operated site south Wales in 2004 (Neath Port
Talbot County Borough Council, 2006). Concentrations at rural
monitoring sites have declined by about 80% between 1972 and 2001,
reflecting the changes in UK emissions.
121. Figure 3.1 presents the time history of the available rural measurements
of total nickel particulate from 1957 through to 2005. Annual mean
levels fell from their maximum levels in the early 1960s to their current
minimum levels. For recent years the figure shows the range of values
measured at monitoring sites in the national networks. The highest
measured concentrations in recent years in urban or industrial areas are
generally similar to or lower than the historical rural concentrations.
Current rural levels appear to be about a factor of 20 below theirhistorical levels. The concentrations measured at the local authority
monitoring site close to an industrial plant at Pontardawe in South
Wales are considerably higher than at other monitoring sites.
Figure 3.1: Time history of the available annual mean total nickel particulate
concentrations in rural air from 1957 through to 1989 for Harwell, Oxfordshire
(Cawse, 1987; Lee et al., 1994; Salmon et al., 1978), the maximum and minimum
values measured in the national monitoring networks from 2000 to 2005 (NPL, 2006;
CEH, 2006) and concentrations of airborne nickel monitored at Pontardawe (NeathPort Talbot County Borough Council, 2006).
0
10
20
30
40
50
60
70
80
90
100
1
9
5
7
1
9
6
1
1
9
6
5
1
9
6
9
1
9
7
3
1
9
7
7
1
9
8
1
1
9
8
5
1
9
8
9
1
9
9
3
1
9
9
7
2
0
0
1
2
0
0
5
A n n u a l m e a n N i , n g / m 3 Salmon et al. (1978)
Cawse (1987)
Lee et al. (1994)
CEH minimum
CEH maximumNPL minimum
NPL maximum
Pontardawe
8/6/2019 Metals and Metal Lo Ids
http://slidepdf.com/reader/full/metals-and-metal-lo-ids 58/139
42
Expert Panel on Air Quality Standards
3.1.4 Human exposures
122. The major non-occupational source of human exposure to nickel is via
food with further contributions from drinking water and air. Cigarette
smoke also contains significant quantities of nickel. Release to
atmosphere from natural sources (mainly windblown dust, volcanoes
and vegetation) has been estimated (Duce et al., 1991; Giusti et al.,
1993) at 30,000 tonnes (as nickel) annually, with about 1.5 times that
quantity coming from anthropogenic sources.
123. Food from all sources contains trace quantities of nickel. Levels in
most foods are similar and generally below 1 ppm (1 mg/kg) but
nuts and cocoa may have significantly higher levels (IARC, 1990).
Daily exposure from the diet has been estimated to range from about70 – 160 µg for both USA and European diets (ATSDR, 2003), with
typical daily exposures from drinking water and air of 8 and 0.4 µg,
respectively. The WHO (1991) reported higher values, with 200 – 300
µg/day considered as the range of mean oral intakes for a Western
adult. Exposures from all sources may increase in areas close to
significant sources of the metal such as refineries. In Sudbury, Ontario,
mean daily exposure from drinking water and air was reported to
average 140 and 15 µg respectively. Mainstream cigarette smoke
contains 0.04 – 0.58 µg/cigarette (WHO, 2000): assuming 50%absorption a smoker consuming 20 cigarettes/day will increase his/her
airborne exposure by up to 6 µg, or about 15 times the ambient value.
Other potential sources of non-occupational nickel exposure are from
watches and jewellery in contact with the skin, (negligible quantities
are absorbed by this route but the exposures can be important for those
sensitised to the metal) and from leaching and corrosion of nickel in
prosthetic devices.
124. Occupational exposures to nickel are highest for those involved inproduction (mining and refining), processing and use, but a wide range
of trades are exposed to a lesser extent from using/repairing
components or devices containing nickel or its alloys, especially
stainless steel. In all cases the inhalation route seems dominant when
considering health effects, with dermal exposures important for those
individuals with hypersensitivity: Oral exposures are of less
significance, even though this route is quantitatively dominant.
125. In mining and refining historical exposures have been very high with
values of up to 100 mg/m3 recorded. These are exceptional: a more
realistic estimate of historical exposures is in the region of 1-5 mg/m3.
The chemical form of nickel present in workplace atmospheres is not
always easy to determine, but generally the highest exposures have
been to the less soluble compounds. These may be retained in the lung
for long periods resulting in significantly increased total body burden.
8/6/2019 Metals and Metal Lo Ids
http://slidepdf.com/reader/full/metals-and-metal-lo-ids 59/139
43
Nickel
The normal body burden of nickel approximates 0.1 µg/g in
non-occupationally exposed individuals, with much of this in the lung.
Svenes and Andersen (1998) reported that the nickel content of
lung tissue taken from a group of ex- nickel refinery workers was 50 ±
150 µg/g (dry weight), compared with 0.74 ± 0.44 µg/g in a similar
group unconnected with the industry.
126. There have been no specific studies to determine whether children are
more susceptible than adults to the effects of nickel. Limited evidence
of an increased susceptibility from dermal exposures is considered
more likely to reflect potential for exposure (via body piercing) than
increased sensitivity (ATSDR, 2003).
3.2 Absorption and excretion
3.2.1 Pulmonary absorption
127. The measured particle size for atmospheric nickel indicates that most
of the inhaled particulate matter will deposit in the lung (WHO, 2000)
with up to 40% being retained in the deep lung where clearance is more
prolonged. There are marked differences in the solubility of nickel
compounds. In general, nickel chloride and nickel sulphate are soluble
while nickel oxide and nickel subsulphide are insoluble. Soluble nickel
compounds are rapidly removed from the lung (Carvalho and Ziemer,
1982). Menzel et al. (1987) demonstrated a saturable clearance
mechanism for soluble nickel compounds from rat lungs, calculating a
maximum clearance velocity of 34.6 ng/g of lung tissue per hour for
nickel chloride. In contrast approximately 50% of a dose of nickel
oxide, which is much less soluble, was still present in the lungs of
golden hamsters after 45 days. Moreover, only 10% nickel sulphide,
which is of intermediate solubility, is retained after 35 days (Valentineand Fisher, 1984).
3.2.2 Metabolism
128. The biological half-life of nickel depends on the compound tested and
thus its solubility as discussed above. Once in blood, nickel binds to the
blood proteins, albumin and α-2-macroglobulin. The bound nickel can
exchange with free histidine, leading to a pool of low molecular weight
nickel-L-histidine complexes, which can cross biological membranes.Tissue based metabolism of nickel has been extensively studied in
animals and has been shown to involve oxidation/reduction (redox)
reactions generating the trivalent form, nickel (Ni3+). The extent of
redox cycling within different tissues is likely to be influenced by the
availability of other oxidising and reducing species.
8/6/2019 Metals and Metal Lo Ids
http://slidepdf.com/reader/full/metals-and-metal-lo-ids 60/139
44
Expert Panel on Air Quality Standards
3.2.3 Tissue distribution and excretion
129. Most soluble forms of inhaled nickel are excreted in urine. Thus high
levels of (insoluble) nickel oxide in air give relatively low plasma and
urine concentrations but high levels in the nasal mucosa and
presumably the lung (Torjussen and Anderson, 1979; Høgetveit et al.,
1978). As nickel-induced cancer of the lung is a major cause for
concern, nickel absorbed into the blood could be considered of less
significance than that retained in the lung, although local effects may
be mediated by soluble forms.
3.3 Health effects/toxicology
3.3.1 Acute and chronic effects
130. Studies in animals have shown that chronic inflammation of the lung
and/or nasal passages follows repeated dose inhalation of a wide range
of nickel compounds. The effects seen are qualitatively similar in both
rats and mice. However, the no observed adverse effects level (NOAEL)
established in the various reported studies shows wide variation, which
in part reflects the solubility of the compound tested: more soluble
compounds show NOAEL about an order of magnitude lower than
the insoluble salts. The results of several studies have been summarised
by ASTDR (2003). In a 13 week study, nickel sulphate induced an
inflammatory response in the lungs of female rats with a NOAEL of
0.06 mg/m3. However, in the chronic (two year) studies conducted by
the USA National Toxicology programme (NTP, 1996 a,b,c) both rats
and mice showed limited signs of respiratory irritation/inflammation
at 0.03 mg/m3 (the lowest dose tested), although the effect was
equivocal and confined to the few rats examined at interim sacrifice
(NTP, 1996b).
131. Apart from nickel sensitivity, which is common in the general
population, non-cancer effects in humans have been reported only in
workers involved in the production or intensive use of nickel-
containing substances. Exposure to nickel by inhalation causes adverse
effects, including lung irritation, and pneumonia. At very high
concentrations, acute inhalation has been reported to cause severe
pulmonary irritation. A worker exposed to an estimated 382 mg/m3 of
metallic nickel died from adult respiratory distress syndrome. Acuteinhalation effects of nickel carbonyl fall into two categories, immediate
and delayed (Defra and EA, 2002a; IEH, 2003). The immediate
response includes headache, nausea, dizziness, vomiting, insomnia and
irritability. In mild cases this resolves within a day; with more severe
exposures, typically in excess of 50 mg/m3, symptoms such as chest
pain, dyspnoea (shortage of breath) and oedema (fluid in the lung) can
occur 12-120 hours after exposure (EC, 2000; WHO, 1991). Severe
8/6/2019 Metals and Metal Lo Ids
http://slidepdf.com/reader/full/metals-and-metal-lo-ids 61/139
45
Nickel
lung damage may occur at high concentrations, but non-occupational
exposure to nickel carbonyl is unlikely.
132. Evidence linking chronic exposure to non-cancer mortality has been
mixed and difficult to interpret due to co-exposures to other
substances (ATSDR, 2003). Chronic exposure has been linked to
irritation and damage to the upper and lower respiratory tract
manifest as nasal septal damage, chronic sinusitis, chronic bronchitis,
reduced ventilatory capacity and pulmonary fibrosis (Kilburn et al.,
1990; Berge and Skyberg, 2003). Occupational exposure has been
associated with asthma in a few reports; this is thought to be caused by
either primary irritation of the airways or an allergic response. Nickel
sensitisation may occur by inhalation, as well as by oral or dermal
routes, at least after occupational exposures. Once sensitised, contactwith a small amount of nickel is sufficient to cause dermatitis. The
mechanism is believed to relate to both allergy and irritation.
Occupational exposure has not been associated with other health
outcomes, apart from some renal and immunological abnormalities of
uncertain clinical significance.
133. In a recent paper Lippmann et al. (2006) showed that mice, specially
bred to be susceptible to atherosclerosis when fed a high fat diet, were
exposed to collected airborne particulate matter there were significantreductions in heart rate which correlated with the nickel content of the
particulate matter. Significant changes were associated with 14 days
when peak nickel concentrations in the particulate matter
(approximately 175 ng/m3) were seen compared to the average value of
43 ng/m3. In a previous investigation in rats Campen et al. (2001)
reported that inhalation of nickel aerosol for six hours/day for four
days caused delayed effects including slowed and irregular heart beat
and reduced body temperature at concentrations > 1.2 mg/m3.
In contrast, no significant effect on heart rate was reported in beagledogs following three hours inhalation exposure on three successive
data to a nickel sulphate aerosol at a concentration of 0.05 mg/m3
(Muggenburg et al., 2003). In a study of boilermakers, Magari et al.
(2002) found evidence of an association between exposure to transition
metals and heart rate variability, although the specific effect associated
with nickel was small and not statistically significant.
3.3.1.1 Hypersensitivity
134. Nickel and its soluble salts are potent skin sensitisers with allergic skin
reactions being the most common health effect (HSE, 1997; WHO,
1991). Skin sensitisation to nickel, identified by patch testing or clinical
history, affects 10-20% of the population, with a higher prevalence in
women which is thought to reflect an increased exposure to nickel in
jewellery. Important risk factors are skin contact with jewellery, skin
8/6/2019 Metals and Metal Lo Ids
http://slidepdf.com/reader/full/metals-and-metal-lo-ids 62/139
46
Expert Panel on Air Quality Standards
piercing and handling of coins and other nickel-containing products.
Rare cases of asthmatic lung disease have been reported after
occupational exposure to inorganic nickel compounds (WHO, 1991)
but there is no evidence that airborne nickel causes allergic reactions in
the general population.
3.3.1.2 Mechanism(s) of acute toxicity
135. Although nickel compounds cause the oxidation of lipids (Stinson
et al., 1992; Athar et al., 1987), proteins (Zhuang et al., 1994) and
nucleic acids (Stinson et al., 1992, Lynn et al., 1997), intracellular
radical production (Huang et al., 1994a,b), and glutathione depletion
(Rodriguez et al., 1991; Herrero et al., 1993; Li et al., 1993) there is
little evidence that free nickel undergoes redox cycling reactions, incontrast to metals such as iron, copper, chromium, vanadium and
cobalt. Hydrated Ni2+ ions react slowly with hydrogen peroxide to form
hydroxyl radicals and are not efficient catalysts of peroxide
decomposition. Their activity in models where lipid, protein and DNA
oxidation have been observed reflects the binding of nickel to
biological ligands such as the imidazole nitrogen of histidine that
reduces its oxidation potential allowing it to be oxidised to Ni3+ by
strong oxidants, such as hydrogen peroxide and organic
hydroperoxides (Datta et al., 1992). This ligand-dependent Ni2+/Ni3+
redox cycling of nickel results in the formation of oxygen radicals via
Fenton-type reactions (Klein et al., 1991; Lin et al., 1992). Consistent
with this view, studies have shown that the formation of alkyl, alkoxyl
and peroxyl radicals by nickel and cumene hydroperoxide occurs only
in the presence of glutathione, carnosine, homocarnosine or anserine
(Shi et al., 1992). This ligand-dependent reaction may also occur with
histones: these nuclear protein-Ni2+ complexes permit hydroxyl radical
generation in the presence of hydrogen peroxide resulting in extensive
DNA base modification (Nackerdien et al., 1991). The above reactions,which are summarised schematically in Figure 3.2, are associated with
soluble nickel salts and may be important in the induction of an
inflammatory response. Further evidence suggests that insoluble nickel
particulate compounds, including the sulphide and subsulphide, can
also induce the release of reactive oxygen species from phagocytic cells
(Costa and Mollenhauer, 1980). These insoluble forms of nickel have
been shown to be more carcinogenic than soluble nickel and in vitro
studies have demonstrated that they induce greater intracellular free
radical production than soluble nickel salts (Huang et al., 1994a,b).
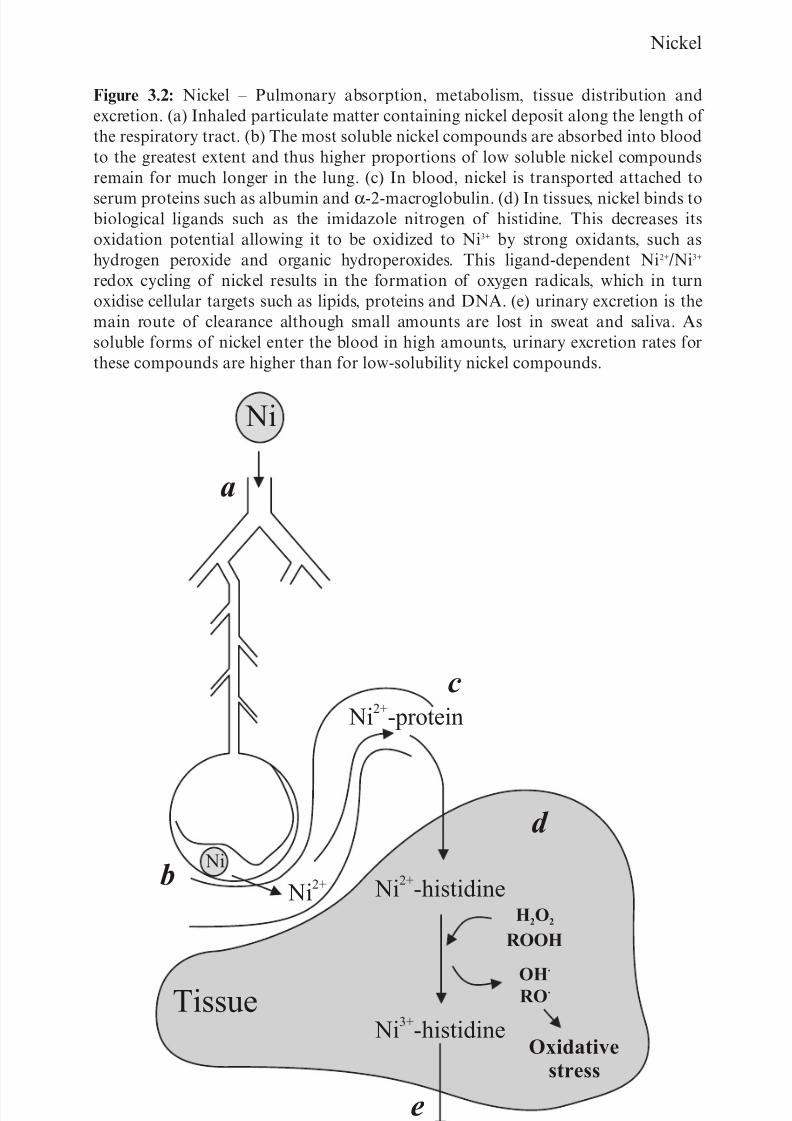
8/6/2019 Metals and Metal Lo Ids
http://slidepdf.com/reader/full/metals-and-metal-lo-ids 63/139
Nickel
Figure 3.2: Nickel – Pulmonary absorption, metabolism, tissue distribution and
excretion. (a) Inhaled particulate matter containing nickel deposit along the length of
the respiratory tract. (b) The most soluble nickel compounds are absorbed into blood
to the greatest extent and thus higher proportions of low soluble nickel compounds
remain for much longer in the lung. (c) In blood, nickel is transported attached to
serum proteins such as albumin and α-2-macroglobulin. (d) In tissues, nickel binds tobiological ligands such as the imidazole nitrogen of histidine. This decreases its
oxidation potential allowing it to be oxidized to Ni3+ by strong oxidants, such as
hydrogen peroxide and organic hydroperoxides. This ligand-dependent Ni2+/Ni3+
redox cycling of nickel results in the formation of oxygen radicals, which in turn
oxidise cellular targets such as lipids, proteins and DNA. (e) urinary excretion is the
main route of clearance although small amounts are lost in sweat and saliva. As
soluble forms of nickel enter the blood in high amounts, urinary excretion rates for
these compounds are higher than for low-solubility nickel compounds.
Ni
Ni
Ni2+-protein
Ni2+-histidine
Ni3+-histidine
Excretion
Tissue
H2O
2
ROOH
Oxidative
stress
OH·
RO·
Ni2+
a
c
b
d
e
47
8/6/2019 Metals and Metal Lo Ids
http://slidepdf.com/reader/full/metals-and-metal-lo-ids 64/139
48
Expert Panel on Air Quality Standards
3.3.2 Genotoxicity
136. The results of bacterial mutation tests in vitro are equivocal. This
probably reflects variations in sensitivities of tester strains used and the
test conditions (ASTDR, 2003). The results from sister chromatid
exchange studies in mammalian cells and cultured human lymphocytes
are positive, as are those for cellular transformation. In the latter
studies, the extent of induction of cellular transformation was shown
to depend on the cellular uptake of the particular test compound
(Costa, 1989).
137. Most of the studies in vivo were negative, but one study with oral
dosing and a second by injection, showed increased incidence of
micronuclei in mice after dosing with soluble nickel compounds. Onestudy with two groups of nickel refinery workers (Waksvik and
Boysen, 1982) showed a slight but significant increase in chromosome
aberrations (but not breaks or sister chromatid exchanges).
138. These observations led the Scientific Committee for Toxicity,
Ecotoxicity and the Environment (CSTEE) to conclude that a
genotoxic mode of action could not be discounted (CSTEE, 2001).
There is evidence that genotoxic effects of nickel compounds may be
indirect, through inhibition of DNA repair systems (Hartwig, 1998).This possibly reflects the ability of nickel to form complexes with the
amino acid histidine which may then take part in redox reactions
(see above).
3.3.3 Carcinogenicity
3.3.3.1 Animal studies
139. No experimental evidence has been found to show that nickelcompounds are carcinogenic when administered orally or cutaneously.
140. Ottolenghti et al. (1974) reported a significant increase in lung tumour
incidence in rats following nickel subsulphide inhalation exposure for
two years. The USA National Toxicity Program (NTP, 1996a,b,c)
examined the carcinogenicity of nickel sulphate hexahydrate, nickel
oxide and nickel subsulphide in rats and mice. None of the compounds
tested induced tumours in mice. Nickel sulphate induced no tumours
in rats, but increased numbers of both benign and malignant tumours
(adenomas and carcinomas) were found in rats exposed to either the
oxide or subsulphide.
8/6/2019 Metals and Metal Lo Ids
http://slidepdf.com/reader/full/metals-and-metal-lo-ids 65/139
49
Nickel
3.3.32 Human studies
141. Studies of occupationally-exposed populations have consistently, and
with clear evidence of an exposure-response relationship, found
increased risks of nasal and lung cancers in workers exposed to airborne
nickel compounds (Seilkop and Oller, 2003). These cancers are not
histologically specific. The relative risks are higher for nasal cancers.
142. Those exposed to high concentrations of nickel compounds at work are
often also exposed to other carcinogens such as arsenic; thus associations
between cancer and nickel exposure are likely to be confounded. Where
there is such confounding, guideline values extrapolated from
occupational risk estimates are likely to be conservative.
143. The highest risks are found among those working in nickel smelting,
refining or sintering (Muir et al., 1994). No significant risks have
been reported among nickel electroplaters or those engaged in nickel
alloy manufacture (Sorahan, 2004). Metallic nickel is believed not to
be carcinogenic.
144. There is uncertainty over the relative human carcinogenicity of the
various nickel compounds. The contention that risk was related chiefly
to exposures to insoluble compounds (nickel oxides or sulphides) hasbeen tempered by recent epidemiological evidence that points also to a
risk from exposure to soluble compounds, particularly nickel sulphate
(Anttila et al., 1998; Grimsrud et al., 2002).
145. The effects of cigarette smoking and nickel compound exposure
appear to be additive (Magnus et al., 1982).
146. Evidence concerning cancers in other sites is far less conclusive. In
1990 the International Committee on Nickel Carcinogenesis in Manconcluded that there was no risk from airborne nickel compounds for
non-nasal/lung cancers (International Committee on Nickel
Carcinogenesis in Man, 1990); more recent studies however have
suggested that there may be increased risks of stomach (Anttila et al.,
1998; Pang et al., 1996) and pancreatic cancer (Ojajarvi et al., 2000).
3.3.4 Reproductive and developmental toxicity
147. Several animal studies (reviewed by Defra and EA, 2002a) have shown
that soluble nickel salts may induce testicular damage, leading to
reduced fertility, and developmental toxicity in rats and mice.
Inhalation exposures of six hours/ day for 12 days to nickel sulphate
(1.8 mg/m3) or nickel subsulphide (1.6 mg/m3) produced testicular
degeneration in rats and mice (ACGIH, 1996).
8/6/2019 Metals and Metal Lo Ids
http://slidepdf.com/reader/full/metals-and-metal-lo-ids 66/139
50
Expert Panel on Air Quality Standards
148. Hamsters and rats exposed to nickel carbonyl (0.16 mg/m3 or higher)
during gestation showed fœtal mortality and fœtal malformations.
149. A single intraperitoneal injection of nickel chloride at 20 mg/kg body
weight to groups of female mice on days 1 to 6 of gestation, wasassociated with increased frequency of early and late fœtal
“resorptions” and of stillborn and abnormal fœtuses (Storeng and
Jonsen, 1981). The authors concluded that nickel chloride “may
influence mouse embryos during the passage though the oviduct and
on their subsequent development after implantation”. Mas et al (1986)
injected radioactive nickel chloride into pregnant rats, and showed that
that nickel enters fœtal tissue, although concentration in the fœtus is
lower than in the dam. Diwan et al. (1992) injected pregnant rats with
Nickel (II) acetate at 90 µg/kg/body weight on days 16-18 of gestation.Offspring had an increased incidence of pituitary tumours – suggesting
that “Ni (II) is a complete transplacental carcinogen for rat pituitary”.
150. Casey and Robinson (1978) showed that nickel crosses the human
placenta in vivo. Since measured levels were similar to those reported
for adult liver, the Authors concluded that: i) nickel salts must cross the
placenta readily and ii) the supply to the fœtus depends on the nickel
status of the mother. Chen and Lin (1998) incubated human placental
explants with nickel chloride (1 to 5 mM, 12 hrs), and found a dose-dependent increase in permeability (indicated by potassium release)
and lipid peroxidation. The authors speculated that these changes may
cause “damage to the fœtus” – but there are no direct data in support.
151. Women working in a Russian nickel refinery had a higher rate (about
double) of spontaneous abortions and increased congenital
malformations compared with women working in local construction
industries. Exposures – primarily to nickel sulphate – were estimated to
be between 80 and 200 µg/m3 (Chashschin et al., 1994). It is not clear thatthese outcomes can be attributed to inhalation of nickel compound(s).
3.4 Evaluations and recommendations by otherorganisations
152. Guidelines and limits on exposure to nickel in ambient air have been
published by the WHO, Defra and the EA, the European Commission
(EU), CSTEE, the US Environmental Protection Agency (EPA) andthe US agency for Toxic Substances and Disease Registry (ATSDR).
153. The WHO (2000) classify nickel compounds as human carcinogens by
inhalation exposure and derived an incremental unit risk of 3.8 x 10⁻⁴
per µg/m3 in air. Lifetime exposure to concentrations of 250 ng/m3,
25 ng/m3 and 2.5 ng/m3 are calculated to increase life-time cancer risks
by not more than 1:10,000, 1:100,000 and 1:1,000 000, respectively.
8/6/2019 Metals and Metal Lo Ids
http://slidepdf.com/reader/full/metals-and-metal-lo-ids 67/139
51
Nickel
154. The EC Working Group on Arsenic, Cadmium and Nickel compounds
proposed an overall limit value for nickel for both carcinogenic and
non-carcinogenic effects of 10-50 ng/m3 as an annual mean (EC, 2000).
This value is calculated to limit the excess lifetime cancer risk to not
more than one in a million. The CSTEE suggested that a limit value of
20 ng/m3 would provide “reasonable protection for the general
population to the carcinogenic effects of nickel compounds in ambient
air” (CSTEE, 2001). This limit value was adopted as a target value, “to
be attained as far as possible”, in the Fourth Daughter Directive on
Ambient Air Quality and is effective from 31 December 2012
(Directive 2004/107//EC).
155. Defra and the EA (2002b) proposed an index dose for nickel to derive
a Soil Guideline Value for contaminated land. The index dose isintended to pose a minimal risk from exposure, with the additional
requirement that exposure should be as low as reasonably practicable
(ALARP). The index dose for nickel was determined as 6 ng/kg body
weight/day based on an airborne concentration of 20 ng/m3. For
threshold effects, the tolerable daily intake from soil (by inhalation)
was determined as 2 and 1 ng/kg body weight/day, respectively, for
adults and six year old children.
156. The US EPA estimated the lifetime cancer risk from exposure to nickelrefinery dust to be 2.4 x 10⁻⁴ (µg/m3)-1 from the results of four
epidemiological studies (US EPA, 1991a). Concentrations of 400
ng/m3, 40 ng/m3 and 4 ng/m3 are calculated to increase life-time cancer
risks by no more than 1:10 000, 1:100 000 and 1:1 000 000, respectively.
The US EPA derived a further unit risk estimate of 4.8 x 10⁻⁴ (µg/m3)-1
for nickel subsulphide by applying a factor of two to account for the
50% (approximately) nickel subsulphide composition of refinery dust
(US EPA, 1991b). Concentrations of 200 ng/m3, 20 ng/m3 and 2 ng/m3
are calculated to increase life-time cancer risks by no morethan1:10,000, 1:100,000 and 1:1,000,000, respectively.
157. The ATSDR (2003) derived intermediate and chronic inhalation
minimal risk levels (MRLs) of 200 ng/m3 and 90 ng/m3 for nickel
sulphate hexahydrate on the basis of inflammation in rats. An MRL is
defined as an estimate of daily human exposure to a substance that is
likely to be without appreciable risk of adverse effects (other than
cancer) over a specified duration of exposure (ATSDR, 2003).
158. The UK HSE workplace exposure limits (WEL) for nickel and its
inorganic compounds (except nickel tetracarbonyl) are 0.1 mg/m3 (as
Ni) for water soluble compounds and 0.5 mg/m3 (as Ni) for insoluble
compounds. The HSE considered the critical health effects resulting
from nickel exposure to be cancer (nickel oxides and sulphides) and
skin sensitisation (water soluble nickel compounds). A ‘Skin’ notation
8/6/2019 Metals and Metal Lo Ids
http://slidepdf.com/reader/full/metals-and-metal-lo-ids 68/139
52
Expert Panel on Air Quality Standards
is also applied, based on sensitisation as one of the critical health
effects.
159. The American Conference of Governmental Industrial Hygienists
(ACGIH) Threshold Limit Value (TLV), a concentration to which
nearly all workers may be repeatedly exposed over a working lifetime
without adverse effect), is 1.5 mg/m3 for elemental nickel, 0.1 mg/m3 for
soluble inorganic compounds, 0.2 mg/m3 for insoluble compounds and
0.1 mg/m3 for nickel subsulphide (all as 8 hour averages).
3.5 Justification for air quality guideline
160. The major health effect from exposure to nickel compounds by
inhalation is toxicity to the respiratory tract, including lung and nasalcancer, although the latter is probably confined to occupational
exposures. The exact agent responsible for this effect remains
controversial. Animal experiments have implicated insoluble salts,
especially the subsulphide and the oxide, and these are certainly more
potent carcinogens than the soluble salts. Nickel sulphate (soluble) did
not increase lung cancer incidence in animals. However, more recent
epidemiological studies have indicated that soluble nickel salts may
contribute to the incidence of lung cancer in refinery workers (Grimsrud
et al., 2002). Sensitisation may result from inhalation of nickel salts, at
least from occupational exposure, but it is relatively rare. There are
insufficient data to allow a guideline value to be set for this response, but
the panel was not aware of any confirmed reports of sensitisation from
environmental exposure. Recent work with airborne particulate matter
in mice may indicate effects at lower levels of exposure (approximately
0.1 µg/m3) but there are insufficient data to attribute these unequivocally
to nickel or to assess the impact on humans.
161. From the rat studies it can be concluded that the NOAEL for
exposures to the insoluble salts (oxide and subsulphide) is at least 0.11
mg/m3 (NTP, 1996a,c). In the case of exposures to nickel sulphate (as
hexahydrate) chronic active inflammation and fibrosis was seen at 0.06
mg/m3 and above (NTP, 1996b). Female (but not male) mice also
showed clear evidence of chronic inflammation at 0.06 mg/m3, the
lowest dose tested (NTP, 1996b). Thus, 0.06 mg/m3 can be considered
to be the lowest adverse effect level (LOAEL) for soluble nickel
compounds in experimental animals.
162. It is evident from studies in vitro that soluble nickel salts may have
weak mutagenic potential and that this is probably due to the nickel
ion. There are no robust data to indicate whether this potential is
expressed in vivo. There is no substantial evidence for mutagenic
potential of the less soluble salts. It is therefore plausible that a
non-genotoxic mechanism, based on the formation of oxygen radicals
8/6/2019 Metals and Metal Lo Ids
http://slidepdf.com/reader/full/metals-and-metal-lo-ids 69/139
53
Nickel
and consequent sustained cell proliferation due to repair of oxidative
damage, could account for the lung tumours seen. If this is the active
mechanism then there is likely to be a threshold of effect.
163. Based on the above, there are two routes by which an air quality
standard could be calculated.
164. The inflammatory response in experimental animals is considered
definitive (i.e. occurs at the lowest exposure levels) so the Panel
considered that a value of 0.06 mg/m3 should be taken as a LOAEL
based on the results from the most sensitive study (NTP, 1996b).
From examination of the effects seen at the next lower dose
(0.03 mg/m3), it is likely that the “true” NOAEL will be close to this
value. Thus, as a precaution the Panel considered that a factor of fiveshould be adequate to account for the use of a LOAEL. The rats and
mice were exposed six hours/day for five days/week (30 hours/week) so
to account for continuous exposure a further factor of six should be
applied. Finally to account for extrapolation from experimental
animals to humans and to allow variability in individual sensitivity a
factor of 100 (ie 10x10) was applied. (It is recognised that for minerals
such as nickel this is likely to be over-cautious as the metabolic
difference between species is likely to be small). This gives a value of
0.02 µg/m3. As less than 50% of atmospheric nickel is present as solublesalts and the NOAEL for the insoluble compounds is an order of
magnitude higher the value should be doubled to 0.04 µg/m3.
165. An alternative is to base the standard on the observed incidence of
respiratory tract tumours in humans. Seilkop and Oller (2003) provide
a comprehensive summary and analysis of the data available from
studies published before 2002. As stated above, workers in the nickel
industry are usually exposed to nickel in a mixture of forms as well as
other substances and there are no absolutely reliable data for long termconcentrations of atmospheric nickel in the workplace. The available
assessments of long term average exposure levels are based on full shift
exposure measurements and the limitations of the measurement
methodologies available mean that there is no information about short
term peak concentrations during individual shifts. It is possible that
respiratory irritation caused by unmeasured intense peaks in exposure
is more important in the development of disease than mean exposure
levels over a full shift.
166. The Panel considered that the measurements available from low
risk/low exposure cohorts demonstrate that the reported excess cancer
risk diminishes rapidly below a value of 1 mg/m3 as a long term average
concentration in workplace air. Statistically significant excess risks of
lung cancer have, however, been reported in nickel refinery workers
with mean exposures to 0.1-0.4 mg/m3 (Anttila et al., 1998) and alloy
8/6/2019 Metals and Metal Lo Ids
http://slidepdf.com/reader/full/metals-and-metal-lo-ids 70/139
54
Expert Panel on Air Quality Standards
workers with exposures to 0.01-0.3 mg/m3 (Redmond, 1984).
Small excess risks have been also been reported in electroplaters
exposed to mean concentrations of 0.01-0.08 mg/m3 but these risks
were not statistically significant (Pang et al., 1996). From the data
summary and accompanying exposure-response function modelprovided by Seilkop and Oller (2003), the Panel concluded that the
value of 0.02 mg/m3 could be taken as a LOAEL in humans. This is
consistent with the findings of a more recent study by Grimsrud et al.
(2002) who report statistically significant increased risks of cancer in
workers with cumulative exposures to soluble nickel of 1.60 mg/m3 x
years or oxidic nickel of 1.67 mg/m3 x years; the equivalent long term
mean exposure to either form of nickel over a 40 year working lifetime
would be 0.04 mg/m3. Given the apparent shallow dose-relationship at
low concentrations a ten-fold factor was applied for extrapolation froma LOAEL and a further ten-fold factor for occupational to continuous
exposure, including the higher respiratory dose rate experienced by
children. A further ten fold factor to allow for “susceptible groups
within the population” was applied as a precautionary step. This gives
a calculated value for lifetime exposure of 0.02 µg/m3.
167. As both calculations produced similar results, the panel considered
that the lower value (0.020 µg/m3) should be adopted, as it is based on
human data, which has a more serious outcome with increasedincidence of cancer compared to the effects seen in animals. Soluble
nickel is rapidly excreted and the effects of insoluble nickel are seen at
higher concentrations than those from the soluble salts. The guideline
value is an annual average.
3.6 Recommendation
168. 0.020 µg/m3
total nickel compounds, in the PM10 size fraction, as anannual mean.
169. The panel recommends that an airborne concentration of all nickel
compounds (measured as nickel) of 0.020 µg/m3 (annual mean) should
protect against the short and long-term effects of inhaled nickel.
References
ACGIH (1996). Documentation of the Threshold Limit Values and
Biological Exposure Indices for Chemicals in the Environment, 6th edition.
American Conference of Governmental Industrial Hygienists.
Anttila, A., Pukkala, E., Aitio, A., Rantanen, T. and Karjalainen, S. (1998).
Update of cancer incidence among workers at a copper/nickel smelter and
nickel refinery. Int Arch Occup Environ Health 71(4):245-250.
8/6/2019 Metals and Metal Lo Ids
http://slidepdf.com/reader/full/metals-and-metal-lo-ids 71/139
55
Nickel
Athar, M., Hasan, S.K. and Srivastava, R.C. (1987). Evidence for the
involvement of hydroxyl radicals in nickel mediated enhancement of lipid
peroxidation: implications for nickel carcinogenesis. Biochem Biophys Res
Commun. 147(3): 1276-81.
ATSDR (2003). Toxicological Profile for Nickel. Agency for Toxic
Substances and Disease Registry. September 2003.
Berge, S.R. and Skyberg, K. (2003). Radiographic evidence of pulmonary
fibrosis and possible etiologic factors at a nickel refinery in Norway. J
Environ Monit. 5(4):681-8.
Campen, M.J., Nolan, J.P., Schladweiler, M.C., Kodavanti, U.P., Evansky,
P.A., Costa, D.L. and Watkinson, W.P. (2001). Cardiovascular andthermoregulatory effects of inhaled PM-associated transition metals: a
potential interaction between nickel and vanadium sulfate. Toxicol Sci.
Dec;64(2):243-52.
Carvalho, S.M. and Ziemer, P.L. (1982). Distribution and clearance of 63Ni
administered as 63NiCl2 in the rat: intratracheal study. Arch Environ
Contam Toxicol. 11(2):245-8.
Casey, C.E. and Robinson, M.F. (1978). Copper, manganese, zinc, nickel,cadmium and lead in human fœtal tissues. Br J Nutr 39(3):639-646.
Cawse, P.A. (1987). Trace and major elements in the atmosphere at rural
locations in Great Britain, 1972-1981. In: Pollutant Transport and Fate in
Ecosystems. Special Publication Number 6 of The British Ecological Society.
Blackwell Scientific Publications, Oxford.
Chashschin, V.P., Artunina, G.P. and Norseth, T. (1994). Congenital defects,
abortion and other health effects in nickel refinery workers. Sci TotalEnviron. 6;148(2-3):287-91.
Chen, C.Y. and Lin, T.H. (1998). Nickel toxicity to human term placenta: in
vitro study on lipid peroxidation. J Toxicol Environ Health A 54(1):37-47.
Costa, M. (1989). Perspectives on the mechanism of nickel carcinogenesis
gained from models of in vitro carcinogenesis. Environ Health Perspect.
81:73-6.
Costa, M. and Mollenhauer, H.H. (1980). Phagocytosis of nickel subsulfide
particles during the early stages of neoplastic transformation in tissue
culture. Cancer Res. 40(8 Pt 1): 2688-94.
CSTEE (2001). Opinion on: Position paper on ambient air pollution by nickel
compounds, Final Version, October 2000. The Scientific Committee for
8/6/2019 Metals and Metal Lo Ids
http://slidepdf.com/reader/full/metals-and-metal-lo-ids 72/139
56
Expert Panel on Air Quality Standards
Toxicity, Ecotoxicity and the Environment. Opinion expressed at the 22nd
CSTEE Plenary Meeting, Brussels, 6-7 March 2001.
Datta, A.K., Misra, M., North, S.L. and Kasprzak, K.S. (1992).
Enhancement by nickel(II) and -histidine of 2’-deoxyguanine oxidation withhydrogen peroxide. Carcinogenesis 13: 283–287
Defra and EA (2002a). Contaminants in Soil: Collation of Toxicological
Data and Intake Values for Humans. Nickel. Department for Environment,
Food and Rural Affairs and the Environment Agency. R&D Publication
TOX 8.
Defra and EA (2002b) Soil Guideline Values for Nickel Contamination.
Department for Environment, Food and Rural Affairs and the EnvironmentAgency. R&D Publication SGV 7.
Diwan, B.A., Kasprzak, K.S. and Rice, J.M. (1992). Transplacental
carcinogenic effects of nickel(II) acetate in the renal cortex, renal pelvis and
adenohypophysis in F344/NCr rats. Carcinogenesis 13(8):1351-1357.
Dore, C.J., Watterson, J.D., Murrells, T.P. et al. (2005). UK Emissions of Air
Pollutants 1970 to 2004. AEA Technology, Netcen. AEAT/ENV/R/2160.
Duce, R.A., Liss, P.S., Merrill, J.T., Atlas, E.L., Buat-Menard, P.,
Hicks, B. B., Miller, J.M., Prospero, J.M., Arimoto, R., Church, T.M.,
Ellis, W., Galloway, J.N., Hansen, L., Jickells, T.D., Knap, A.H.,
Reinhardt, K.H., Schneider, B., Soudine, A., Tokos, J.J., Tsunogai, S.,
Wollast, R. and Zhou, M. (1991). The atmospheric input of trace species to
the world ocean, Global Biogeochem. Cycles, 5(3), 193-259.
EC (2000). Ambient air pollution by As, Cd and Ni compounds. European
Communities. Position Paper, October 2000. Working Group on Arsenic,Cadmium and Nickel Compounds, European Commission DG Environment.
Grimsrud, T.K., Berge, S.R., Haldorsen, T. and Andersen A. (2002).
Exposure to different forms of nickel and risk oflung cancer. Am J Epidemiol
156(12):1123-1132.
Guisti, L., Yang, Y.-L., Hewitt, C.N., Hamilton-Taylor, J. and Davison, W.
(1993). The solubility and partitioning of atmospherically derived trace
metals in artificial and natural waters: a review. Atmospheric Environment
Part A. 27(10):1567-1578.
Hansen, L.D. and Fisher, G.L. (1980). Elemental distribution in coal fly ash
particles. Environ. Sci. Technol., 14(9): 1111-1117.
Hansen, L.D., Sulberman, D., Fisher, G.L. and Eatough, D.J. (1984).
8/6/2019 Metals and Metal Lo Ids
http://slidepdf.com/reader/full/metals-and-metal-lo-ids 73/139
57
Nickel
Chemical speciation of elements in stack-collected, respirable-size coal fly
ash. Environ. Sci. Technol., 18: 181-186.
Hartwig, A. (1998). Carcinogenicity of metal compounds: possible role of
DNA repair inhibition. Toxicol Lett. 28;102-103:235-9.
Herrero, M.C., Alvarez, C., Cartana, J., Blade, C. and Arola, L. (1993).
Nickel effects on hepatic amino acids. Res Commun Chem Pathol Pharmacol .
79(2): 243-8.
Høgetveit, A.C., Barton, R.T. and Kostøl, C.O. (1978). Plasma nickel as a
primary index of exposure in nickel refining. Ann Occup Hyg. 21(2):113-20.
HSE (1997). EH60 (revised). Nickel and its inorganic compounds: HealthHazards and precautionary measures. Health and Safety Executive.
Huang, X., Klein, C.B. and Costa, M. (1994a). Crystalline Ni3S2 specifically
enhances the formation of oxidants in the nuclei of CHO cells as detected by
dichlorofluorescein. Carcinogenesis. 15(3): 545-8.
Huang, X., Zhuang, Z., Frenkel, K., Klein, C.B., and Costa, M. (1994b). The
role of nickel and nickel-mediated reactive oxygen species in the mechanism
of nickel carcinogenesis. Environ Health Perspect. 102 Suppl 3: 281-4.
IARC (1990). IARC Monographs on the Evaluation of Carcinogenic Risks
to Humans. Volume 49: Chromium, Nickel and Welding. International
Agency for Research on Cancer, WHO, Lyon, France.
IEH (2003). Review of incineration and other combustion techniques: IEH
health effects review. Institute for Environment and Health. MRC Institute
for Environment and Health, University of Leicester
International Committee on Nickel Carcinogenesis in Man (1990). Report of
the International Committee on Nickel Carcinogenesis in Man. Scandinavian
Journal of Work, Environment and Health, 16, 1-82 (1990).
Kilburn, K.H., Warshaw, R., Boylen, C.T., Thornton, J.C., Hopfer, S.M.,
Sunderman, F.W. Jr. and Finklea, J. (1990). Cross-shift and chronic effects of
stainless-steel welding related to internal dosimetry of chromium and nickel.
Am J Ind Med. 17(5):607-15.
Klein, C.B., Frenkel, K. and Costa, M. (1991). The role of oxidative
processes in metal carcinogenesis. Chem. Res. Toxicol. 4: 592–604.
Lee, R.E. and Von Lehmden, D.J. (1973) Trace metal pollution in the
environment. J. Air. Pollut. Control Assoc., 23: 853-857.
8/6/2019 Metals and Metal Lo Ids
http://slidepdf.com/reader/full/metals-and-metal-lo-ids 74/139
58
Expert Panel on Air Quality Standards
Lee, D.S., Garland, J.A., and Fox, A.A. (1994). Atmospheric concentrations
of trace elements in urban areas of the United Kingdom. Atmospheric
Environment 28, 2691-2713.
Li, W., Zhao, Y. and Chou, I.N. (1993). Alterations in cytoskeletal protein
sulfhydryls and cellular glutathione in cultured cells exposed to cadmium and
nickel ions. Toxicology. 77(1-2): 65-79.
Lin, X., Zhuang, Z. and Costa, M. (1992). Analysis of residual amino acid--
DNA crosslinks induced in intact cells by nickel and chromium compounds.
Carcinogenesis. 13(10): 1763-8.
Lippmann, M., Kaxuhiko, I., Hwang, J.-S., Maciejczyk, P. and Chen, L.-C.
(2006). Cardiovascular effects of nickel in ambient air. Environ HealthPerspect.;114(11):1662-9.
Lynn, S., Yew, F.H., Chen, K.S. and Jan, K.Y. (1997). Reactive oxygen species
are involved in nickel inhibition of DNA repair. Environ Mol Mutagen. 29(2):
208-16.
Magari, S.R., Schwartz, J., Williams, P.L., Hauser, R., Smith, T.J. and
Christiani, D.C. (2002). The association of particulate air metal
concentrations with heart rate variability. Environ Health Perspect.Sep;110(9):875-80.
Magnus, K., Andersen, A. and Høgetveit, A.C. (1982). Cancer of respiratory
organs among workers at a nickel refinery in Norway. Int J Cancer
30:681-685.
Mas, A., Peligero, M.J., Arola, L., Alemany, M. (1986). Distribution and
kinetics of injected nickel in the pregnant rat. Clin Exp Pharmacol Physiol
13(2):91-96.
Menzel, D.B., Deal, D.L., Tayyeb, M.I., Wolpert, R.L., Boger, J.R. 3rd,
Shoaf, C.R., Sandy, J., Wilkinson, K. and Francovitch, R.J. (1987).
Pharmacokinetic modeling of the lung burden from repeated inhalation of
nickel aerosols. Toxicol Lett. 38(1-2):33-43.
Milford, J.B. and Davison, C.I. (1985). The sizes of particulate trace elements
in the atmosphere – a review. J. Air Pollut. Control Assoc., 35(12): 1249-1260.
Muggenburg, B.A., Benson, J.M., Barr, E.B., Kubatko, J. and Tilley, L.P.
(2003). Short-term inhalation of particulate transition metals has little effect
on the lectrocardiograms of dogs having preexisting cardiac abnormalities.
Inhal Toxicol. Apr 11;15(4):357-71.
8/6/2019 Metals and Metal Lo Ids
http://slidepdf.com/reader/full/metals-and-metal-lo-ids 75/139
59
Nickel
Muir, D.C.F., Jadon, N., Julian, J.A., and Roberts, R.S. (1994). Cancer of the
respiratory tract in nickel sinter plant workers: Effect of removal from sinter
plant exposure. Occup Environ Med 51(1):19-2.
Nackerdien, Z., Kasprzak, K.S., Rao, G., Halliwell, B. and Dizdaroglu,
M. (1991). Nickel(II)- and cobalt(II)-dependent damage by hydrogen
peroxide to the DNA bases in isolated human chromatin. Cancer Res.
51(21): 5837-42.
Natusch, D.F.S., Wallace, J.R. and Evans, C.A. (1974). Toxic trace elements:
preferential concentration in respirable particles. Science, 183: 202-204.
Neath Port Talbot County Borough Council (2006). Air quality report – 2004
http://www.neath-porttalbot.gov.uk/html/environment/pollution/reports/annual04.pdf
NTP (1996a). Toxicology and carcinogenesis studies of nickel oxide.
National Toxicology Programme. USA Department of Health and Human
Services. Public Health Service. National Institute of Health. NTP TR 451.
NTP (1996b). Toxicology and carcinogenesis studies of nickel sulphate
hexahydrate. National Toxicology Programme. USA Department of Health
and Human Services. Public Health Service. National Institute of Health.NTP TR 454.
NTP (1996c). Toxicology and carcinogenesis studies of nickel subsulphide.
National Toxicology Programme. USA Department of Health and Human
Services. Public Health Service. National Institute of Health. NTP TR 453.
Ojajarvi, I.A., Partanen, T.J., Ahblom, A., Boffetta, P., Hakulinen, T.,
Jourenkova, N., Kauppinen, T.P., Kogevinas, M., Porta, M., Vainio, H.U.,
Weiderpass, E. and Wesseling, C.H. (2000). Occupational exposures andpancreatic cancer: A meta-analysis. Occup Environ Med 57(5):316-324.
Ottolenghi, A.D., Haseman, J.K., Payne, W.W., Falk, H.L. and MacFarland,
H.N. (1974). Inhalation studies of nickel sulphide in pulmonary
carcinogenesis of rats. J. Nat. Canc. Inst., 54, 1165-1172.
Pang, D., Burges, D.C., Sorhan, T. (1996). Mortality studies of nickel platers
with special reference to cancers of the stomach and lung. Occup Environ
Med 53(10):714-717.
Redmond, C.K. (1984). Site-specific cancer mortality among workers
involved in the production of high nickel alloys. IARC Sci Publ. (53):73-86.
8/6/2019 Metals and Metal Lo Ids
http://slidepdf.com/reader/full/metals-and-metal-lo-ids 76/139
60
Expert Panel on Air Quality Standards
Rodriguez, R.E., Misra, M., North, S.L. and Kasprzak, K.S. (1991). Nickel-
induced lipid peroxidation in the liver of different strains of mice and its
relation to nickel effects on antioxidant systems. Toxicol Lett. 57(3): 269-81.
Salmon, L., Atkins, D.H.F., Fisher, E.M.R., Healy, C. and Law, D.V., (1978).
Retrospective trend analysis of the content of U.K. air particulate material
1957-1974. Science of the Total Environment 9, 161-200.
Schmidt, J.A. and Andren, A.W. (1980). The atmospheric chemistry of
nickel. In: Nriagu, J.O. ed. Nickel in the environment, New York, John Wiley
and Sons, pp. 93-135.
Seilkop, S.K. and Oller, A.R. (2003). Respiratory cancer risks associated
with low-level nickel exposure: an integrated assessment based on animal,epidemiological, and mechanistic data. Regul Toxicol Pharmacol. 37(2):
173-90 (Erratum in: Regul Toxicol Pharmacol. 2005 Feb;41(1):92-3).
Shi, X., Dalal, N.S. and Kasprzak, K.S. (1992). Generation of free
radicals from lipid hydroperoxides by Ni2+ in the presence of oligopeptides.
Arch Biochem Biophys. 299(1): 154-62.
Sorahan, T. (2004). Mortality of workers at a plant manufacturing nickel
alloys, 1958-2000. Occup Med 54(1):28-34.
Stinson, T.J., Jaw, S., Jeffery, E.H. and Plewa, M.J. (1992). The relationship
between nickel chloride-induced peroxidation and DNA strand breakage in
rat liver. Toxicol Appl Pharmacol. 117(1): 98-103.
Storeng, R. and Jonsen, J. (1981). Nickel toxicity in early embryogenesis in
mice. Toxicology 20(1):45-51.
Torjussen, W. and Andersen, I. (1979). Nickel concentrations in nasalmucosa, plasma, and urine in active and retired nickel workers. Ann Clin Lab
Sci. 9(4):289-98.
USEPA (1991a). Nickel Refinery Dust. US Environmental Protection
Agency Integrated Risk Information System (IRIS)
http://www.epa.gov/ncea/iris/subst/0272.htm
USEPA (1991b). Nickel subsulphide. US Environmental Protection Agency
Integrated Risk Information System (IRIS)
http://www.epa.gov/ncea/iris/subst/0273.htm
Valentine, R. and Fisher, G.L. (1984). Pulmonary clearance of intratracheally
administered 63Ni3S2 in strain A/J mice. Environ Res. 34(2):328-34.
8/6/2019 Metals and Metal Lo Ids
http://slidepdf.com/reader/full/metals-and-metal-lo-ids 77/139
61
Nickel
Vincent, K. and Passant, N. (2005). Assessment of Heavy Metal
Concentrations in the United Kingdom. AEA Technology, Netcen.
AEAT/ENV/R/2013.
Waksvik, H. and Boysen, M. (1982). Cytogenetic analyses of lymphocytes
from workers in a nickel refinery. Mutat Res. 1982 Feb;103(2):185-90.
WHO (1991). Environmental Health Criteria 108, World Health
Organisation, Geneva, Switzerland.
WHO (2000). Air quality guidelines for Europe, 2nd edition. World Health
Organisation. Regional Office for Europe, Copenhagen. WHO Regional
Publications, European Series, No. 91.
Yokoi, K., Uthus, E.O., and Nielson, F.H. (2003). Nickel deficiency
diminishes sperm quality and movement in rats. Biol. Trace Elem. Res.
93 141 -154.
Zhuang, Z., Huang, X. and Costa, M. (1994). Protein oxidation and
amino acid-DNA crosslinking by nickel compounds in intact cultured cells.
Toxicol Appl Pharmacol . 126(2): 319-25.

8/6/2019 Metals and Metal Lo Ids
http://slidepdf.com/reader/full/metals-and-metal-lo-ids 78/139
62
Expert Panel on Air Quality Standards
8/6/2019 Metals and Metal Lo Ids
http://slidepdf.com/reader/full/metals-and-metal-lo-ids 79/139
63
Chapter 4
Beryllium
4.1 Background
4.1.1 Basic chemical information
170. Beryllium is a very light but hard metal with a high melting point
(1280ºC). It has good electrical and thermal conductance and is
resistant to corrosion. Its concentration in rocks of the earth’s crust is
variable but averages 3 mg/kg. Appreciable concentrations of
beryllium occur in coals, with values generally ranging between 1 and
2 mg/kg (Reimannet al.,
1998) but sometimes, for example in poorquality brown coals from central Europe, as high as 30 mg/kg (Bouska,
1981). It has been suggested that just 1% of the beryllium in coal is
volatilised during combustion (Kubiznáková, 1987) so that much of
the element remains in the ash residue.
171. Inhalation of insoluble beryllium compounds seems to cause the most
serious health problems; these compounds include beryllium oxide and
various alloys, the most important being copper-beryllium alloy.
However, it seems likely that not all forms of beryllium-containingmaterials pose the same health risk. Wegner et al. (2000) studied beryl
gemstone cutters and found little in the way of adverse health effects
despite exposures as high as 2 µg/m3 beryllium. Similarly Deubner et
al. (2001a) found that workers at a bertrandite [Be4Si2O7(OH)2] mine
experienced no respiratory health problems. These authors suggest
that in the absence of beryllium oxide particulate matter, exposure to
ore dusts of beryl and bertrandite or beryllium salts carries a lower risk
of respiratory health effects. In another study Kreiss et al. (1993) found
higher rates of chronic beryllium disease in workers in the berylliumceramics industry where beryllium oxide is the essential component.
Paustenbach et al. (2001) also suggest that beryllium oxide is the most
hazardous form in industrial settings; in any case beryllium alloys
always have some degree of oxide formation on exposed surfaces
after machining.
8/6/2019 Metals and Metal Lo Ids
http://slidepdf.com/reader/full/metals-and-metal-lo-ids 80/139
64
Expert Panel on Air Quality Standards
4.1.2 Sources and concentrations of beryllium in the UK atmosphere
172. Much of the beryllium in the atmosphere probably derives from
anthropogenic sources although the size of this contribution is
disputed. In the USA it has been estimated that 97% results from coal
combustion with 2.7% contributed by volcanic eruptions and the
remaining 0.2% deriving from the production and industrial use of the
element (Kolanz, 2001). However, others (Reimann et al., 1998; Willis
and Florig, 2002) suggest that the major contributor to atmospheric
beryllium is soil dust.
173. The main sources of beryllium emissions to the air in the UK
(Dore et al., 2004) are reported to be road traffic (about 40%),
domestic and other space heating (about 20%), non-road mobilemachinery (about 10%) and refineries (about 10%). About three
quarters of the emissions are associated with the combustion of liquid
fuels and about one quarter with the combustion of solid fuels.
Estimates of UK emissions are only available for the period from 2000
to 2004 and show no major changes over this period.
174. The National Atmospheric Emissions Inventory has only recently
started to report emission estimates for beryllium. They are subject to
considerable uncertainty and emission factors are only available for thecombustion of solid and heavy liquid fuels; and not for industrial
processes with the exception of iron and steel manufacture and a few
others. The emission factors used have not been subject to any in-depth
review. A limited review carried out for the 2003 inventory concluded
that the emission factors for solid and liquid fuels are based on very
few data and, in the case of coal, also require various assumptions to
be made about, for example, the efficiency of particulate matter
abatement in use by industry. It is possible that the emission factors for
coal and oils might be out by a factor of five; if this were the case thencoal, rather than oil, could be the major source.
175. The available data suggest that there is little industrial use of beryllium
in the UK. Only one small company uses beryllium oxide, in the
manufacture of an electronic product. An estimated 50 companies
(employing an estimated total of 500 employees) in the UK
manufacture or machine products containing beryllium as an alloy. It
is probable however that there is further use of beryllium alloys; this is
anticipated to increase (Health and Safety Executive personal
communication; data held on file).
176. In the absence of industrial contamination, ambient air generally
contains very low or non-detectable concentrations of beryllium.
Higher levels are generally found in urban air reflecting anthropogenic
sources such as burning of fossil fuels; and in the vicinity of coal fired
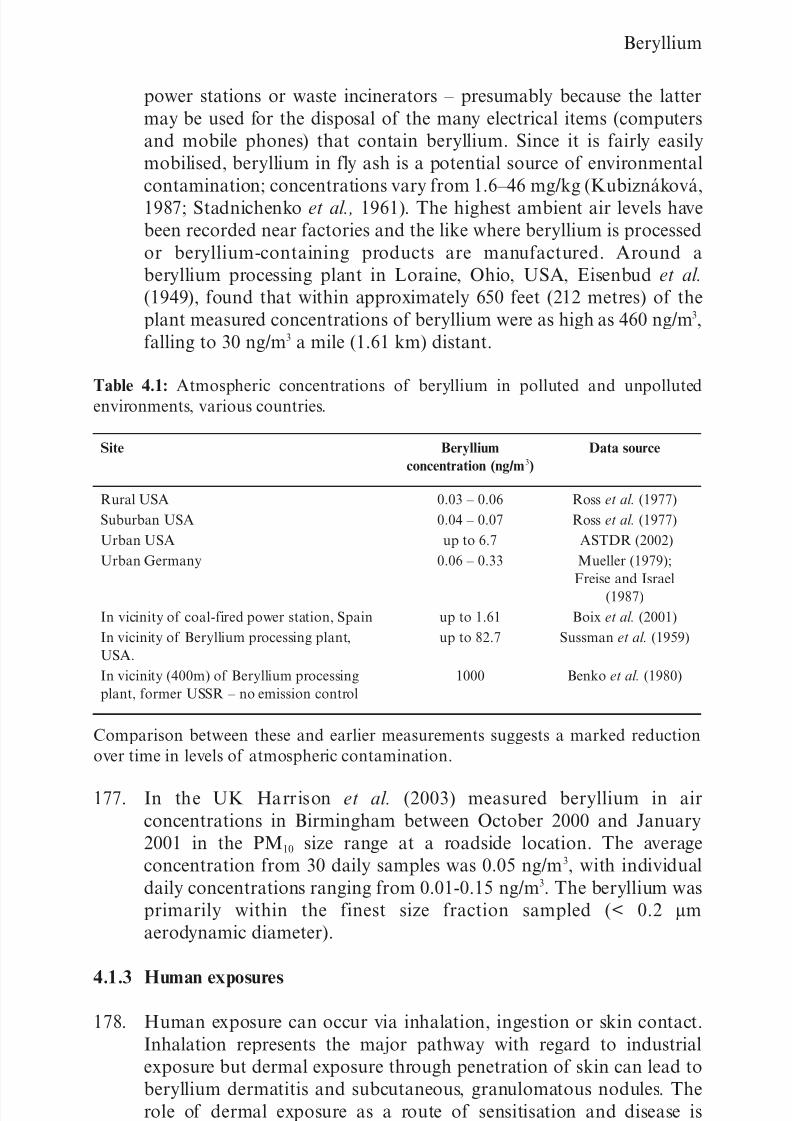
8/6/2019 Metals and Metal Lo Ids
http://slidepdf.com/reader/full/metals-and-metal-lo-ids 81/139
65
Beryllium
power stations or waste incinerators – presumably because the latter
may be used for the disposal of the many electrical items (computers
and mobile phones) that contain beryllium. Since it is fairly easily
mobilised, beryllium in fly ash is a potential source of environmental
contamination; concentrations vary from 1.6–46 mg/kg (Kubiznáková,
1987; Stadnichenko et al., 1961). The highest ambient air levels have
been recorded near factories and the like where beryllium is processed
or beryllium-containing products are manufactured. Around a
beryllium processing plant in Loraine, Ohio, USA, Eisenbud et al.
(1949), found that within approximately 650 feet (212 metres) of the
plant measured concentrations of beryllium were as high as 460 ng/m3,
falling to 30 ng/m3 a mile (1.61 km) distant.
Table 4.1: Atmospheric concentrations of beryllium in polluted and unpollutedenvironments, various countries.
Comparison between these and earlier measurements suggests a marked reduction
over time in levels of atmospheric contamination.
177. In the UK Harrison et al. (2003) measured beryllium in air
concentrations in Birmingham between October 2000 and January
2001 in the PM10 size range at a roadside location. The average
concentration from 30 daily samples was 0.05 ng/m3, with individual
daily concentrations ranging from 0.01-0.15 ng/m3. The beryllium was
primarily within the finest size fraction sampled (< 0.2 µm
aerodynamic diameter).
4.1.3 Human exposures
178. Human exposure can occur via inhalation, ingestion or skin contact.
Inhalation represents the major pathway with regard to industrial
exposure but dermal exposure through penetration of skin can lead to
beryllium dermatitis and subcutaneous, granulomatous nodules. The
role of dermal exposure as a route of sensitisation and disease is
uncertain (Tinkle et al., 2003; Day et al., 2006).
Site Beryllium
concentration (ng/m3)
Data source
Rural USA
Suburban USA
Urban USA
Urban Germany
In vicinity of coal-fired power station, Spain
In vicinity of Beryllium processing plant,
USA.
In vicinity (400m) of Beryllium processing
plant, former USSR – no emission control
0.03 – 0.06
0.04 – 0.07
up to 6.7
0.06 – 0.33
up to 1.61
up to 82.7
1000
Ross et al. (1977)
Ross et al. (1977)
ASTDR (2002)
Mueller (1979);
Freise and Israel
(1987)
Boix et al. (2001)
Sussman et al. (1959)
Benko et al. (1980)
8/6/2019 Metals and Metal Lo Ids
http://slidepdf.com/reader/full/metals-and-metal-lo-ids 82/139
66
Expert Panel on Air Quality Standards
179. By far the most important source of exposure is directly or indirectly
through the workplace. Seventy five percent of beryllium is used in the
production of copper-beryllium alloys (Cunningham, 2003) which are
used extensively in the aerospace, telecommunications, computer, vehicle
and oil/gas industries. Beryllium oxide is incorporated into a ceramic
which is used in electronic circuitry, ignition systems and microwave
ovens. Cases of berylliosis have been shown to occur in workers handling
all insoluble beryllium-containing materials (Maier, 2002).
180. While urban exposures are probably higher than rural, it seems likely
that non-occupationally exposed individuals are not exposed to high
concentrations of atmospheric beryllium (Apostoli and Schaller, 2001).
181. Other, minor respiratory exposures include cigarette smoking althoughthis is not considered to be important in the development of beryllium
disease (Sawyer et al., 2002). Beryllium may be used in the
manufacture of dental bridges, crowns and plates; and in this form has
occasionally resulted in allergic reactions in the mouth and gums.
Similarly, it is unlikely that dermal exposure to beryllium will result
from non-occupational exposure. While the beryllium containing
gemstone beryl (including aquamarine and emerald) is used in
jewellery, this mineral does not cause any dermal problems.
182. The concentrations of beryllium in drinking waters are generally very
low in the UK; a study of British aquifers revealed a highest
concentration of 1.02 µg/L beryllium (Edmunds and Trafford, 1993).
Concentrations in foodstuffs are very variable but since most ingested
beryllium is rapidly excreted, even those with high beryllium content
are unlikely to induce any serious health effect in humans.
4.2 Toxicokinetics
4.2.1 Absorption
183. Inhalation is the major pathway into the body with beryllium
subsequently absorbed through the lungs; there is, however,
insufficient information to determine rates or degree of absorption
(ATSDR, 2002) which in any case are likely to depend on the solubility
of the inhaled compound.
184. When insoluble or low-solubility beryllium-containing particulate
matter is inhaled most are thought to be removed by mucocilliary
transport to the gastrointestinal tract. Some however is transferred to
the regional lymph nodes and pulmonary intersitium where it may be
retained for many years after exposure (Maier, 2002; Sawyer et al.,
2005). This retained beryllium is slowly solubilised and is the source of
adverse health effects.
8/6/2019 Metals and Metal Lo Ids
http://slidepdf.com/reader/full/metals-and-metal-lo-ids 83/139
67
Beryllium
185. It is generally believed that there are two phases – one rapid, one slow
– of beryllium removal from lungs, probably corresponding to the
removal of soluble and insoluble components respectively. In animal
models the half-life for rapid removal is between 1-60 days, while for
the slow phase it is in the range of 0.6-2.3 years (WHO/IPCS, 2001).
Rosenman et al. (2005) found that exposed workers without chronic
beryllium disease had been exposed to higher concentrations of
soluble beryllium – and thus had had a lower retained body burden –
than those with disease.
4.2.2 Distribution
186. Beryllium that is absorbed after inhalation is transferred to tracheal
lymph nodes and ultimately to the skeleton, the main site for storage(WHO/IPCMS, 2001). In a rodent model where rats were exposed by
inhalation to radioactively labelled beryllium in the form of soluble
salts, measurements after 408 hours exposure suggested that 92% of
the total body radioactivity was in excreta with 6.8% retained in the
skeleton. Small amounts are transferred to the liver and other organs
(ASTDR, 2002). Beryllium may bind to the iron-transport protein
ferritin and be transported back to the lung where it can be taken up
by lung macrophages so promoting beryllium-antigen formation
(Sawyer et al., 2004); it is postulated that this action is the cause of chronic beryllium disease many years after exposure has ceased.
187. Beryllium can form complexes with both adenosine triphosphate
(ATP) and adenosine diphosphate (ADP) (Boukhalfa et al., 2004),
as well as with endogenous proteins such as ferritin and transferrin
(Price and Joshi, 1983; Sawyer et al., 2004). Sawyer et al. (2002)
quote literature data suggesting that beryllium interacts with nuclear
acidic proteins, G proteins and protein kinases and interferes with
protein phosphorylation; in addition it inhibits the activities of regulatory enzymes.
4.2.3 Metabolism
188. Beryllium and its compounds seem not to be biotransformed,
although it is likely that soluble salts can in part be converted to
insoluble forms in the lung (Reeves and Vorwald, 1967).
4.2.4 Elimination
189. Almost all (98%) ingested beryllium is excreted via faeces; much
inhaled low-solubility beryllium is transferred from the lung to the
gastrointestinal tract and similarly excreted. Renal excretion also
occurs after inhalation and is probably important for soluble
beryllium, and that solubilised in the lung; workers exposed to elevated
8/6/2019 Metals and Metal Lo Ids
http://slidepdf.com/reader/full/metals-and-metal-lo-ids 84/139
68
Expert Panel on Air Quality Standards
levels of atmospheric beryllium have higher concentrations in urine
than subjects not exposed (ATSDR, 2002; Apostoli and Schaller,
2001). However, some beryllium is thought to remain in the lung for
several years where it will slowly dissolve (Maier, 2002), move into the
blood stream and subsequently be excreted. Beryllium inhalation can
cause lung damage and consequently decrease the ability of the lung to
clear the particles (ASTDR, 2002). The half-life of inhaled beryllium
in animals varies greatly, with much of the variation thought to be due
to its chemical form (ATSDR, 2002). The half-life of beryllium stored
in bone is around 450 days.
190. There is no information on the toxicokinetics or toxicity of beryllium
in children.
4.3 Health Effects
4.3.1 Acute health effects
191. Short-term respiratory exposures to high concentrations of beryllium
salts and particulate beryllium oxide can induce an acute pneumonitis
which is sometimes lethal. There is little information on the minimum
levels necessary to cause this though a 1940s study suggests that all
affected workers were exposed to >0.1 mg/m3 beryllium generally as
soluble beryllium sulphate or fluoride (Eisenbud et al., 1948).
The occurrence of acute beryllium disease is currently very rare;
only occasional cases resulting from accidental exposure have been
recorded in more recent times (Eisenbud and Lisson, 1983).
192. Experiments with animals subjected to high doses of soluble beryllium
salts result in a relatively high death rate. Animals exposed to beryllium
oxide have a lower mortality, due probably to the lower solubility of the oxide. In studies of rats inhaling soluble beryllium sulphate at
concentrations of 4.3 mg/m3 or 2.59 mg/m3, all died within 14 and 18
days respectively; of rats exposed to 31 mg/m3 beryllium as beryllium
oxide, 10% died. Of 74 rats exposed for 50 minutes to aerosolised
beryllium metal at a concentration of 0.8 mg/m3, 20 died 12-15 days
after exposure. There seems to be inter-species variation in
susceptibility with rats and monkeys being more sensitive to acute
beryllium exposure than hamsters and guinea pigs (ATSDR, 2002).
4.3.2 Sub-chronic effects – beryllium sensitisation
193. Immunological ‘delayed-type’ sensitisation to beryllium may be
present in the absence of detectable disease. It is believed to arise
following inhalation of beryllium but dermal exposure may also be
important. Sensitisation is identified using a specialised test – the
beryllium-stimulated lymphocyte proliferation test (BeLPT) – on
8/6/2019 Metals and Metal Lo Ids
http://slidepdf.com/reader/full/metals-and-metal-lo-ids 85/139
69
Beryllium
blood or lung fluid samples. Beryllium sensitisation does not seem to
be dependent on the degree of exposure (Willis and Florig, 2002) and
may occur after only brief contact with beryllium compounds (Viet et
al., 2000). There is probably an important genetic component to
individual susceptibility; the leukocyte antigen, HLA-DPB1 Glu69 has
been found in a higher than expected proportion of sensitised
individuals and in those suffering from chronic beryllium disease
(Richeldi et al., 1997; Saltini et al., 2001; Amicosante et al., 2002;
McCanlies et al., 2003, 2004). Estimates of the proportion of
individuals who are so predisposed vary widely between 1-15%.
194. It has also been suggested that beryllium can cause an allergic reaction
on skin. Sawyer et al. (2002) are of the opinion that dermatitis caused
by beryllium contact – for example through dental bridges – is in facta beryllium sensitive reaction. Tinkle et al. (2003) showed that
beryllium oxide caused sensitisation in mice due to particles
penetrating the skin. These workers postulate that skin sensitisation of
workers exposed to beryllium containing materials could be an added
factor to respiratory exposure.
4.3.3 Chronic effects
195. Airborne beryllium exposure may give rise to a granulomatous,interstitial lung disease – chronic beryllium disease (CBD) or
‘berylliosis’ – that has many similarities to sarcoidosis. In almost all
instances it is accompanied by evidence of beryllium sensitisation. The
disease has a long latency, becoming apparent many years (up to 40)
after first exposure and any time between a few months to decades
after sensitisation. It is incurable and when severe can result in
terminal respiratory failure.
196. On review of the literature, McCanlies et al. (2003) suggest thatbetween 36% and 100% of sensitised employees show signs of CBD.
Estimates of the annual incidence of progression from sensitisation to
disease range from about 5% to 10% (Maier, 2002; Newman et al.,
2005). Progression beyond sensitisation might also have one or more
genetic determinants (Saltini et al., 2001; Maier et al., 2003).
197. There are no animal models of the disease and virtually all of the
information on CBD derives from studies of workforces, in most cases
in the USA. Workplace prevalence figures for both sensitisation and
berylliosis vary (see Table 4.2) in part because of different study
designs and methods of detecting disease but probably also because of
variable exposures.
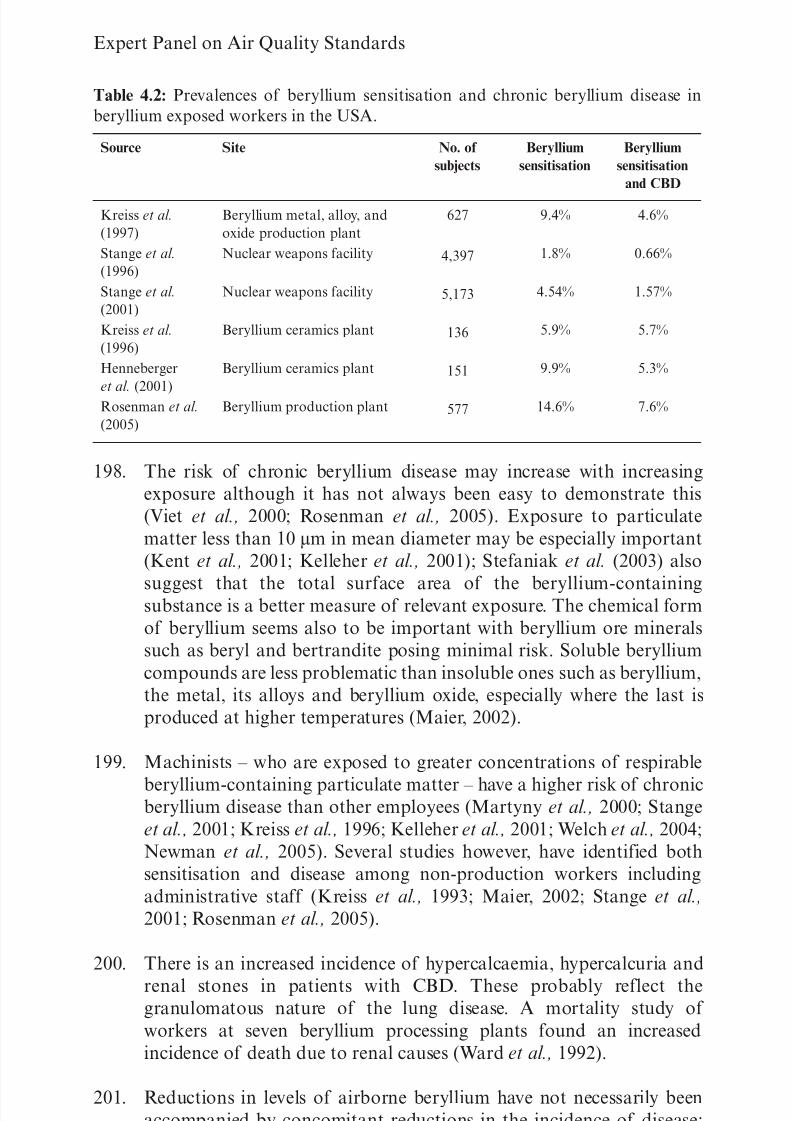
8/6/2019 Metals and Metal Lo Ids
http://slidepdf.com/reader/full/metals-and-metal-lo-ids 86/139
70
Expert Panel on Air Quality Standards
Table 4.2: Prevalences of beryllium sensitisation and chronic beryllium disease in
beryllium exposed workers in the USA.
198. The risk of chronic beryllium disease may increase with increasing
exposure although it has not always been easy to demonstrate this
(Viet et al., 2000; Rosenman et al., 2005). Exposure to particulate
matter less than 10 µm in mean diameter may be especially important
(Kent et al., 2001; Kelleher et al., 2001); Stefaniak et al. (2003) also
suggest that the total surface area of the beryllium-containingsubstance is a better measure of relevant exposure. The chemical form
of beryllium seems also to be important with beryllium ore minerals
such as beryl and bertrandite posing minimal risk. Soluble beryllium
compounds are less problematic than insoluble ones such as beryllium,
the metal, its alloys and beryllium oxide, especially where the last is
produced at higher temperatures (Maier, 2002).
199. Machinists – who are exposed to greater concentrations of respirable
beryllium-containing particulate matter – have a higher risk of chronicberyllium disease than other employees (Martyny et al., 2000; Stange
et al., 2001; Kreiss et al., 1996; Kelleher et al., 2001; Welch et al., 2004;
Newman et al., 2005). Several studies however, have identified both
sensitisation and disease among non-production workers including
administrative staff (Kreiss et al., 1993; Maier, 2002; Stange et al.,
2001; Rosenman et al., 2005).
200. There is an increased incidence of hypercalcaemia, hypercalcuria and
renal stones in patients with CBD. These probably reflect thegranulomatous nature of the lung disease. A mortality study of
workers at seven beryllium processing plants found an increased
incidence of death due to renal causes (Ward et al., 1992).
201. Reductions in levels of airborne beryllium have not necessarily been
accompanied by concomitant reductions in the incidence of disease;
dermal exposures – and even ingestion – have therefore been
Source Site No. of
subjects
Beryllium
sensitisation
Beryllium
sensitisation
and CBD
Kreiss et al.
(1997)
Stange et al.
(1996)
Stange et al.
(2001)
Kreiss et al.
(1996)
Henneberger
et al. (2001)Rosenman et al.
(2005)
Beryllium metal, alloy, and
oxide production plant
Nuclear weapons facility
Nuclear weapons facility
Beryllium ceramics plant
Beryllium ceramics plant
Beryllium production plant
627
4,397
5,173
136
151
577
9.4%
1.8%
4.54%
5.9%
9.9%
14.6%
4.6%
0.66%
1.57%
5.7%
5.3%
7.6%
8/6/2019 Metals and Metal Lo Ids
http://slidepdf.com/reader/full/metals-and-metal-lo-ids 87/139
71
Beryllium
considered as alternative, important routes of exposure (Tinkle et al.,
2003; Deubner et al., 2001b). In humans, where skin has been
penetrated by beryllium or beryllium oxide, granulomatous lesions
may develop (Sawyer et al., 2002). Contact dermatitis has been
described in workers exposed to airborne beryllium salts (ATSDR,
2002) and in some individuals fitted with dental bridges containing
beryllium (Sawyer et al., 2002).
4.3.4 Genotoxicity
202. Laboratory studies of the genotoxicity of beryllium have been
contradictory (Gorden and Bowser, 2003). Mutation and chromosome
aberration assays on bacteria have generally given negative results.
Some studies on mammalian cells in vitro have indicated that berylliumsalts have caused sister chromatid exchange and possible chromosome
aberration (IARC, 1993); however, Anderson (1983), did not find any
sister chromatid exchange on beryllium sulphate treatment of
human lymphocytes. The International Agency for Research on
Cancer report on one study using beryllium chloride where gene
mutation occurred in mammalian cells; and in another study of
cultured mammalian cells low temperature beryllium oxide was found
to cause breaks in single strand DNA (IARC, 1993). An in vivo study
on mice subjected to beryllium sulphate found that no micronucleiwere induced in bone marrow (IARC, 1993). Some of the
contradiction in this evidence is probably due to the use and
preparation of different forms of beryllium.
4.3.5 Carcinogenicity
203. Beryllium has been classed as a Group 1 human carcinogen by the
International Agency for Research on Cancer (IARC, 1993). The US
Department of Health and Human Services (USDHHS, 2003) alsolists beryllium and its compounds as known human carcinogens. The
American College of Governmental Industrial Hygienists (ACGIH,
2001) lists beryllium as a confirmed carcinogen. However, the US
Environmental Protection Agency lists beryllium in group B1, making
it a probable human carcinogen (USEPA, 1998).
204. Increased risks of death from lung cancer have been reported in a small
number of occupational cohorts from the USA. In each there is limited
– if any – control for confounding exposures (especially cigarette
smoking) and disease latency.
205. The earliest studies were of employees in beryllium processing facilities
in Ohio and Pennsylvania, USA and were carried out from the late
1960s through to the 1980s (see references in ATSDR, 2002). In 1991
Steenland and Ward (1991) reported the mortality experience of 689
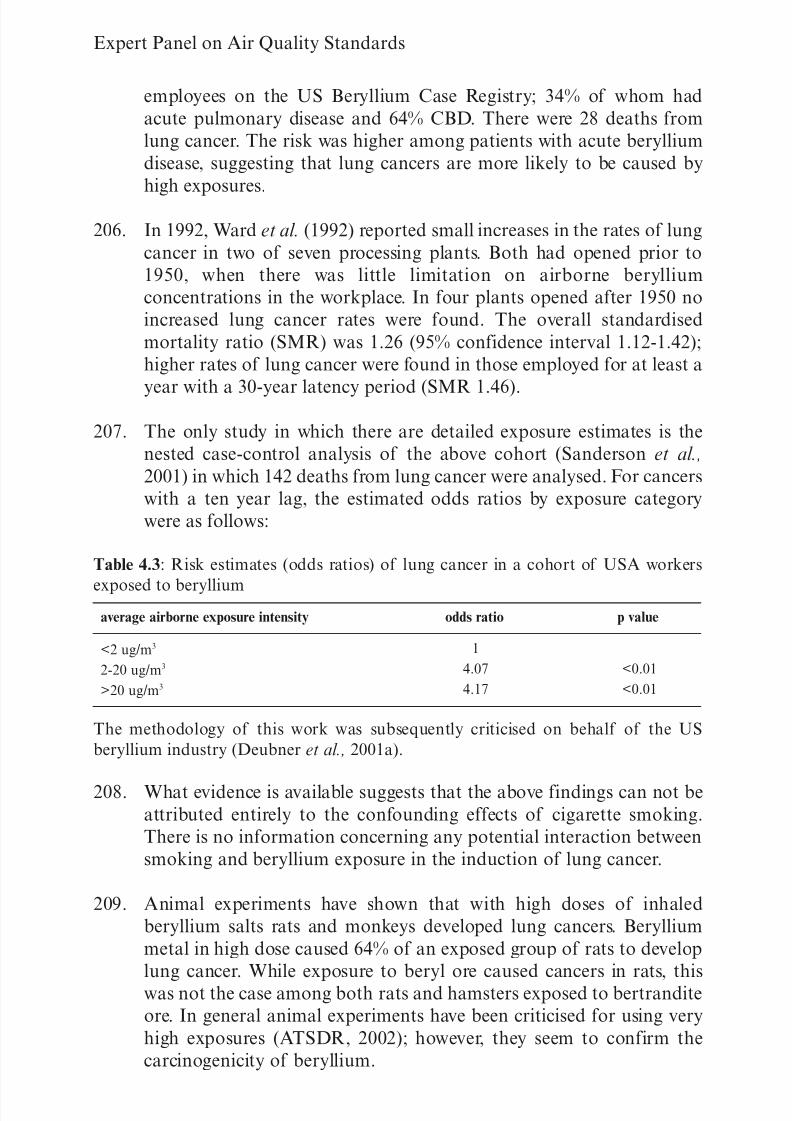
8/6/2019 Metals and Metal Lo Ids
http://slidepdf.com/reader/full/metals-and-metal-lo-ids 88/139
72
Expert Panel on Air Quality Standards
employees on the US Beryllium Case Registry; 34% of whom had
acute pulmonary disease and 64% CBD. There were 28 deaths from
lung cancer. The risk was higher among patients with acute beryllium
disease, suggesting that lung cancers are more likely to be caused by
high exposures.
206. In 1992, Ward et al. (1992) reported small increases in the rates of lung
cancer in two of seven processing plants. Both had opened prior to
1950, when there was little limitation on airborne beryllium
concentrations in the workplace. In four plants opened after 1950 no
increased lung cancer rates were found. The overall standardised
mortality ratio (SMR) was 1.26 (95% confidence interval 1.12-1.42);
higher rates of lung cancer were found in those employed for at least a
year with a 30-year latency period (SMR 1.46).
207. The only study in which there are detailed exposure estimates is the
nested case-control analysis of the above cohort (Sanderson et al.,
2001) in which 142 deaths from lung cancer were analysed. For cancers
with a ten year lag, the estimated odds ratios by exposure category
were as follows:
Table 4.3: Risk estimates (odds ratios) of lung cancer in a cohort of USA workers
exposed to beryllium
The methodology of this work was subsequently criticised on behalf of the US
beryllium industry (Deubner et al., 2001a).
208. What evidence is available suggests that the above findings can not beattributed entirely to the confounding effects of cigarette smoking.
There is no information concerning any potential interaction between
smoking and beryllium exposure in the induction of lung cancer.
209. Animal experiments have shown that with high doses of inhaled
beryllium salts rats and monkeys developed lung cancers. Beryllium
metal in high dose caused 64% of an exposed group of rats to develop
lung cancer. While exposure to beryl ore caused cancers in rats, this
was not the case among both rats and hamsters exposed to bertrandite
ore. In general animal experiments have been criticised for using very
high exposures (ATSDR, 2002); however, they seem to confirm the
carcinogenicity of beryllium.
average airborne exposure intensity odds ratio p value
<2 ug/m3
2-20 ug/m3
>20 ug/m3
1
4.07
4.17
<0.01
<0.01
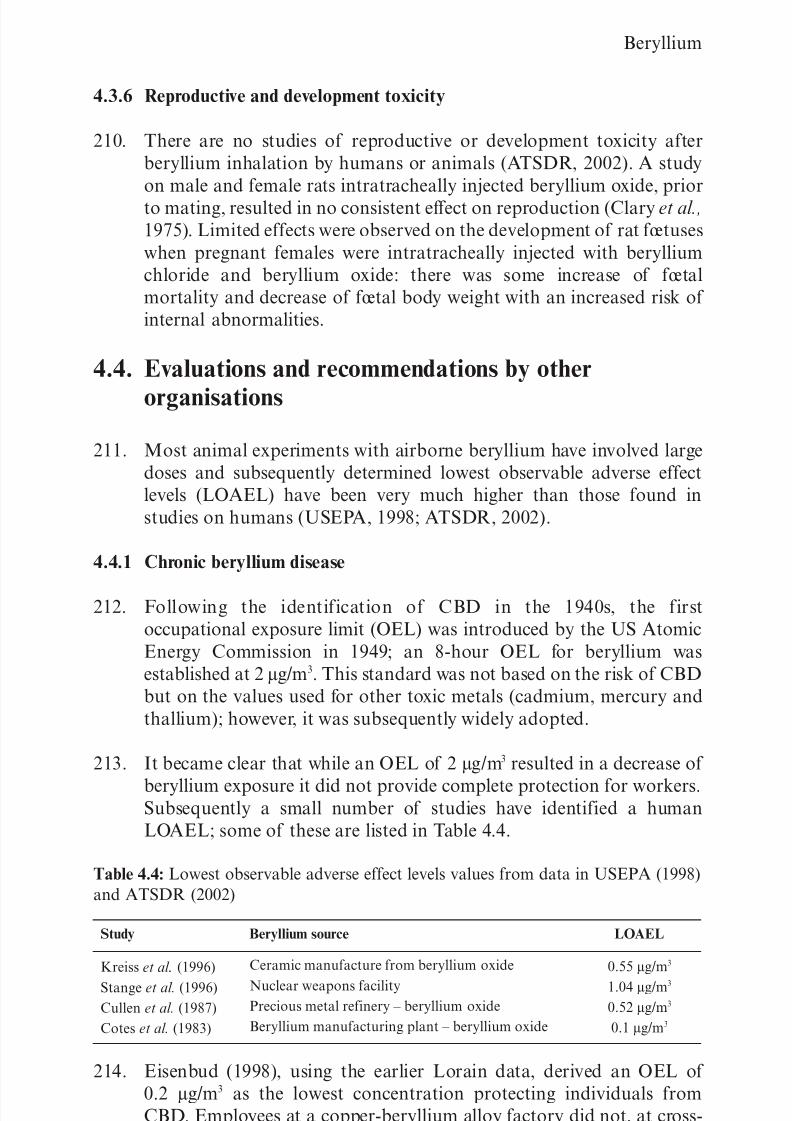
8/6/2019 Metals and Metal Lo Ids
http://slidepdf.com/reader/full/metals-and-metal-lo-ids 89/139
73
Beryllium
4.3.6 Reproductive and development toxicity
210. There are no studies of reproductive or development toxicity after
beryllium inhalation by humans or animals (ATSDR, 2002). A study
on male and female rats intratracheally injected beryllium oxide, prior
to mating, resulted in no consistent effect on reproduction (Clary et al.,
1975). Limited effects were observed on the development of rat fœtuses
when pregnant females were intratracheally injected with beryllium
chloride and beryllium oxide: there was some increase of fœtal
mortality and decrease of fœtal body weight with an increased risk of
internal abnormalities.
4.4. Evaluations and recommendations by other
organisations
211. Most animal experiments with airborne beryllium have involved large
doses and subsequently determined lowest observable adverse effect
levels (LOAEL) have been very much higher than those found in
studies on humans (USEPA, 1998; ATSDR, 2002).
4.4.1 Chronic beryllium disease
212. Following the identification of CBD in the 1940s, the first
occupational exposure limit (OEL) was introduced by the US Atomic
Energy Commission in 1949; an 8-hour OEL for beryllium was
established at 2 µg/m3. This standard was not based on the risk of CBD
but on the values used for other toxic metals (cadmium, mercury and
thallium); however, it was subsequently widely adopted.
213. It became clear that while an OEL of 2 µg/m3 resulted in a decrease of
beryllium exposure it did not provide complete protection for workers.Subsequently a small number of studies have identified a human
LOAEL; some of these are listed in Table 4.4.
Table 4.4: Lowest observable adverse effect levels values from data in USEPA (1998)
and ATSDR (2002)
214. Eisenbud (1998), using the earlier Lorain data, derived an OEL of
0.2 µg/m3 as the lowest concentration protecting individuals from
CBD. Employees at a copper-beryllium alloy factory did not, at cross-
sectional survey, have either sensitisation or CBD if they worked in
Study Beryllium source LOAEL
Kreiss et al . (1996)
Stange et al. (1996)
Cullen et al. (1987)
Cotes et al. (1983)
Ceramic manufacture from beryllium oxide
Nuclear weapons facility
Precious metal refinery – beryllium oxide
Beryllium manufacturing plant – beryllium oxide
0.55 µg/m3
1.04 µg/m3
0.52 µg/m3
0.1 µg/m3
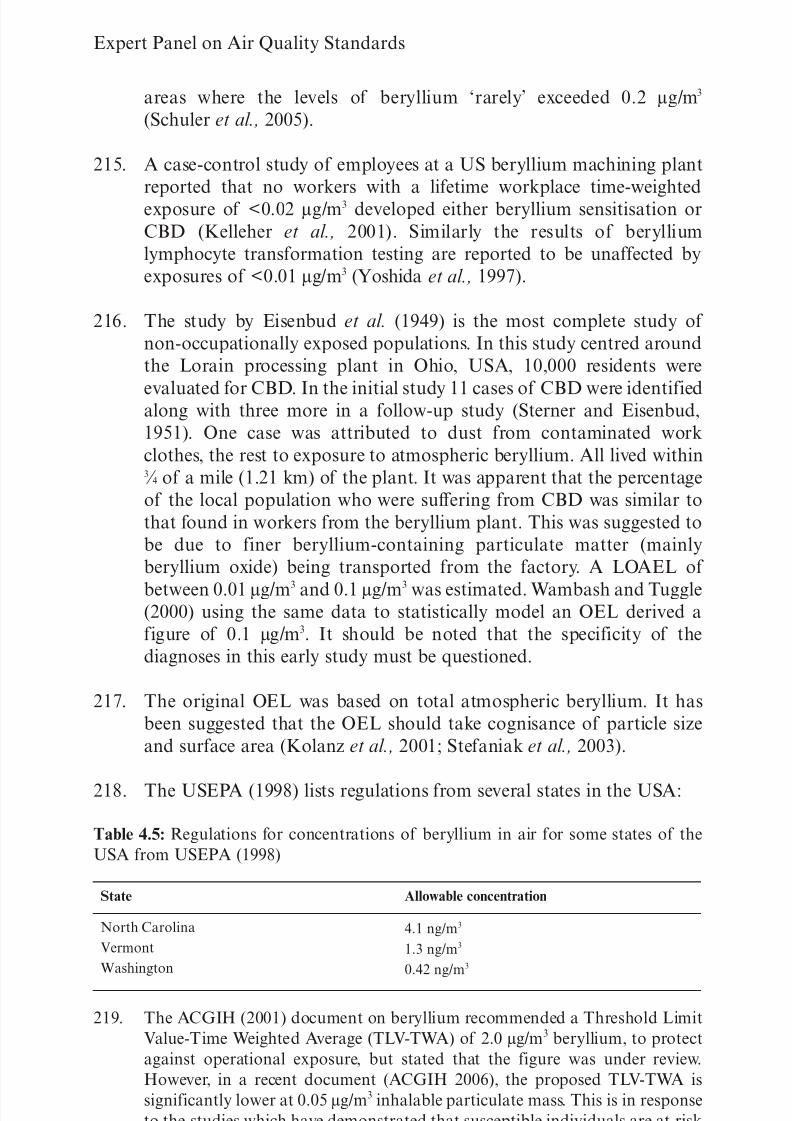
8/6/2019 Metals and Metal Lo Ids
http://slidepdf.com/reader/full/metals-and-metal-lo-ids 90/139
74
Expert Panel on Air Quality Standards
areas where the levels of beryllium ‘rarely’ exceeded 0.2 µg/m3
(Schuler et al., 2005).
215. A case-control study of employees at a US beryllium machining plant
reported that no workers with a lifetime workplace time-weightedexposure of <0.02 µg/m3 developed either beryllium sensitisation or
CBD (Kelleher et al., 2001). Similarly the results of beryllium
lymphocyte transformation testing are reported to be unaffected by
exposures of <0.01 µg/m3 (Yoshida et al., 1997).
216. The study by Eisenbud et al. (1949) is the most complete study of
non-occupationally exposed populations. In this study centred around
the Lorain processing plant in Ohio, USA, 10,000 residents were
evaluated for CBD. In the initial study 11 cases of CBD were identifiedalong with three more in a follow-up study (Sterner and Eisenbud,
1951). One case was attributed to dust from contaminated work
clothes, the rest to exposure to atmospheric beryllium. All lived within3 ⁄ 4 of a mile (1.21 km) of the plant. It was apparent that the percentage
of the local population who were suffering from CBD was similar to
that found in workers from the beryllium plant. This was suggested to
be due to finer beryllium-containing particulate matter (mainly
beryllium oxide) being transported from the factory. A LOAEL of
between 0.01 µg/m3 and 0.1 µg/m3 was estimated. Wambash and Tuggle(2000) using the same data to statistically model an OEL derived a
figure of 0.1 µg/m3. It should be noted that the specificity of the
diagnoses in this early study must be questioned.
217. The original OEL was based on total atmospheric beryllium. It has
been suggested that the OEL should take cognisance of particle size
and surface area (Kolanz et al., 2001; Stefaniak et al., 2003).
218. The USEPA (1998) lists regulations from several states in the USA:
Table 4.5: Regulations for concentrations of beryllium in air for some states of the
USA from USEPA (1998)
219. The ACGIH (2001) document on beryllium recommended a Threshold Limit
Value-Time Weighted Average (TLV-TWA) of 2.0 µg/m3 beryllium, to protect
against operational exposure, but stated that the figure was under review.
However, in a recent document (ACGIH 2006), the proposed TLV-TWA is
significantly lower at 0.05 µg/m3 inhalable particulate mass. This is in response
to the studies which have demonstrated that susceptible individuals are at risk
at low atmospheric concentrations of beryllium and that inhalation of
State Allowable concentration
North Carolina
Vermont
Washington
4.1 ng/m3
1.3 ng/m3
0.42 ng/m3
8/6/2019 Metals and Metal Lo Ids
http://slidepdf.com/reader/full/metals-and-metal-lo-ids 91/139
75
Beryllium
respirable particulate beryllium substantially increases the risk of developing
sensitisation and CBD.
220. The USA Occupational Safety and Health Administration (OSHA) currently
list a Permissible Exposure Limit (PEL) of 2 µg/m3 as an eight-hour time-
weighted average (TWA) for beryllium and its compounds. This isaccompanied by an acceptable ceiling concentration of 5 µg/m3. Exposures are
allowed to exceed 5 µg/m3 (but never exceed 25 µg/m3) for a maximum of 30
minutes during an 8-hr shift but there must be corresponding periods of lower
exposure such that exposure for the 8-hr shift does not exceed the 8-hr TWA
PEL. OSHA is in the process of re-evaluating these limits owing to concerns
that they may not be adequate to protect health (OSHA, 2005).
221. In the UK the maximum exposure limit (MEL) assigned for beryllium and its
compounds is 2 µg/m3, averaged over an 8-hour period (HSE, 1995). Maximum
Exposure Limits are occupational exposure limits set under the Control of
Substances Hazardous to Health (COSHH) Regulations (2002 as amended).
4.4.2 Lung cancer
222. The USEPA (1998) has estimated the unit health risk from lung cancer due to
continuous exposure to beryllium to be 2.4 x 10⁻³ per µg/m3. On this basis they
have further estimated that an individual inhaling in an atmosphere
containing 0.4 ng/m3 beryllium throughout life, would theoretically have no
more than a one in a million increased chance of lung cancer; while anindividual spending a lifetime inhaling an atmosphere containing 4 ng/m3
beryllium, would not have more than a one in a hundred thousand increased
chance of developing lung cancer.
223. Using the EPA figures Willis and Florig (2002) suggest that for an individual
exposed to 2 µg/m3 of beryllium for a 2,000-hour work year and a 40-year
working life, the lifetime lung cancer risk would be 0.0005, which is an order
of magnitude smaller than that of CBD for sensitised individuals. These
authors further suggest that the lifetime lung cancer mortality rate for an
individual living in close proximity to a beryllium-emitting industrial site,
which is in compliance with the EPA limit for concentrations around
beryllium plants (0.01 µg/m3) will be approximately 2 x 10⁻⁵. McCanlies et al.
(2003) also suggest that the risk of CBD in sensitised individuals vastly
exceeds that of lung cancer.
4.5. Justification for air quality guideline
224. Because the risks of sensitisation and CBD are apparent at far lowerexposures, it seems appropriate to base a guideline on these rather than on the
risk of lung cancer.
225. Use of a no observed adverse effects level (NOAEL) of 0.02 ug/m3 for both
sensitisation and CBD (Kelleher et al., 2001) with division by ten to allow for
the greater exposure duration of the general public and a further ten to allow
for the presence of susceptible individuals would produce a guideline value of
0.2 ng/m3.
8/6/2019 Metals and Metal Lo Ids
http://slidepdf.com/reader/full/metals-and-metal-lo-ids 92/139
76
Expert Panel on Air Quality Standards
226. The Panel recognises the uncertainties over the time period required to induce
a disease characterised by sensitisation but considers that an annual averaging
time would be appropriate.
4.6. Recommendation227. 0.2 ng/m3 total particulate beryllium in the PM10 size fraction, as an
annual mean.
228. This value is close to the highest level measured in a UK roadside site.Given the paucity of data, the Panel recommends that further and moreextensive measurement of airborne particulate beryllium be made inurban and industrial centres across the UK to establish whether traffic orindustrial sources are the more important.
References
ACGIH (2001). Beryllium and compounds. American Committee of Governmental
Industrial Hygienists 1-6.
ACGIH (2006). TLVs and BEIs. Based on the Documentation of the Threshold
Limit Values for Chemicals Substances and Physical Agents and Biological
Exposure Indices. American Committee of Governmental Industrial Hygienists.ISBN: 1-882417-62-3.
Amicosante, M., Berretta, F., Franchi, A., Rogliani, P., Dott, C., Losi, M., Dweik, R.
and Saltini, C. (2002). HLA-DP-unrestricted TNF-· release in beryllium-stimulated
peripheral blood mononuclear cells. Eur. Respir. J. 20, 1174-1178.
Anderson, O. (1983). Effects of coal combustion products and metal compounds on
sister chromatid exchange (SCE) in a macrophagelike cell line. Environ. Health
Perspect. 47, 239-253.
Apostoli, P. and Schaller, K.H. (2001). Urinary beryllium – suitable tool for assessing
occupational and environmental beryllium exposure? Int. Arch. Occup. Environ.
Health 74, 162-166.
ATSDR (2002). Toxicological Profile for Beryllium. US Agency for Toxic Substances
and Disease Registry. CAS# 7440-41-7, 1-290.
Benko, V., Vasileva, E. V. and Symon, K. (1980). Immunological aspects of exposure
to emissions from burning coal of high beryllium content. Environ. Res. 22, 439-449.
Boix, A., Jordan, M. M., Querol, X. and Sanfeliu, T. (2001). Characterization of total
suspended particles around a power station in an urban coastal area in eastern Spain.
Environ. Geol. 40, 891-896.
Boukhalfa, H., Lewis, J. G., and Crumbliss, A. L. (2004). Beryllium(II) binding to
ATP and ADP: potentiometric determination of the thermodynamic constants and
implications for in vivo toxicity. BioMetals 17, 105-109.
8/6/2019 Metals and Metal Lo Ids
http://slidepdf.com/reader/full/metals-and-metal-lo-ids 93/139
77
Beryllium
Bouska, V., (1981). Geochemistry of Coal. Akademia, Prague.
Clary, J. J., Bland, L. S. and Stokinger, H. E. (1975). The effect of reproduction and
lactation on the extent of latent chronic beryllium disease. Toxicol. Appl. Pharmacol.
33, 214-221.
Cotes, J.E., Gilson, J.C., McKerrow, C.B., and Oldham, P. (1983). A long term follow-
up of workers exposed to beryllium. Brit. J. Ind. Med. 40, 13-21.
Cullen, M.R., Kominsky, J.R., Rossman, M.D., Cherniack, M.G., Rankin, J.A.,
Balmes, J.R., Kern, J.A., Daniele, R.P., Palmer, L., Naegel, G.P., et al. (1987) Chronic
beryllium disease in a precious metal refinery. Clinical epidemiologic and
immunologic evidence for continuing risk from exposure to low level beryllium fume.
Am Rev Respir Dis. 135(1):201-208.
Cunningham, L.D. (2003). Beryllium. U. S. Geol. Surv. Minerals Yearbook 2003.
Day, G.A., Stefaniak, A.B., Weston, A. and Tinkle, S.S. (2006). Beryllium exposure:
dermal and immunological considerations. Int Arch Occup Environ Health. 79:161-164.
Deubner, D.C., Lockey, J.L., Kotin, P., Powers, M.B., Miller, F., Rogers, A.E. and
Trichopoulos, D. (2001a). Re: Lung cancer case-control study of beryllium workers.
Sanderson W.T., Steenland K., Petersen M.R. Letter to the editor. Am. J. Ind. Med.
40, 284-285.
Deubner, D.C., Lowney, Y.W., Paustenbach, D.J., Warmerdam, J. (2001b).
Contribution of incidental exposure pathways to total beryllium exposures. Appl.
Occup. Environ. Hygiene 16, 568-578.
Dore, C.J., Watterson, J.D., Goodwin, J.W.L., Murrells, T.P., Passant, N.R., Hobson,
M.M., Baggott, S.L., Thistlethwaite, G., Coleman, P.J., King, K.R., Adams, M. and
Cumine, P.R. (2004), UK Emissions of Air Pollutants 1970-2002. Netcen, AEA
Technology, Harwell, Oxfordshire. Report AEAT/ENV/R/1933. ISBN 0954713648.
Edmunds, W.M and Trafford, J.M. (1993). Beryllium in river baseflow, shallow
groundwaters and major aquifers of the U.K. Appl. Geochem., Supp. 2, 223-233.
Eisenbud, M. (1998). The standard for control of chronic beryllium disease. Appl.
Occup. Environ. Hyg. 13, 25-31.
Eisenbud, M. and Lisson, J. (1983). Epidemiological aspects of beryllium-induced
non-malignant lung disease. Appl. Occup. Environ. Hyg. 13, 25-31.
Eisenbud, M., Berghout, C.F. and Steadman, L.T. (1948). Environmental studies in plantsand laboratories using beryllium: the acute disease. J. Ind. Hyd. Toxicol. 30, 282-285.
Eisenbud, M., Wanta, R.C., Dustan, C., Steadman, L.T., Harris, W.B. and Wolf, B.S.
(1949). Non-occupational berylliosis. J. Ind. Hyg. Toxicol. 31, 282-294.
Freise, R. and Israel, G.W. (1987). [Investigations into suspended dust load in
Berlin (West)] Technische Universität Berlin, Institut für Technischen Umweltschutz.
(in German)
8/6/2019 Metals and Metal Lo Ids
http://slidepdf.com/reader/full/metals-and-metal-lo-ids 94/139
78
Expert Panel on Air Quality Standards
Gorden, T. and Bowser, D. (2003). Beryllium: genotoxicity and carcinogenicity.
Mutation Res. 533, 99-105.
Harrison, R.M., Tilling, R., Callen Romero, M.S., Harrad, S. and Jarvis, K. (2003).
A Study of Trace Metals and Polycyclic Aromatic Hydrocarbons in the Roadside
Environment. Atmos. Environ. 37, 2391-2402.
Henneberger, P.K., Cumro, D., Deubner, D.D., Kent, M.S., McCawley, M. and Kreiss,
K. (2001). Beryllium sensitisation and disease among long-term and short-term
workers in a beryllium ceramics plant. Int. Arch. Occup. Environ. Health 74, 167-176.
HSE (1995). Beryllium and You. Health and Safety Executive.
http://www.hse.gov.uk/pubns/indg311.pdf
IARC (1993). Beryllium, cadmium, mercury and exposures in the glass
manufacturing Industry. IARC Monographs on the Evaluation of Carcinogenic Risk
of Chemical to Humans, vol. 58.
Kelleher, P.C., Martyny, J.W., Mroz, M.M., Maier, L.A., Ruttenber, A.J., Young,
D.A. and Newman, L.S. (2001). Beryllium particulate exposure and disease relations
in a beryllium machining plant. J Occup Environ Med 43:238-249.
Kent, M.S., Robins, T.G. and Macl, A.K. (2001). Is total mass or mass of alveolar-
deposited airborne particles of beryllium a better predictor of the prevalence of
disease? A preliminary study of a beryllium processing facility. Appl. Occup. Environ.Hygiene 16, 539-558.
Kolanz, M. E. (2001). Introduction to beryllium: Uses, regulatory history, and
disease. Appl. Occup. Environ. Hygiene 16, 559-567.
Kolanz, M.E., Madl, A.K., Kelsh, M.A., Kent, M.S., Kalmes, R.M. and
Paustenbach, D.J. (2001). A comparison and critique of historical and current
exposure assessment methods for beryllium: Implications for evaluating risk of
chronic beryllium disease. Appl. Occup. Environ. Hygiene 16, 559-567.
Kreiss, K., Mroz, M.M., Newman, L.S., Martyny, J.W. and Zhen, B. (1996).
Machining risk of beryllium disease and sensitisation with median exposures below
2 µg/m3. Am. J. Ind. Med. 30, 16-25.
Kreiss, K., Mroz, M.M., Zhen, B., Wiedemann, H. and Barna, B. (1997). Risks of
beryllium disease related to work processes at a metal, alloy, and oxide production
plant. Occup. Environ. Med. 54, 605-612.
Kreiss, K., Wasserman S., Mroz, M.M. and Newman, L.S., (1993). Beryllium diseasescreening in the ceramics industry. J. Occup. Med. 35, 267-274.
Kubiznáková, J. (1987). Beryllium pollution from slag and ashes from thermal power
stations. Water Air Soil Pollut. 34, 363-367.
Maier, L. A. (2002). Genetic and exposure risks for chronic beryllium disease. Clin.
Chest Med. 23, 827-839.
8/6/2019 Metals and Metal Lo Ids
http://slidepdf.com/reader/full/metals-and-metal-lo-ids 95/139
79
Beryllium
Maier, L., McGrath, D.S., Sato, H., Lympany, P., Welsh, K., du Bois, R., Silveira, L.,Fontenot, A.P., Sawyer, R.T. and Wilcox, E. (2003). Influence of MHC class II insusceptibility to beryllium sensitisation and chronic beryllium disease. J. Immunol.171, 6910-6918.
Martyny, J.W., Hoover, M.D., Mroz, M.M., Ellis, K., Maier, L.S., Sheff, K.L. andNewman, L.S. (2000). Aerosols generated during beryllium machining. J. Occup.Environ. Med. 42, 8-18.
McCanlies, E.C., Ensey, J.S., Schuler, C.R., Kreiss, K. and Weston, A. (2004). Theassociation between HLA-DPB1Glu69 and chronic beryllium disease and berylliumsensitization. Am. J. Indust. Med. 46, 95-103.
McCanlies, E.C., Kreiss, K., Andrew, M., and Weston, A. (2003). HLA-DPB1 andchronic beryllium disease: A HuGE review. Am. J. Epidemiol. 157, 368-398.
Mueller, J. (1979). Beryllium, cobalt, chromium and nickel in particulate matter of ambient air. In: Proc. Internat. Conf. Heavy Metals in the Environment, London,September 1979. Edinburgh, CEP Consultants Ltd., 300-303.
Newman, L.S., Mroz, M.M., Balkisson, R. and Maier, L.A. (2005). Berylliumsensitisation progresses to chronic beryllium disease. A longitudinal study of diseaserisk. Am. J. Respir. Crit. Care Med. 171, 54-60.
OSHA (2005). Toxic and Hazardous Substances. Occupational Safety and HealthAdministration – USA. Washington, DC.
Paustenbach, D.J., Madl, A.K. and Greene, J.F. (2001). Identifying an appropriateoccupational exposure limit (OEL) for beryllium: data gaps and current researchinitiatives. Appl. Occup. Environ. Hygiene 16, 527-538.
Price, D.J. and Joshi, J.G. (1983). Ferritin. Binding of beryllium and other divalentmetal ions. J Biol Chem. 258:10873-10880.
Reeves, A.L. and Vorwald, A.J. (1967). Beryllium carcinogenesis. II. Pulmonary
deposition and clearance of inhaled beryllium sulfate in the rat. Cancer Res 27:446-451.
Reimann, C., Äyräs, M., Chekushin, V., Bogatyrev, I., Boyd, R., Caritat, P. de, Dutter,R., Finne, T.E., Halleraker, J.H., Jæger, Ø., Kashulina, G., Lehto, O., Niskavaara, H.,Pavlov, V., Räisänen, M.I., Strand, T. and Volden, T. (1998). EnvironmentalGeochemical Atlas of the Central Barents Region. Geological Survey of Norway.
Richeldi, L., Kreiss, K., Mroz, M.M., Zhen, B. and Tartoni, P. (1997). Interaction of
genetic and exposure factors in the prevalence of berylliosis. Am. J. Ind. Med. 32,337-340.
Rosenman, K., Hertzberg, V., Rice, C., Reilly, M.J., Aronchick, J., Parker, J.E.,Regovich, J. and Rossman, M. (2005). Chronic beryllium disease and sensitisation ata beryllium processing facility. Environ. Health Pers. 113, 1366-1372.
8/6/2019 Metals and Metal Lo Ids
http://slidepdf.com/reader/full/metals-and-metal-lo-ids 96/139
80
Expert Panel on Air Quality Standards
Ross, W.D., Pyle, J.L. and Sievers, R.E. (1977). Analysis of beryllium in ambient air
particulates by gas chromatography. Environ. Sci. Technol. 11, 467-471.
Saltini, C., Richeldi, L., Losi, M., Amicosante, M., Voorter, C., van den Berg-
Loonen, Dweik, R.A., Wiedemann, H.P., Deubner, D.C. and Tinelli, C. (2001).
Major histocompatibility locus genetic markers of beryllium sensitization anddisease. Eur. Respir. J. 18, 677-684.
Sanderson, W.T., Ward, E.M., Steenland, K. and Petersen, M.R. (2001). Lung cancer
case-control study of beryllium workers. Am. J. Ind. Med. 39, 133-144.
Sawyer, R.T., Maier, L.A., Kittle, L.A. and Newman, L.S. (2002). Chronic beryllium
disease: a model interaction between innate and acquired immunity. Int.
Immunopharm. 2, 249-261.
Sawyer, R.T., Day, B.J., Fadok, V.A., Chiarappa-Zucca, M., Maier, L.A., Fontenot,
A. P., Silveira, L. and Newman, L.S. (2004). Beryllium-Ferritin. Lymphocyte
proliferation and macrophage apostosis in chronic beryllium disease. Am. J. Repir.
Cell. Mol. Biol. 31, 470-477.
Sawyer, R.T., Abraham, J.L., Daniloff, E. and Newman L.S. (2005). Secondary ion
mass spectroscopy demonstrates retention of beryllium in chronic beryllium disease
granulomas. J Occup Environ Med. 47:1218-26.
Schuler, C.R., Kent, M.S., Deubner, D.C., Berakis, M.T., McCawley, M.,Henneberger, P.K., Rossman, M.D. and Kreiss, K. (2005). Process-related risk of
beryllium sensitisation and disease in a copper-beryllium alloy facility. Am J Ind Med
47:195-205.
Stadnichenko, T.M., Zubovic, P. and Sheffey, N.B. (1961). Beryllium contents of
American Coals. U. S. Geol. Surv. Bull., 1084-K, 253-295.
Stange, A.W., Hilmas, D.E. and Furman, F.J. (1996). Possible health risks from low
level exposure to beryllium. Toxicol. 111, 213-224.
Stange, A.W., Hilmas, D.E., Furman, F.J. and Gatliffe, T.R. (2001). Beryllium
sensitisation and chronic beryllium disease at a former nuclear weapons facility. Appl.
Occup. Environ. Hyg. 16, 405-417.
Steenland, K. and Ward, E. (1991). Lung cancer incidence among patients with
beryllium disease: a cohort mortality study. J. Natl. Cancer Inst., 83, 1380-1385.
Stefaniak, A.B., Hoover, M.D., Dickerson, R.M., Peterson, E.J., Day, G.A., Breysse,
P.N., Kent, M.S. and Scripsick, R.C. (2003). Surface area of respirable berylliummetal, oxide, and copper alloy aerosols and implications for assessment of exposure
risk of chronic beryllium disease. AIHA Journal 64, 297-305.
Sterner, J.H. and Eisenbud, M. (1951). Epidemiology of beryllium intoxication.
Arch. Ind. Hyg. Occup. Med. 4, 123-151.
8/6/2019 Metals and Metal Lo Ids
http://slidepdf.com/reader/full/metals-and-metal-lo-ids 97/139
81
Beryllium
Sussman, V.H., Lieben, J. and Cleland, J.G. (1959). An air pollution study of a
community surrounding a beryllium plant. Am. Indust. Hyg. Assoc. J. 20, 504-508.
Tinkle, S.S., Antonini, J.M., Rich, B.A., Roberts, J.R., Salmen, R., De Pree, K. and
Adkins, E.J., (2003). Skin as a route of exposure and sensitisation in chronic
beryllium disease. Environ. Health Perspect. 111, 1202-1208.
USDHHS (2003). US Department of Health and Human Services National
Toxicology Programme (NTPS-NIES). 11th report on carcinogens.
USEPA (1998). Toxicological Review of Beryllium and compounds. EPA/635/R-
98/008. US Environmental Protection Agency, Washington, DC.
Viet, S., Torma-Krajewski, J. and Rogers, J., (2000). Rocky Flats beryllium health
surveillance. Am. Indust. Health Assoc. J. 61, 244-254.
Wambash, P.F. and Tuggle, R.M. (2000). Development of an eight-hour occupational
exposure limit for beryllium. Appl. Occup. Environ. Hygiene 15, 581-587.
Ward, E., Okun, A., Ruder, A., Fingerhut, M., and Steenland K. (1992). A mortality
study of workers at seven beryllium processing plants. Am. J. Ind. Med. 22, 885-904.
Wegner, R., Heinrich-Ramm, R., Nowak, D., Olma, K., Poschadel, R. and
Szadkowski, D. (2000). Lung function, biological monitoring, and biological effect
monitoring of gemstone cutters exposed to beryls. Occup. Environ. Med. 57, 133-139.
Welch, L., Ringen, K., Bingham, E., Dement, J., Takaro, T., McGowan, W., Chen, A.
and Quinn, P. (2004). Screening for beryllium disease among construction trade
workers at Department of Energy nuclear sites. Am J Ind Med. Sep;46(3):207-18.
WHO/IPCMS (2001). Beryllium and beryllium compounds. CICAD (Concise
International Chemical Assessment Document) 32.
Willis, H.E. and Florig, H.K. (2002). Potential exposures and risks from beryllium-
containing products. Risk Anal. 22, 1019-1033.
Yoshida, T., Shima, S., Nakoga, K., Taniwaki, H., Wada, A., Kurita, H. and Morita,
K. (1997). A study on the beryllium lymphocyte transformation test and beryllium
levels in the working environment. Ind Health 35(3):374-379.

8/6/2019 Metals and Metal Lo Ids
http://slidepdf.com/reader/full/metals-and-metal-lo-ids 98/139
82
8/6/2019 Metals and Metal Lo Ids
http://slidepdf.com/reader/full/metals-and-metal-lo-ids 99/139
83
Chapter 5
Chromium
5.1 Background
5.1.1 Basic chemical information
229. Chromium is a metallic element. The metal is hard and dense and is
resistant to chemical attack because a protective film of chromium
trioxide forms on the surface. It forms stable compounds, which are
widespread in the environment. It is relatively abundant in soil and
rocks, but the only important ore is ferrochromite. Chromium
comprises about 200 mg/kg of the Earth’s crust. The medianconcentration in UK soils is about 39 mg/kg: concentrations in
polluted soils are highly variable but may be as high as 10,000 mg/kg
(Alloway, 1995).
230. Chromium metal is stable but occurs in the free form only as a result
of industrial production. In the environment, chromium exists
predominantly in two oxidation (valence) states. Trivalent chromium
(Cr(III)) is the more stable and thus more abundant. Most Cr(III)
compounds are insoluble in water. Hexavalent chromium compounds(Cr(VI)) are chiefly produced by industrial processes, and are generally
more soluble in water than the Cr(III) compounds. Other oxidation
(valence) states are known – divalent, tetravalent and pentavalent
forms – but are unstable. An exception is the tetravalent chromium
dioxide (CrO2), which finds wide use in magnetic recording tapes.
231. Trivalent chromium is an essential nutrient for humans and animals,
where it potentiates the action of insulin, assisting the metabolism of
glucose, protein and fat. Living plants and animals absorb the Cr(VI)form in preference to Cr(III), but once absorbed, it is reduced to the
stable Cr(III) state.
232. Chromium compounds are used for chrome plating, manufacture of
dyes and pigments, leather tanning, wood preserving (copper-chrome-
arsenate is used as a timber treatment), drilling mud, rust corrosion
inhibitors, textiles and copy machine toners (ATSDR, 2000). Other
uses include incorporation in metal alloys.
8/6/2019 Metals and Metal Lo Ids
http://slidepdf.com/reader/full/metals-and-metal-lo-ids 100/139
84
Expert Panel on Air Quality Standards
5.1.2 Sources of chromium in the UK atmosphere
233. Because of its presence in the earth’s crust, chromium exists in a range
of geological materials and is widespread in natural dusts. The main
natural sources of airborne chromium are forest fires and, perhaps,
volcanic eruptions. Man-made sources include all types of combustion
and emissions by the chromium industry. It may be assumed that all of
the chromium in air emitted from combustion sources is present as
particulate chromium and is associated with the fine particulate
fraction. Chromium from metallurgical production is usually in the
Cr(III) or the metallic (zero) state. During chromate production,
chromate dusts can be emitted. Aerosols containing chromic acid can
be produced during the chrome-plating process.
234. The chemical forms of chromium in the air are poorly understood but
chromium trioxide (CrO3) may be the most important single
compound (Sullivan, 1969). However it should be assumed that
airborne chromium exists partially in the Cr(VI) form. Hexavalent
chromium is subject to reduction to the Cr(III) form in the presence of
other pollutants such as hydrogen sulphide, iron salts, bisulphites,
oxides of nitrogen and organic material, which may also be emitted
from the same sources. Kimbrough et al. (1999) estimated that the half
life of Cr(VI) in the atmosphere ranges from 0.7-4.8 days.
235. Estimates of the comparative concentrations in air of Cr(III) and
Cr(VI) are uncertain, in part because the ratio is variable and
dependent on the source of chromium. In the UK it is likely that less
than 20% of emissions are of Cr(VI), those with the higher
proportions from chromium-using industries (Passant, 2002). The
proportion of Cr(VI) in ambient air may be lower than that measured
in emissions. Data from Canada, quoted by Rowbotham et al. (2000),
suggest that Cr(VI) constitutes between 3 and 8% of total airbornechromium in that country. Keiber et al. (2002) found that about half of
the chromium in rainwater in the USA was in water soluble form and
of this there were approximately equal concentrations of Cr(VI) and
Cr(III). As most of the insoluble chromium is likely to be present as
Cr(III), this implies that the Cr(III)/Cr(VI) ratio in air was about 3:1.
5.1.3 Ambient concentrations
236. Chromium occurs in the air of non-industrialised areas in
concentrations of less than 100 ng/m3 (WHO, 1988).
237. The main sources of chromium emissions to the air reported in the UK
National Atmospheric Emissions Inventory for 2004 include emissions
from the chemicals and iron and steel industries, power stations and
the combustion of treated wood. Combustion of coal in power
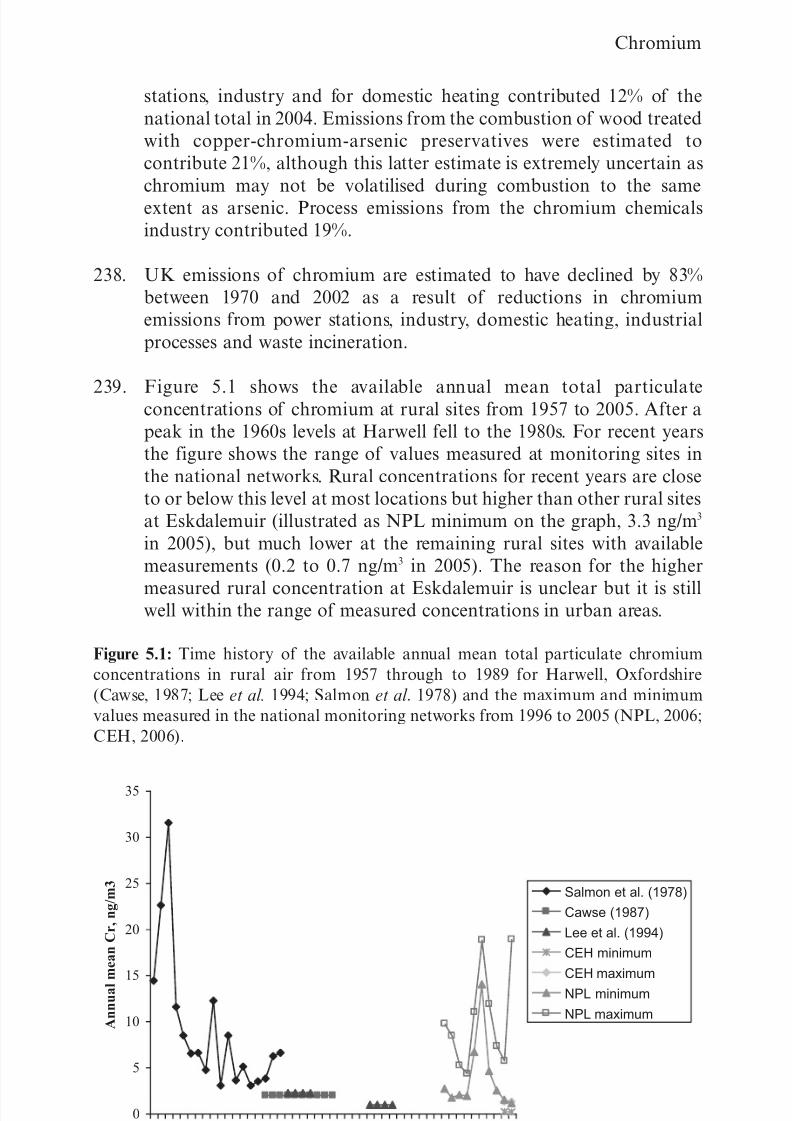
8/6/2019 Metals and Metal Lo Ids
http://slidepdf.com/reader/full/metals-and-metal-lo-ids 101/139
85
Chromium
stations, industry and for domestic heating contributed 12% of the
national total in 2004. Emissions from the combustion of wood treated
with copper-chromium-arsenic preservatives were estimated to
contribute 21%, although this latter estimate is extremely uncertain as
chromium may not be volatilised during combustion to the same
extent as arsenic. Process emissions from the chromium chemicals
industry contributed 19%.
238. UK emissions of chromium are estimated to have declined by 83%
between 1970 and 2002 as a result of reductions in chromium
emissions from power stations, industry, domestic heating, industrial
processes and waste incineration.
239. Figure 5.1 shows the available annual mean total particulateconcentrations of chromium at rural sites from 1957 to 2005. After a
peak in the 1960s levels at Harwell fell to the 1980s. For recent years
the figure shows the range of values measured at monitoring sites in
the national networks. Rural concentrations for recent years are close
to or below this level at most locations but higher than other rural sites
at Eskdalemuir (illustrated as NPL minimum on the graph, 3.3 ng/m3
in 2005), but much lower at the remaining rural sites with available
measurements (0.2 to 0.7 ng/m3 in 2005). The reason for the higher
measured rural concentration at Eskdalemuir is unclear but it is stillwell within the range of measured concentrations in urban areas.
Figure 5.1: Time history of the available annual mean total particulate chromium
concentrations in rural air from 1957 through to 1989 for Harwell, Oxfordshire
(Cawse, 1987; Lee et al. 1994; Salmon et al . 1978) and the maximum and minimum
values measured in the national monitoring networks from 1996 to 2005 (NPL, 2006;
CEH, 2006).
Salmon et al. (1978)
Cawse (1987)
Lee et al. (1994)
CEH minimum
CEH maximum
NPL minimum
NPL maximum
0
5
10
15
20
25
30
35
1 9 5 7
1 9 6 1
1 9 6 5
1 9 6 9
1 9 7 3
1 9 7 7
1 9 8 1
1 9 8 5
1 9 8 9
1 9 9 3
1 9 9 7
2 0 0 1
2 0 0 5
A n n u a l m e a n C r , n g / m 3
8/6/2019 Metals and Metal Lo Ids
http://slidepdf.com/reader/full/metals-and-metal-lo-ids 102/139
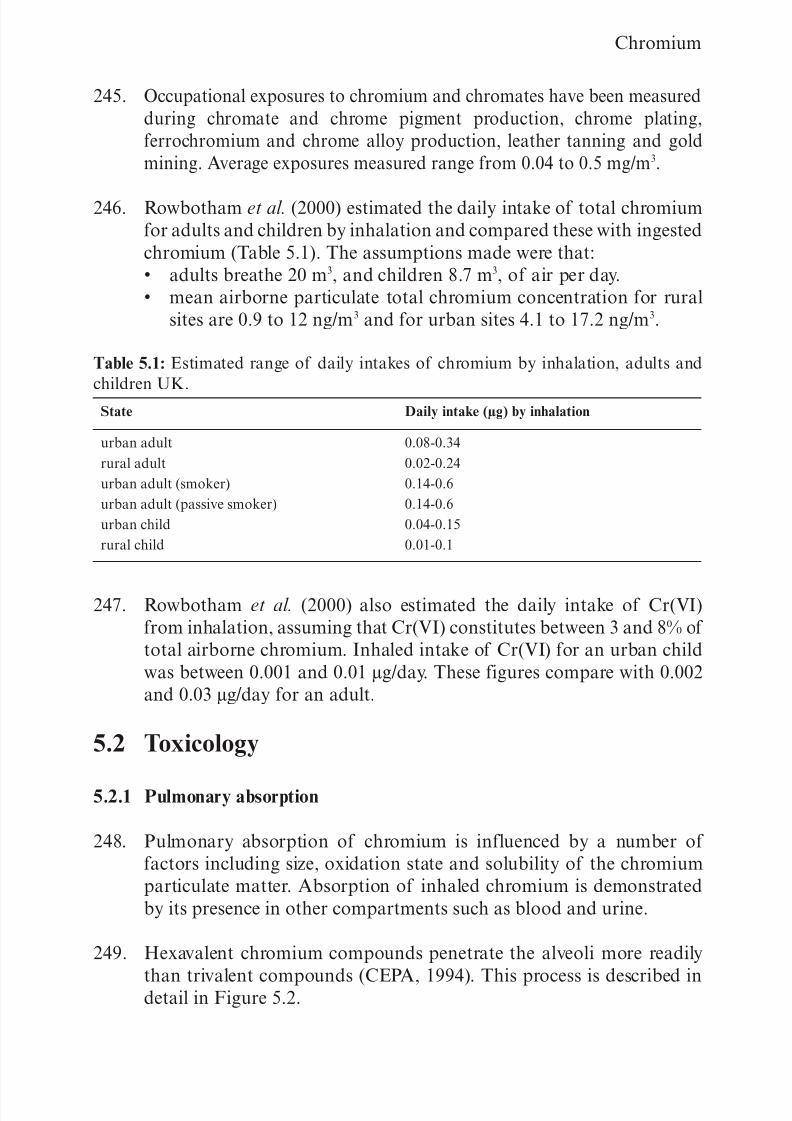
8/6/2019 Metals and Metal Lo Ids
http://slidepdf.com/reader/full/metals-and-metal-lo-ids 103/139
87
Chromium
245. Occupational exposures to chromium and chromates have been measured
during chromate and chrome pigment production, chrome plating,
ferrochromium and chrome alloy production, leather tanning and gold
mining. Average exposures measured range from 0.04 to 0.5 mg/m3.
246. Rowbotham et al. (2000) estimated the daily intake of total chromium
for adults and children by inhalation and compared these with ingested
chromium (Table 5.1). The assumptions made were that:
• adults breathe 20 m3, and children 8.7 m3, of air per day.
• mean airborne particulate total chromium concentration for rural
sites are 0.9 to 12 ng/m3 and for urban sites 4.1 to 17.2 ng/m3.
Table 5.1: Estimated range of daily intakes of chromium by inhalation, adults and
children UK.
247. Rowbotham et al. (2000) also estimated the daily intake of Cr(VI)
from inhalation, assuming that Cr(VI) constitutes between 3 and 8% of
total airborne chromium. Inhaled intake of Cr(VI) for an urban child
was between 0.001 and 0.01 µg/day. These figures compare with 0.002
and 0.03 µg/day for an adult.
5.2 Toxicology
5.2.1 Pulmonary absorption
248. Pulmonary absorption of chromium is influenced by a number of
factors including size, oxidation state and solubility of the chromium
particulate matter. Absorption of inhaled chromium is demonstrated
by its presence in other compartments such as blood and urine.
249. Hexavalent chromium compounds penetrate the alveoli more readily
than trivalent compounds (CEPA, 1994). This process is described indetail in Figure 5.2.
State Daily intake (µg) by inhalation
urban adult
rural adult
urban adult (smoker)
urban adult (passive smoker)
urban child
rural child
0.08-0.34
0.02-0.24
0.14-0.6
0.14-0.6
0.04-0.15
0.01-0.1
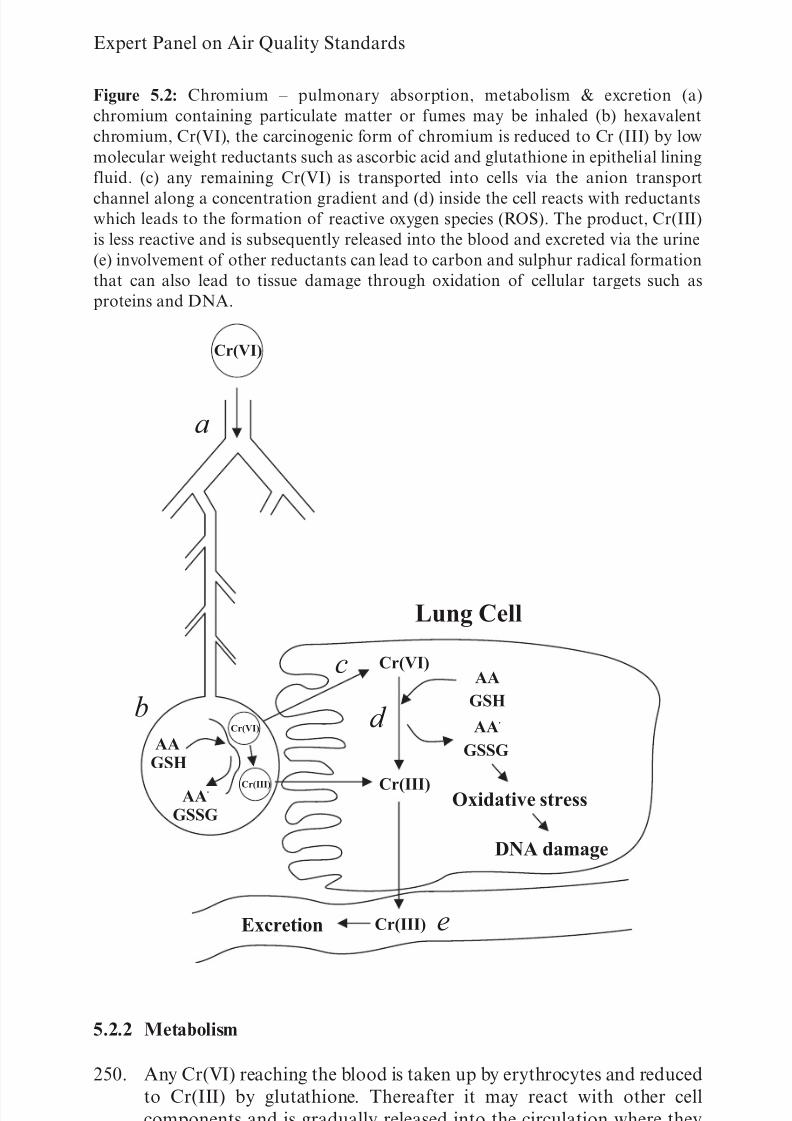
8/6/2019 Metals and Metal Lo Ids
http://slidepdf.com/reader/full/metals-and-metal-lo-ids 104/139
88
Expert Panel on Air Quality Standards
Figure 5.2: Chromium – pulmonary absorption, metabolism & excretion (a)
chromium containing particulate matter or fumes may be inhaled (b) hexavalent
chromium, Cr(VI), the carcinogenic form of chromium is reduced to Cr (III) by low
molecular weight reductants such as ascorbic acid and glutathione in epithelial lining
fluid. (c) any remaining Cr(VI) is transported into cells via the anion transport
channel along a concentration gradient and (d) inside the cell reacts with reductantswhich leads to the formation of reactive oxygen species (ROS). The product, Cr(III)
is less reactive and is subsequently released into the blood and excreted via the urine
(e) involvement of other reductants can lead to carbon and sulphur radical formation
that can also lead to tissue damage through oxidation of cellular targets such as
proteins and DNA.
5.2.2 Metabolism
250. Any Cr(VI) reaching the blood is taken up by erythrocytes and reduced
to Cr(III) by glutathione. Thereafter it may react with other cell
components and is gradually released into the circulation where they
bind to plasma proteins (USEPA, 1998).
Cr(VI)
Cr(VI)
Cr(III)Cr(III)
Cr(VI)
Cr(III)
AA
GSH
AAGSH
AA.
GSSG
AA.
GSSGOxidative stress
DNA damage
Excretion
a
b
c
Lung Cell
d
e
8/6/2019 Metals and Metal Lo Ids
http://slidepdf.com/reader/full/metals-and-metal-lo-ids 105/139
89
Chromium
5.2.3 Tissue distribution and excretion
251. Absorbed chromium travels around the body absorbed to plasma
proteins and is taken up by a range of tissues including bone, liver,
kidney and spleen (USEPA, 1998).
252. Absorbed chromium is eliminated largely in the urine with most of the
unabsorbed portion in faeces (CEPA, 1994). The hair and nails are
also minor pathways of excretion (Defra and EA, 2002).
5.3 Health effects
5.3.1 Acute effects
5.3.1.1 Animal studies
253. Trivalent and hexavalent chromium can result in toxicity following oral,
inhalation and dermal exposures. Acute oral toxicity in animals
increases with increasing water solubility. Oral LD50 ranges for trivalent
compounds range from 140-522 mg/kg and hexavalent compounds
range from 13-795 mg/kg (Government of Canada, 1994). Acute toxic
effects in rats and mice exposed to high single doses of Cr(VI) include
gastric ulcerations, pulmonary congestion, gastrointestinal oedema,
diarrhoea and cyanosis (von Burg and Liu, 1993).
254. In rats, LC50 values for inhaled, highly soluble chromium hexavalent
compounds are in the range of 33-65 mg/m3 (von Burg and Liu, 1993).
Associated effects include inflammatory responses and altered
macrophage morphology.
255. Hexavalent chromium compounds can cause severe eye and skinirritation which can lead to ulceration. LD50 values for acute dermal
exposure range from 400-677 mg/kg in rats. Associated effects include
necrosis of the application site, diarrhoea, hypoactivity, dermal
oedema and inflammation.
5.3.1.2 Human studies
256. Massive inhalations of chromium-containing fume can cause irritant
damage to the upper and lower respiratory tracts. A study of tenvolunteers exposed ‘briefly’ to CrO3 reported nasal irritation above
concentrations of 2.5 µg/m3 (Kuperman, 1964).
8/6/2019 Metals and Metal Lo Ids
http://slidepdf.com/reader/full/metals-and-metal-lo-ids 106/139
90
Expert Panel on Air Quality Standards
5.3.2 Chronic and sub-chronic effects
5.3.2.1 Animal studies
257. In studies involving rats fed up to 1000 times the daily human intake
of chromium no toxic effects have been reported (Anderson, 1997)
although decreased testicular enzyme activity has been noted (von
Burg and Liu, 1993).
258. Following inhalation, immune system effects have been observed in
animals exposed to both trivalent and hexavalent chromium.
Responses included increased macrophage activity, total serum
immunoglobulin content and antibody response (von Burg and Liu,
1993).
5.3.2.2 Non-malignant effects
259. Hexavalent chromium is a dermal irritant and sensitiser that can
induce and provoke a delayed-type allergic contact dermatitis;
sensitisation is identified through patch testing of the skin. These
outcomes are not uncommon in several occupational settings
including chrome-plating, leather tanning, and work involving
repeated skin contact with wet cement. It is estimated that 0.08% of theUSA population is sensitised in this way (Proctor et al., 1998).
260. Estimates of the dermal dose required to elicit an allergic response in
sensitised individuals vary between from 0.09 and 12.5 µg/cm2 (Scott
and Proctor, 1997; Nethercott et al., 1994).
261. Trivalent chromium may also act as a dermal sensitising agent but
appears to be less potent in this respect than Cr(VI).
262. Respiratory sensitisation to Cr(VI) may also occur in response to
workplace exposures (Keskinen et al., 1980; Moller et al., 1986) but is
probably rare. There is no published information on the threshold
concentrations of airborne chromium necessary to induce respiratory
sensitisation or to provoke symptoms in those who are sensitised.
263. Chronic exposures to chromium fumes have been related to an excess
of deaths from non-malignant respiratory disease in UK (Sorahan et
al., 1987; Davies et al., 1991) and USA (Taylor, 1966) employees in the
chromate production or electroplating industries. These associations
are believed to relate directly to chromium exposures – rather than to
confounding, current or past exposures to other metals such as nickel
– but the effects of cigarette smoking have not been examined in detail.
No reliable exposure estimates are available. In a chromate production
plant in the USA at which atmospheric concentrations of Cr(VI)
8/6/2019 Metals and Metal Lo Ids
http://slidepdf.com/reader/full/metals-and-metal-lo-ids 107/139
91
Chromium
occasionally reached levels of 289 µg/m3, high cumulative exposure was
not associated with an increased risk of chronic bronchitis,
emphysema, shortness of breath, or chronic cough (Pastides et al.,
1994). Among a group of chrome-plating workers in Sweden, with a
median exposure of 2.5 years, transient reductions in lung volumeshave been associated with exposures to Cr(VI) above 2 µg/m3 (Lindberg
and Hedenstierna, 1983). Among 106 workers producing Cr(III) oxide
and sulphate compounds – with estimated exposures to Cr(III) of
1.99 mg/m3 there was no evidence of current respiratory disease
(Korallus et al., 1974). Two hundred and twenty one stainless steel
production workers with median exposures to Cr(VI) of 0.0005 µg/m3
and to Cr(III) of 0.022 µg/m3 (similar to those in ambient air) had
similar lung function and chest X-ray findings to an unexposed control
group (Huvinen et al., 1996).
264. Chronic rhinitis, nasal ulceration and perforation of the nasal septum
have each been described in occupationally-exposed populations.
There was a high incidence of these outcomes in an Italian population
of chromate production workers with measured exposures to Cr(VI) of
10 µg/m3 (Sassi, 1956). In the Swedish chrome-platers described above,
clinical evidence of nasal disease was evident among employees with
mean exposure levels to Cr(VI) of 2–200 µg/m3. No significant nasal
effects were observed in workers exposed at peak levels of 0.2-1 µg/m3.It is suggested that nasal adverse effects may in part be attributable to
chromium salts being applied directly from contaminated fingers.
265. Sub-clinical evidence suggestive of renal damage has been described in
some populations with occupational exposure to chromium
compounds. In 43 men working in the chromate and dichromate
production industry, where occupational exposures to Cr(VI) were
between 50 and 1000 µg/m3 there were increased urinary levels of small
proteins (retinol binding protein and tubular antigens) (Franchini andMutti, 1988). Studies of populations with lower exposures have found
equivocal or no adverse renal effects. Urinalysis of samples from
Italian chromate production workers with estimated exposures of
10 µg/m3 found no abnormalities (Sassi, 1956). Elevated urinary levels
of ß2-microglobulin were observed in chrome platers with personal
exposures over about five years to Cr(VI) of 4 µg/m3 (Lindberg and
Vesterberg, 1983; Liu et al., 1998); but not in retired platers suggesting
a reversible effect (Lindberg and Vesterberg, 1983). Occupational
exposure to Cr(III) or Cr(0) does not appear to be associated with
adverse renal effects.
266. In addition to allergic sensitisation, direct skin contact with chromium
salts can give rise to irritant dermatitis and skin ulceration. These have
been related to airborne concentrations of chromium in the workplace
but it is difficult to disentangle these from dermal exposures.
8/6/2019 Metals and Metal Lo Ids
http://slidepdf.com/reader/full/metals-and-metal-lo-ids 108/139
92
Expert Panel on Air Quality Standards
267. High but unquantified exposures to Cr(VI) compounds have been
reported to provoke ocular irritation, gastrointestinal ulceration,
temporary neurological symptoms and reversible changes in liver
function.
5.3.3 Genotoxicity
5.3.3.1 in vitro studies
268. There is a large body of in-vitro work describing genotoxic effects of
Cr(VI) compounds in mammalian cells; studies of Cr(III) compounds
on the other hand have been largely negative probably because they are
less able to cross cell membranes (summarised in ATSDR, 2000).
5.3.3.2 Animal/bacterial studies
269. Alterations in pulmonary DNA, including chromosomal aberrations
and sister chromatid exchanges, have been observed in rats after
intratracheal exposure to Cr(VI) (Izzotti et al., 1998); and in peripheral
lymphocytes after exposure by inhalation to Cr(0). Similarly, gene
mutations have been induced in fruit flies after exposure to Cr(VI)
(ATSDR, 2000). Soluble Cr(VI), but probably not Cr(III), compounds
are mutagenic in Salmonella typhimurium reverse mutation assays(ATSDR, 2000).
270. A number of occupational studies have reported increased frequencies
of chromosomal aberration or sister chromatid exchange in workers
exposed to Cr(VI) during chrome-plating or stainless steel welding
(Sarto et al., 1982; Stella et al., 1982; Werfel et al., 1998). These
changes have not been related to Cr(VI) exposure and the effects of
confounding gentotoxic exposures have not been examined. Several
similar studies have reported negative findings (Husgafvel-Pursianen etal., 1982; Littorin et al., 1983; Nagaya et al., 1991).
5.3.4 Malignant effects
5.3.4.1 Animal studies
271. Chromium compounds have been reported to cause lung tumours in
some experimental animals following inhalation (HSE, 2002).
However, the literature is mixed with several studies in rats, rabbits and
guinea pigs reporting little on no increase in tumour formation
(Baetjer et al., 1959; Steffee and Baetjer, 1965; Lee et al., 1989). Based
on their increased solubility and bioavailability, Cr(VI) compounds are
generally agreed to be more carcinogenic than Cr(III) compounds
(ICDA, 1997).
8/6/2019 Metals and Metal Lo Ids
http://slidepdf.com/reader/full/metals-and-metal-lo-ids 109/139
93
Chromium
5.3.4.2 Human studies
272. There is a large body of evidence from the USA, Europe and the far
East associating occupational exposure to chromium compounds with
lung cancer, and, more rarely, nasopharyngeal cancer (ATSDR, 2000;
Hayes, 1988; USEPA, 1998). The most consistent associations have
been observed among workers in the chromate production and
chromate pigment industries. Risks of lung cancer increase with the
intensity and duration of exposure and the strength of association
makes it unlikely that the results are due to uncontrolled confounding
by cigarette smoking or other factors. Studies of workers in the chrome
plating industry have found less consistent associations and studies of
workers engaged in stainless steel welding and ferrochrome alloy
production have been inconclusive.
273. A review of the largest and best-designed studies of occupational lung
cancer, to date, was published in 1996 (Steenland et al., 1996).
The information from these was used to estimate the range of excess
deaths across five levels of exposure (SCOEL, 2004); the findings are
summarised in Table 5.2.
Table 5.2: Estimated excess numbers of lung cancer deaths by exposure intensity to
hexavalent chromium compounds.
274. Occupational exposures are generally to both Cr(III) and Cr(VI) with
the possibility in some occupations of co-exposures to other
substances such as nickel. Toxicological studies show that Cr(VI) is
carcinogenic but that Cr(III) is less so, if at all (IARC, 1997). For this
reason it is widely accepted that the increased risk of cancer in
occupational studies is attributable to Cr(VI). It should be noted that
Mancuso (1997) in a study of chromate workers in Ohio, concluded
that cancer was also associated with exposure to Cr(III), but this
conclusion has been questioned. In the leather tanning industry, whereexposure is mainly to Cr(III), studies in the USA, UK and Germany
have reported no increased risk of cancer.
275. There is a lack of informative studies of the effects of community
exposures to airborne chromium. A single report of a study of the
population living near a ferrochrome alloy plant in Sweden found no
excess risk of lung cancer (Axelson and Rylander, 1980).
Working-life exposure to various hexavalent
chromium compounds
Excess number of deaths from lung cancer
(range)
50 µg/m3
25 µg/m3
10 µg/m3
5 µg/m3
1 µg/m3
5-28
2-14
1-6
0.5-3
0.1-0.6
8/6/2019 Metals and Metal Lo Ids
http://slidepdf.com/reader/full/metals-and-metal-lo-ids 110/139
94
Expert Panel on Air Quality Standards
276. On the basis of the combined evidence from epidemiological and
animal studies IARC (1997) classed Cr(VI) as ‘carcinogenic to humans’
(Group 1). The USA Environmental Protection Agency (USEPA) has
classified Cr(VI) as Group A, ‘a known carcinogen by inhalation’.
277. Further, IARC classified Cr(III) and metallic compounds as ‘not
classifiable as to their carcinogenicity to humans’ (Group 3). This was
based on inadequate evidence in humans and limited evidence in
experimental animals.
5.3.5 Reproductive and developmental toxicity
278. An increase in the incidence of spontaneous abortions among the wives
of stainless steel welders (exposed to chromium fume) has beenreported in two Danish populations (Hjollund et al., 2000; Bonde et al.,
1992) but not in a third (Hjollund et al., 1995). None of these studies
reported risks in relation to measurements of chromium exposure.
279. In comparison to an unexposed control group, higher numbers of
morphologically abnormal sperm were found in a small study of
employees of a factory manufacturing chromium sulphate in India
(Kumar et al., 2005). These changes were positively correlated with
blood chromium levels. Similar findings have been reported amongwelders in India (Danadevi et al., 2003) and among employees exposed
to Cr(VI) in China (Li et al., 2001); but not among welders in
Denmark (Hjollund et al., 1998). Again none of these studies reported
measurements of chromium in air and the effects of confounding
exposures cannot be discounted.
280. Two reports (in Russian) of women working in a dichromate
manufacturing plant in Russia described increased rates of (undefined)
complications during pregnancy and childbirth (Shmitova, 1980;Shmitova, 1978). It is not clear that these outcomes can be attributed
to chromate exposure; no exposure measurements were reported. No
increase in abnormal birth outcomes in relation to welding was found
in a cohort of 10,000 Danish metalworkers (Bonde et al., 1992).
5.4 Evaluations and recommendations by other
organisations
281. Exposure to chromium in ambient air has been reviewed by the WHO,
Defra and the Environment Agency (EA), the USEPA and the US
Agency for Toxic Substances and Disease Registry (ATSDR). The UK
Health and Safety Commission (HSC) and the American Conference
of Governmental Industrial Hygienists (ACGIH) have published limits
and guidelines on workplace exposures.
8/6/2019 Metals and Metal Lo Ids
http://slidepdf.com/reader/full/metals-and-metal-lo-ids 111/139
95
Chromium
282. The WHO (2000) classifies Cr(VI) compounds as human carcinogens
by inhalation exposure. They were unable to recommend an air
quality guideline based on a safe level of exposure. A lifetime unit risk
for lung cancer of 4x10⁻² per µg/m3 in air was derived by averaging the
results of studies of four cohorts of chromate production workers
(WHO, 2000). Extrapolation from this value by calculation equates
excess lifetime risks of 1 in 10,000, 1 in 100,000 and 1 in 1,000,000 with
exposures to concentrations of 2.5 ng/m3, 0.25 ng/m3 or 0.025 ng/m3.
The WHO note that only a proportion of the total concentration of
chromium in air comprises Cr(VI) and that other forms of chromium
are not carcinogenic.
283. The USEPA Reference Dose (RfD) for chronic oral exposure to
Cr(III) is 1.5 mg/kg body weight day per day based on a no observedadverse effect level (NOAEL) in a rat feeding study (USEPA, 1998).
This is an estimate of a daily exposure by ingestion that is likely to be
without an appreciable risk of deleterious effects during a lifetime. No
inhalation reference concentration (RfC) is available for Cr(III). The
US EPA RfD for noncancer effects arising from exposure to Cr(VI) is
3 µg/kg body weight day per day based on a NOAEL in a rat drinking
water study (USEPA, 1998). The RfC for non-cancer effects arising
from exposure to Cr(VI) in the form of chromic acid mists and
dissolved Cr(VI) aerosols is 8 ng/m3 based on nasal septum atrophy inexposed workers. This is an estimate of an airborne concentration that
is likely to be without an appreciable risk of deleterious effects during
a lifetime. The RfC for non-cancer effects arising from exposure to Cr
(VI) as particulate is 100 ng/m3 based on the results of a 90 day study
in rats. The confidence of the USEPA in their RfCs for chromic acid
mists and Cr(VI) dusts are low and medium, respectively. The same
agency has estimated the unit risk factor for lifetime (lung) cancer risk
arising from exposure to Cr(VI) to be 1x10⁻² per µg/m3 in air.
Concentrations of 8 ng/m3, 0.8 ng/m3 and 0.08 ng/m3 are extrapolatedto increased life-time cancer risks of 1:10 000, 1:100 000 and
1:1 000 000, respectively (USEPA, 1998).
284. The USEPA and WHO unit risks are of very similar magnitude, in
spite of being based on different occupational studies.
285. Defra and EA have not developed guidelines for inhalation exposures
to chromium, but have set an inhalation Index Dose to minimise the
risk of lung cancer arising from exposure to dust from chromium
contaminated soils. An Index Dose for inhalation exposure of 0.001
µg/kg body weight/day was derived for Cr(VI) which represents “a risk
level from possible exposure to a particular substance from a source”
and is accompanied by an ALARP (as low as reasonable practicable)
notation (also known as an inhalation Tolerable Daily Intake) (Defra
and EA, 2002). This is based on the calculated concentration of Cr(VI)
8/6/2019 Metals and Metal Lo Ids
http://slidepdf.com/reader/full/metals-and-metal-lo-ids 112/139
96
Expert Panel on Air Quality Standards
in air associated with a 10-4 lifetime cancer risk (ie 2.5 ng/m3) as
determined by WHO (2000). An oral tolerable daily intake (TDI) for
Cr(VI) of 3 µg/kg body weight/day was derived for children of six years
or over and adults.
286. The US ATSDR (2000) derived an inhalation Minimal Risk Level
(MRL) for Cr(VI) as chromium trioxide mist and other dissolved
Cr(VI) aerosols and mists, of 5 ng/m3 for intermediate exposure (15-
364 days). This was based on the development of upper respiratory
effects in exposed workers. A separate MRL for intermediate exposure
to particulate Cr(VI) compounds of 1 µg/m3 was derived based on the
findings of a 90 day study in rats. The ATSDR believed it to be
inappropriate to set a long term MRL for non-cancer effects because
of the over-riding importance of cancer as a health endpoint.
287. The UK HSC has set a Workplace Exposure Limit (WEL) of
0.5 mg/m3 (8-hour time weighted average (TWA)) for chromium metal,
Cr(II) compounds and Cr(III) compounds and a WEL of 0.05 mg/m3
(8-hour TWA) for Cr(VI) compounds (HSE, 2005). Workplace
Exposure Limits are occupational exposure limits set under the
Control of Substances Hazardous to Health (COSHH) Regulations
(2002 as amended). The WEL for Cr(VI) compounds was based on the
lowest airborne concentrations that could be achieved by followinggood occupational hygiene practices across the majority of British
industry. No safe level of exposure could be identified.
288. The ACGIH (2005) have set a Threshold Limit Value (TLV) for
chromium metal and Cr(III) compounds of 0.5 mg/m3 to protect
against respiratory irritation and dermatitis. This is a level of exposure
that has not been observed to cause adverse effects in the workplace.
The TLV for water-soluble Cr(VI) compounds is 0.05 mg/m3 and is
intended to protect against liver and kidney toxicity and respiratoryeffects. This limit may be reviewed in the future. The TLV for insoluble
Cr(VI) compounds is 0.01 mg/m3, based on workplace studies of
cancer in humans and is intended to provide protection for respiratory
effects and cancer. A TLV is a concentration to which nearly all
workers may be repeatedly exposed over a working lifetime without
adverse effects and the TLVs for chromium and chromium compounds
have been set as 8-hour TWA’s.
289. The US Occupational Safety and Health Administration (OSHA) has
published a final standard for occupational exposure to Cr(VI)
(OSHA, 2006). This standard reduced the earlier allowable exposure
by a factor of ten. The permissible exposure limit (PEL) for Cr(VI),
and for all its compounds, is 5 µg/m3 air, as an 8-hour TWA.
8/6/2019 Metals and Metal Lo Ids
http://slidepdf.com/reader/full/metals-and-metal-lo-ids 113/139
97
Chromium
5.5. Justification for air quality guideline
290. The Panel is setting an air quality guideline for Cr(VI) due to studies
showing its toxicity. No guidelines are proposed for Cr(III) and Cr(0).
291. The most important effect of inhaled Cr(VI) for which there is
adequate information on exposure and response appears to be the
induction of lung cancer. There are insufficient human data on issues
such as genotoxicity to know whether or not there is a threshold of
exposure and whether or not the relationship between dose and risk
(especially at low exposures) is linear or otherwise. The Panel is aware
of considerable and currently unresolved controversy in these areas
and has elected to adopt a precautionary approach. This may need to
be reviewed if further information becomes available.
292. As far as is known, the exposures to chromium that are necessary to
induce non-carcinogenic disease are greater then those that induce
lung cancer.
293. The approach adopted here for guideline-setting is directly analogous
to that used by EPAQS in setting standards for other chemical
carcinogens such as benzene and polycyclic aromatic hydrocarbons.
294. New analyses including quantitative risk assessment of a cohort of
chromate production workers in Baltimore have been reported
(Gibb et al., 2000; Park et al., 2004). These concerned a cohort of 2,357
chromate production workers with 122 lung cancer deaths. Extensive
records of systematic air sampling which included total Cr(VI) were
available for the cohort and smoking habit reported at hire was
included in the modelling. On account of its size and exposure
characterisation it is the most suitable for deriving a standard.Stratification by quintiles of number of deaths from lung cancer
indicates a monotonic increase in risk of death with increasing
cumulative exposure to Cr(VI), independent of smoking.
295. A statistically significant increase in standardised mortality from lung
cancer was reported for employees in the lowest of the five categories
of cumulative exposure (0.0000-0.0282 mg/m3.years). The mid point of
this range is 0.0141 mg/m3.years which converts to an average annual
concentration of 0.00035 mg/m3
(0.35 µg/m3
) over a 40 year workinglifetime. If this concentration is considered as a Lowest Observed
Adverse Effect Level (LOAEL) then, following the precedent set in
earlier reports by this Panel, division by a factor of ten, giving a
concentration of 0.035 µg/m3, provides a notional NOAEL. This has
further been divided by a factor of ten to allow for the greater exposure
duration of the general public and a further factor of ten to allow for
the presence of susceptible groups from within the general population.
This leads to a guideline value of 0.35 ng/m3 of Cr(VI) as CrO3.
8/6/2019 Metals and Metal Lo Ids
http://slidepdf.com/reader/full/metals-and-metal-lo-ids 114/139
98
Expert Panel on Air Quality Standards
296. The measurements made in this study were of ‘Cr(VI) as CrO3’.
Expressed as Cr(VI) the guideline value above must be multiplied by a
factor of 0.52, producing a figure of 0.2 ng/m3.
5.5.1 Sensitivity to method of derivation
297. Unit risk approach. There are three choices of exposure response for
determining an acceptable level for public protection: 1) USEPA, based
on the Ohio chromate production workers; 2) WHO based on a hybrid
of Baltimore chromate production workers and Norwegian ferrochrome
workers; and 3) Park et al. (2004) analysis of Baltimore chromate
production workers. Our opinion is that we should use the last of these
since it appears to use the best data and to be best analysed.
298. Park et al . (2004) estimated that 1mg/m3.year of cumulative exposure
to Cr(VI) (as CrO3) with a lag of five years had a relative rate of 2.44
(95% CI 1.54 to 3.83). This was used to estimate the unit risk for lung
cancer per µg/m3 over a life-time using the formula in WHO (2000):
• UR = P0 (RR-1)/life time exposure
• P0 = 0.04 (as in WHO 2000)
• RR-1 per mg/m3 = 1.44 (from Park et al., 2004)
• Life-time average exposure = 8/24x240/365x1/70 = 0.003131
• Unit risk = (0.04x1.44)/(8/24x240/365x1/70) = 18.40 per mg/m3
• = 0.0184 per µg/m3 (1.8 x 10⁻²)
299. This is close to the unit risks estimated by the USEPA from different
data, and WHO using a combination of Baltimore and Norwegian
data (see earlier).
300. The risks of lung cancer associated with life-time exposures to
different levels are: 0.05 ng/m3 =1 in 10-6 (10-6/1.84 x 10-5); 0.5 ng/m3 =
I in 10-5; 5.0 ng/m3 = 1 in 10-4.
301. The guideline value of 0.35 ng/m3 as CrO3 derived using the customary
EPAQS method above equates to a lifetime risk of 7 in one million
people. This gives confidence that the EPAQS procedure yields a
guideline value consistent with that that would be generated by other
procedures such as the unit risk method.
302. At current upper UK urban levels of chromium of around 15 ng/m3
containing an estimated 4 ng/m3 of Cr(VI), the increased risk of lung
cancer would amount to a little under 1 in 10,000 which is comparable
to the rate of death from lung cancer in non-smokers derived from a
20 year follow-up of male British doctors.
303. Particulate matter may be more potent as any effect may be extended
in time and effectively localised. However, particulate matter will be
largely Cr(III) and a standard must take account of this.
8/6/2019 Metals and Metal Lo Ids
http://slidepdf.com/reader/full/metals-and-metal-lo-ids 115/139
99
Chromium
5.6. Recommendation
304. 0.2 ng/m3 chromium in the Cr(VI) oxidation state in the PM10 size
fraction as an annual mean.
305. The Panel believes that the recommended guideline for Cr(VI) should
offer a high level of protection against the risk of lung cancer and of
other adverse health effects. However, for this as for other carcinogens,
the Panel advocates a progressive reduction in airborne concentrations
below this guideline.
References
Alloway, B.J. (1995). (Editor). Heavy Metals in Soils. Blackie Academic and
Professional, London.
Anderson, R.A. (1981). Nutritional role of chromium. Sci Total Environ
17:13-29.
Anderson, R.A. (1997). Chromium as an essential nutrient for humans.
Regul. Toxicol. Pharmacol 26: S35-S41.
ATSDR (2000). Toxicological profile: chromium. Agency for Toxic
Substances and Disease Registry.
http://www.atsdr.cdc.gov/toxprofiles/tp7.pdf.
Axelsson, G. and Rylander, R. (1980). Environmental chromium dust and
lung cancer mortality. Environ Res. 23:469-476.
Baetjer, A.M., Lowney, J.F., Steffee, H. and Budacz, V. (1959). Effect of
chromium on incidence of lung tumours in mice and rats. Arch Ind Health20: 124-135.
Bonde, J.P., Olsen, J.H. and Hansen, K.S. (1992). Adverse pregnancy
outcome and childhood malignancy with reference to paternal welding
exposure. Scand J Work Environ Health. Jun;18(3):169-77.
Cawse, P.A. (1987). Trace and major elements in the atmosphere at rural
locations in Great Britain, 1972-1981. In: Pollutant Transport and Fate in
Ecosystems. Special Publication Number 6 of The British Ecological Society.
Blackwell Scientific Publications, Oxford.
CEH (2006). Heavy Metal Monitoring Network. The Centre for Ecology &
Hydrology. www.heavymetals.ceh.ac.uk
CEPA (1994) Priority Substances List Assessment Report. Chromium and its
8/6/2019 Metals and Metal Lo Ids
http://slidepdf.com/reader/full/metals-and-metal-lo-ids 116/139
100
Expert Panel on Air Quality Standards
compounds. Canadian Environmental Protection Act. Government of
Canada, Environmental Canada, health Canada.
Danadevi, K., Rozati, R., Reddy, P.P. and Grover, P. (2003). Semen quality of
Indian welders occupationally exposed to nickel and chromium. Reprod
Toxicol. Jul-Aug;17(4):451-6.
Davies, J., Easton, D. and Bidstrup, P. (1991). Mortality from respiratory
cancer and other causes in United Kingdom chromate production workers.
Br J Ind Med 48:299-313.
Defra and EA (2002). Contaminants in soil: Collation of Toxicological data
and intake values for humans: Chromium. Department for Environment,
Food and Rural Affairs and Environment Agency. R&D Publication TOX4.ISBN 1 857 05743 0.
DETR (1997). Digest of Environmental Statistics, No 19. Department of the
Environment, Transport and the Regions. The Stationery Office, London.
Franchini I. and Mutti, A. (1988). Selected toxicological aspects of
chromium(VI) compounds. Sci Total Environ 71:379-387.
Gibb, H.J., Lees, P.S., Pinsky, P.F. and Rooney, B.C. (2000). Lung canceramong workers in chromium chemical production. Am J Ind Med.
38:115-126.
Government of Canada. 1994. Chromium and its compounds. In:
Canadian Environmental Protection Act. Priority substances list assessment
report. Ottawa, Ontario: Government of Canada, Minister if Supply and
Services Canada.
Hayes, R.B. (1988). Review of occupational epidemiology of chromiumchemicals and respiratory cancer. Sci Total Environ 71:331-339.
Hjollund, N.H., Bonde, J.P. and Hansen, K.S. (1995). Male-mediated risk of
spontaneous abortion with reference to stainless steel welding. Scand J Work
Environ Health. Aug;21(4):272-6.
Hjollund, N.H., Bonde, J.P., Jensen, T.K., Ernst, E., Henriksen, T.B.,
Kolstad, H.A., Giwercman, A., Skakkebaek, N.E. and Olsen, J. (1998).
Semen quality and sex hormones with reference to metal welding. Reprod
Toxicol. Mar-Apr;12(2):91-5.
Hjollund, N.H., Bonde, J.P., Jensen, T.K., Henriksen, T.B., Andersson, A.M.,
Kolstad, H.A., Ernst, E., Giwercman, A., Skakkebaek, N.E. and Olsen, J.
(2000). Male-mediated spontaneous abortion among spouses of stainless
steel welders. Scand J Work Environ Health. Jun;26(3):187-92.
8/6/2019 Metals and Metal Lo Ids
http://slidepdf.com/reader/full/metals-and-metal-lo-ids 117/139
101
Chromium
HSE (2002). EH64 Summary Criteria for occupational Exposure Limits,
Health and Safety Executive, Sudbury, UK.
HSE (2005). EH40/2005 Workplace exposure limits. Health and Safety
Executive, UK. http://www.hse.gov.uk/coshh/table1.pdf
Husgafvel-Pursiainen, K., Kalliomaki, P.-L. and Sorsa, M. (1982). A
chromosome study among stainless steel workers. J Occup Med 24:762-766.
Huvinen, M., Uitti, J., Zitting, A., Roto, P., Virkola, K., Kuikka, P.,
Laippala, P. and Aitio, A. (1996). Respiratory health of workers exposed to
low levels of chromium in stainless steel production. Occup Environ Med
53:741-747.
IARC (1990) (updated 1997). Monographs on the Evaluation of
Carcinogenic Risks to Humans, vol. 49, Chromium, Nickel and Welding.
IARC, Lyon.
ICDA (1997). Criteria document for hexavalent chromium. International
Chromium Development Association, Paris.
Izzotti, A., Bagnasco, M., Camoirano, A., Orlando, M. and de Flora, S.
(1998). DNA fragmentation, DNA-protein crosslinks, 32P postlabelednucleotide modifications, and 8-hydroxy-2'-deoxyguanosine in the lung but
not in the liver of rats receiving intratracheal instillations of chromium(VI).
Chemoprevention by oral N-acetylcysteine. Mutat Res 400:233-244.
Keiber, R.J., Willey, J.D. and Zvalaren, S.D. (2002). Chromium speciation in
rainwater: temporal variability and atmospheric deposition. Environ Sci
Technol 36; 5321-5327.
Keskinen, H., Kalliomaki, P. and Alanko, K. (1980). Occupational asthmadue to stainless steel welding fumes. Clin Allergy 10:151-159.
Kimbrough, D.E., Cohen, Y., Winer, A.M., Creelman, L. and Mabuni, C.
(1999). A critical assessment of chromium in the environment. Crit Rev
Environ Sci 29(1):1-46.
Korallus, U., Ehrlicher, H., and Wustefeld, E. et al. (1974). Trivalent
chromium compounds – results of a study in occupational medicine. Arb Soz
Prev 9:51-54.
Kumar, S., Sathwara, N.G., Gautam, A.K., Agarwal, K., Shah, B., Kulkarni,
P.K., Patel, K., Patel, A., Dave, L.M., Parikh, D.J. and Saiyed, H.N. (2005)
Semen quality of industrial workers occupationally exposed to chromium. J
Occup Health. Sep;47(5):424-30.
8/6/2019 Metals and Metal Lo Ids
http://slidepdf.com/reader/full/metals-and-metal-lo-ids 118/139
102
Expert Panel on Air Quality Standards
Kuperman, E.F. (1963). On the maximum permissible concentration of
hexavalent chromium in the atmosphere. Gig Sanit 28: 9-16.
Langård, S. and Norseth, T. (1979). Chromium. In: Friberg L, Nordberg GF,
Vouk VB, ed. Handbook on the toxicology of metals. Amsterdam:
Elsevier/North-Holland Biomedical Press, 383-397.
Lee, K.P., Ulrich, C.E., Geil, R.G. and Trochimowocz, H.J. (1989).
Inhalation toxicology of chromium dioxide dust to rats after two years
exposure. Sci Total Environ 86: 83-108.
Lee, D.S., Garland, J.A., and Fox, A.A., (1994). Atmospheric concentrations
of trace elements in urban areas of the United Kingdom. Atmospheric
Environment 28, 2691-2713.
Li, H., Chen, Q., Li, S., Yao, W., Li, L., Shi, X., Wang, L., Castranova, V.,
Vallyathan, V., Ernst, E. and Chen, C. (2001). Effect of Cr(VI) exposure on
sperm quality: human and animal studies. Ann Occup Hyg. Oct;45(7):505-11.
Lindberg, E. and Hedenstierna, G. (1983). Chrome plating: Symptoms,
findings in the upper airways, and effects on lung function. Arch Environ
Health 38:367-374.
Lindberg, E. and Vesterberg, O. (1983). Urinary excretion of proteins in
chromeplaters, exchromeplaters and referents. Scand J Work Environ Health
9:505-510.
Littorin, M., Högstedt, B., Strömbäck, B., Karlsson, A., Welinder, H.,
Mitelman, F. and Skerfving, S. (1983). No cytogenetic effects in lymphocytes
of stainless steel welders. Scand J Work Environ Health 9:259-264.
Liu, C.-S., Kuo, H.-W., Lai, J.-S., Lin, T.I. (1998). Urinary N-acetyl-B-glucosaminidase as an indicator of renal dysfunction in electroplating
workers. Int Arch Occup Environ Health 71:348-352.
Mancuso, T.F. (1997). Chromium as an industrial carcinogen: Part I. Am J
Ind Med 31:129-139.
Moller, D.R., Brooks, S.M., Bernstein, D.I., Cassedy, K., Enrione, M. and
Bernstein, I.L. (1986). Delayed anaphylactoid reaction in a worker exposed
to chromium. J Allergy Clin Immunol 77(3):451-456.
Nagaya, T., Ishikawa, N., Hata, H. and Otobe, T. (1991). Sister-chromatid
exchanges in lymphocytes from 12 chromium platers: A 5-year follow-up
study. Toxicol Lett 58:329-335.
8/6/2019 Metals and Metal Lo Ids
http://slidepdf.com/reader/full/metals-and-metal-lo-ids 119/139
103
Chromium
Nethercott, J., Paustenbach, D., Adams, R., Fowler, J., Marks, J., Morton, C.,
Taylor, J., Horowitz, S. and Finley, B. (1994). A study of chromium induced
allergic contact dermatitis with 54 volunteers: Implications for environmental
risk assessment. Occup Environ Med 51:371-380.
NPL (2006). National Physical Laboratory. Results available from the Air
Quality Archive. www.airquality.co.uk/archive/data_and_statistics.php
OSHA (2006). Occupational Exposure to Hexavalent Chromium.
Occupational Safety and Health Administration, USA. www.osha.gov
Park, R.M., Bena, J.F., Stayner, L.T., Smith, R.J., Gibb, H.J. and Lees, P.S.
(2004). Hexavalent chromium and lung cancer in the chromate industry: a
quantitative risk assessment. Risk Anal 24:1099-108.
Passant, N.R., Peirce, M., Rudd, H.J., Scott, D.W., Marlowe, I. and
Watterson, J.D. (2002). UK Particulate and Heavy Metal Emissions from
Industrial Processes. AEAT-6270 Issue 2.
Pastides, H., Austin, R., Lemeshow, S., Klar, J. and Mundt, K.A. (1994). A
retrospective-cohort study of occupational exposure to hexavalent
chromium. Am J Ind Med 25:663-675.
Proctor, D.M., Fredrick, M.M., Scott, P.K., Paustenbach, D.J. and Finley,
B.L. (1998). The Prevalence of Chromium Allergy in the United States and
Its Implications for Setting Soil Cleanup: A Cost-Effectiveness Case Study.
Regulatory toxicology and pharmacology 28, 27–37.
Rowbotham, A.L., Levy, L.S. and Shuker, L.K. (2000). Chromium in the
environment: an evaluation of exposure of the UK general population
and possible adverse health effects. J Toxicol Environ Health B Crit Rev;
3(3):145-178.
Salmon, L., Atkins, D.H.F., Fisher, E.M.R., Healy, C. and Law, D.V., (1978).
Retrospective trend analysis of the content of U.K. air particulate material
1957-1974. Science of the Total Environment 9, 161-200.
Sarto, F., Cominato, I., Bianchi, V., and Levis, A.G. (1982). Increased
incidence of chromosomal aberrations and sister chromatid exchanges in
workers exposed to chromic acid (CrO3) in electroplating factories.
Carcinogenesis 3(9):1011-1016.
Sassi, C. (1956). Occupational pathology in a chromate plant. Med Lav
47(5):314-327.
8/6/2019 Metals and Metal Lo Ids
http://slidepdf.com/reader/full/metals-and-metal-lo-ids 120/139
104
Expert Panel on Air Quality Standards
SCOEL (2004). Recommendation for risk assessment of hexavalent
chromium. Scientific Committee on Occupational Exposure Limits
SCOEL/Sum 86 – final Rev 1.
Schroeder, H.A., Balassa, J.J. and Tipton, I.H. (1962). Abnormal trace
metals in man — Chromium. J Chron Dis. 15:941-964.
Scott, P.K. and Proctor, D.M. (1997). Evaluation of 10% minimum
elicitation threshold for Cr(VI)-induced allergic contact dermatitis using
benchmark dose methods. J Soil Contam 6(6):707-731.
Shmitova, L.A. (1978). The course of pregnancy in women engaged in the
production of chromium and its compounds. Vliy Prof Fakt Spet Funk
Zhensk Organ, Sverd 108-111.
Shmitova, L.A. (1980). Content of hexavalent chromium in the biological
substrates of pregnant women and women in the immediate post-natal
period engaged in the manufacture of chromium compounds. Gig Trud Prof
Zabol 2:33-35.
Sorahan, T., Burges, D.C.L. and Waterhouse, J.A.H. (1987). A mortality
study of nickel/chromium platers. Br J Ind Med 44:250-258.
Steenland, K., Loomis, D., Shy, C. and Simonsen, N. (1996). Review of
occupational lung carcinogens. Am J Ind Med. 29:474-90.
Steffee, C.H. and Baetjer, A.M. (1965). Histopathological effects of chromate
chemicals. Report of studies in rabbits, guinea pigs rats and mice. Arch
Environ Health 11:66.
Stella, M., Montaldi, A., Rossi, R., Rossi, G. and Levis, A.G. (1982).
Clastogenic effects of chromium on human lymphocytes in vitro and in vivo.Mutat Res 101:151-164.
Sullivan R.J. (1969). Air pollution aspects of chromium and its compounds,
Raleigh, North Carolina, US Department of Health, Education and Welfare,
75 pp (National Air Pollution Control Administration Publication No.
APTD 69-34).
Taylor, F.H. (1966). The relationship of mortality and duration of
employment as reflected by a cohort of chromate workers. Am J Public
Health 56(2):218-229.
USEPA (1998). Toxicological review of hexavalent chromium (CAS No.
18540-29-9). In support of summary information on the Integrated Risk
Information System (IRIS). USA Environmental Protection Agency,
Washington, DC.
8/6/2019 Metals and Metal Lo Ids
http://slidepdf.com/reader/full/metals-and-metal-lo-ids 121/139
105
Chromium
Von Burg, R. and Liu, D. (1993). Chromium and hexavalent chromium. J
Appl Toxicol 13: 225-230.
Werfel, U., Langen, V., Eickhoff, I., Schoonbrood, J., Vahrenholz, C.,
Brauksiepe, A., Popp, W. and Norpoth, K. (1998). Elevated DNA single-
strand breakage frequencies in lymphocytes of welders exposed to chromium
and nickel. Carcinogenesis 19(3):413-418.
WHO (1988). Environmental Health Criteria 61. World Health Organisation,
Geneva, Switzerland.
WHO (2000). Chapter 6.4. Chromium. Air Quality Guidelines, 2nd edition.
World Health Organisation.

8/6/2019 Metals and Metal Lo Ids
http://slidepdf.com/reader/full/metals-and-metal-lo-ids 122/139
106
Expert Panel on Air Quality Standards
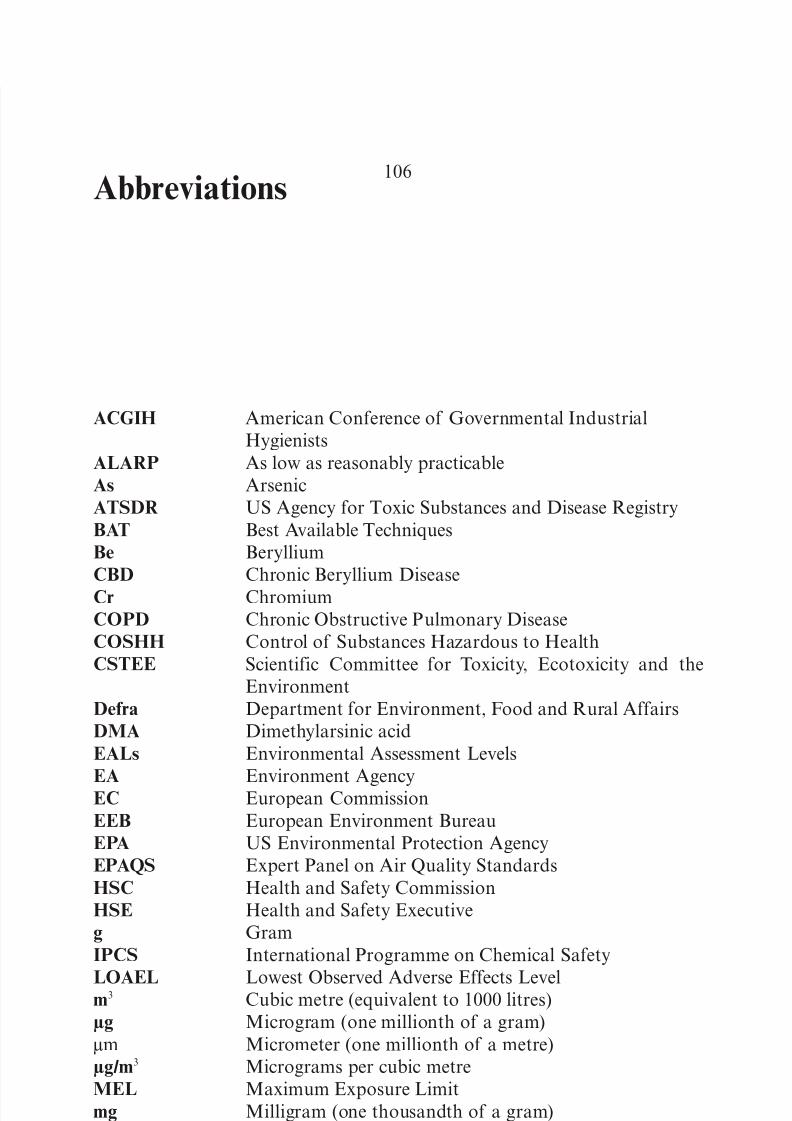
8/6/2019 Metals and Metal Lo Ids
http://slidepdf.com/reader/full/metals-and-metal-lo-ids 123/139
107
Abbreviations
ACGIH American Conference of Governmental Industrial
Hygienists
ALARP As low as reasonably practicable
As ArsenicATSDR US Agency for Toxic Substances and Disease Registry
BAT Best Available Techniques
Be Beryllium
CBD Chronic Beryllium Disease
Cr Chromium
COPD Chronic Obstructive Pulmonary Disease
COSHH Control of Substances Hazardous to Health
CSTEE Scientific Committee for Toxicity, Ecotoxicity and the
Environment
Defra Department for Environment, Food and Rural Affairs
DMA Dimethylarsinic acid
EALs Environmental Assessment Levels
EA Environment Agency
EC European Commission
EEB European Environment Bureau
EPA US Environmental Protection Agency
EPAQS Expert Panel on Air Quality StandardsHSC Health and Safety Commission
HSE Health and Safety Executive
g Gram
IPCS International Programme on Chemical Safety
LOAEL Lowest Observed Adverse Effects Level
m3 Cubic metre (equivalent to 1000 litres)
µg Microgram (one millionth of a gram)
µm Micrometer (one millionth of a metre)
µg/m3 Micrograms per cubic metreMEL Maximum Exposure Limit
mg Milligram (one thousandth of a gram)
MMA Monomethylarsonic acid
MRL Minimal Risk Level
ng Nanogram (one billionth of a gram)
Ni Nickel
NOAEL No Observed Adverse Effects Level
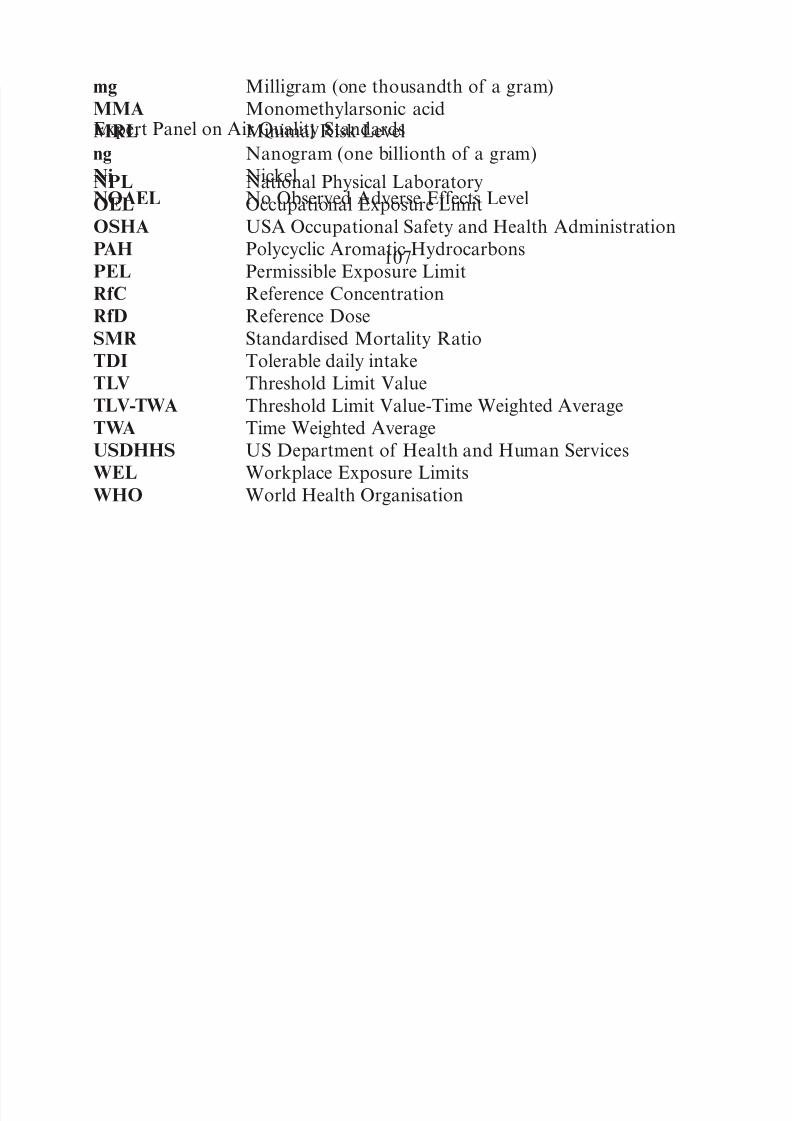
8/6/2019 Metals and Metal Lo Ids
http://slidepdf.com/reader/full/metals-and-metal-lo-ids 124/139
108
Expert Panel on Air Quality Standards
NPL National Physical Laboratory
OEL Occupational Exposure Limit
OSHA USA Occupational Safety and Health Administration
PAH Polycyclic Aromatic Hydrocarbons
PEL Permissible Exposure Limit
RfC Reference Concentration
RfD Reference Dose
SMR Standardised Mortality Ratio
TDI Tolerable daily intake
TLV Threshold Limit Value
TLV-TWA Threshold Limit Value-Time Weighted Average
TWA Time Weighted Average
USDHHS US Department of Health and Human Services
WEL Workplace Exposure LimitsWHO World Health Organisation
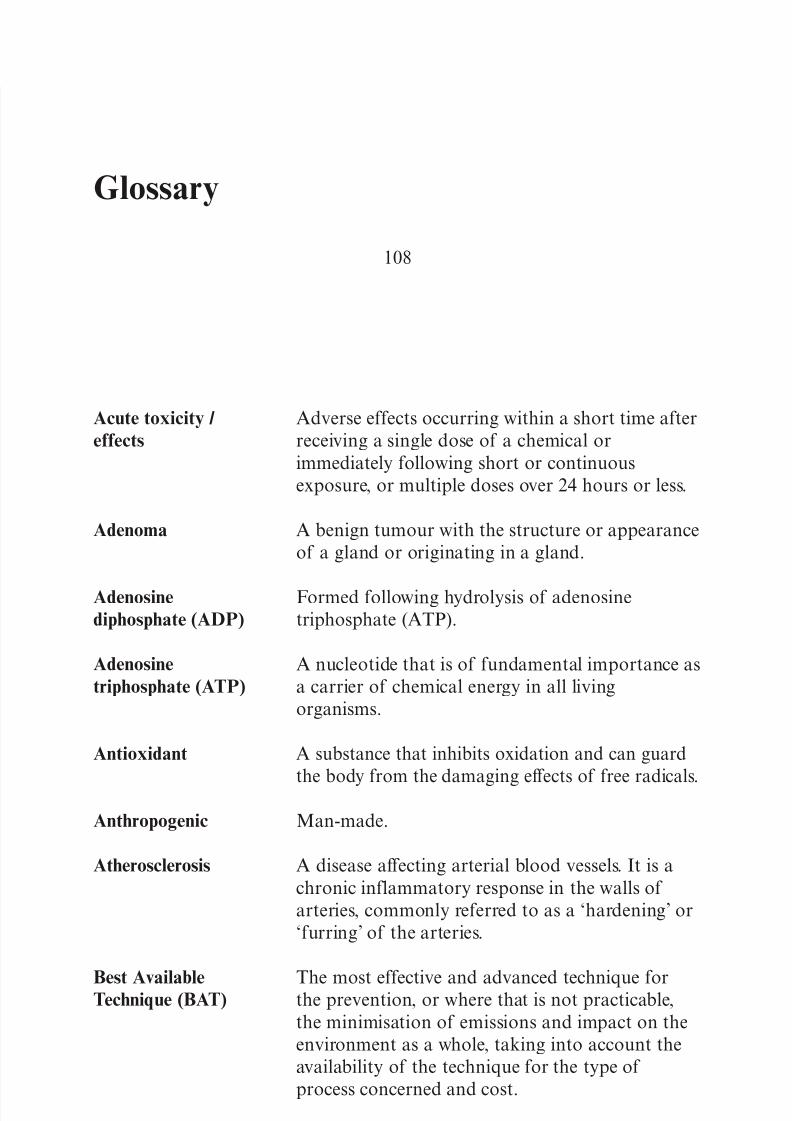
8/6/2019 Metals and Metal Lo Ids
http://slidepdf.com/reader/full/metals-and-metal-lo-ids 125/139
109
Glossary
Acute toxicity / Adverse effects occurring within a short time after
effects receiving a single dose of a chemical or
immediately following short or continuous
exposure, or multiple doses over 24 hours or less.
Adenoma A benign tumour with the structure or appearance
of a gland or originating in a gland.
Adenosine Formed following hydrolysis of adenosine
diphosphate (ADP) triphosphate (ATP).
Adenosine A nucleotide that is of fundamental importance as
triphosphate (ATP) a carrier of chemical energy in all living
organisms.
Antioxidant A substance that inhibits oxidation and can guard
the body from the damaging effects of free radicals.
Anthropogenic Man-made.
Atherosclerosis A disease affecting arterial blood vessels. It is achronic inflammatory response in the walls of
arteries, commonly referred to as a ‘hardening’ or
‘furring’ of the arteries.
Best Available The most effective and advanced technique for
Technique (BAT) the prevention, or where that is not practicable,
the minimisation of emissions and impact on the
environment as a whole, taking into account the
availability of the technique for the type of process concerned and cost.
Berylliosis or An occupational lung disease arising from an
chronic beryllium allergic-type response to beryllium and its
disease (CBD) compounds in the workplace. The condition is
characterised by lung scarring and is incurable,
treatment being symptomatic only.
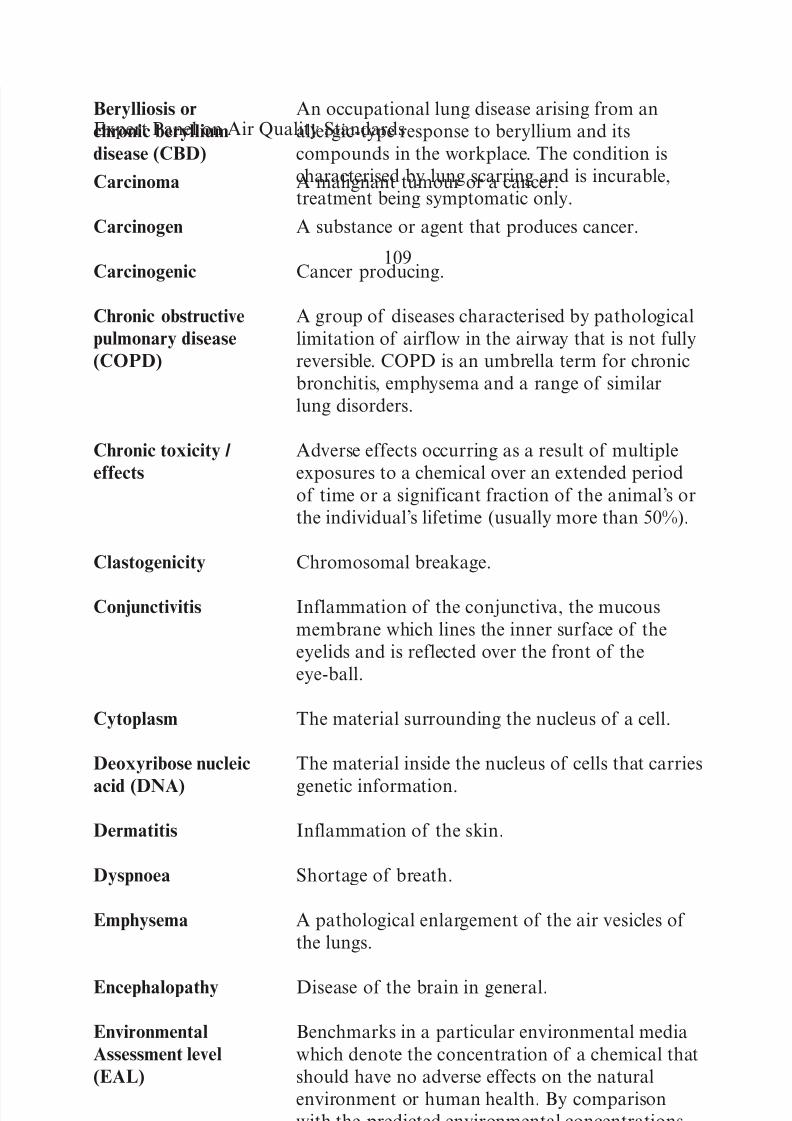
8/6/2019 Metals and Metal Lo Ids
http://slidepdf.com/reader/full/metals-and-metal-lo-ids 126/139
110
Expert Panel on Air Quality Standards
Carcinoma A malignant tumour or a cancer.
Carcinogen A substance or agent that produces cancer.
Carcinogenic Cancer producing.
Chronic obstructive A group of diseases characterised by pathological
pulmonary disease limitation of airflow in the airway that is not fully
(COPD) reversible. COPD is an umbrella term for chronic
bronchitis, emphysema and a range of similar
lung disorders.
Chronic toxicity / Adverse effects occurring as a result of multiple
effects exposures to a chemical over an extended periodof time or a significant fraction of the animal’s or
the individual’s lifetime (usually more than 50%).
Clastogenicity Chromosomal breakage.
Conjunctivitis Inflammation of the conjunctiva, the mucous
membrane which lines the inner surface of the
eyelids and is reflected over the front of the
eye-ball.
Cytoplasm The material surrounding the nucleus of a cell.
Deoxyribose nucleic The material inside the nucleus of cells that carries
acid (DNA) genetic information.
Dermatitis Inflammation of the skin.
Dyspnoea Shortage of breath.
Emphysema A pathological enlargement of the air vesicles of
the lungs.
Encephalopathy Disease of the brain in general.
Environmental Benchmarks in a particular environmental media
Assessment level which denote the concentration of a chemical that
(EAL) should have no adverse effects on the natural
environment or human health. By comparison
with the predicted environmental concentrations
arising from releases, they are intended to enable
the significance of releases to be assessed, the need
for further pathway modelling to be determined
and the relative impact of pollutants released to
different environmental media to be compared.
8/6/2019 Metals and Metal Lo Ids
http://slidepdf.com/reader/full/metals-and-metal-lo-ids 127/139
111
Glossary
Epidemiology Study of the distribution of disease among
populations; and of the causes of this
distribution.
Epithelium The tissue that covers the external surface of the
body and lines hollow structures.
Ferritin A water-soluble crystalline protein containing
ferric iron that occurs in many animals, especially
in the liver and spleen, and is involved in the
storage of iron by the body.
Gastrointestinal tract The system of organs within multicellular animals
that takes in food, digests it to extract energy andnutrients, and expels the remaining waste. It
includes the mouth, pharynx, oesophagus,
stomach, intestines and anus.
Genotoxic carcinogen Known to cause cancer as a result of interacting
with DNA.
Granuloma Small nodule.
(plural granulomata)
Health and Safety The Health and Safety Commission’s remit is to
Commission (HSC) protect everyone in Great Britain against risks to
health or safety arising out of work activities; to
conduct and sponsor research; promote training;
provide an information and advisory service; and
submit proposals for new or revised regulations
and approved codes of practice.
Health and Safety Britain’s Health and Safety Commission and
Executive (HSE) Health and Safety Executive are responsible for
the regulation of almost all the risks to health and
safety arising from work activity in Britain.
Histological Concerned with the minute structure of the tissues
of animals.
Hypercalcaemia Elevated calcium levels in the blood.
Hypercalciuria Condition of elevated calcium in the urine.
Hyperkeratosis Excessive development of the horny layer of
the skin.
8/6/2019 Metals and Metal Lo Ids
http://slidepdf.com/reader/full/metals-and-metal-lo-ids 128/139
112
Expert Panel on Air Quality Standards
Hyperpigmentation Excessive pigmentation.
Hypersensitivity Increased or abnormal sensitivity to compounds
which can trigger a specific immune response
accompanied by tissue damage.
Hypertension Abnormally high blood pressure.
Hypermethylation Excessive addition of methyl groups.
Hypomethylation Insufficient addition of methyl groups.
Intratracheal Within the trachea or windpipe.
Leucocytes A colourless corpuscle, eg, one of the white blood-
corpuscles, or one of those found in lymph,
connective tissue, etc.
Lowest Observed The lowest level of exposure at which a statistically
Adverse Effects Level significant increase in the frequency of an adverse
(LOAEL) health effect has been observed in a study.
Lymph A colourless liquid found within the lymphaticsystem, into which it drains from the spaces
between cells.
Lymphocyte A type of small leucocyte which has a single
round nucleus and little or no granulation in the
cytoplasm, constitutes about a quarter of the total
leucocytes in the blood stream, is found in large
numbers in the lymph nodes and other lymphoid
tissue, and is a major agent in mostimmunological processes.
Lymph nodes A mass of lymphoid tissue, many of which occur
at intervals along the lymphatic system. Lymph in
the lymphatic vessels flows through the lymph
nodes which filter out bacteria and other foreign
particles so preventing them from entering the
bloodstream and causing infection.
Messenger RNA Responsible for carrying the genetic code
(mRNA) transcribed from DNA to specialised sites
within the cell known as ribosomes, where the
information is translated into protein
composition.
8/6/2019 Metals and Metal Lo Ids
http://slidepdf.com/reader/full/metals-and-metal-lo-ids 129/139
113
Glossary
Metalloid An element which is intermediate of metals and
nonmetals in terms of malleability, ductility,
conductivity and lustre.
Mucocilliary transport The normal system of removal of particles form
the airways of the lung using the combination of
microscopic motile protrusions on the surface of
airway cells (‘cilia’) and mucous produced by
airway glands.
Mutagenic Changes the structure of genetic material.
Nasopharyngeal Of or relating to the nose and the pharynx jointly,
or the nasopharynx, which is the uppermost partof the pharynx, lying above the soft palate and
connecting with the nasal cavity.
No Observed Adverse A highest exposure level at which there is no
Effect Level (NOAEL) statistically or biologically significant increase in
the frequency or severity of adverse effect between
the exposed population and its appropriate
control; some effects may be produced at this
level, but they are not considered adverse, norprecursors to adverse effects.
Occupational Exposure The UK Health and Safety Commission sets
Limit (OEL) occupational exposure limits which are
concentrations of substances in the air at or below
which occupational exposure is considered to be
adequate.
Oedema Excessive accumulation of fluid in the bodytissues. When fluid accumulates in the lung it is
known as a pulmonary oedema.
Oncogene A gene whose products may in certain
circumstances transform a cell containing them
into a tumour cell.
Oxidation state A measure of the electron control that an atom
has in a compound compared to the atom in the
pure state.
Oxidative A metabolic pathway that uses energy released by
phosphorylation the oxidation of nutrients to produce adenosine
triphosphate (ATP).
8/6/2019 Metals and Metal Lo Ids
http://slidepdf.com/reader/full/metals-and-metal-lo-ids 130/139
114
Expert Panel on Air Quality Standards
Peripheral neuropathy Neuropathy (disease or dysfunction of the nervous
system) affecting one or more peripheral nerves,
causing sensory changes and motor weakness.
Pharmacokinetics Branch of pharmacology dedicated to the
determination of the fate of substances
administered externally to a living organism.
Pulmonary Relating to the lung.
Pulmonary fibrosis Chronic progressive interstitial lung disease of
unknown origin, characterised by an abnormal
and excessive deposition of fibrotic tissue in
the pulmonary interstitium with minimalassociated inflammation.
Pulmonary interstitium The part of the lungs which lies between the
principal cells, tissues, etc.
Pulmonary oedema Build up of fluid in the lungs causing
breathlessness.
Raynaud’s Spasm of the arteries of the digits (often due tophenomenon low temperature or vibration) leads to pallor,
pain, and numbness, and in severe cases
to gangrene.
Respiratory tract The organs that are involved in breathing. These
include the nose, throat, larynx, trachea, bronchi
and lungs.
Renal stones Kidney stones.
Ribonucleic A complex organic compound in living cells
acid (RNA) concerned with protein synthesis.
Sarcoidosis A chronic disease characterised by the widespread
appearance of sarcoid granulomata in the lungs
and other tissues. Its cause is usually unknown but
it can mimic berylliosis.
Subcutaneous Lying or situated under the skin.
8/6/2019 Metals and Metal Lo Ids
http://slidepdf.com/reader/full/metals-and-metal-lo-ids 131/139
115
Glossary
Threshold Limit These values are established by the American
Values (TLVs) Conference of Governmental Industrial
Hygienists (ACGIH). They are the concentration
in air of a substance to which, it is believed that,
most workers can be exposed daily without
adverse effect. Quoted as time weighted
concentrations for a seven or eight hour workday
and a 40 hour working week. For most substances
the value may be exceeded, to a certain extent,
provided there are compensating periods of
exposure below the value during the workday or,
in some cases, working week. A limited number of
substances are given ceiling concentrations that
should never be exceeded.
Toxicological Relating to toxicology, ie, the nature and effects
of poisons.
Toxicokinetics Application of pharmacokinetics to determine the
relationship between the systemic exposure of a
compound in experimental animals and its
toxicity. It is used primarily for establishing
relationships between exposures in toxicologyexperiments in animals and the corresponding
exposures in humans.
Transferrin Any of several beta globulins found in blood
serum which bind and transport iron.
Vasospastic symptoms Sudden constriction of a blood vessel, resulting in
reduced flow.

8/6/2019 Metals and Metal Lo Ids
http://slidepdf.com/reader/full/metals-and-metal-lo-ids 132/139
116
Expert Panel on Air Quality Standards
8/6/2019 Metals and Metal Lo Ids
http://slidepdf.com/reader/full/metals-and-metal-lo-ids 133/139
117
Appendix 1
Setting air quality standards and guidelines
for chemical carcinogens
A1 Introduction
306. One of the generic problems for an expert committee in setting air
quality standards and guidelines for the protection of human health is
that it has to work from pre-existing data, which are usually far from
ideal; rarely is it possible to commission studies specifically to aid in
the standard-setting process. The pre-existing data usually fits into one
of three categories:
• Studies in which human subjects have been administered controlled
exposures of pollutants in a clinical setting and their response
closely monitored (termed chamber or challenge studies);• Epidemiological studies of human populations either in the
workplace or the non-occupational environment;
• Studies using animals as model species.
307. In the case of chemical carcinogens, the first type of data is unavailable
for ethical reasons and the epidemiological data, when relating to
specific chemical substances as opposed to the air pollutant mix as a
whole, are derived from exposures in the workplace. The
concentrations there are often higher by several orders of magnitude
than those to which the general public are exposed in their everyday
lives. As a last resort, expert panels have to base their judgements on
studies with animal models, but there is always a problem of how to
extrapolate that information between species. This is particularly
problematic when a chemical proves carcinogenic in one test species
but not in another. In the case of the chemical carcinogens addressed
by EPAQS thus far (benzene, 1,3-butadiene and polycyclic aromatic
hydrocarbons), there have generally been high quality studies of cancerincidence in occupationally exposed workers (albeit relatively few in
number). It is these studies that have formed the basis for standard-
setting. The approach adopted thus far by EPAQS has differed from
that used by the World Health Organisation (WHO) and some other
countries. The purpose of this appendix is to explain the EPAQS
approach and to compare and contrast it with the other main
approach used, that based upon quantitative risk assessment.
8/6/2019 Metals and Metal Lo Ids
http://slidepdf.com/reader/full/metals-and-metal-lo-ids 134/139
118
Expert Panel on Air Quality Standards
308. Before describing the approaches used, it is important to distinguish
between genotoxic and non-genotoxic carcinogens. The former act by
damaging DNA in the nucleus of the cell. In this case, a single
molecule of the chemical carcinogen could lead to cancer, but the
chances are exceedingly small. However, because of this there is no
level of exposure which is entirely without risk. Non-genotoxic
carcinogens act by other mechanisms, such as by damaging tissue,
leading to continuous re-growth during which cell mutations may
occur, leading in turn to cancer. For non-genotoxic carcinogens, there
may be a threshold, or safe level of exposure below which the processes
preceding carcinogenesis do not take place, and hence cancer does not
result. Benzene, 1,3-butadiene and polycyclic aromatic hydrocarbons
are believed to be, and are generally accepted as, genotoxic
carcinogens. The evidence relating to the metals in this report is lessclear, but consistent with the Panel’s precautionary approach, a
genotoxic mechanism has been assumed. The following discussion
relates to genotoxic carcinogens.
A2 The EPAQS approach to setting air qualityguidelines for chemical carcinogens
309. EPAQS first developed its approach when recommending an airquality standard for benzene. This is a chemical to which there had
been widespread exposures in industry. There was a well known excess
of leukaemia in the synthetic rubber industry attributable to benzene
exposure. The approach of EPAQS was to review the occupational
exposure literature and to identify a high quality study in which the
excess cases of cancer in large groups of workers with different
exposures to benzene had been estimated. Generally, as expected, those
workers with the largest integrated exposures to benzene were found to
have the highest risk of contracting cancer. By examining the lessexposed groups of workers it was possible to identify the highest
exposure concentration at which no significant excess of cancers could
be identified. It was accepted that had larger numbers been studied
then an effect might have been discovered. Thus no completely safe
level of exposure could be identified. However, the Panel took as a
starting point a figure derived from the published studies that showed
no effect (EPAQS, 1994).
310. Having identified a starting point from a study of workers in asynthetic rubber plant in North America, EPAQS went about building
in safety margins to protect the general public. They built in two
factors as follows:
• a factor to take account of the fact that the general public is
exposed to polluted air for 24 hours a day, 365 days a year for a
lifetime (taken as 70 years) whilst the occupationally-exposed
worker will be exposed only for about 220 working days per year, 40
8/6/2019 Metals and Metal Lo Ids
http://slidepdf.com/reader/full/metals-and-metal-lo-ids 135/139
119
Appendix 1
hours per week for a 40 year maximum working lifetime. This led to
an exposure duration safety factor of ten;
• a second safety factor of ten was also applied to recognise the fact
that those exposed in industry are generally healthy adult workers
whereas the general public includes the very young and the infirm
who may, perhaps for genetic reasons, be more vulnerable to
developing cancer as a result of exposure to carcinogens.
311. The combination of the two safety factors leads to an overall factor of
100 by which the starting figure is divided to give a guideline value at
which, in the judgement of the Panel, the risks to the general public
from benzene exposure should be exceedingly small. The standard
arrived at was 5 ppb (annual average concentration). The panel
recognised that this was greater than the current ambientconcentration and proposed as a target 1 ppb. No formal mechanism
for deriving 1 ppb from 5 ppb was proposed. Outdoor benzene
exposures in the UK are nowadays generally around 1 part per billion,
or less, compared to part-per-million exposure levels for the workers in
tyre manufacture who contracted leukaemia.
312. When EPAQS examined occupational cancer data resulting from
exposure to polycyclic aromatic hydrocarbons, the Panel found that
even the least exposed group of workers in an aluminium smelterexperienced a small but significant increase in lung cancer incidence.
The studies did not report a No Observed Adverse Effect Level
(NOAEL). The lowest category of exposures at which an effect on
cancer was seen was presented as a range and EPAQS took the lower
boundary of that range and referred to it as a Lowest Observed
Adverse Effect Level (LOAEL). Recognising that this still represented
a small but significant risk of additional cancers, EPAQS divided the
LOAEL by ten to reach a notional NOAEL to which additional safety
factors, each of ten for duration of exposure and vulnerable groupswere applied in order to reach a guideline.
313. In effect, therefore, the EPAQS approach identifies an amount of
chemical carcinogen which is associated with minimal risk to those
occupationally exposed. It then converts this to a lower concentration
corresponding to that at which the general public would receive the same
overall dose as those exposed occupationally over a working lifetime and
then further applies a safety factor of ten to allow for vulnerable groups
in the population. This approach is both logical and transparent but
differs from that used by the WHO and some other countries.
8/6/2019 Metals and Metal Lo Ids
http://slidepdf.com/reader/full/metals-and-metal-lo-ids 136/139
120
Expert Panel on Air Quality Standards
A3 The quantitative risk assessment approach
314. The data from occupational exposures to chemical carcinogens tell us
that at a certain (high) exposure concentration there is a particular
level of additional risk for exposed workers. The quantitative riskassessment approach seeks to extrapolate the occupational data to
lower concentrations and therefore to quantify the additional risk of
cancer at environmentally meaningful concentrations. There are many
ways in which this extrapolation can be made depending upon the
assumed mechanism of carcinogenesis. This can lead to very different
estimates of risk at low exposure concentrations, which is one of the
weaknesses of the Quantitative Risk Assessment approach. In practice
the simplest assumption and that used by the WHO is that the risk of
cancer is zero only at zero concentration of that compound andincreases proportionately with concentration. This is referred to as a
linear model without threshold (i.e. there is no level below which no
effect is thought to occur).
315. This method leads to an estimate of risk referred to as the incremental
unit risk estimate which is defined by WHO as “the additional lifetime
cancer risk occurring in a hypothetical population in which all individuals
are exposed continuously from birth throughout their lifetimes to a
concentration of 1 µg/m3 of the agent in the air they breathe”.
316. The WHO is frank about the limitations to this approach (WHO, 2000)
and one of its concerns shared by the Department of Health’s
Committee on Carcinogenicity is that the method can give a spurious
impression of precision when extrapolating data which already have
inherent uncertainties over orders of magnitude in concentration. The
WHO (2000) point out that the quantitative risk estimates should not
be regarded as being equivalent to the true cancer risk, but to representplausible upper bounds which may vary widely according to the
assumptions on which they are based. Nonetheless, the method is very
widely used and, for example, for benzene, yields an excess lifetime risk
of leukaemia at an air concentration of 1 µg/m3 of 6 x 10⁻⁶ (WHO, 2000)
– i.e. 6 in 1 million, meaning that six people in every million exposed to
benzene at that concentration will develop leukaemia in a lifetime. The
WHO does not directly utilise this unit risk factor to recommend a
numerical air quality guideline but calculates the concentrations of
airborne benzene associated with particular levels of excess lifetimerisk. In the case of benzene, the excess lifetime risk of one in 10,000
occurs at a concentration of 17 µg/m3, a lifetime risk of one in 100,000
at 1.7 µg/m3 and a lifetime risk of one in 1 million at 0.17 µg/m3.
317. The quantitative risk assessment method uses the same occupational
cancer data as a starting point and inherently very similar assumptions
to the EPAQS method. However, unlike the EPAQS method it does not
8/6/2019 Metals and Metal Lo Ids
http://slidepdf.com/reader/full/metals-and-metal-lo-ids 137/139
121
Appendix 1
arrive at a single concentration as a guideline. Rather, it is necessary for
the standard setting agency to specify a maximum tolerable level of
risk which can then be converted to a guideline concentration using the
unit risk factor. Governments have traditionally been reluctant to
specify such levels of tolerable risk. To do so involves societal
judgements, and arguably expert committees should not usurp the
rights of society to make such judgements themselves.
A4 How do the methods compare?
318. As pointed out above, the starting points to the two methods are
essentially identical although it may be easier for the unit risk factor
method to take account of multiple sources of data which can be
combined using standard meta-analysis methods. On the other hand,the EPAQS method allows the Panel to use as its starting point the
study showing the greatest impact, in order to take a precautionary
approach. The assumptions inherent in each method are also broadly
similar in assuming linearity (proportionality) of response and no
threshold. If one takes the standards recommended by EPAQS for
benzene and polycyclic aromatic hydrocarbons, and converts them to
an implied level of excess risk using WHO unit risk factors, the level of
risk turns out to be about one in 100,000 lifetime risk.
A5 The specific case of Arsenic
319. In recommending an air quality guideline for arsenic, the Panel has
adopted the procedure used previously by EPAQS in recommending
standards for chemical carcinogens. Three studies were available from
metal smelters and the lowest range of cumulative exposure that was
associated with a statistically significant increase in lung cancer risk
was less than 250 µg/m3.years in a Swedish workforce and less than833 µg/m3.years and 750-2000 µg/m3.years in two US workforces.
The Panel adopted a precautionary approach and took the lowest
exposures, corresponding to the Swedish workforce and took the mid-
point of the exposure range whose lower bound was not defined in the
study and was assumed to be zero. Thus, the mid-point was
125 µg/m3.years, which taking the precautionary assumption that those
contracting cancer had been exposed for 40 year converts to an average
concentration of 3 µg/m3 over a 40 year working lifetime.
320. This yields 3 µg/m3 as a LOAEL, and following the earlier practice
of dividing by ten, 0.3 µg/m3 (or 300 ng/m3) as a NOAEL. Dividing by
two further factors of ten, one to allow for exposure duration and the
other for susceptible groups results in a recommended guideline value
of 3 ng/m3.
8/6/2019 Metals and Metal Lo Ids
http://slidepdf.com/reader/full/metals-and-metal-lo-ids 138/139
122
Expert Panel on Air Quality Standards
321. The most recent quantitative risk evaluations of the workforce cancer
data for arsenic yield pooled estimates of the unit risk of 1.43 x 10⁻³ per
µg/m3 (Viren and Silvers, 1994) and 1.5 x 10⁻³ per µg/m3 (WHO, 2000).
If one takes the figure from WHO (2000), then the EPAQS
recommendation of 3 ng/m3 equates to a lifetime risk of 4.5 in a
million or about half of the one in 100,000 risk level discussed above
as being of the order sometimes used in regulatory toxicology.
References
EPAQS (1994). Benzene. Expert Panel on Air Quality Standards.
Viren, J.R. and Silvers, A. (1994). Unit Risk Estimates for Airborne Arsenic
Exposure: An Updated View Based on Recent Data from Two CopperSmelter Cohorts. Regulatory Toxicology and Pharmacology, 20, 125-138.
WHO (2000). Air Quality Guidelines for Europe, Second Edition.
Copenhagen, WHO, Regional Office for Europe (WHO Regional
Publications, European Series, No. 91).
http://www.euro.who.int/document/e71922.pdf
8/6/2019 Metals and Metal Lo Ids
http://slidepdf.com/reader/full/metals-and-metal-lo-ids 139/139