Embed Size (px)
DESCRIPTION
METAL LOSS IN-LINE INSPECTION SURVEYS. LIMITS AND INACCURACIES. BACKGROUND. Began use in 1960’s. Initial inspection tools were low resolution, low power tools. Suitable for finding where to look for corroded pipe. Better resolution and power offered in 1980’s. - PowerPoint PPT Presentation
Citation preview
METAL LOSS IN-LINE
INSPECTION SURVEYS
LIMITS AND INACCURACIES
2
BACKGROUND• Began use in 1960’s.• Initial inspection tools were low resolution, low
power tools.• Suitable for finding where to look for corroded
pipe.• Better resolution and power offered in 1980’s.• High resolution tools began use in late 1980’s.• Despite limitations and inaccuracies, pipelines
began to calculate pressure limits based on in-line inspection grading in late 1990’s/early 2000’s.
INACCURACIES IN PRESSURE
LIMIT CALCULATIONS
4
5
RUPTURES
6
LEAKS
7
High Resolution Inspection Tool Stated Limits and Inaccuracies
• API 1160
• Inspection Company’s Specs
8
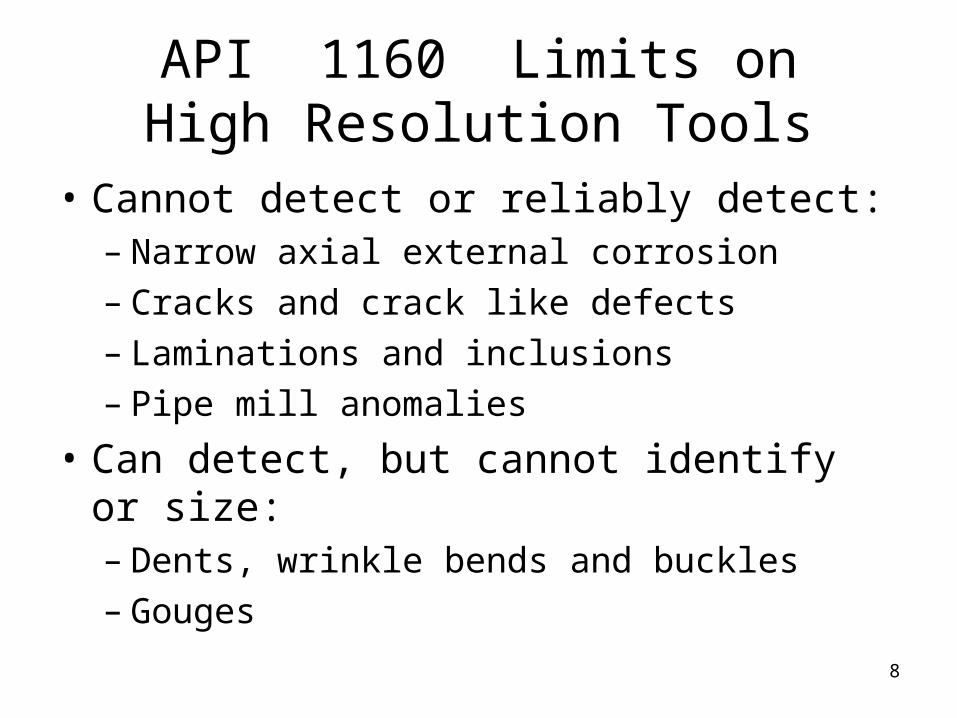
API 1160 Limits onHigh Resolution Tools
• Cannot detect or reliably detect:– Narrow axial external corrosion– Cracks and crack like defects– Laminations and inclusions– Pipe mill anomalies
• Can detect, but cannot identify or size:– Dents, wrinkle bends and buckles– Gouges
9
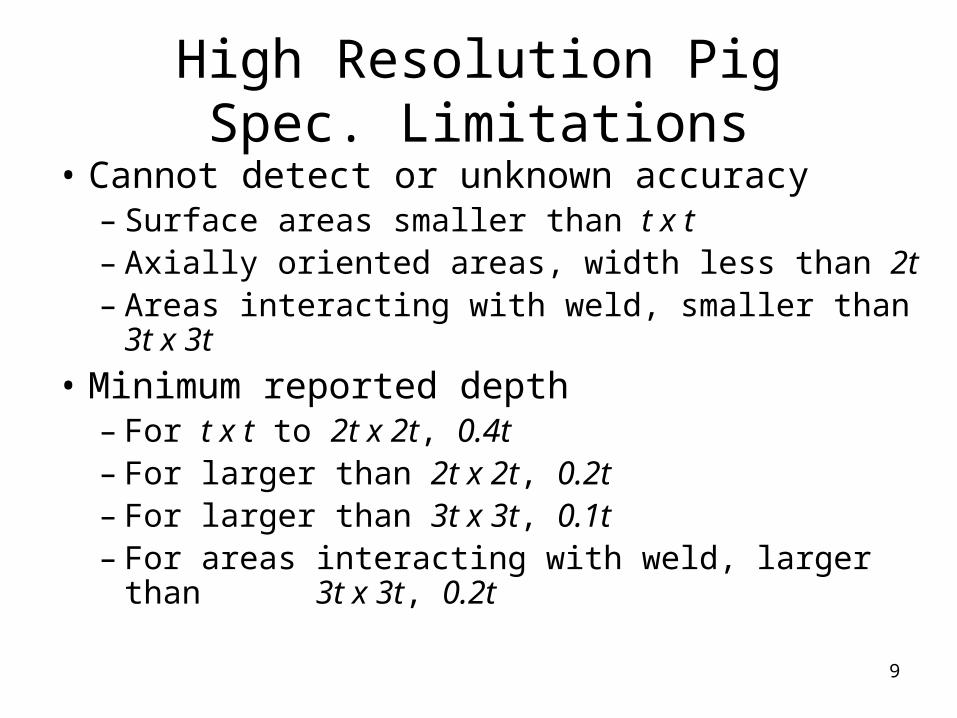
High Resolution PigSpec. Limitations
• Cannot detect or unknown accuracy– Surface areas smaller than t x t– Axially oriented areas, width less than 2t– Areas interacting with weld, smaller than 3t x 3t
• Minimum reported depth– For t x t to 2t x 2t, 0.4t– For larger than 2t x 2t, 0.2t– For larger than 3t x 3t, 0.1t– For areas interacting with weld, larger than 3t
x 3t, 0.2t
10
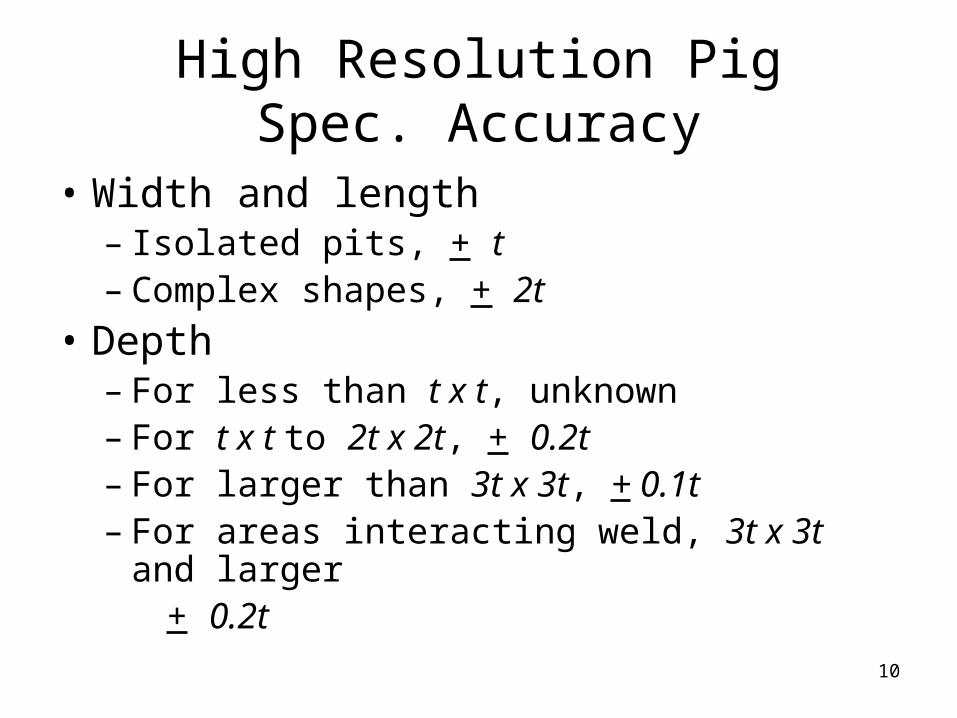
High Resolution PigSpec. Accuracy
• Width and length– Isolated pits, + t– Complex shapes, + 2t
• Depth– For less than t x t, unknown– For t x t to 2t x 2t, + 0.2t– For larger than 3t x 3t, + 0.1t– For areas interacting weld, 3t x 3t and larger + 0.2t
11
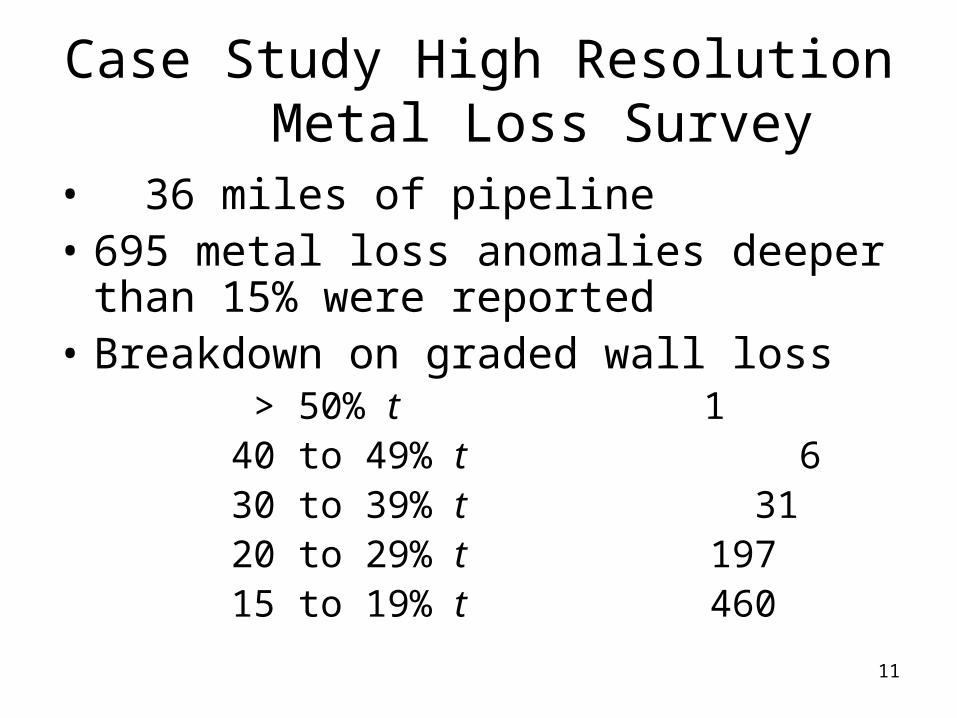
Case Study High Resolution Metal Loss Survey
• 36 miles of pipeline• 695 metal loss anomalies deeper than
15% were reported• Breakdown on graded wall loss
> 50% t 140 to 49% t 630 to 39% t 3120 to 29% t 19715 to 19% t 460
12
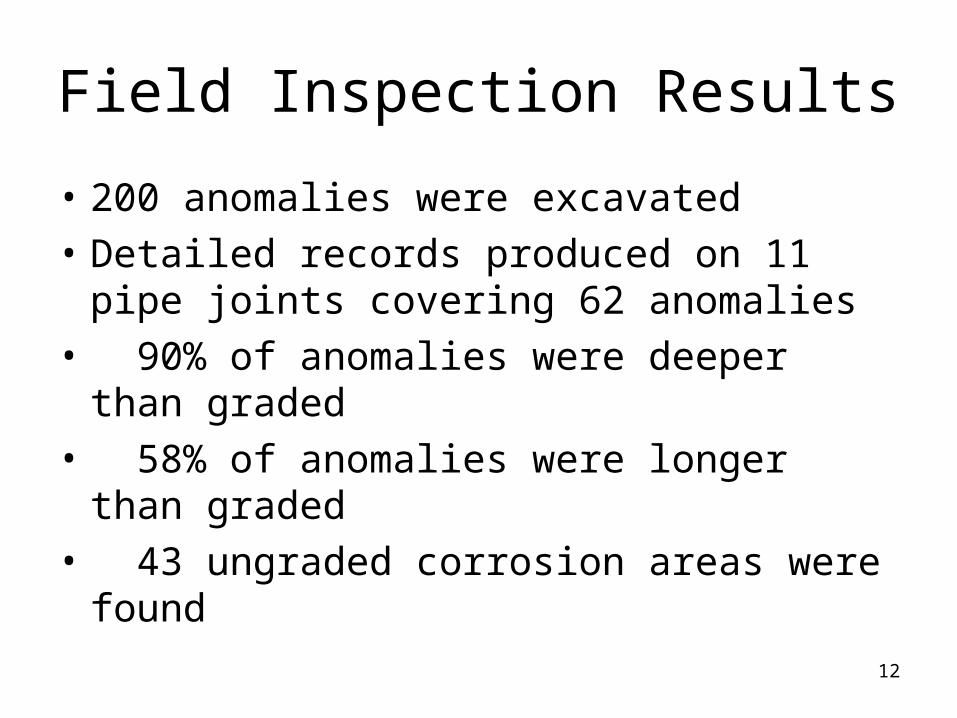
Field Inspection Results
• 200 anomalies were excavated
• Detailed records produced on 11 pipe joints covering 62 anomalies
• 90% of anomalies were deeper than graded
• 58% of anomalies were longer than graded
• 43 ungraded corrosion areas were found
13
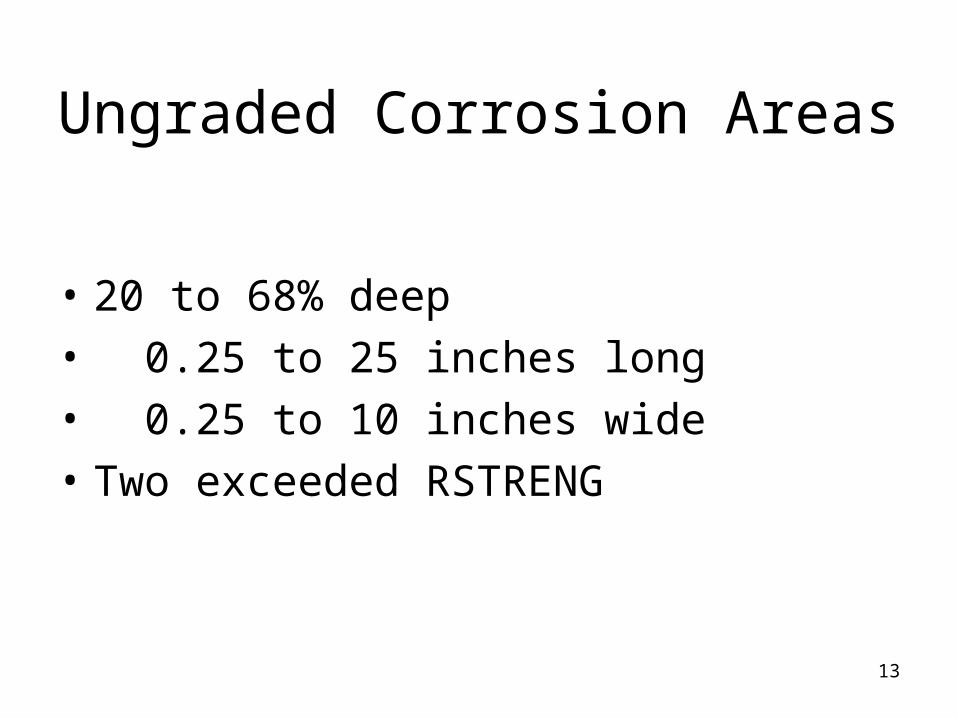
Ungraded Corrosion Areas
• 20 to 68% deep
• 0.25 to 25 inches long
• 0.25 to 10 inches wide
• Two exceeded RSTRENG

14
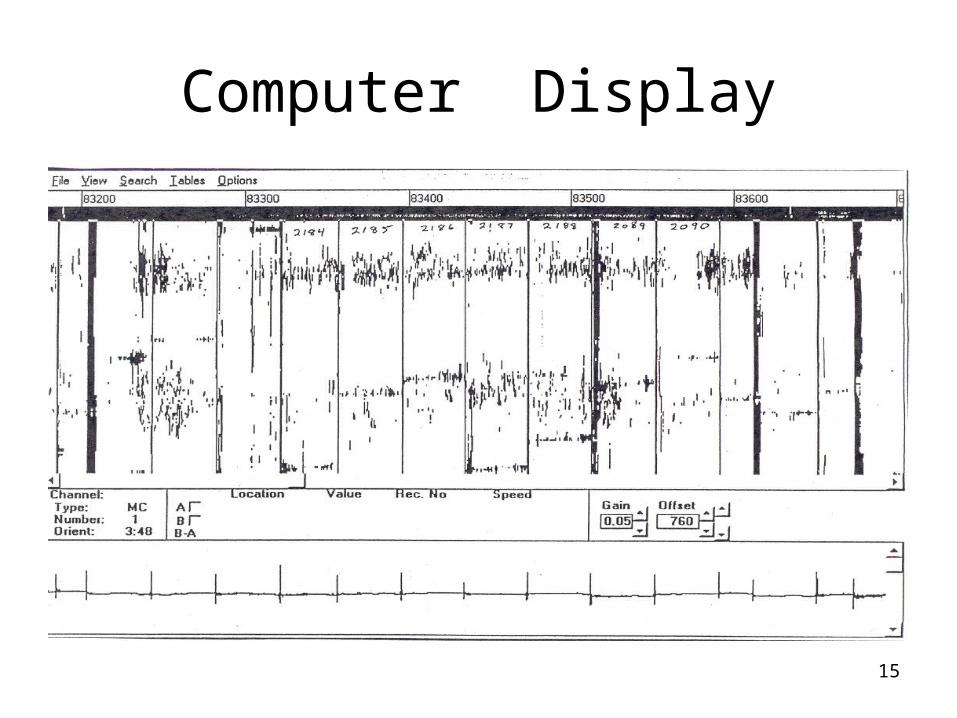
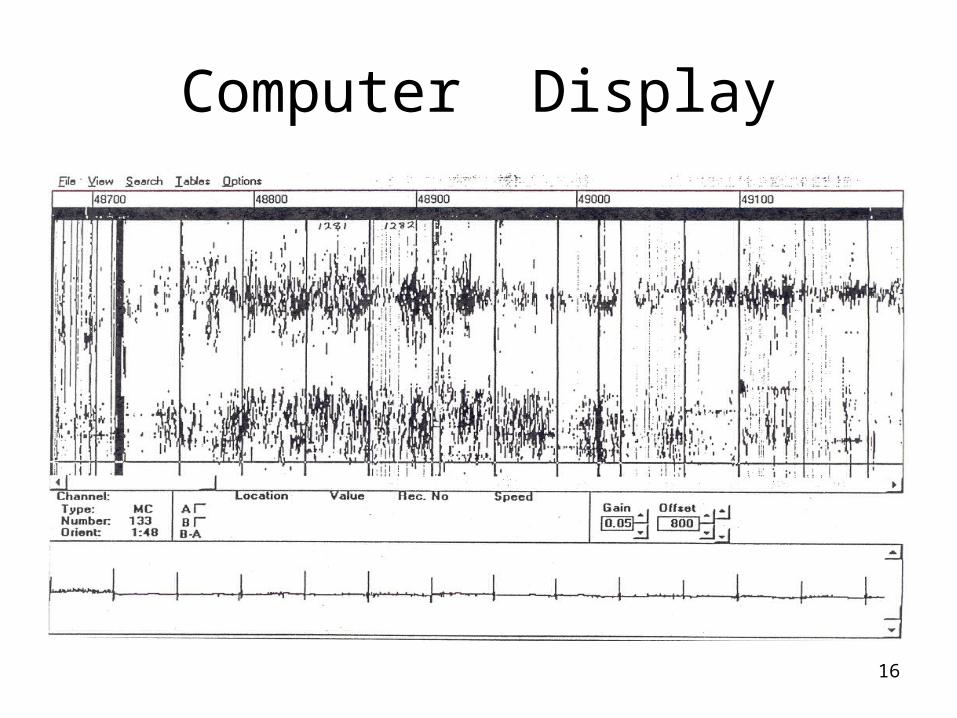
Computer Display
15
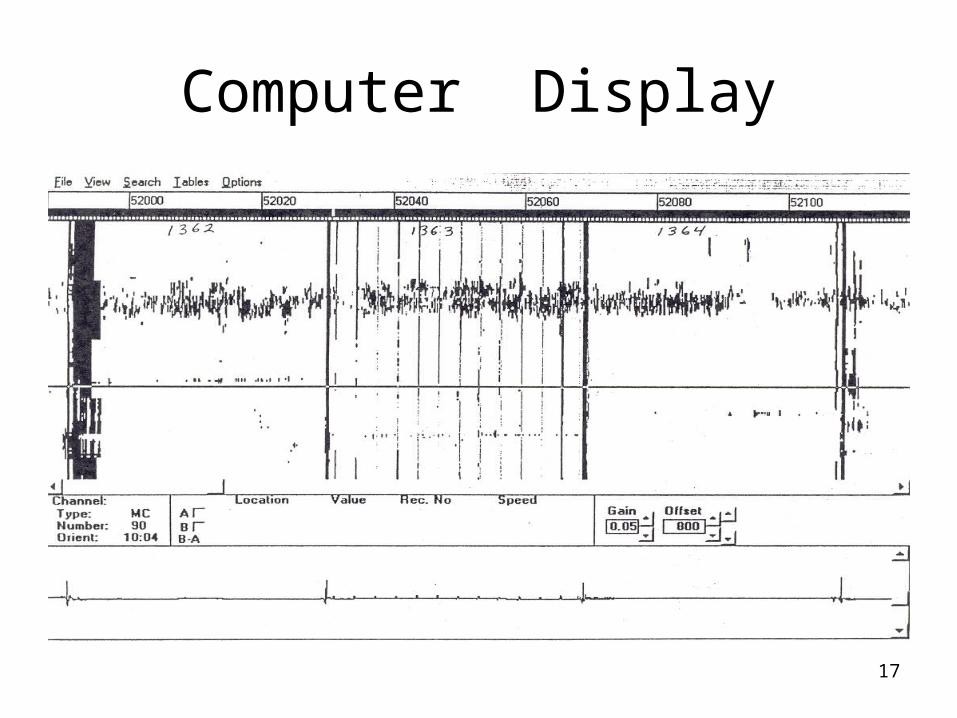
Computer Display
16
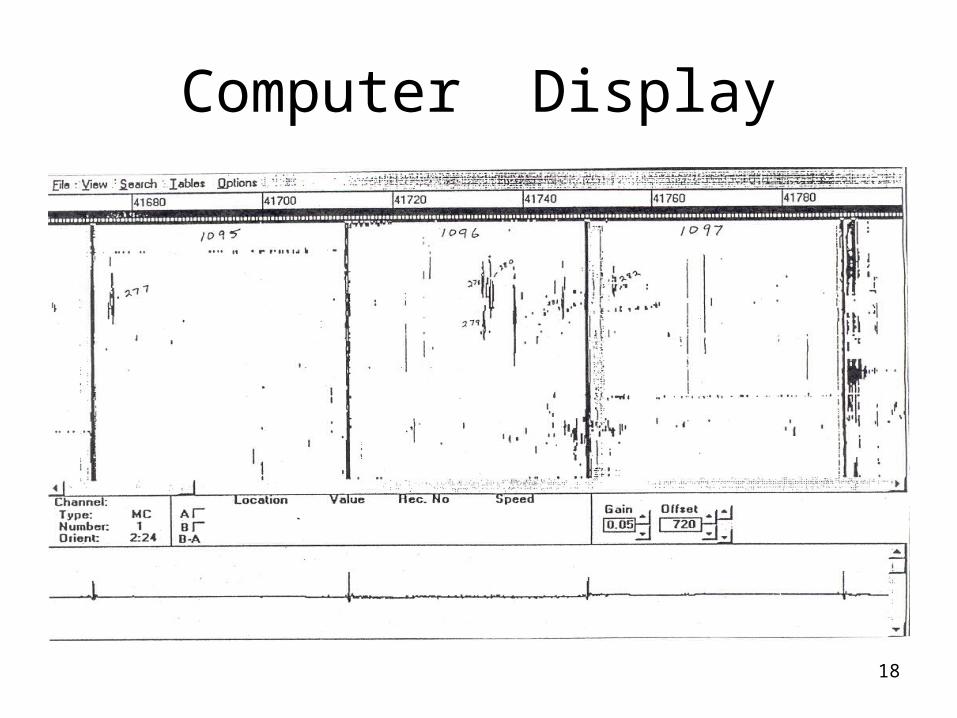
Computer Display
17
Computer Display
18
Computer Display
19
Needed Post Field Inspection Activities
• Organize graded vs. found data
• Regrade in-line inspection survey
• New field inspection plan
• Re-inspect and repair pipeline
• Statistical analysis of areas not inspected
• Apply future growth to anomalies
20
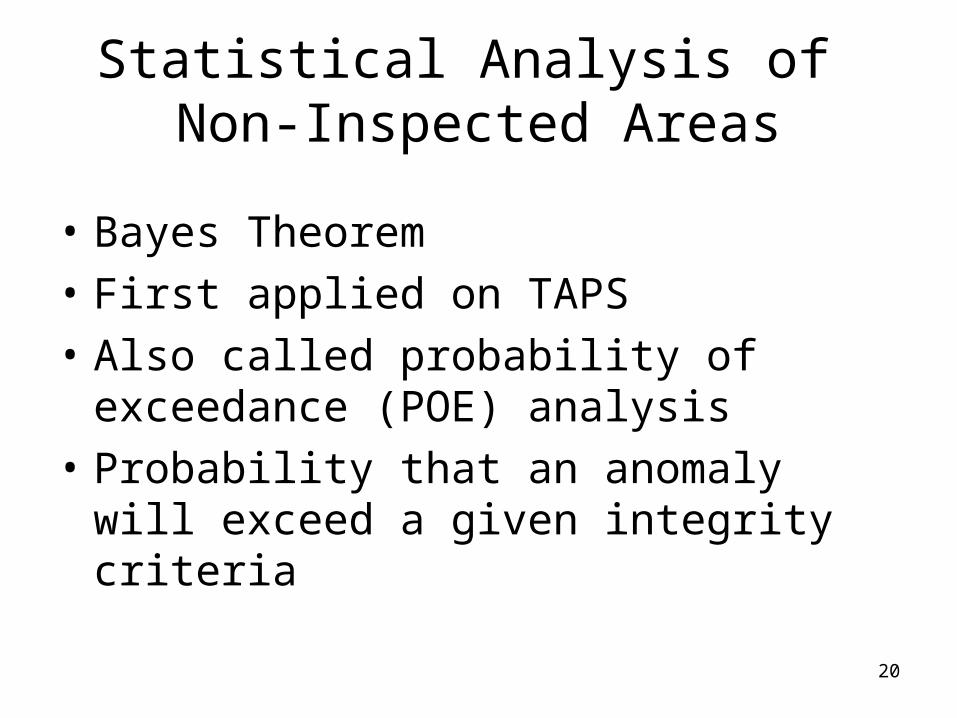
Statistical Analysis of Non-Inspected Areas
• Bayes Theorem
• First applied on TAPS
• Also called probability of exceedance (POE) analysis
• Probability that an anomaly will exceed a given integrity criteria
21
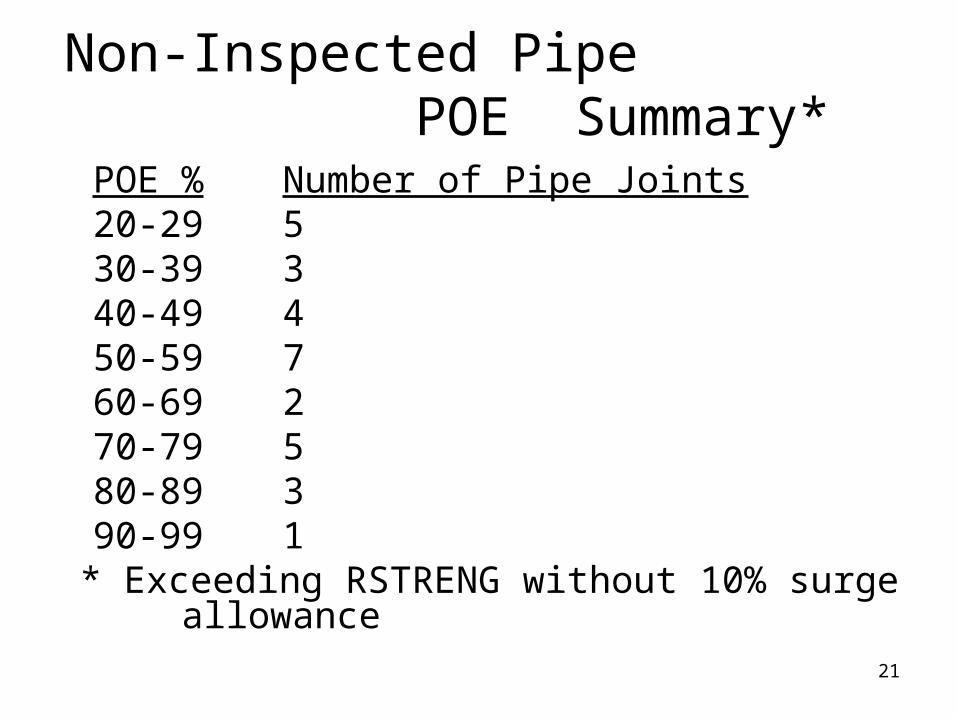
Non-Inspected Pipe POE Summary*
POE % Number of Pipe Joints20-29 530-39 340-49 450-59 760-69 270-79 580-89 390-99 1
* Exceeding RSTRENG without 10% surge allowance
22
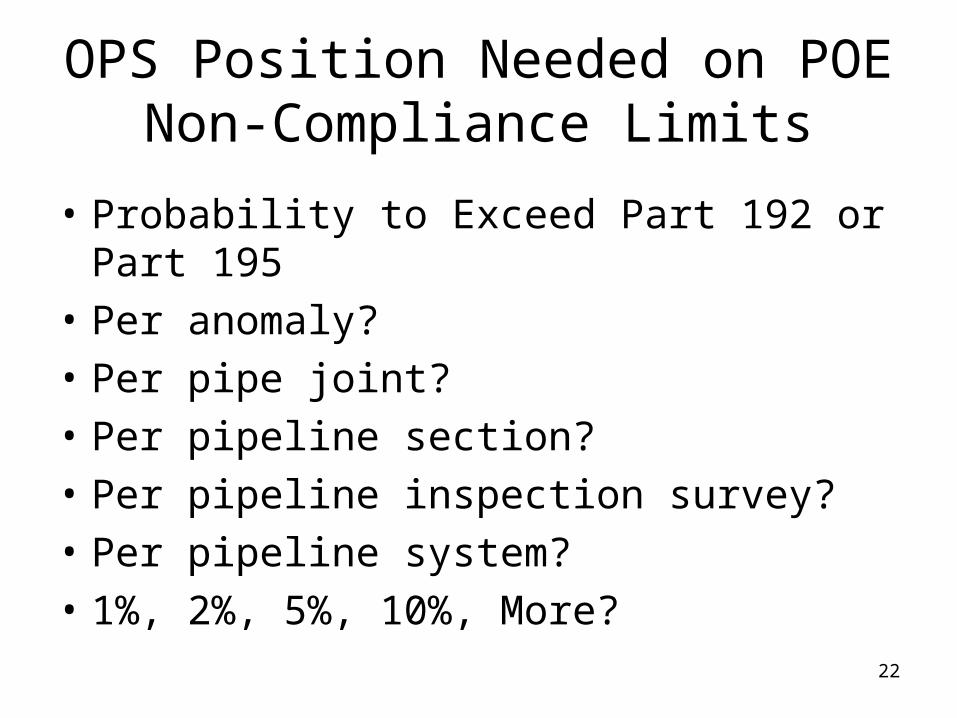
OPS Position Needed on POE Non-Compliance Limits
• Probability to Exceed Part 192 or Part 195
• Per anomaly?
• Per pipe joint?
• Per pipeline section?
• Per pipeline inspection survey?
• Per pipeline system?
• 1%, 2%, 5%, 10%, More?


![[TSC] Countermeasure Surveys - Xpera€¦ · Technical Surveillance Countermeasure Surveys Information is the lifeblood of competitive advantage. To prevent the loss of intellectual](https://img.pdfslide.us/doc/110x75/605a9a810b4d8b273b5156cd/tsc-countermeasure-surveys-xpera-technical-surveillance-countermeasure-surveys.jpg)