Embed Size (px)
Citation preview
This document is being distrubuted as an operational draft. Thefinal version will be published in booklet style on or before March31, 2001. At that time, the document will also be availableelectronically in a read-only format.
Comments should be submitted to:Brian RaymerTel: 250-387-8909Fax: [email protected]
Your comments may also be forwarded to:Prifor Management Ltd.Sue SchaadTel: 250-392-2703Fax: [email protected]
JUVENILESPACINGQUALITYINSPECTIONMarch 30, 2001
FS251 HFP 01/03/20
2Juvenile Spacing Quality Inspection March 30, 2001
Table of ContentsIntroduction ................................................................................... 2Survey Principles ........................................................................... 3Choosing a Plot Radius .................................................................. 4Survey Methodology and Data Collection .................................... 4Conventions Used in this Document ............................................. 5Correlation between Pre Stand Tending Surveys, SMPs and
Juvenile Spacing Treatments ............................................. 5Plot Legend .................................................................................... 6Plot 1 - Plot in an Evenly Spaced Stand ......................................... 6Plot 2 - Variation in the Inter-Tree Distance ................................... 7Plot 3 - Natural Openings in the Plot .............................................. 8Plot 4 - Natural Opening and Reducing the Inter-Tree Distance .... 9Plot 5 - Excess Trees ..................................................................... 10Plot 6 - Designated Tree Uncut ..................................................... 11Plot 7 - Close Spacing – Inside or Outside the Plot Boundary ...... 11Plot 8 - Close Spacing – Inside or Outside the Plot Boundary ...... 12Plot 9 - Reworkable Errors ............................................................ 13Plot 10 - Over Cutting .................................................................... 14Plot 11- Over Cutting and Creating a Void ..................................... 15Plot 12 - Improper Crop Tree Selection ......................................... 16Plot 13 - Improper Crop Tree Selection ......................................... 17Plot 14 - Cutting or Damaging Leave Trees ................................... 18Procedures for Confirming Density and Establishing
Density Plots .................................................................... 19Reworkable Errors ......................................................................... 20Non Reworkable Errors ................................................................. 21Juvenile Spacing Quality Inspection Plot Card ............................. 22Sample Juvenile Spacing Quality Inspection Plot Card ................. 23Payment Calculations .................................................................... 24Juvenile Spacing Payment Calculation Card ................................. 25Sample Juvenile Spacing Payment Calculation Card ..................... 26Juvenile Spacing Payment Quick Reference Guide ....................... 27Inter-Tree Distances and Corresponding Stand Densities ........... 28
IntroductionThe juvenile spacing quality inspection system is a procedureintended to be used to determine the quality of treatment and thesubsequent payment percentage of the work performed on ajuvenile spacing project.
A standardized inspection procedure is required so that allparties involved in juvenile spacing projects understand how thesuccess of the project will be measured. The “rules” formeasuring the success of juvenile spacing projects are found inthe Stand Management Prescription (SMP), in the contract and inthis document.
It is important to follow the procedures described in thisdocument to ensure that proper implementation of the “rules” areapplied consistently to all juvenile spacing projects.
The juvenile spacing quality inspection procedures involve theestablishment of sample plots within the work area. The plotdata are then used in mathematical calculations to determine thePerformance Quality, commonly referred to as the Quality ofWork. This Performance Quality is then used to determine aPayment Percent. The bid price per hectare multiplied by thePayment Percent determines the final amount that the contractorwill be paid for the work completed.
The intent of these juvenile spacing quality inspectionprocedures is to determine how closely the work completedcorresponds to the standards stated in the SMP and in thecontract. If the quality of work completed is below 92.6%, thenpayment is reduced based on a graduated payment system.
This update of the juvenile spacing quality inspectionprocedures introduces new concepts to deal with the naturalvariation commonly found within young forested stands andpromotes the selection of the best crop trees.
3Juvenile Spacing Quality Inspection March 30, 2001
Survey PrinciplesThe juvenile spacing quality inspection procedure is a samplingprocess that uses circular sample plots. The total tree and croptree densities, as well as the faults found in the plots areassumed to be representative of the work area in and aroundthe plot locations.
Circular plots with a known radius are the key to the samplingprocedures. We know that a plot with a radius of 3.99 metres(m) has an area of 50 m2. This is determined using the formulafor calculating the area of a circle. A hectare is 10 000 m2. Thismeans a 3.99 metre circular plot represents 1/200 of a hectare.The plot multiplier is determined by dividing 10 000 m2 by 50 m2.Therefore, the plot multiplier is 200. For example, if you have 7crop trees within a plot, you can calculate that there are 1400crop trees per hectare by multiplying 7 crop trees by 200.
The same mathematical principles can be applied to a plotradius of 5.64 m. The plot multiplier is 100. Therefore, theaverage density per hectare is equal to the average number ofcrop trees in a plot multiplied by 100.
The most common sampling methodology involves thepositioning of plots along predetermined strip lines. Plots arepositioned at regular intervals along the strip lines. Manypeople refer to this as a “grid pattern”.
This systematic method is only one of the possiblemethodologies. Any method that produces a non-biased,systematic random sample is acceptable.
The number of plots to be established is not regulated. Thecontract may specify the sampling intensity. However, over theyears an accepted standard of 1 plot per hectare has becomequite common. When considering how many plots to establish,one should consider the following;
• the variation in stand density prior to treatment,• visual impressions of the consistency of the treatment,• confidence with the historic quality of work
performed by the Contractor.
Less than one plot per hectare can often provide the desiredprecision required for determining payment.
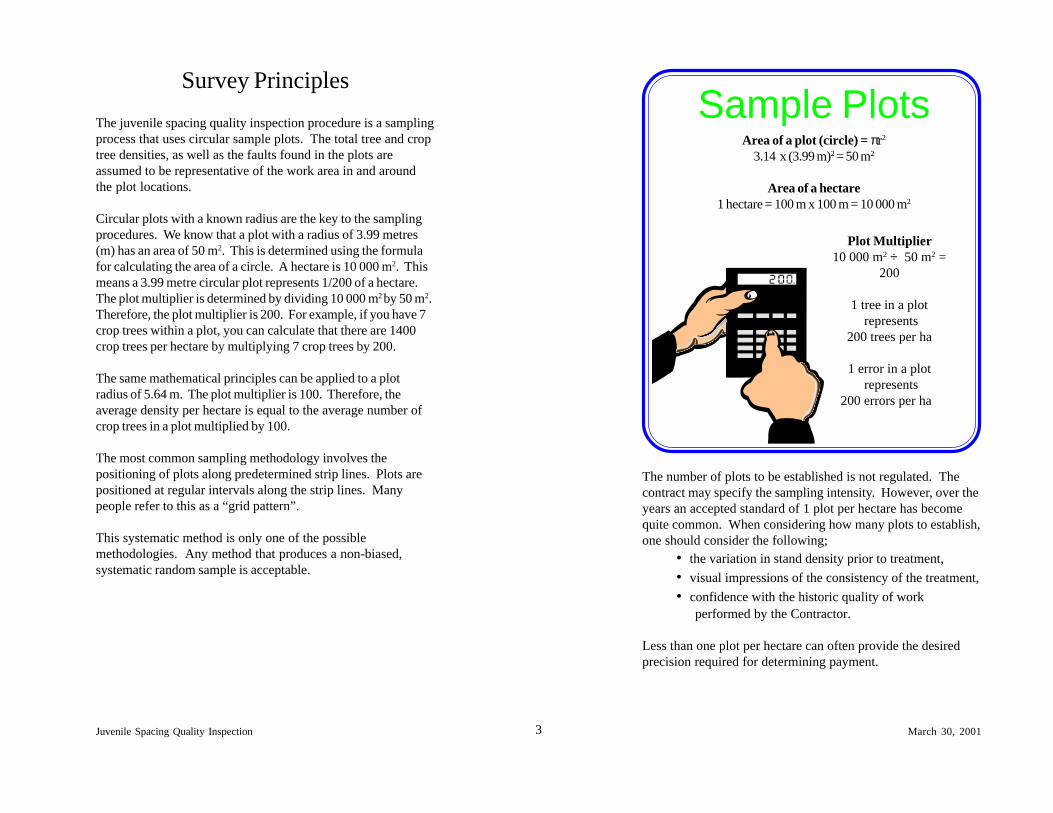
Sample PlotsArea of a plot (circle) = πr2
3.14 x (3.99 m)2 = 50 m2
Area of a hectare1 hectare = 100 m x 100 m = 10 000 m2
Plot Multiplier10 000 m2 ÷ 50 m2 =
200
1 tree in a plot represents
200 trees per ha
1 error in a plot represents
200 errors per ha
4Juvenile Spacing Quality Inspection March 30, 2001
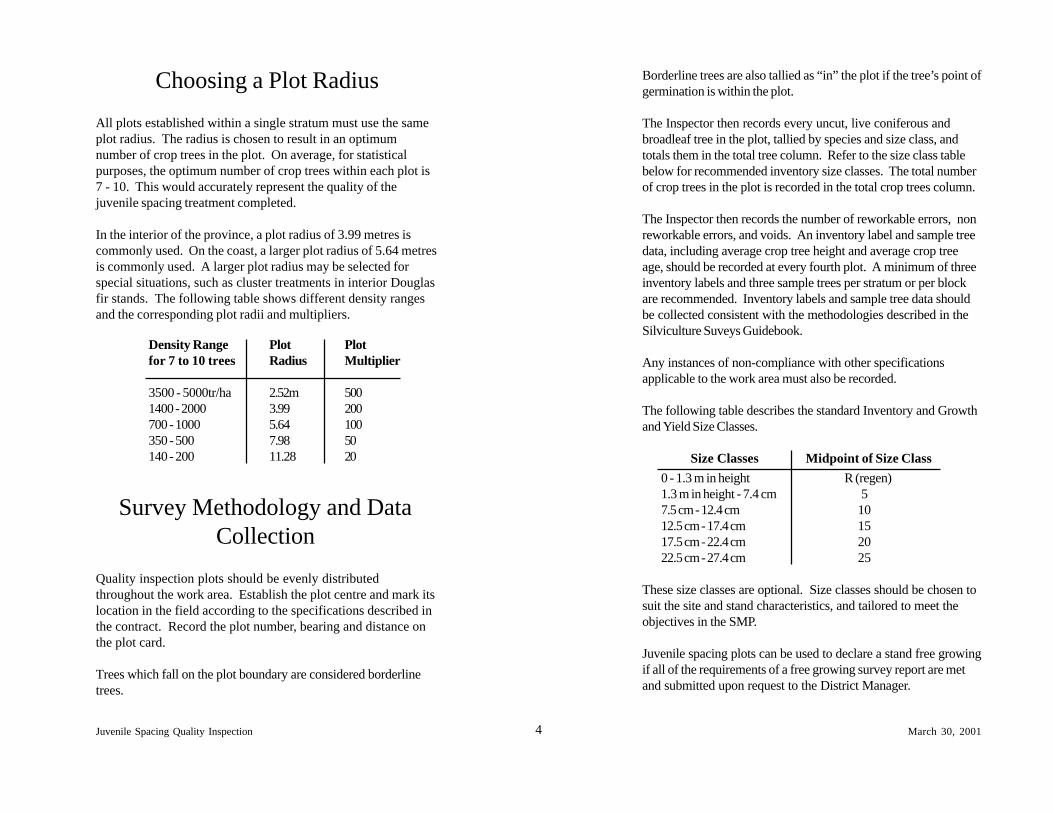
Choosing a Plot RadiusAll plots established within a single stratum must use the sameplot radius. The radius is chosen to result in an optimumnumber of crop trees in the plot. On average, for statisticalpurposes, the optimum number of crop trees within each plot is7 - 10. This would accurately represent the quality of thejuvenile spacing treatment completed.
In the interior of the province, a plot radius of 3.99 metres iscommonly used. On the coast, a larger plot radius of 5.64 metresis commonly used. A larger plot radius may be selected forspecial situations, such as cluster treatments in interior Douglasfir stands. The following table shows different density rangesand the corresponding plot radii and multipliers.
Borderline trees are also tallied as “in” the plot if the tree’s point ofgermination is within the plot.
The Inspector then records every uncut, live coniferous andbroadleaf tree in the plot, tallied by species and size class, andtotals them in the total tree column. Refer to the size class tablebelow for recommended inventory size classes. The total numberof crop trees in the plot is recorded in the total crop trees column.
The Inspector then records the number of reworkable errors, nonreworkable errors, and voids. An inventory label and sample treedata, including average crop tree height and average crop treeage, should be recorded at every fourth plot. A minimum of threeinventory labels and three sample trees per stratum or per blockare recommended. Inventory labels and sample tree data shouldbe collected consistent with the methodologies described in theSilviculture Suveys Guidebook.
Any instances of non-compliance with other specificationsapplicable to the work area must also be recorded.
The following table describes the standard Inventory and Growthand Yield Size Classes.
Size Classes Midpoint of Size Class0 - 1.3 m in height R (regen)1.3 m in height - 7.4 cm 57.5 cm - 12.4 cm 1012.5 cm - 17.4 cm 1517.5 cm - 22.4 cm 2022.5 cm - 27.4 cm 25
These size classes are optional. Size classes should be chosen tosuit the site and stand characteristics, and tailored to meet theobjectives in the SMP.
Juvenile spacing plots can be used to declare a stand free growingif all of the requirements of a free growing survey report are metand submitted upon request to the District Manager.
Survey Methodology and DataCollection
Quality inspection plots should be evenly distributedthroughout the work area. Establish the plot centre and mark itslocation in the field according to the specifications described inthe contract. Record the plot number, bearing and distance onthe plot card.
Trees which fall on the plot boundary are considered borderlinetrees.
Density Range Plot Plotfor 7 to 10 trees Radius Multiplier
3500 - 5000tr/ha 2.52m 5001400 - 2000 3.99 200700 - 1000 5.64 100350 - 500 7.98 50140 - 200 11.28 20
5Juvenile Spacing Quality Inspection March 30, 2001
Correlation between Pre StandTending Surveys, SMPs andJuvenile Spacing Treatments
Pre stand tending surveys should be done using the samesurvey parameters as the intended juvenile spacing treatment.Otherwise, the post spacing objectives prescribed in the SMPmay not be possible to achieve.
The SMP must prescribe a wide variation in the inter-treedistance between crop trees in stands with high variability indensity. This is key in allowing the Contractor to choose theoptimum crop tree. Without this flexibility, the optimum croptrees may be sacrificed because of a specified inter-treedistance. If Contractors do not choose the optimum croptree(s), the “chainsaw effect” will likely occur. Chainsaw effectis described as a reduction in the top height of a stand resultingfrom improper crop tree selection. This lowers the timberproduction capacity and decreases the average diameter of thestand. The loss of optimum crop trees also reduces theexpressed site index and decreases the potential volume at thenext rotation.
Conventions Used in thisDocument
The data below is for the sample plots within this documentonly and do not represent provincial default standards.
The plots shown in this document are not drawn to scale, andare for demonstration purposes only. All examples are basedon:
• a plot radius of 3.99 metres, 1/200 of a hectare;• a target number of 1800 crop trees per hectare, or 9 crop
trees within a plot;• a minimum number of 1600 crop trees per hectare, or 8
crop trees within a plot;• a maximum number of 2000 crop trees per hectare, or
10 crop trees within a plot;• an inter-tree distance of 2.5 metres;• a minimum inter-tree distance of 1.0 metre;• no conifers less than 1.0 metre in height shall be cut;• no conifers greater than 10.0 cm in diameter, measured
at breast height shall be cut (leave tree);• broadleaf species, greater than 1.5 metres in distance,
measured from the stem of the conifer to the stem of thebroadleaf tree, are not to be cut.
Throughout this document, we have referenced allprescriptions as ‘Stand Management Prescriptions’ (SMP’s).Juvenile spacing is normally carried out under a SMP. Theseinspection procedures are recommended for juvenile spacingcarried out on Crown land in British Columbia.
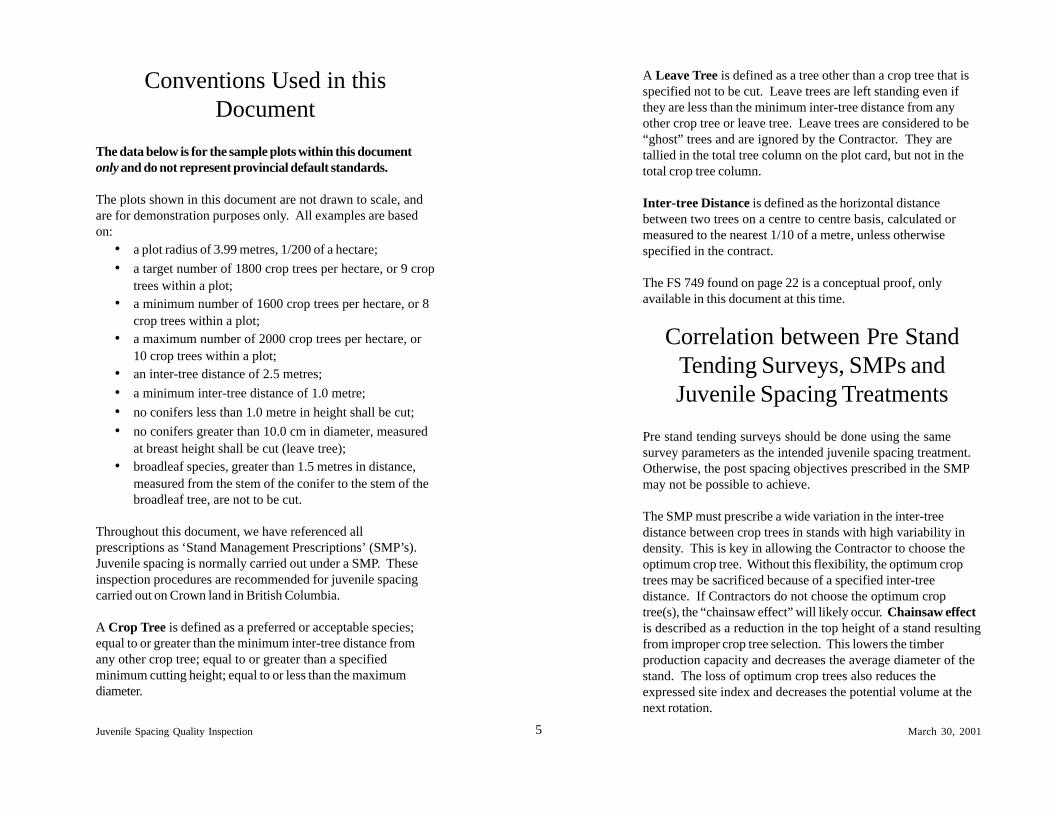
A Crop Tree is defined as a preferred or acceptable species;equal to or greater than the minimum inter-tree distance fromany other crop tree; equal to or greater than a specifiedminimum cutting height; equal to or less than the maximumdiameter.
A Leave Tree is defined as a tree other than a crop tree that isspecified not to be cut. Leave trees are left standing even ifthey are less than the minimum inter-tree distance from anyother crop tree or leave tree. Leave trees are considered to be“ghost” trees and are ignored by the Contractor. They aretallied in the total tree column on the plot card, but not in thetotal crop tree column.
Inter-tree Distance is defined as the horizontal distancebetween two trees on a centre to centre basis, calculated ormeasured to the nearest 1/10 of a metre, unless otherwisespecified in the contract.
The FS 749 found on page 22 is a conceptual proof, onlyavailable in this document at this time.
6Juvenile Spacing Quality Inspection March 30, 2001
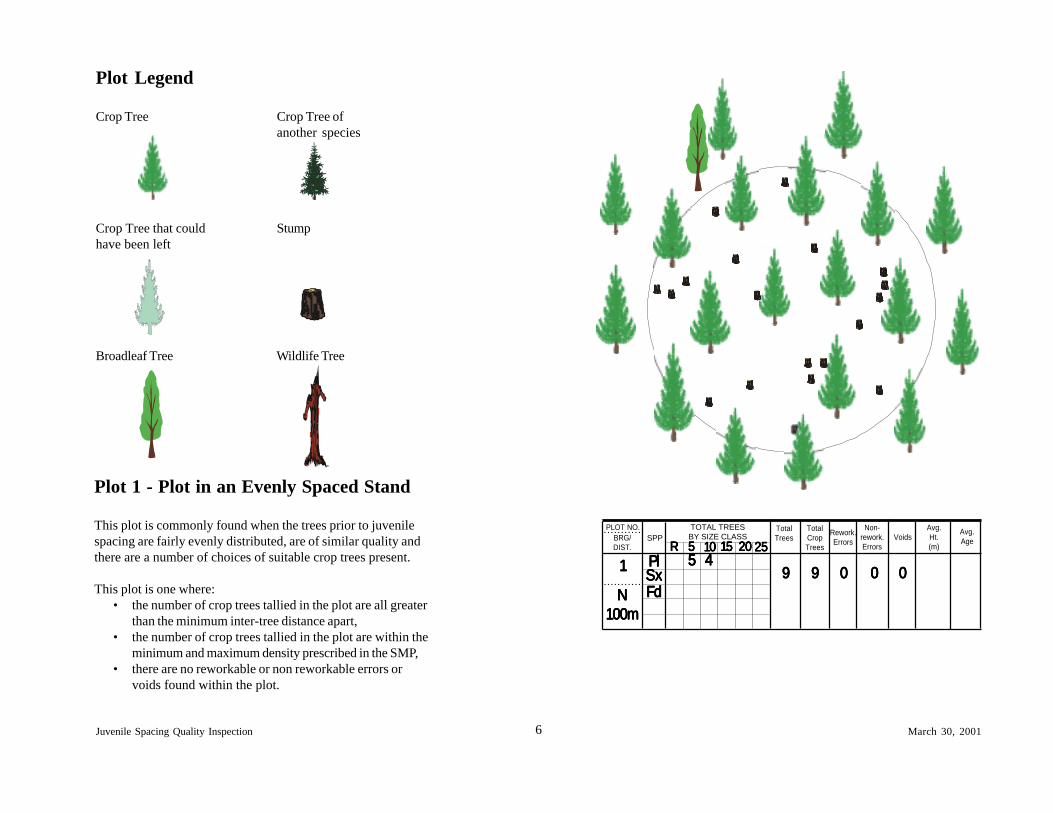
Plot 1 - Plot in an Evenly Spaced Stand
This plot is commonly found when the trees prior to juvenilespacing are fairly evenly distributed, are of similar quality andthere are a number of choices of suitable crop trees present.
This plot is one where:• the number of crop trees tallied in the plot are all greater
than the minimum inter-tree distance apart,• the number of crop trees tallied in the plot are within the
minimum and maximum density prescribed in the SMP,• there are no reworkable or non reworkable errors or
voids found within the plot.
Plot Legend
Crop Tree Crop Tree ofanother species
Crop Tree that could Stumphave been left
Broadleaf Tree Wildlife Tree
BRG/DIST.
SPPTOTAL TREESBY SIZE CLASS
PLOT NO. TotalCropTrees
Avg.Ht.(m)
Avg.Age
TotalTrees Voids
Non-rework.Errors
Rework.Errors
. . . . . . . . . . .
. . . . . . . . . . .
PlPlPlPlPl11111
NNNNN100m100m100m100m100m
RRRRR 55555 1010101010 1515151515 2020202020 2525252525
SxSxSxSxSxFdFdFdFdFd
444445555599999 99999 000000000000000
7Juvenile Spacing Quality Inspection March 30, 2001
6
5
4
1
2
3
7
8
9
10
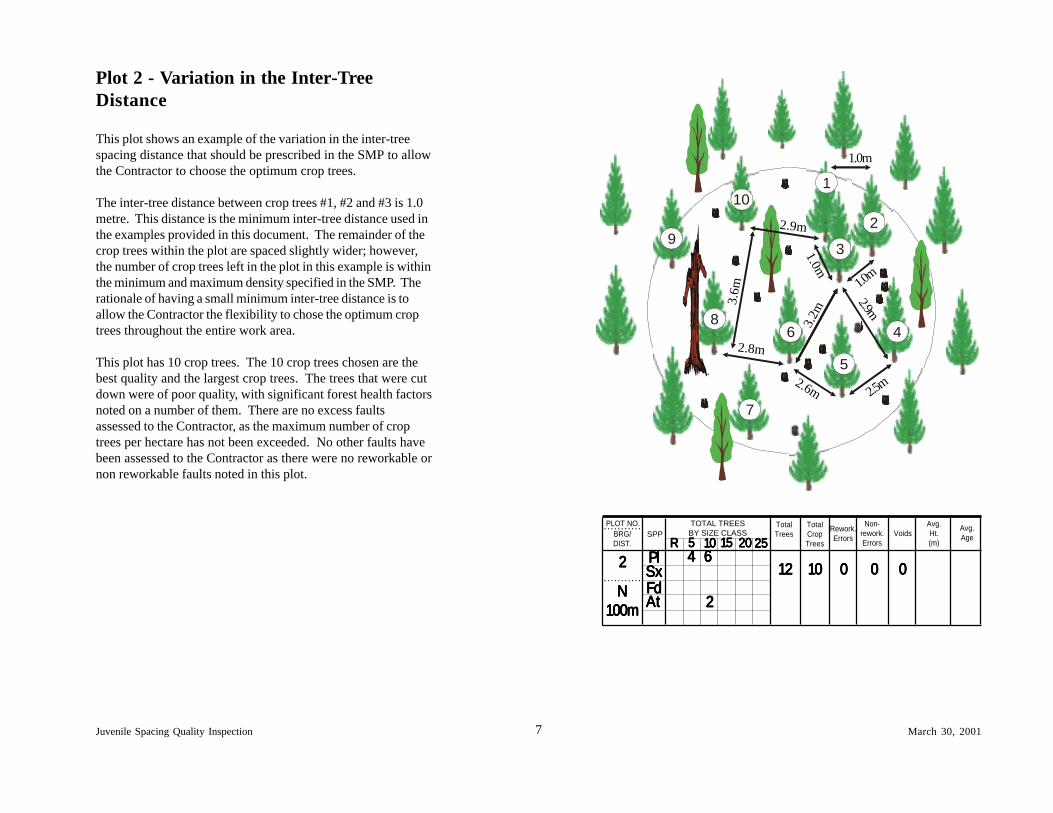
Plot 2 - Variation in the Inter-TreeDistance
This plot shows an example of the variation in the inter-treespacing distance that should be prescribed in the SMP to allowthe Contractor to choose the optimum crop trees.
The inter-tree distance between crop trees #1, #2 and #3 is 1.0metre. This distance is the minimum inter-tree distance used inthe examples provided in this document. The remainder of thecrop trees within the plot are spaced slightly wider; however,the number of crop trees left in the plot in this example is withinthe minimum and maximum density specified in the SMP. Therationale of having a small minimum inter-tree distance is toallow the Contractor the flexibility to chose the optimum croptrees throughout the entire work area.
This plot has 10 crop trees. The 10 crop trees chosen are thebest quality and the largest crop trees. The trees that were cutdown were of poor quality, with significant forest health factorsnoted on a number of them. There are no excess faultsassessed to the Contractor, as the maximum number of croptrees per hectare has not been exceeded. No other faults havebeen assessed to the Contractor as there were no reworkable ornon reworkable faults noted in this plot.
1.0m
3.2m
2.9m
2.6m 2.5m
1.0m
BRG/DIST.
SPPTOTAL TREESBY SIZE CLASS
PLOT NO. TotalCropTrees
Avg.Ht.(m)
Avg.Age
TotalTrees Voids
Non-rework.Errors
Rework.Errors
. . . . . . . . . . .
. . . . . . . . . . .
PlPlPlPlPl22222
NNNNN100m100m100m100m100m
RRRRR 55555 1010101010 1515151515 2020202020 2525252525
SxSxSxSxSxFdFdFdFdFd
66666444441212121212 1010101010 000000000000000
AtAtAtAtAt 22222
2.8m
3.6m
2.9m
1.0m
8Juvenile Spacing Quality Inspection March 30, 2001
Plot 3 - Natural Openings in the Plot
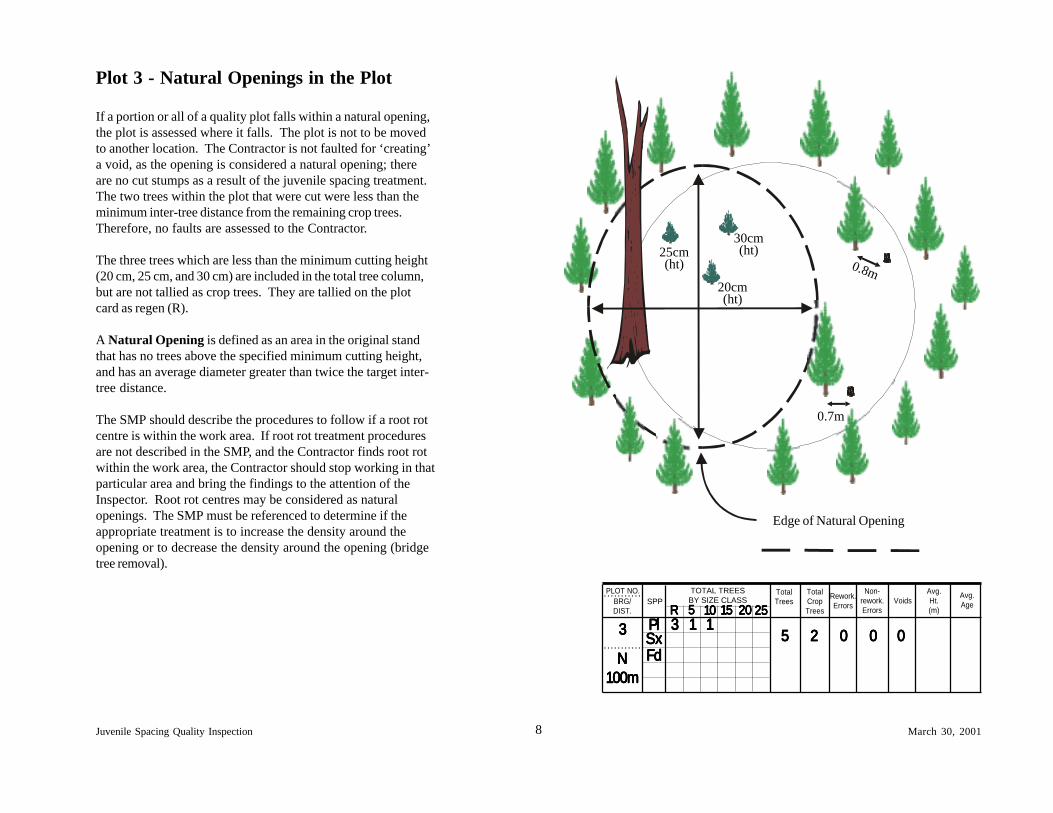
If a portion or all of a quality plot falls within a natural opening,the plot is assessed where it falls. The plot is not to be movedto another location. The Contractor is not faulted for ‘creating’a void, as the opening is considered a natural opening; thereare no cut stumps as a result of the juvenile spacing treatment.The two trees within the plot that were cut were less than theminimum inter-tree distance from the remaining crop trees.Therefore, no faults are assessed to the Contractor.
The three trees which are less than the minimum cutting height(20 cm, 25 cm, and 30 cm) are included in the total tree column,but are not tallied as crop trees. They are tallied on the plotcard as regen (R).
A Natural Opening is defined as an area in the original standthat has no trees above the specified minimum cutting height,and has an average diameter greater than twice the target inter-tree distance.
The SMP should describe the procedures to follow if a root rotcentre is within the work area. If root rot treatment proceduresare not described in the SMP, and the Contractor finds root rotwithin the work area, the Contractor should stop working in thatparticular area and bring the findings to the attention of theInspector. Root rot centres may be considered as naturalopenings. The SMP must be referenced to determine if theappropriate treatment is to increase the density around theopening or to decrease the density around the opening (bridgetree removal).
BRG/DIST.
SPPTOTAL TREESBY SIZE CLASS
PLOT NO. TotalCropTrees
Avg.Ht.(m)
Avg.Age
TotalTrees Voids
Non-rework.Errors
Rework.Errors
. . . . . . . . . . .
. . . . . . . . . . .
PlPlPlPlPl33333
NNNNN100m100m100m100m100m
RRRRR 55555 1010101010 1515151515 2020202020 2525252525
SxSxSxSxSxFdFdFdFdFd
222221111111111
55555 00000000000000033333
25cm(ht)
20cm(ht)
30cm(ht)
Edge of Natural Opening
0.8m
0.7m
9Juvenile Spacing Quality Inspection March 30, 2001
Plot 4 - Natural Opening and Reducing theInter-Tree Distance
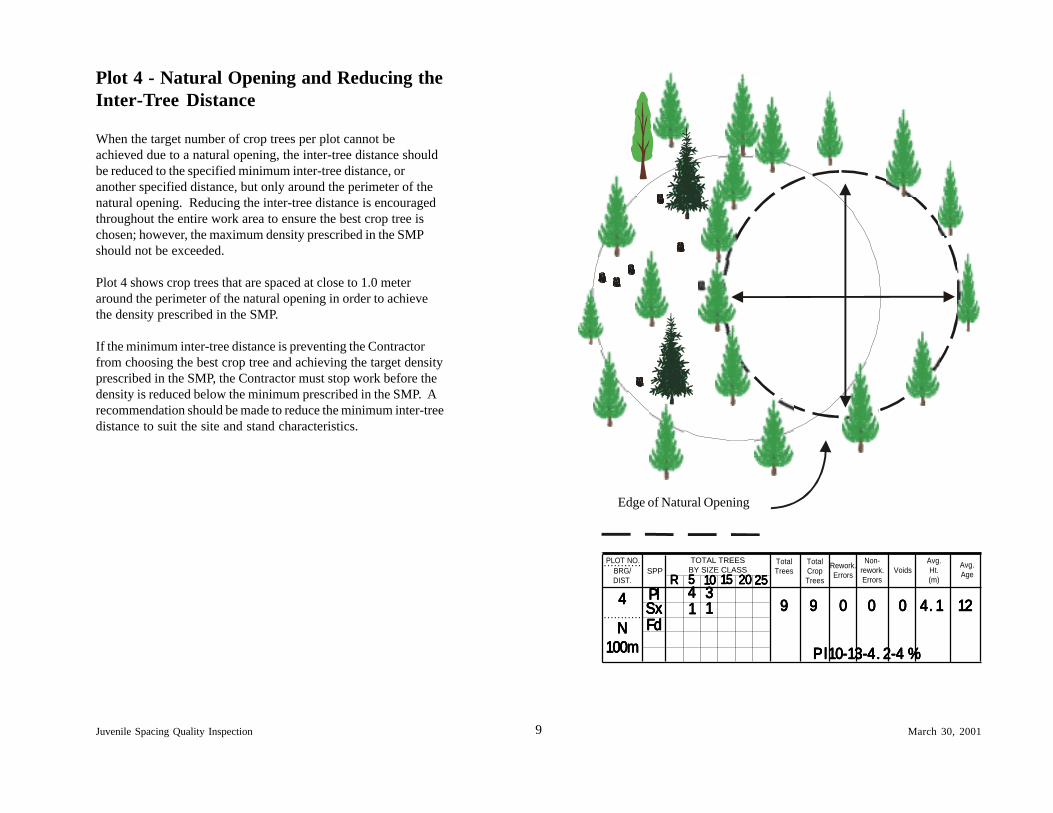
When the target number of crop trees per plot cannot beachieved due to a natural opening, the inter-tree distance shouldbe reduced to the specified minimum inter-tree distance, oranother specified distance, but only around the perimeter of thenatural opening. Reducing the inter-tree distance is encouragedthroughout the entire work area to ensure the best crop tree ischosen; however, the maximum density prescribed in the SMPshould not be exceeded.
Plot 4 shows crop trees that are spaced at close to 1.0 meteraround the perimeter of the natural opening in order to achievethe density prescribed in the SMP.
If the minimum inter-tree distance is preventing the Contractorfrom choosing the best crop tree and achieving the target densityprescribed in the SMP, the Contractor must stop work before thedensity is reduced below the minimum prescribed in the SMP. Arecommendation should be made to reduce the minimum inter-treedistance to suit the site and stand characteristics.
11111 4. 14. 14. 14. 14. 199999111113333344444
99999 1212121212000000000000000
BRG/DIST.
SPPTOTAL TREESBY SIZE CLASS
PLOT NO. TotalCropTrees
Avg.Ht.(m)
Avg.Age
TotalTrees Voids
Non-rework.Errors
Rework.Errors
. . . . . . . . . . .
. . . . . . . . . . .
PlPlPlPlPl44444
NNNNN100m100m100m100m100m
RRRRR 55555 1010101010 1515151515 2020202020 2525252525
SxSxSxSxSxFdFdFdFdFd
Edge of Natural Opening
P l10-13-4. 2-4 %P l10-13-4. 2-4 %P l10-13-4. 2-4 %P l10-13-4. 2-4 %P l10-13-4. 2-4 %
10Juvenile Spacing Quality Inspection March 30, 2001
BRG/DIST.
SPPTOTAL TREESBY SIZE CLASS
PLOT NO. TotalCropTrees
Avg.Ht.(m)
Avg.Age
TotalTrees Voids
Non-rework.Errors
Rework.Errors
. . . . . . . . . . .
. . . . . . . . . . .
PlPlPlPlPl55555
NNNNN100m100m100m100m100m
RRRRR 55555 1010101010 1515151515 2020202020 2525252525
SxSxSxSxSxFdFdFdFdFd
5555511111
R 1R 1R 1R 1R 1
6666610101010101111111111 00000 00000
Plot 5 - Excess Trees
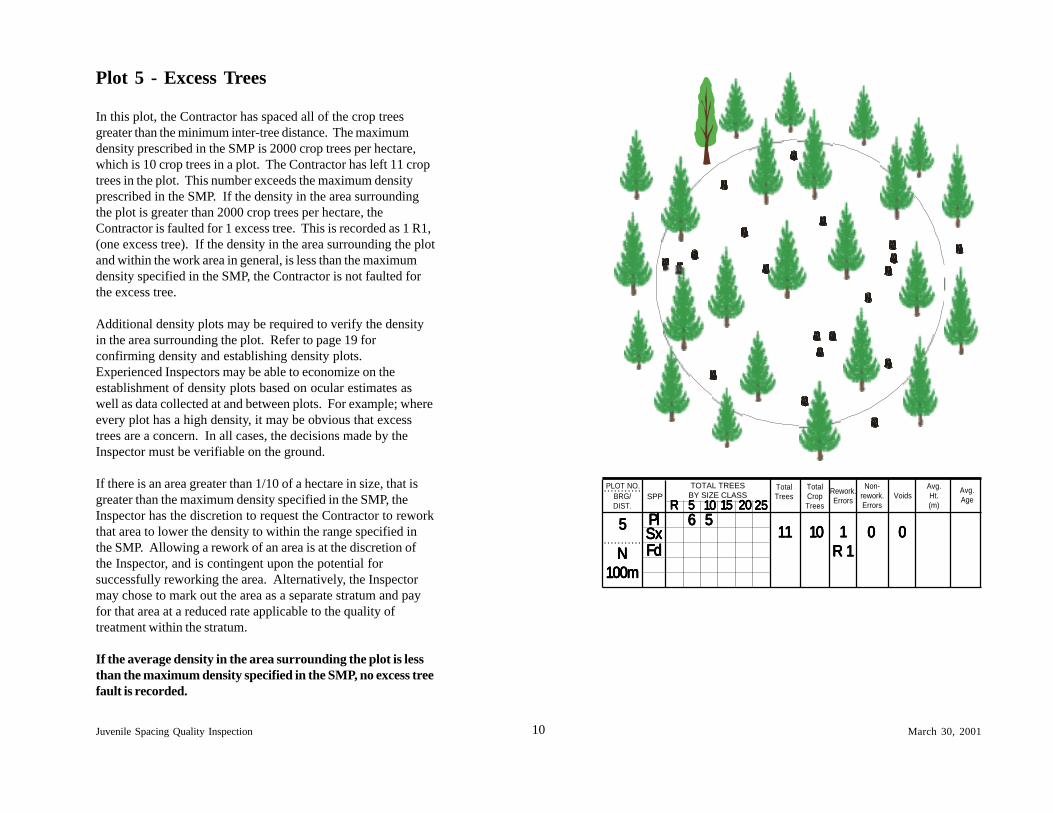
In this plot, the Contractor has spaced all of the crop treesgreater than the minimum inter-tree distance. The maximumdensity prescribed in the SMP is 2000 crop trees per hectare,which is 10 crop trees in a plot. The Contractor has left 11 croptrees in the plot. This number exceeds the maximum densityprescribed in the SMP. If the density in the area surroundingthe plot is greater than 2000 crop trees per hectare, theContractor is faulted for 1 excess tree. This is recorded as 1 R1,(one excess tree). If the density in the area surrounding the plotand within the work area in general, is less than the maximumdensity specified in the SMP, the Contractor is not faulted forthe excess tree.
Additional density plots may be required to verify the densityin the area surrounding the plot. Refer to page 19 forconfirming density and establishing density plots.Experienced Inspectors may be able to economize on theestablishment of density plots based on ocular estimates aswell as data collected at and between plots. For example; whereevery plot has a high density, it may be obvious that excesstrees are a concern. In all cases, the decisions made by theInspector must be verifiable on the ground.
If there is an area greater than 1/10 of a hectare in size, that isgreater than the maximum density specified in the SMP, theInspector has the discretion to request the Contractor to reworkthat area to lower the density to within the range specified inthe SMP. Allowing a rework of an area is at the discretion ofthe Inspector, and is contingent upon the potential forsuccessfully reworking the area. Alternatively, the Inspectormay chose to mark out the area as a separate stratum and payfor that area at a reduced rate applicable to the quality oftreatment within the stratum.
If the average density in the area surrounding the plot is lessthan the maximum density specified in the SMP, no excess treefault is recorded.
11Juvenile Spacing Quality Inspection March 30, 2001
1 2
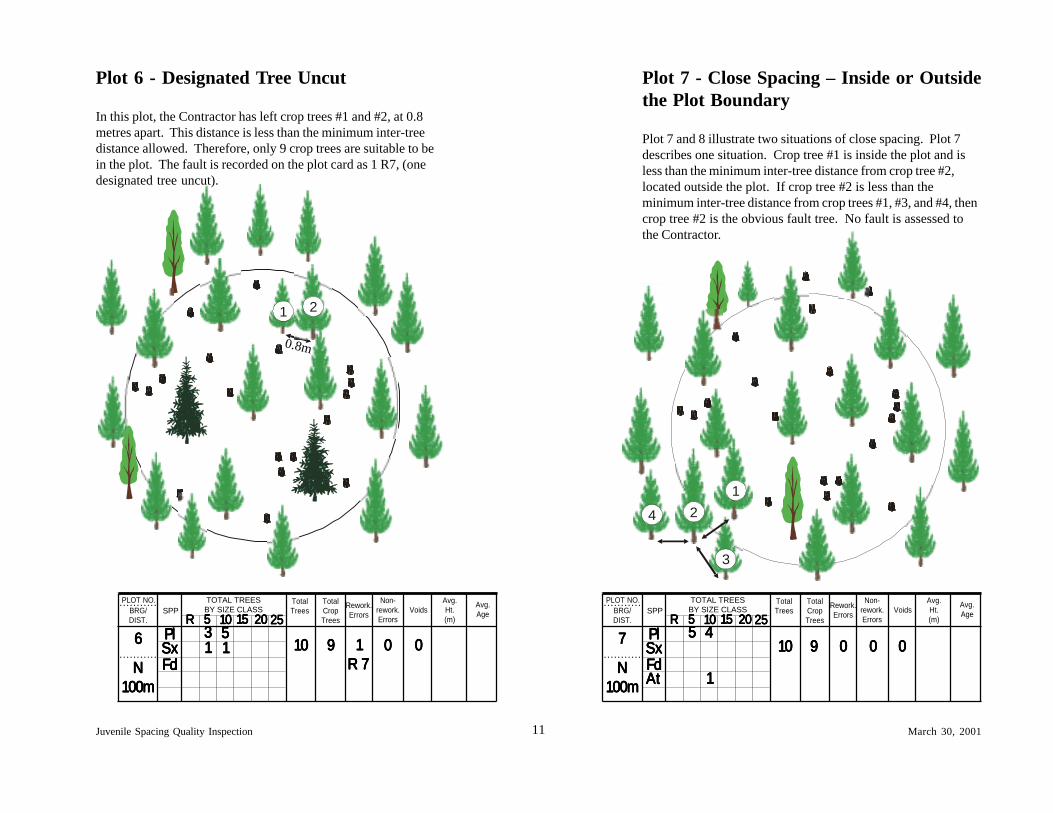
Plot 6 - Designated Tree Uncut
In this plot, the Contractor has left crop trees #1 and #2, at 0.8metres apart. This distance is less than the minimum inter-treedistance allowed. Therefore, only 9 crop trees are suitable to bein the plot. The fault is recorded on the plot card as 1 R7, (onedesignated tree uncut).
0.8m
1111133333
999991010101010 000001111155555
0000011111R 7R 7R 7R 7R 7
BRG/DIST.
SPPTOTAL TREESBY SIZE CLASS
PLOT NO. TotalCropTrees
Avg.Ht.(m)
Avg.Age
TotalTrees Voids
Non-rework.Errors
Rework.Errors
. . . . . . . . . . .
. . . . . . . . . . .
PlPlPlPlPl66666
NNNNN100m100m100m100m100m
RRRRR 55555 1010101010 1515151515 2020202020 2525252525
SxSxSxSxSxFdFdFdFdFd
77777
NNNNN100m100m100m100m100m
BRG/DIST.
SPPTOTAL TREESBY SIZE CLASS
PLOT NO. TotalCropTrees
Avg.Ht.(m)
Avg.Age
TotalTrees Voids
Non-rework.Errors
Rework.Errors
. . . . . . . . . . .
. . . . . . . . . . .
PlPlPlPlPlRRRRR 55555 1010101010 1515151515 2020202020 2525252525
SxSxSxSxSxFdFdFdFdFd
1010101010 000004444455555
99999 0000000000
AtAtAtAtAt 11111
Plot 7 - Close Spacing – Inside or Outsidethe Plot Boundary
Plot 7 and 8 illustrate two situations of close spacing. Plot 7describes one situation. Crop tree #1 is inside the plot and isless than the minimum inter-tree distance from crop tree #2,located outside the plot. If crop tree #2 is less than theminimum inter-tree distance from crop trees #1, #3, and #4, thencrop tree #2 is the obvious fault tree. No fault is assessed tothe Contractor.
1
2
3
4
12Juvenile Spacing Quality Inspection March 30, 2001
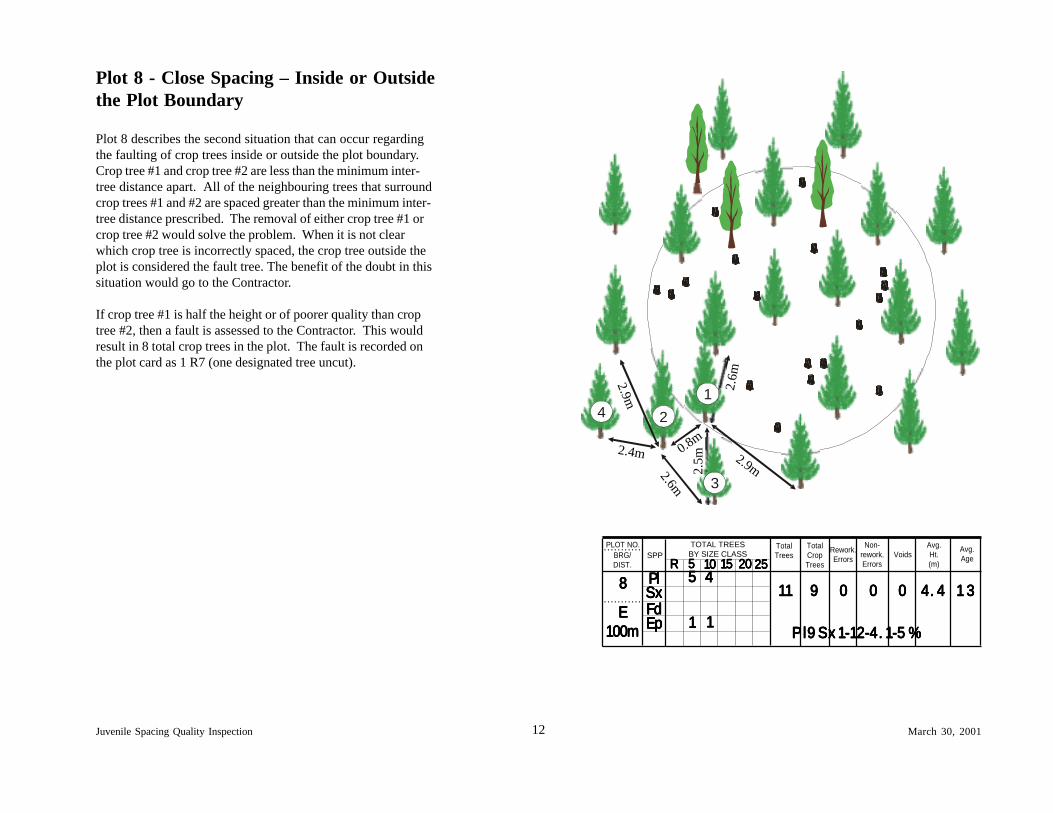
Plot 8 - Close Spacing – Inside or Outsidethe Plot Boundary
Plot 8 describes the second situation that can occur regardingthe faulting of crop trees inside or outside the plot boundary.Crop tree #1 and crop tree #2 are less than the minimum inter-tree distance apart. All of the neighbouring trees that surroundcrop trees #1 and #2 are spaced greater than the minimum inter-tree distance prescribed. The removal of either crop tree #1 orcrop tree #2 would solve the problem. When it is not clearwhich crop tree is incorrectly spaced, the crop tree outside theplot is considered the fault tree. The benefit of the doubt in thissituation would go to the Contractor.
If crop tree #1 is half the height or of poorer quality than croptree #2, then a fault is assessed to the Contractor. This wouldresult in 8 total crop trees in the plot. The fault is recorded onthe plot card as 1 R7 (one designated tree uncut).
P l9 Sx 1-12-4. 1-5 %P l9 Sx 1-12-4. 1-5 %P l9 Sx 1-12-4. 1-5 %P l9 Sx 1-12-4. 1-5 %P l9 Sx 1-12-4. 1-5 %
88888
EEEEE100m100m100m100m100m
BRG/DIST.
SPPTOTAL TREESBY SIZE CLASS
PLOT NO. TotalCropTrees
Avg.Ht.(m)
Avg.Age
TotalTrees Voids
Non-rework.Errors
Rework.Errors
. . . . . . . . . . .
. . . . . . . . . . .
PlPlPlPlPlRRRRR 55555 1010101010 1515151515 2020202020 2525252525
SxSxSxSxSxFdFdFdFdFd
4. 44. 44. 44. 44. 41111111111 000004444455555
99999 1 31 31 31 31 30000000000
EpEpEpEpEp 1111111111
1
2
3
4
0.8m2.4m 2.9m2.6m
2.6m2.9m
2.5m
13Juvenile Spacing Quality Inspection March 30, 2001
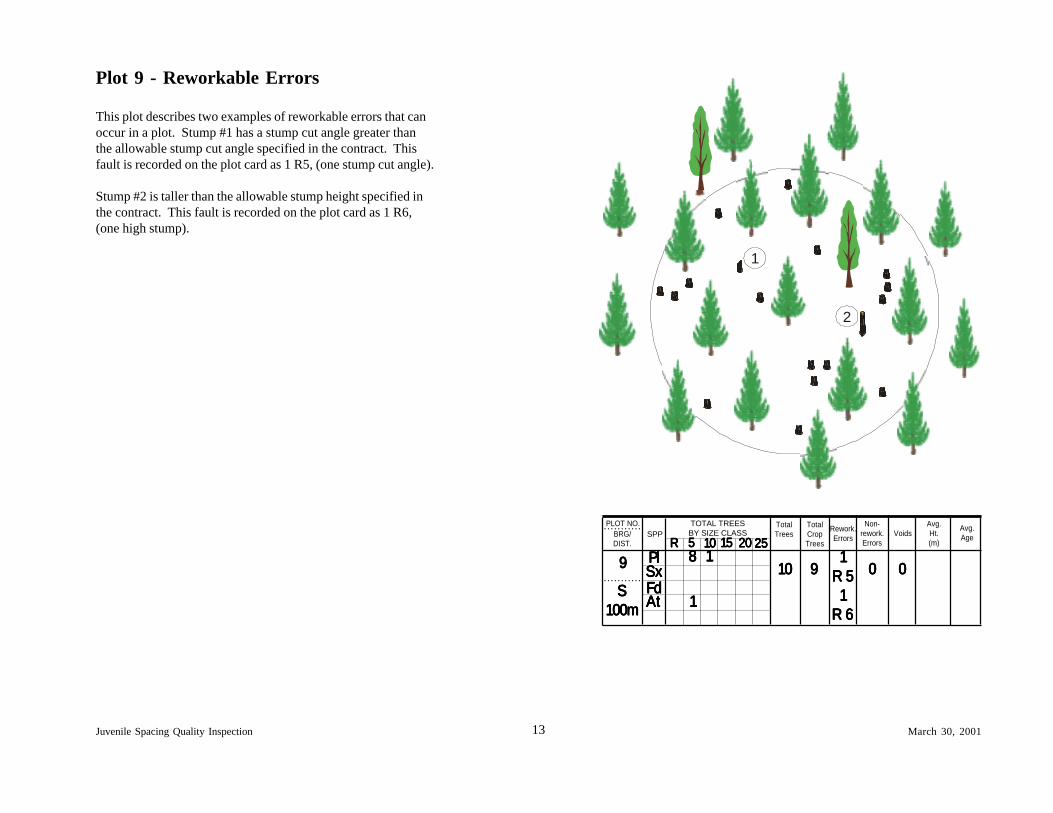
Plot 9 - Reworkable Errors
This plot describes two examples of reworkable errors that canoccur in a plot. Stump #1 has a stump cut angle greater thanthe allowable stump cut angle specified in the contract. Thisfault is recorded on the plot card as 1 R5, (one stump cut angle).
Stump #2 is taller than the allowable stump height specified inthe contract. This fault is recorded on the plot card as 1 R6,(one high stump).
1
2
99999 0000010101010101111188888
0000011111
R 5R 5R 5R 5R 511111
R 6R 6R 6R 6R 6
BRG/DIST.
SPPTOTAL TREESBY SIZE CLASS
PLOT NO. TotalCropTrees
Avg.Ht.(m)
Avg.Age
TotalTrees Voids
Non-rework.Errors
Rework.Errors
. . . . . . . . . . .
. . . . . . . . . . .
PlPlPlPlPl99999
SSSSS100m100m100m100m100m
RRRRR 55555 1010101010 1515151515 2020202020 2525252525
SxSxSxSxSxFdFdFdFdFdAtAtAtAtAt 11111
14Juvenile Spacing Quality Inspection March 30, 2001
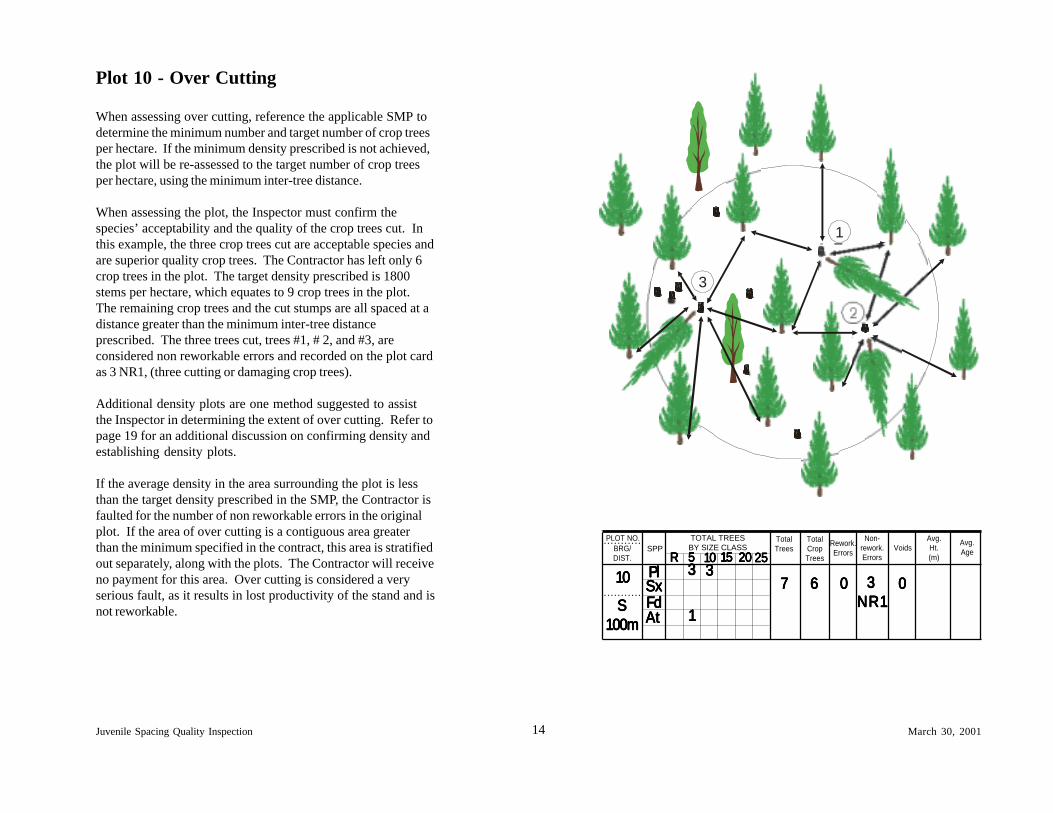
Plot 10 - Over Cutting
When assessing over cutting, reference the applicable SMP todetermine the minimum number and target number of crop treesper hectare. If the minimum density prescribed is not achieved,the plot will be re-assessed to the target number of crop treesper hectare, using the minimum inter-tree distance.
When assessing the plot, the Inspector must confirm thespecies’ acceptability and the quality of the crop trees cut. Inthis example, the three crop trees cut are acceptable species andare superior quality crop trees. The Contractor has left only 6crop trees in the plot. The target density prescribed is 1800stems per hectare, which equates to 9 crop trees in the plot.The remaining crop trees and the cut stumps are all spaced at adistance greater than the minimum inter-tree distanceprescribed. The three trees cut, trees #1, # 2, and #3, areconsidered non reworkable errors and recorded on the plot cardas 3 NR1, (three cutting or damaging crop trees).
Additional density plots are one method suggested to assistthe Inspector in determining the extent of over cutting. Refer topage 19 for an additional discussion on confirming density andestablishing density plots.
If the average density in the area surrounding the plot is lessthan the target density prescribed in the SMP, the Contractor isfaulted for the number of non reworkable errors in the originalplot. If the area of over cutting is a contiguous area greaterthan the minimum specified in the contract, this area is stratifiedout separately, along with the plots. The Contractor will receiveno payment for this area. Over cutting is considered a veryserious fault, as it results in lost productivity of the stand and isnot reworkable.
0000033333NR1NR1NR1NR1NR1
3333366666 00000
3333377777
BRG/DIST.
SPPTOTAL TREESBY SIZE CLASS
PLOT NO. TotalCropTrees
Avg.Ht.(m)
Avg.Age
TotalTrees Voids
Non-rework.Errors
Rework.Errors
. . . . . . . . . . .
. . . . . . . . . . .
PlPlPlPlPl1010101010
SSSSS100m100m100m100m100m
RRRRR 55555 1010101010 1515151515 2020202020 2525252525
SxSxSxSxSxFdFdFdFdFd
11111AtAtAtAtAt
1
2
3
15Juvenile Spacing Quality Inspection March 30, 2001
1
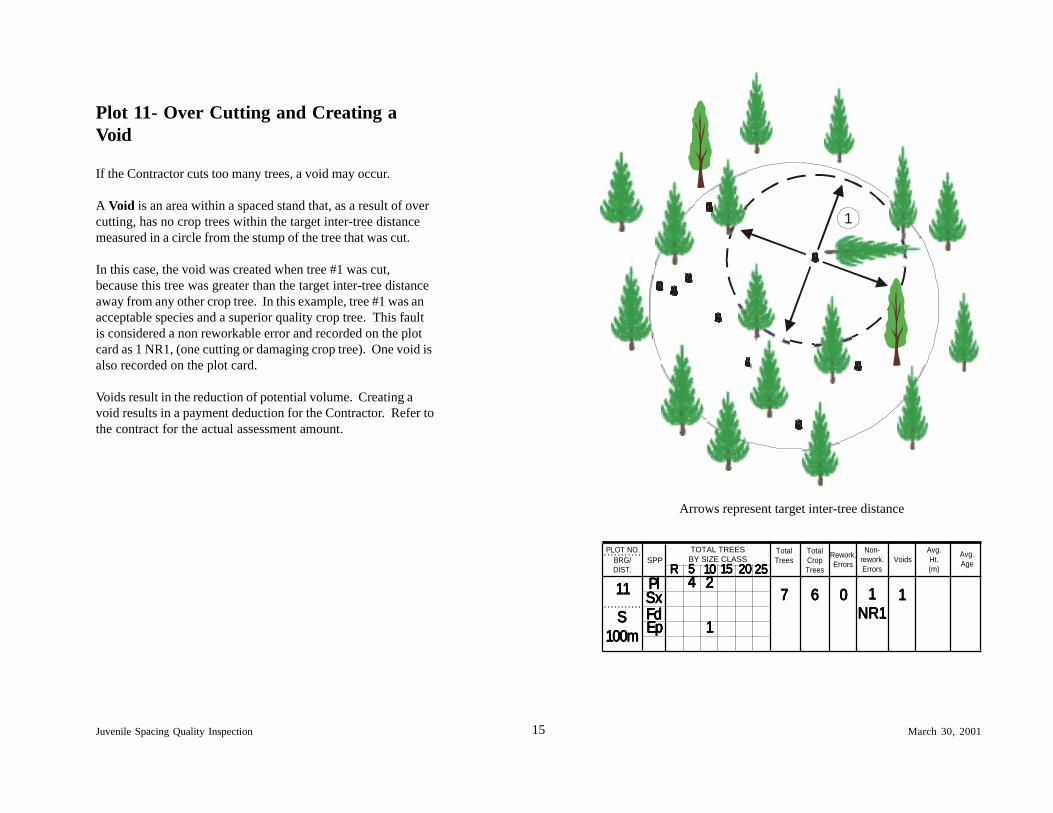
Plot 11- Over Cutting and Creating aVoid
If the Contractor cuts too many trees, a void may occur.
A Void is an area within a spaced stand that, as a result of overcutting, has no crop trees within the target inter-tree distancemeasured in a circle from the stump of the tree that was cut.
In this case, the void was created when tree #1 was cut,because this tree was greater than the target inter-tree distanceaway from any other crop tree. In this example, tree #1 was anacceptable species and a superior quality crop tree. This faultis considered a non reworkable error and recorded on the plotcard as 1 NR1, (one cutting or damaging crop tree). One void isalso recorded on the plot card.
Voids result in the reduction of potential volume. Creating avoid results in a payment deduction for the Contractor. Refer tothe contract for the actual assessment amount.
BRG/DIST.
SPPTOTAL TREESBY SIZE CLASS
PLOT NO. TotalCropTrees
Avg.Ht.(m)
Avg.Age
TotalTrees Voids
Non-rework.Errors
Rework.Errors
. . . . . . . . . . .
. . . . . . . . . . .
PlPlPlPlPl1111111111
SSSSS100m100m100m100m100m
RRRRR 55555 1010101010 1515151515 2020202020 2525252525
SxSxSxSxSxFdFdFdFdFd
666662222244444
77777 1111111111NR1NR1NR1NR1NR1
00000
EpEpEpEpEp 11111
Arrows represent target inter-tree distance
16Juvenile Spacing Quality Inspection March 30, 2001
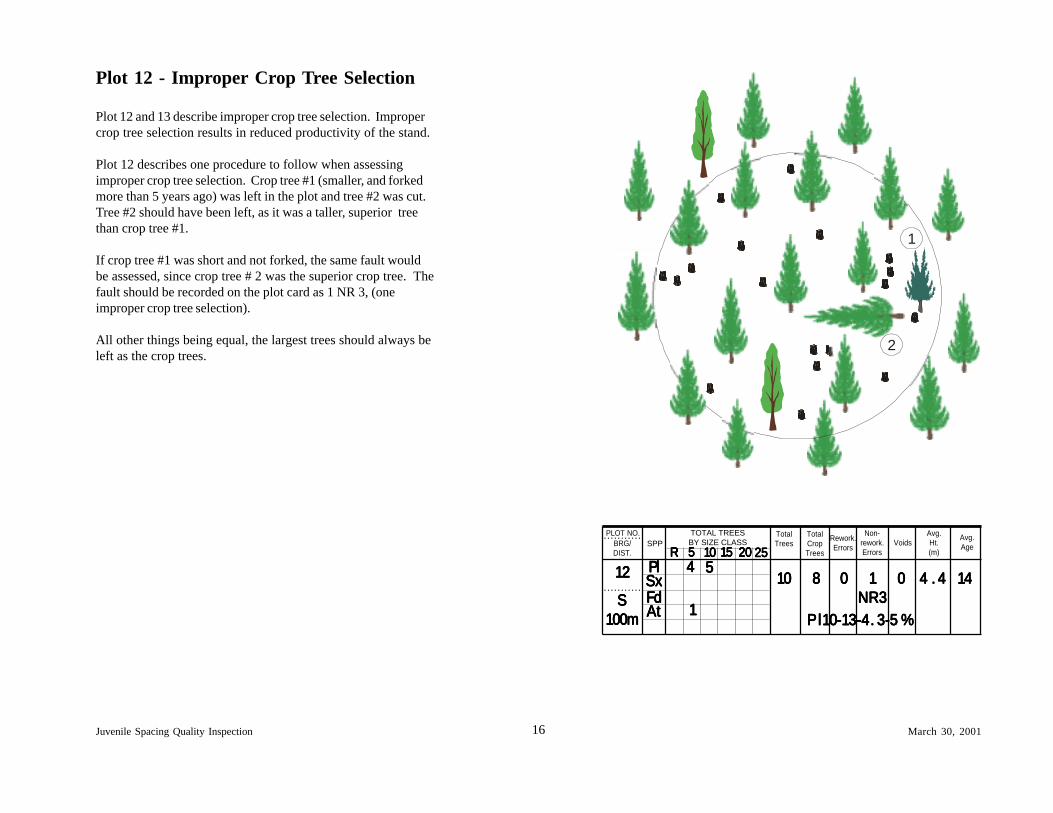
Plot 12 - Improper Crop Tree Selection
Plot 12 and 13 describe improper crop tree selection. Impropercrop tree selection results in reduced productivity of the stand.
Plot 12 describes one procedure to follow when assessingimproper crop tree selection. Crop tree #1 (smaller, and forkedmore than 5 years ago) was left in the plot and tree #2 was cut.Tree #2 should have been left, as it was a taller, superior treethan crop tree #1.
If crop tree #1 was short and not forked, the same fault wouldbe assessed, since crop tree # 2 was the superior crop tree. Thefault should be recorded on the plot card as 1 NR 3, (oneimproper crop tree selection).
All other things being equal, the largest trees should always beleft as the crop trees.
555554444400000 11111
NR3NR3NR3NR3NR3888881010101010
BRG/DIST.
SPPTOTAL TREESBY SIZE CLASS
PLOT NO. TotalCropTrees
Avg.Ht.(m)
Avg.Age
TotalTrees Voids
Non-rework.Errors
Rework.Errors
. . . . . . . . . . .
. . . . . . . . . . .
PlPlPlPlPl1212121212
SSSSS100m100m100m100m100m
RRRRR 55555 1010101010 1515151515 2020202020 2525252525
SxSxSxSxSxFdFdFdFdFd
00000 4 . 44 . 44 . 44 . 44 . 4 1414141414
P l10-13-4. 3-5 %P l10-13-4. 3-5 %P l10-13-4. 3-5 %P l10-13-4. 3-5 %P l10-13-4. 3-5 %AtAtAtAtAt 11111
2
1
17Juvenile Spacing Quality Inspection March 30, 2001
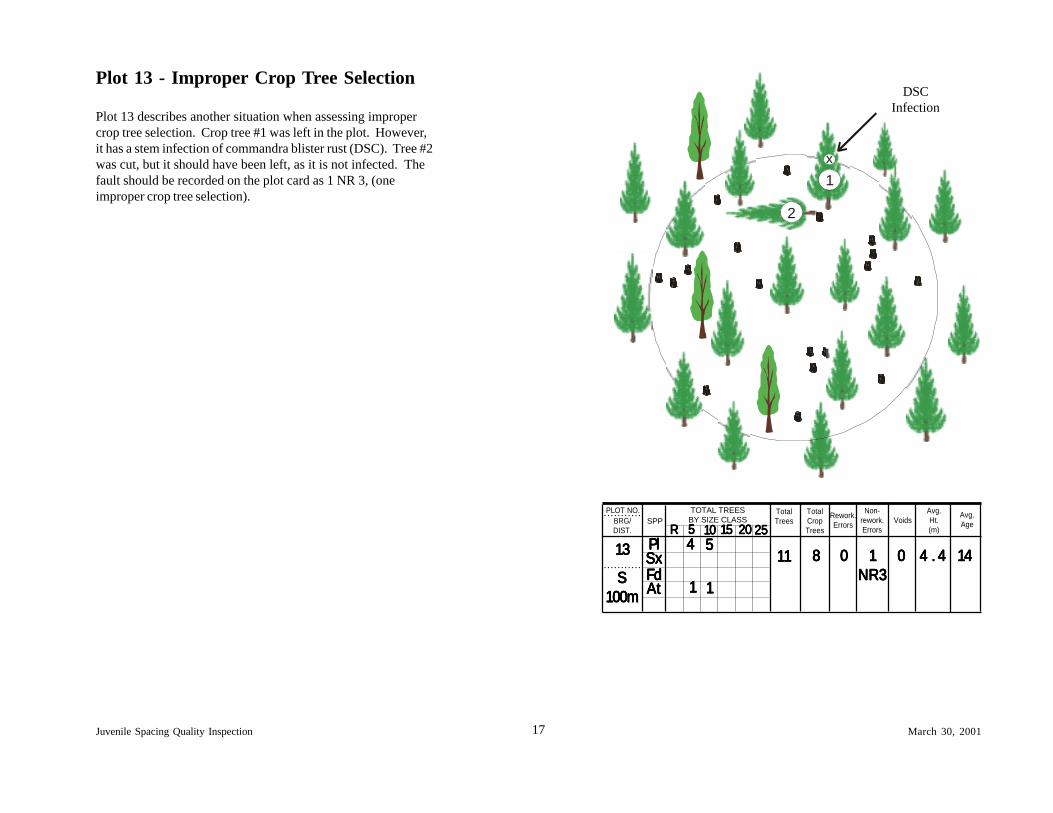
Plot 13 - Improper Crop Tree Selection
Plot 13 describes another situation when assessing impropercrop tree selection. Crop tree #1 was left in the plot. However,it has a stem infection of commandra blister rust (DSC). Tree #2was cut, but it should have been left, as it is not infected. Thefault should be recorded on the plot card as 1 NR 3, (oneimproper crop tree selection).
DSCInfection
555554444400000 11111
NR3NR3NR3NR3NR3888881111111111
BRG/DIST.
SPPTOTAL TREESBY SIZE CLASS
PLOT NO. TotalCropTrees
Avg.Ht.(m)
Avg.Age
TotalTrees Voids
Non-rework.Errors
Rework.Errors
. . . . . . . . . . .
. . . . . . . . . . .
PlPlPlPlPl1313131313
SSSSS100m100m100m100m100m
RRRRR 55555 1010101010 1515151515 2020202020 2525252525
SxSxSxSxSxFdFdFdFdFd
00000 4 . 44 . 44 . 44 . 44 . 4 1414141414
AtAtAtAtAt 11111 11111
1
2
x
18Juvenile Spacing Quality Inspection March 30, 2001
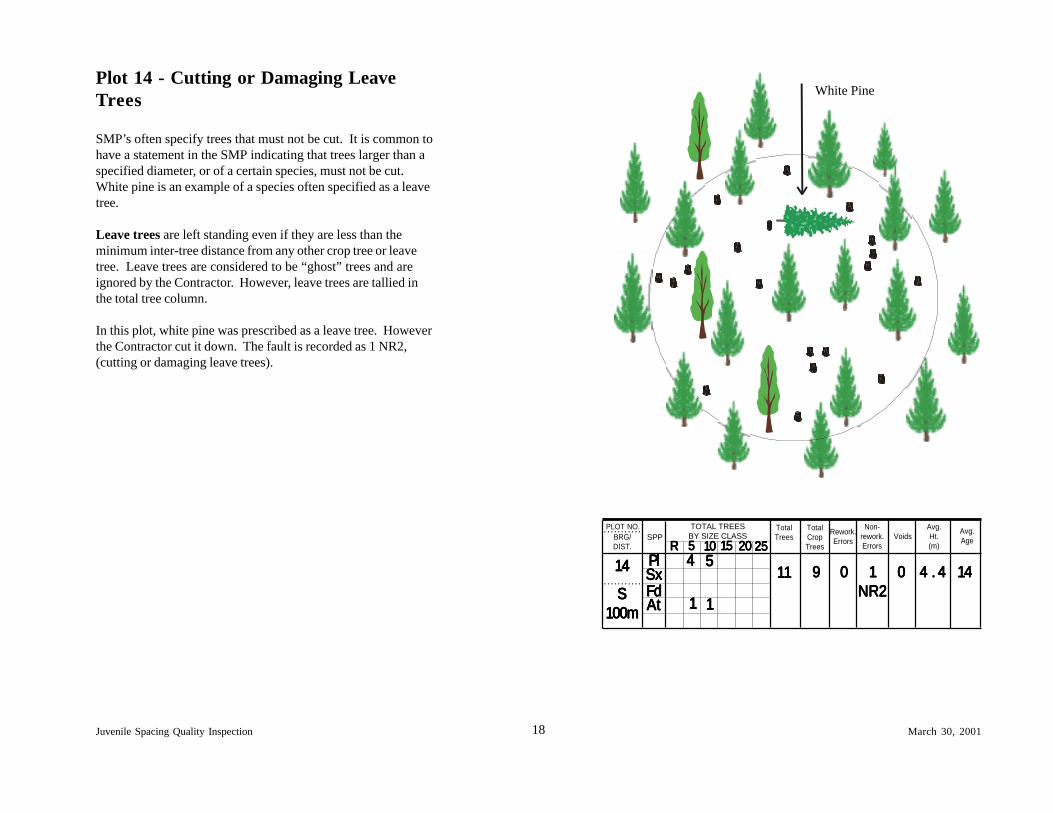
Plot 14 - Cutting or Damaging LeaveTrees
SMP’s often specify trees that must not be cut. It is common tohave a statement in the SMP indicating that trees larger than aspecified diameter, or of a certain species, must not be cut.White pine is an example of a species often specified as a leavetree.
Leave trees are left standing even if they are less than theminimum inter-tree distance from any other crop tree or leavetree. Leave trees are considered to be “ghost” trees and areignored by the Contractor. However, leave trees are tallied inthe total tree column.
In this plot, white pine was prescribed as a leave tree. Howeverthe Contractor cut it down. The fault is recorded as 1 NR2,(cutting or damaging leave trees).
555554444400000 11111
NR2NR2NR2NR2NR2999991111111111
BRG/DIST.
SPPTOTAL TREESBY SIZE CLASS
PLOT NO. TotalCropTrees
Avg.Ht.(m)
Avg.Age
TotalTrees Voids
Non-rework.Errors
Rework.Errors
. . . . . . . . . . .
. . . . . . . . . . .
PlPlPlPlPl1414141414
SSSSS100m100m100m100m100m
RRRRR 55555 1010101010 1515151515 2020202020 2525252525
SxSxSxSxSxFdFdFdFdFd
00000 4 . 44 . 44 . 44 . 44 . 4 1414141414
AtAtAtAtAt 11111 11111
White Pine
19Juvenile Spacing Quality Inspection March 30, 2001
Procedures for Confirming Density andEstablishing Density Plots
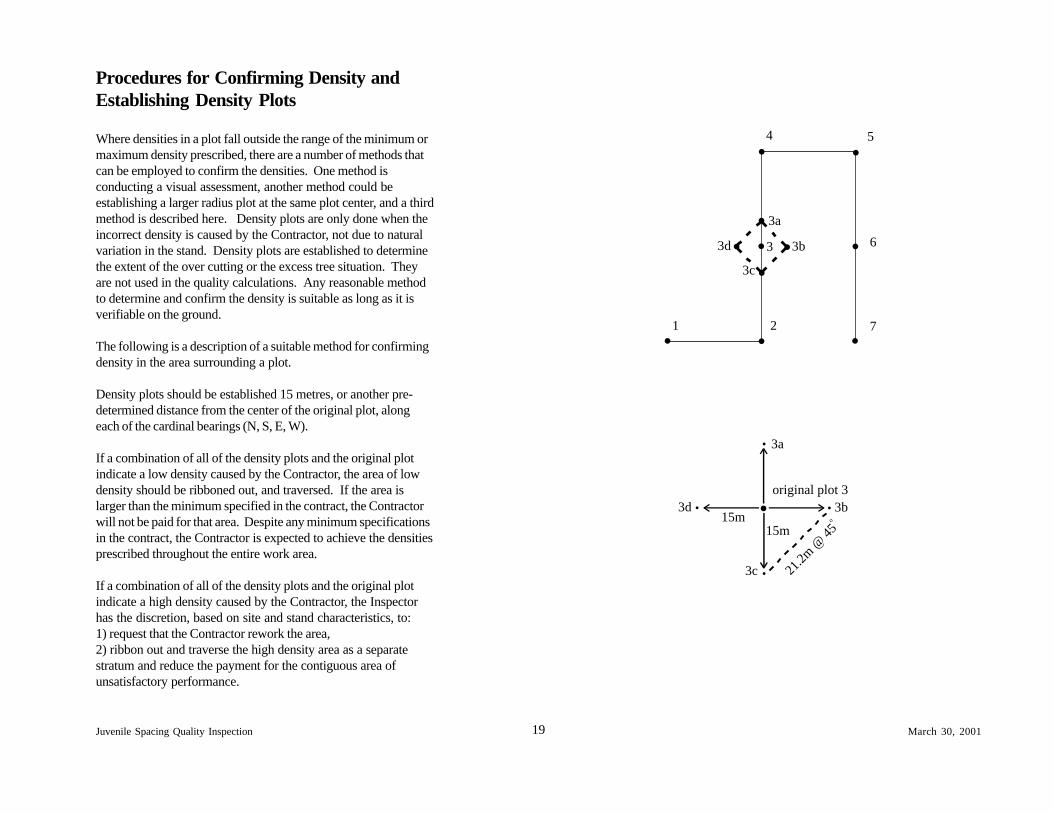
Where densities in a plot fall outside the range of the minimum ormaximum density prescribed, there are a number of methods thatcan be employed to confirm the densities. One method isconducting a visual assessment, another method could beestablishing a larger radius plot at the same plot center, and a thirdmethod is described here. Density plots are only done when theincorrect density is caused by the Contractor, not due to naturalvariation in the stand. Density plots are established to determinethe extent of the over cutting or the excess tree situation. Theyare not used in the quality calculations. Any reasonable methodto determine and confirm the density is suitable as long as it isverifiable on the ground.
The following is a description of a suitable method for confirmingdensity in the area surrounding a plot.
Density plots should be established 15 metres, or another pre-determined distance from the center of the original plot, alongeach of the cardinal bearings (N, S, E, W).
If a combination of all of the density plots and the original plotindicate a low density caused by the Contractor, the area of lowdensity should be ribboned out, and traversed. If the area islarger than the minimum specified in the contract, the Contractorwill not be paid for that area. Despite any minimum specificationsin the contract, the Contractor is expected to achieve the densitiesprescribed throughout the entire work area.
If a combination of all of the density plots and the original plotindicate a high density caused by the Contractor, the Inspectorhas the discretion, based on site and stand characteristics, to:1) request that the Contractor rework the area,2) ribbon out and traverse the high density area as a separatestratum and reduce the payment for the contiguous area ofunsatisfactory performance.
.
. .
. ..
.
.
. 3a
3d .3c .
3b.
.. .
.
original plot 3
15m15m
3a
3b
3c
3d . ..
. 21.2m
@ 45
o
.1 2
4 5
6
7
3
20Juvenile Spacing Quality Inspection March 30, 2001
Reworkable ErrorsReworkable errors are those errors that can be corrected.Reworkable errors can include any of the following faults:
Excess TreesAdditional trees over and above the prescribed amount that areleft within a plot. Excess trees are not recorded as excessunless the excess trees are also found in the immediate adjacentarea. Refer to Plot 5 for a detailed description of excess trees.These faults are recorded on the plot card as R1, (excess tree).
Hinged TreeA tree that is still partially attached to the stump due to anincomplete cut. There must be some cambium still attached tothe stump to be considered a hinged tree. A hinged tree maycontinue to grow and to compete with crop trees. These faultsare recorded on the plot card as R2, (hinged tree).
LeanerA tree that has been cut and which is leaning on a crop tree isconsidered a “leaner”. Leaning trees can damage crop trees,reducing the crop tree’s potential growth. These faults arerecorded on the plot card as R3, (leaner).
Live BranchesTrees are to be cut below the lowest live branch. Live branchesare commonly referred to as ‘live limbs’. These live branchesmay turn up and continue to grow. These faults are recorded onthe plot card as R4, (live branches).
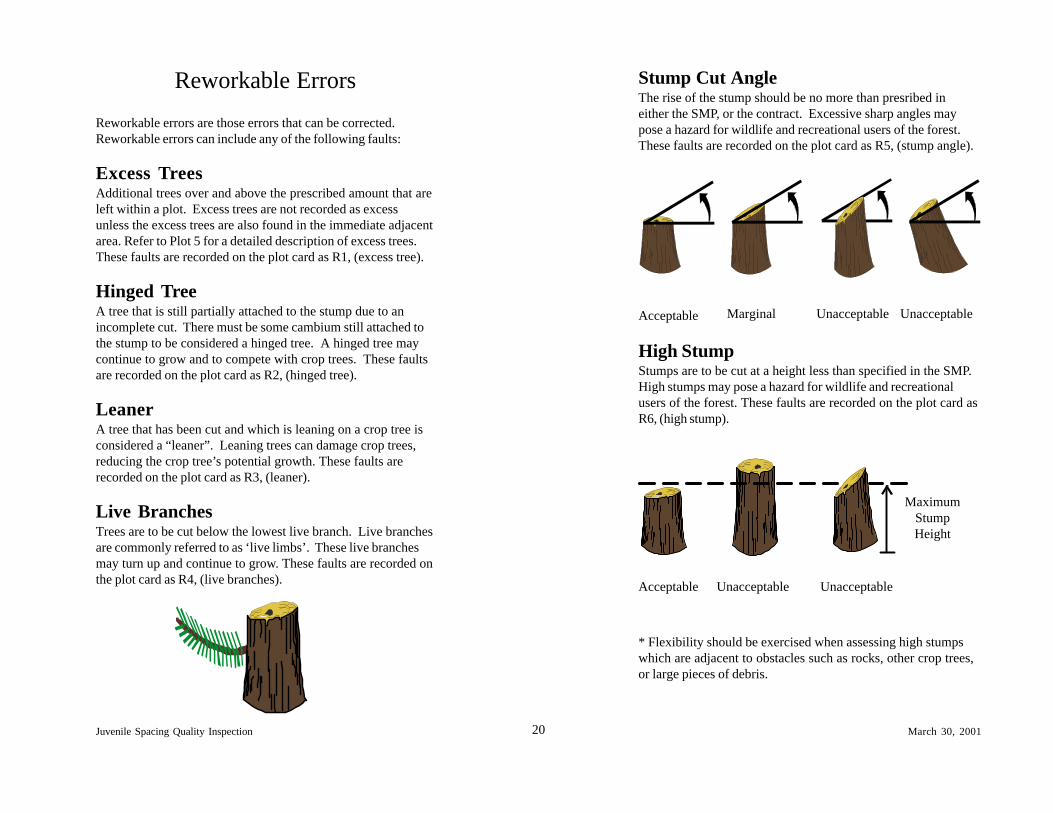
Stump Cut AngleThe rise of the stump should be no more than presribed ineither the SMP, or the contract. Excessive sharp angles maypose a hazard for wildlife and recreational users of the forest.These faults are recorded on the plot card as R5, (stump angle).
High StumpStumps are to be cut at a height less than specified in the SMP.High stumps may pose a hazard for wildlife and recreationalusers of the forest. These faults are recorded on the plot card asR6, (high stump).
* Flexibility should be exercised when assessing high stumpswhich are adjacent to obstacles such as rocks, other crop trees,or large pieces of debris.
Acceptable Unacceptable
MaximumStumpHeight
UnacceptableMarginal
Acceptable Unacceptable Unacceptable
21Juvenile Spacing Quality Inspection March 30, 2001
Designated Tree UncutAny conifer, broadleaf or diseased tree that should have beencut but was not, is considered a designated tree uncut. Forexample, a lodgepole pine with western gall rust on its stem thatshould have been cut, but was not, is considered a designatedtree uncut. These faults are recorded on the plot card as R7,(designated tree uncut).
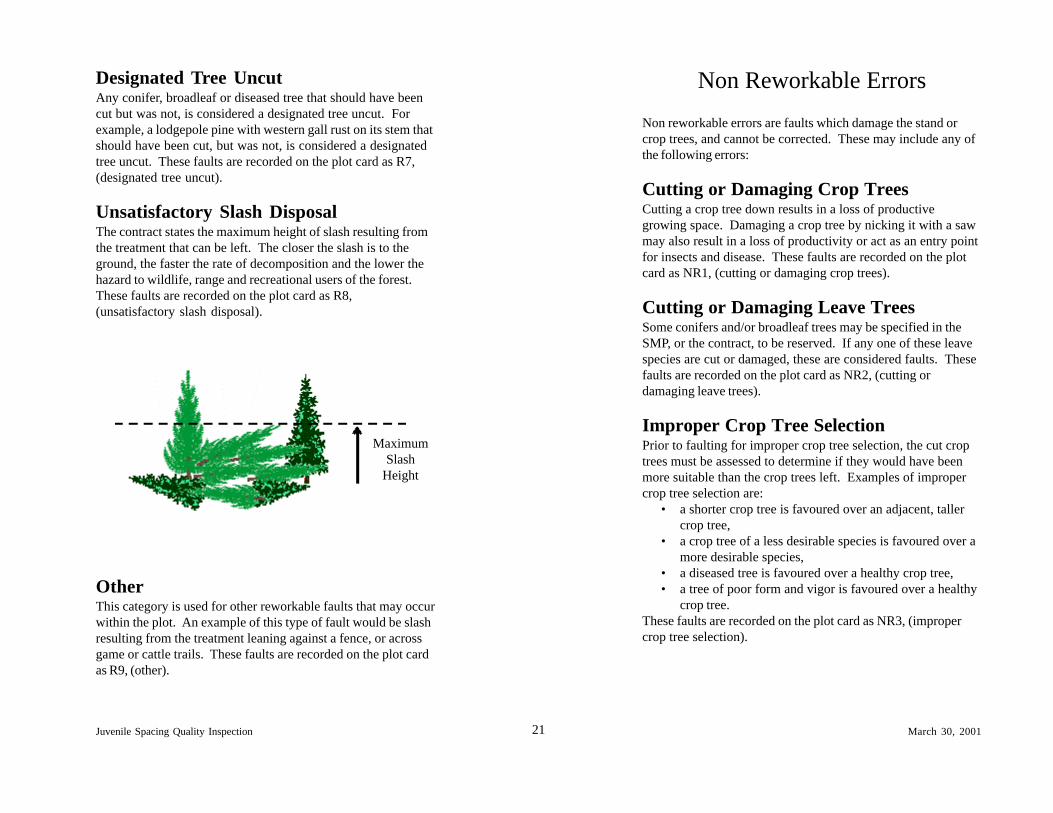
Unsatisfactory Slash DisposalThe contract states the maximum height of slash resulting fromthe treatment that can be left. The closer the slash is to theground, the faster the rate of decomposition and the lower thehazard to wildlife, range and recreational users of the forest.These faults are recorded on the plot card as R8,(unsatisfactory slash disposal).
OtherThis category is used for other reworkable faults that may occurwithin the plot. An example of this type of fault would be slashresulting from the treatment leaning against a fence, or acrossgame or cattle trails. These faults are recorded on the plot cardas R9, (other).
Non Reworkable ErrorsNon reworkable errors are faults which damage the stand orcrop trees, and cannot be corrected. These may include any ofthe following errors:
Cutting or Damaging Crop TreesCutting a crop tree down results in a loss of productivegrowing space. Damaging a crop tree by nicking it with a sawmay also result in a loss of productivity or act as an entry pointfor insects and disease. These faults are recorded on the plotcard as NR1, (cutting or damaging crop trees).
Cutting or Damaging Leave TreesSome conifers and/or broadleaf trees may be specified in theSMP, or the contract, to be reserved. If any one of these leavespecies are cut or damaged, these are considered faults. Thesefaults are recorded on the plot card as NR2, (cutting ordamaging leave trees).
Improper Crop Tree SelectionPrior to faulting for improper crop tree selection, the cut croptrees must be assessed to determine if they would have beenmore suitable than the crop trees left. Examples of impropercrop tree selection are:
• a shorter crop tree is favoured over an adjacent, tallercrop tree,
• a crop tree of a less desirable species is favoured over amore desirable species,
• a diseased tree is favoured over a healthy crop tree,• a tree of poor form and vigor is favoured over a healthy
crop tree.These faults are recorded on the plot card as NR3, (impropercrop tree selection).
MaximumSlash
Height
22Juvenile Spacing Quality Inspection March 30, 2001
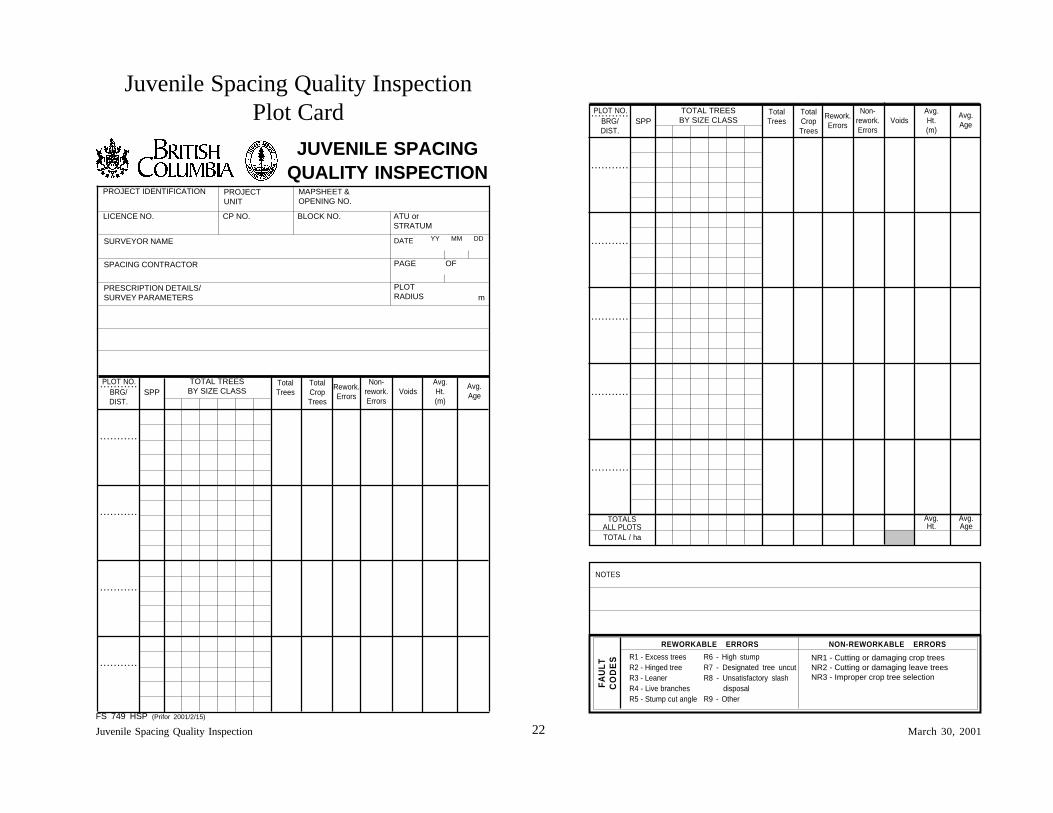
Juvenile Spacing Quality InspectionPlot Card
JUVENILE SPACINGQUALITY INSPECTION
PLOT NO.
YY MM DD
. . . . . . . . . . .
PROJECT IDENTIFICATION PROJECTUNIT
ATU orSTRATUM
MAPSHEET &OPENING NO.
PLOTRADIUS
DATESURVEYOR NAME
SPACING CONTRACTOR
BLOCK NO.CP NO.LICENCE NO.
PRESCRIPTION DETAILS/SURVEY PARAMETERS
PAGE OF
BRG/DIST.
SPPTOTAL TREESBY SIZE CLASS
TotalCropTrees
Avg.Ht.(m)
Avg.Age
TotalTrees Voids
Non-rework.Errors
Rework.Errors
FS 749 HSP (Prifor 2001/2/15)
m
. . . . . . . . . . .
. . . . . . . . . . .
. . . . . . . . . . .
. . . . . . . . . . .
TOTAL / ha
TOTALSALL PLOTS
Avg.Age
Avg.Ht.
BRG/DIST.
SPPTOTAL TREESBY SIZE CLASS
PLOT NO. TotalCropTrees
Avg.Ht.(m)
Avg.Age
TotalTrees Voids
Non-rework.Errors
Rework.Errors
. . . . . . . . . . .
. . . . . . . . . . .
. . . . . . . . . . .
. . . . . . . . . . .
. . . . . . . . . . .
. . . . . . . . . . .
FAUL
TC
OD
ES
R1 - Excess treesR2 - Hinged treeR3 - LeanerR4 - Live branchesR5 - Stump cut angle
R6 - High stumpR7 - Designated tree uncutR8 - Unsatisfactory slash disposalR9 - Other
NR1 - Cutting or damaging crop treesNR2 - Cutting or damaging leave treesNR3 - Improper crop tree selection
REWORKABLE ERRORS NON-REWORKABLE ERRORS
NOTES
23Juvenile Spacing Quality Inspection March 30, 2001
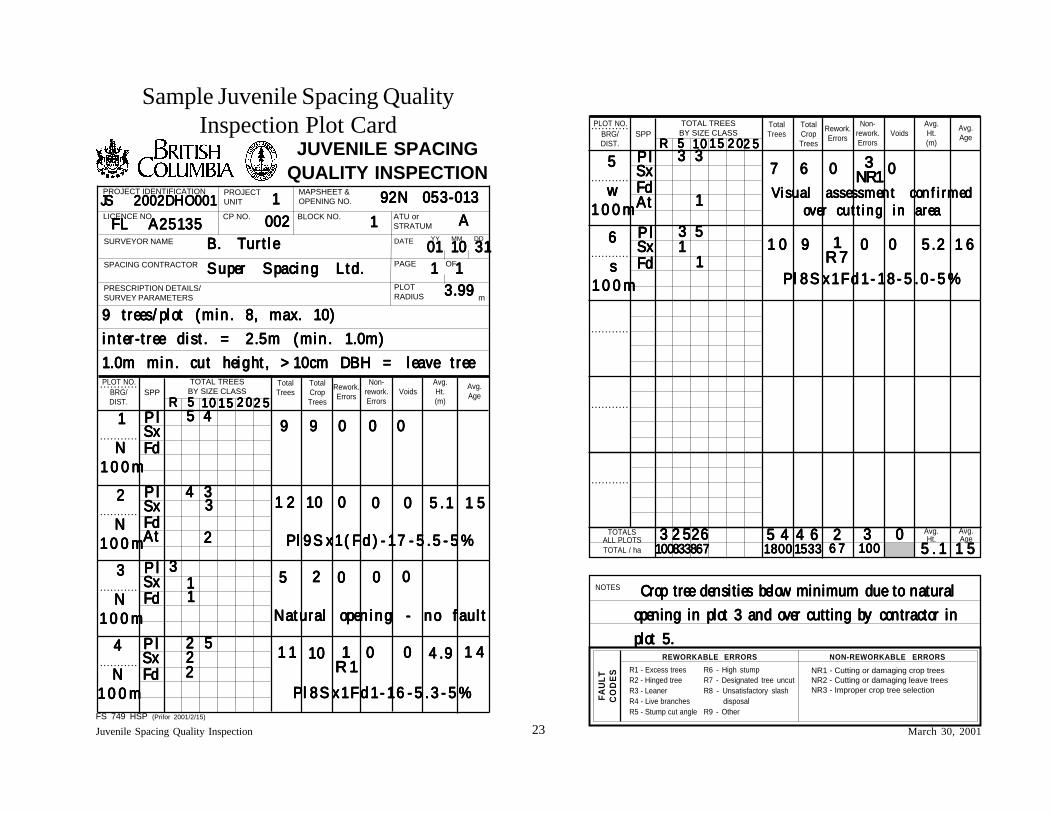
Sample Juvenile Spacing QualityInspection Plot Card
JUVENILE SPACINGQUALITY INSPECTION
PLOT NO.
YY MM DD
. . . . . . . . . . .
PROJECT IDENTIFICATION PROJECTUNIT
ATU orSTRATUM
MAPSHEET &OPENING NO.
PLOTRADIUS
DATESURVEYOR NAME
SPACING CONTRACTOR
BLOCK NO.CP NO.LICENCE NO.
PRESCRIPTION DETAILS/SURVEY PARAMETERS
PAGE OF
BRG/DIST.
SPPTOTAL TREESBY SIZE CLASS
TotalCropTrees
Avg.Ht.(m)
Avg.Age
TotalTrees Voids
Non-rework.Errors
Rework.Errors
FS 749 HSP (Prifor 2001/2/15)
m
. . . . . . . . . . .
. . . . . . . . . . .
. . . . . . . . . . .
. . . . . . . . . . .
P lP lP lP lP l33333
NNNNN1 0 0 m1 0 0 m1 0 0 m1 0 0 m1 0 0 m
SxSxSxSxSxFdFdFdFdFd
1111133333
55555 22222 000000000000000
RRRRR 55555 1 01 01 01 01 0 1 51 51 51 51 5 2 02 02 02 02 0 2 52 52 52 52 5
P lP lP lP lP l22222
NNNNN1 0 0 m1 0 0 m1 0 0 m1 0 0 m1 0 0 m
SxSxSxSxSxFdFdFdFdFd
33333444441 21 21 21 21 2 1010101010 000000000000000
AtAtAtAtAt 22222
33333 5 . 15 . 15 . 15 . 15 . 1 1 51 51 51 51 5
P l 9 S x 1 ( F d ) - 1 7 - 5 . 5 - 5 %P l 9 S x 1 ( F d ) - 1 7 - 5 . 5 - 5 %P l 9 S x 1 ( F d ) - 1 7 - 5 . 5 - 5 %P l 9 S x 1 ( F d ) - 1 7 - 5 . 5 - 5 %P l 9 S x 1 ( F d ) - 1 7 - 5 . 5 - 5 %
P l 8 S x 1 F d 1 - 1 6 - 5 . 3 - 5 %P l 8 S x 1 F d 1 - 1 6 - 5 . 3 - 5 %P l 8 S x 1 F d 1 - 1 6 - 5 . 3 - 5 %P l 8 S x 1 F d 1 - 1 6 - 5 . 3 - 5 %P l 8 S x 1 F d 1 - 1 6 - 5 . 3 - 5 %
Natural opening - no faultNatural opening - no faultNatural opening - no faultNatural opening - no faultNatural opening - no fault
P lP lP lP lP l11111
NNNNN1 0 0 m1 0 0 m1 0 0 m1 0 0 m1 0 0 m
SxSxSxSxSxFdFdFdFdFd
4444455555 99999 99999 000000000000000
P lP lP lP lP l44444
NNNNN1 0 0 m1 0 0 m1 0 0 m1 0 0 m1 0 0 m
SxSxSxSxSxFdFdFdFdFd
5555522222 1 11 11 11 11 1 1010101010 0000000000
11111
2222222222 11111
R 1R 1R 1R 1R 14.94.94.94.94.9 1 41 41 41 41 4
JS 2002DHO001JS 2002DHO001JS 2002DHO001JS 2002DHO001JS 2002DHO001
FL A25135FL A25135FL A25135FL A25135FL A25135B. TurtleB. TurtleB. TurtleB. TurtleB. TurtleSuper Spacing Ltd.Super Spacing Ltd.Super Spacing Ltd.Super Spacing Ltd.Super Spacing Ltd.
9 trees/plot (min. 8, max. 10)9 trees/plot (min. 8, max. 10)9 trees/plot (min. 8, max. 10)9 trees/plot (min. 8, max. 10)9 trees/plot (min. 8, max. 10)inter-tree dist. = 2.5m (min. 1.0m)inter-tree dist. = 2.5m (min. 1.0m)inter-tree dist. = 2.5m (min. 1.0m)inter-tree dist. = 2.5m (min. 1.0m)inter-tree dist. = 2.5m (min. 1.0m)1.0m min. cut height, >10cm DBH = leave tree1.0m min. cut height, >10cm DBH = leave tree1.0m min. cut height, >10cm DBH = leave tree1.0m min. cut height, >10cm DBH = leave tree1.0m min. cut height, >10cm DBH = leave tree
002 002 002 002 002 1 1 1 1 1
1 1 1 1 1 92N 053-013 92N 053-013 92N 053-013 92N 053-013 92N 053-013
A A A A A
3.99 3.99 3.99 3.99 3.99 1 1 1 1 1 1 1 1 1 1
01 10 31 01 10 31 01 10 31 01 10 31 01 10 31
TOTAL / ha
TOTALSALL PLOTS
Avg.Age
Avg.Ht.
BRG/DIST.
SPPTOTAL TREESBY SIZE CLASS
PLOT NO. TotalCropTrees
Avg.Ht.(m)
Avg.Age
TotalTrees Voids
Non-rework.Errors
Rework.Errors
. . . . . . . . . . .
. . . . . . . . . . .
. . . . . . . . . . .
. . . . . . . . . . .
. . . . . . . . . . .
. . . . . . . . . . .
FAUL
TC
OD
ES
R1 - Excess treesR2 - Hinged treeR3 - LeanerR4 - Live branchesR5 - Stump cut angle
R6 - High stumpR7 - Designated tree uncutR8 - Unsatisfactory slash disposalR9 - Other
NR1 - Cutting or damaging crop treesNR2 - Cutting or damaging leave treesNR3 - Improper crop tree selection
REWORKABLE ERRORS NON-REWORKABLE ERRORS
NOTES
RRRRR 55555 1 01 01 01 01 0 1 51 51 51 51 5 2 02 02 02 02 02 52 52 52 52 5
P l 8 S x 1 F d 1 - 1 8 - 5 . 0 - 5 %P l 8 S x 1 F d 1 - 1 8 - 5 . 0 - 5 %P l 8 S x 1 F d 1 - 1 8 - 5 . 0 - 5 %P l 8 S x 1 F d 1 - 1 8 - 5 . 0 - 5 %P l 8 S x 1 F d 1 - 1 8 - 5 . 0 - 5 %
Visual assessment confirmedVisual assessment confirmedVisual assessment confirmedVisual assessment confirmedVisual assessment confirmedover cutting in areaover cutting in areaover cutting in areaover cutting in areaover cutting in area
P lP lP lP lP l55555
wwwww1 0 0 m1 0 0 m1 0 0 m1 0 0 m1 0 0 m
SxSxSxSxSxFdFdFdFdFd
333333333377777 66666 0000000000
P lP lP lP lP l66666
sssss1 0 0 m1 0 0 m1 0 0 m1 0 0 m1 0 0 m
SxSxSxSxSxFdFdFdFdFd
55555333331 01 01 01 01 0 99999 0000000000
AtAtAtAtAt 11111
5.25 .25 .25 .25 .2 1 61 61 61 61 611111R7R7R7R7R7
33333NR1NR1NR1NR1NR1
1111111111
33333 2 52 52 52 52 5262626262618001800180018001800100100100100100833833833833833867867867867867
4 64 64 64 64 65 45 45 45 45 4 0000022222 333336 76 76 76 76 7 100100100100100 5 . 15 . 15 . 15 . 15 . 1 1 51 51 51 51 5
Crop tree densities below minimum due to natural Crop tree densities below minimum due to natural Crop tree densities below minimum due to natural Crop tree densities below minimum due to natural Crop tree densities below minimum due to naturalopening in plot 3 and over cutting by contractor inopening in plot 3 and over cutting by contractor inopening in plot 3 and over cutting by contractor inopening in plot 3 and over cutting by contractor inopening in plot 3 and over cutting by contractor inplot 5.plot 5.plot 5.plot 5.plot 5.
15331533153315331533
24Juvenile Spacing Quality Inspection March 30, 2001
Payment Calculations
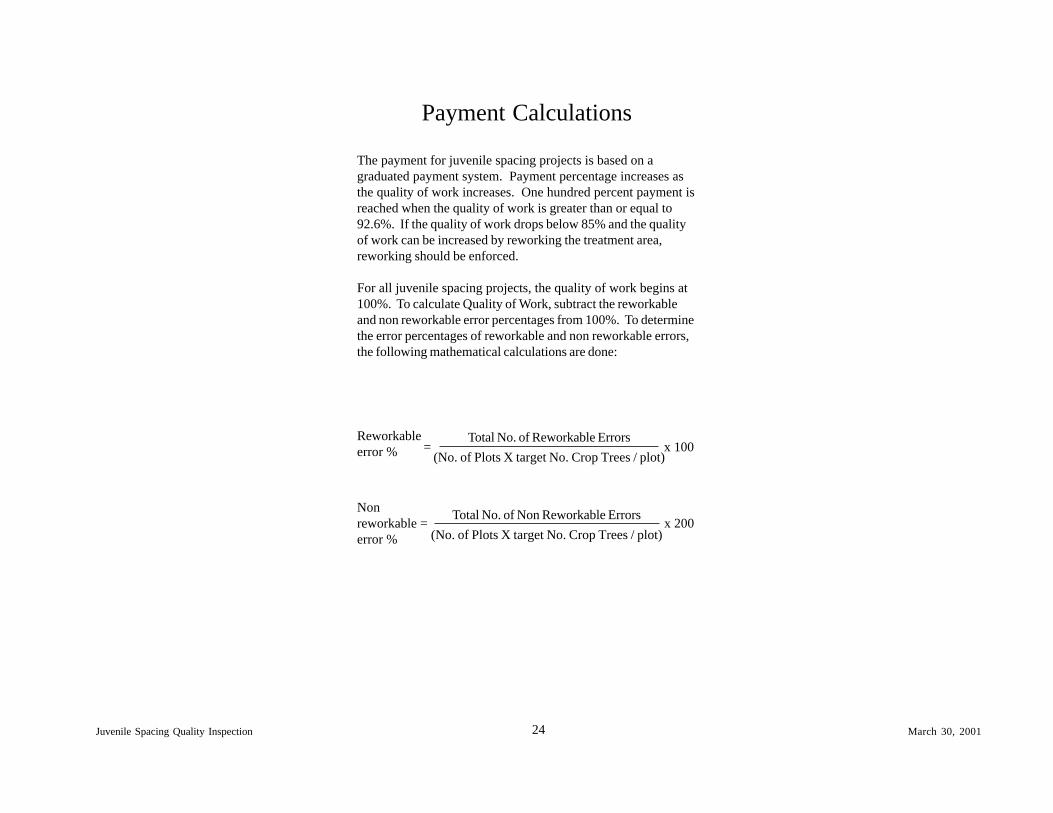
The payment for juvenile spacing projects is based on agraduated payment system. Payment percentage increases asthe quality of work increases. One hundred percent payment isreached when the quality of work is greater than or equal to92.6%. If the quality of work drops below 85% and the qualityof work can be increased by reworking the treatment area,reworking should be enforced.
For all juvenile spacing projects, the quality of work begins at100%. To calculate Quality of Work, subtract the reworkableand non reworkable error percentages from 100%. To determinethe error percentages of reworkable and non reworkable errors,the following mathematical calculations are done:
Reworkableerror % = x 100
Total No. of Reworkable Errors(No. of Plots X target No. Crop Trees / plot)
Nonreworkable = x 200error %
Total No. of Non Reworkable Errors(No. of Plots X target No. Crop Trees / plot)
25Juvenile Spacing Quality Inspection March 30, 2001
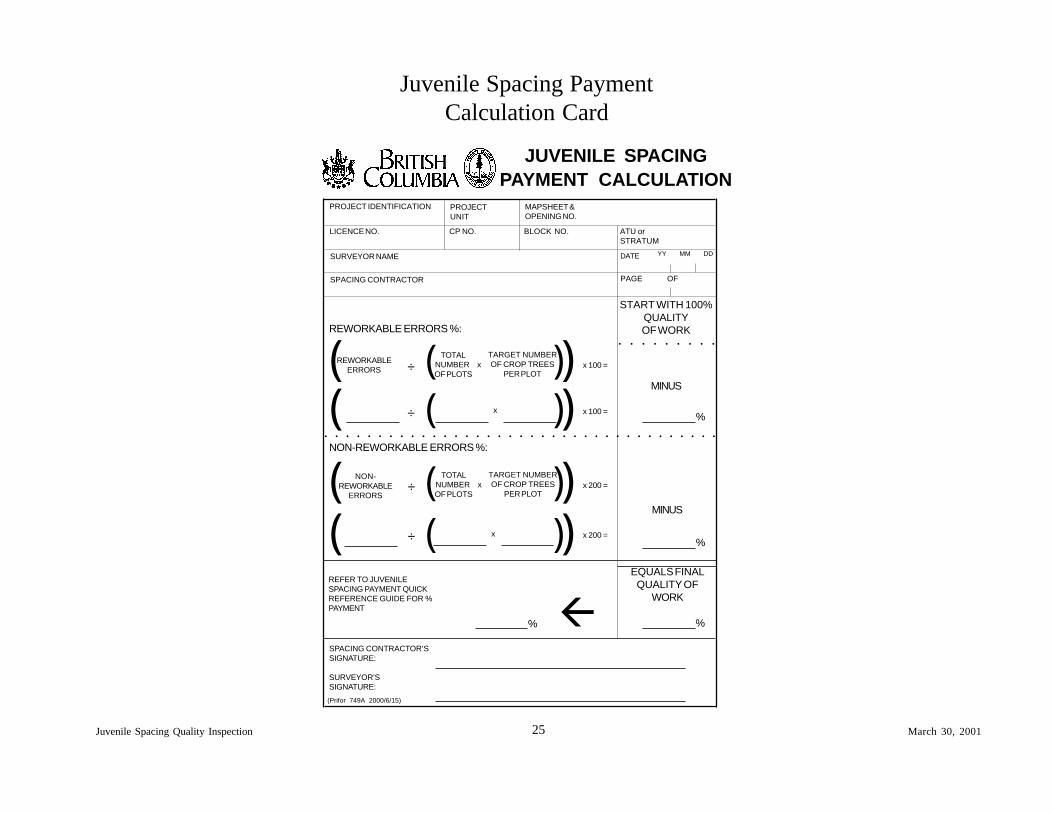
Juvenile Spacing PaymentCalculation Card
( )( )( )( )
PROJECT IDENTIFICATION PROJECTUNIT
ATU orSTRATUM
MAPSHEET &OPENING NO.
DATESURVEYOR NAME YY MM DD
JUVENILE SPACINGPAYMENT CALCULATION
SPACING CONTRACTOR
BLOCK NO.CP NO.LICENCE NO.
PAGE OF
(Prifor 749A 2000/6/15)
REWORKABLE ERRORS %:
NON-REWORKABLE ERRORS %:
SPACING CONTRACTOR’SSIGNATURE:
SURVEYOR’SSIGNATURE:
x 100 =REWORKABLEERRORS
TOTAL NUMBER x
OF PLOTS
TARGET NUMBEROF CROP TREES
PER PLOT÷ ( )x 100 =x÷ ( )x 200 =
TARGET NUMBEROF CROP TREES
PER PLOT
NON-REWORKABLE
ERRORS
TOTAL NUMBER x
OF PLOTS÷ ( )
x 200 =x÷ ( )REFER TO JUVENILESPACING PAYMENT QUICKREFERENCE GUIDE FOR %PAYMENT
○ ○ ○ ○ ○ ○ ○ ○ ○
START WITH 100%QUALITYOF WORK
○ ○ ○ ○ ○ ○ ○ ○ ○ ○ ○ ○ ○ ○ ○ ○ ○ ○ ○ ○ ○ ○ ○ ○ ○ ○ ○ ○ ○ ○ ○ ○ ○ ○ ○ ○ ○
MINUS
MINUS
EQUALS FINALQUALITY OF
WORK
%
%
%!%
26Juvenile Spacing Quality Inspection March 30, 2001
Sample Juvenile Spacing PaymentCalculation Card
( )( )( )( )
PROJECT IDENTIFICATION PROJECTUNIT
ATU orSTRATUM
MAPSHEET &OPENING NO.
DATESURVEYOR NAME YY MM DD
JUVENILE SPACINGPAYMENT CALCULATION
SPACING CONTRACTOR
BLOCK NO.CP NO.LICENCE NO.
PAGE OF
(Prifor 749A 2000/6/15)
REWORKABLE ERRORS %:
NON-REWORKABLE ERRORS %:
SPACING CONTRACTOR’SSIGNATURE:
SURVEYOR’SSIGNATURE:
x 100 =REWORKABLEERRORS
TOTAL NUMBER x
OF PLOTS
TARGET NUMBEROF CROP TREES
PER PLOT÷ ( )x 100 =x÷ ( )x 200 =
TARGET NUMBEROF CROP TREES
PER PLOT
NON-REWORKABLE
ERRORS
TOTAL NUMBER x
OF PLOTS÷ ( )
x 200 =x÷ ( )REFER TO JUVENILESPACING PAYMENT QUICKREFERENCE GUIDE FOR %PAYMENT
○ ○ ○ ○ ○ ○ ○ ○ ○
START WITH 100%QUALITYOF WORK
○ ○ ○ ○ ○ ○ ○ ○ ○ ○ ○ ○ ○ ○ ○ ○ ○ ○ ○ ○ ○ ○ ○ ○ ○ ○ ○ ○ ○ ○ ○ ○ ○ ○ ○ ○ ○
MINUS
MINUS
EQUALS FINALQUALITY OF
WORK
%
%
%!%
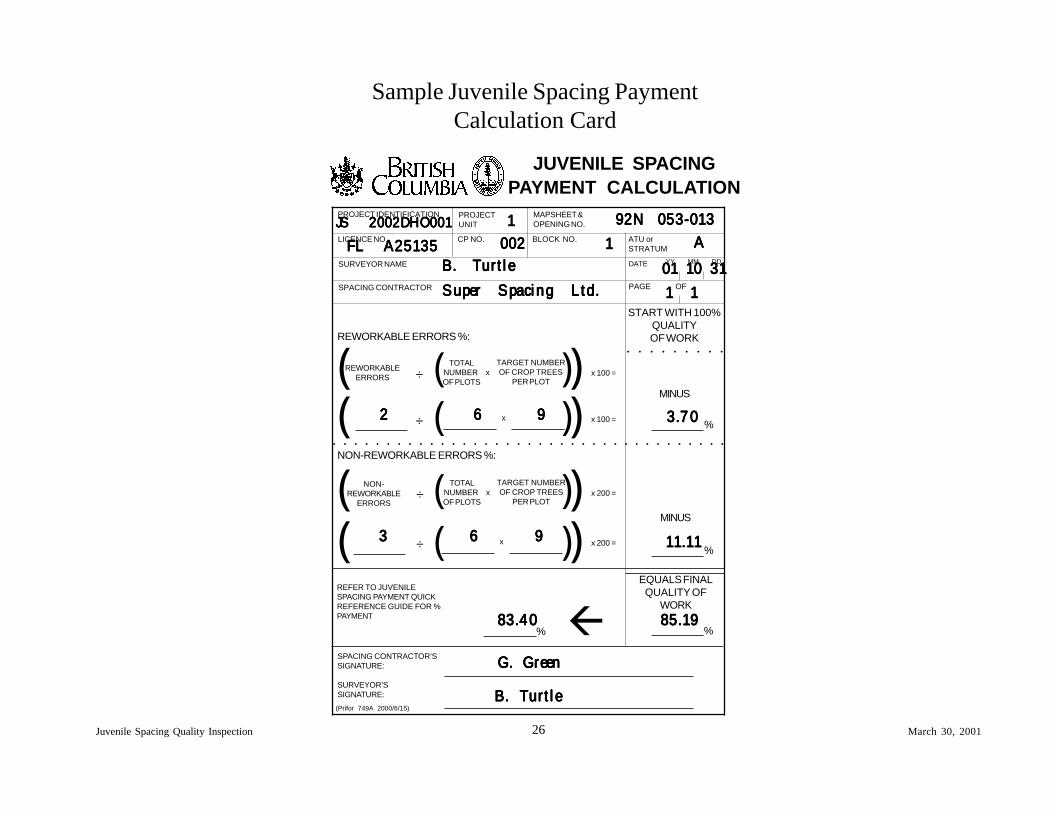
JS 2002DHO001JS 2002DHO001JS 2002DHO001JS 2002DHO001JS 2002DHO001
FL A25135FL A25135FL A25135FL A25135FL A25135B. TurtleB. TurtleB. TurtleB. TurtleB. TurtleSuper Spacing Ltd.Super Spacing Ltd.Super Spacing Ltd.Super Spacing Ltd.Super Spacing Ltd.
002 002 002 002 002 1 1 1 1 1
1 1 1 1 1 92N 053-013 92N 053-013 92N 053-013 92N 053-013 92N 053-013
A A A A A
1 1 1 1 1 1 1 1 1 1 01 10 31 01 10 31 01 10 31 01 10 31 01 10 31
2 2 2 2 2 6 6 6 6 6 9 9 9 9 9 3.70 3.70 3.70 3.70 3.70
3 3 3 3 3 6 6 6 6 6 9 9 9 9 9 11.11 11.11 11.11 11.11 11.11
83.40 83.40 83.40 83.40 83.40 85.19 85.19 85.19 85.19 85.19
B. Turtle B. Turtle B. Turtle B. Turtle B. Turtle
G. Green G. Green G. Green G. Green G. Green
27Juvenile Spacing Quality Inspection March 30, 2001
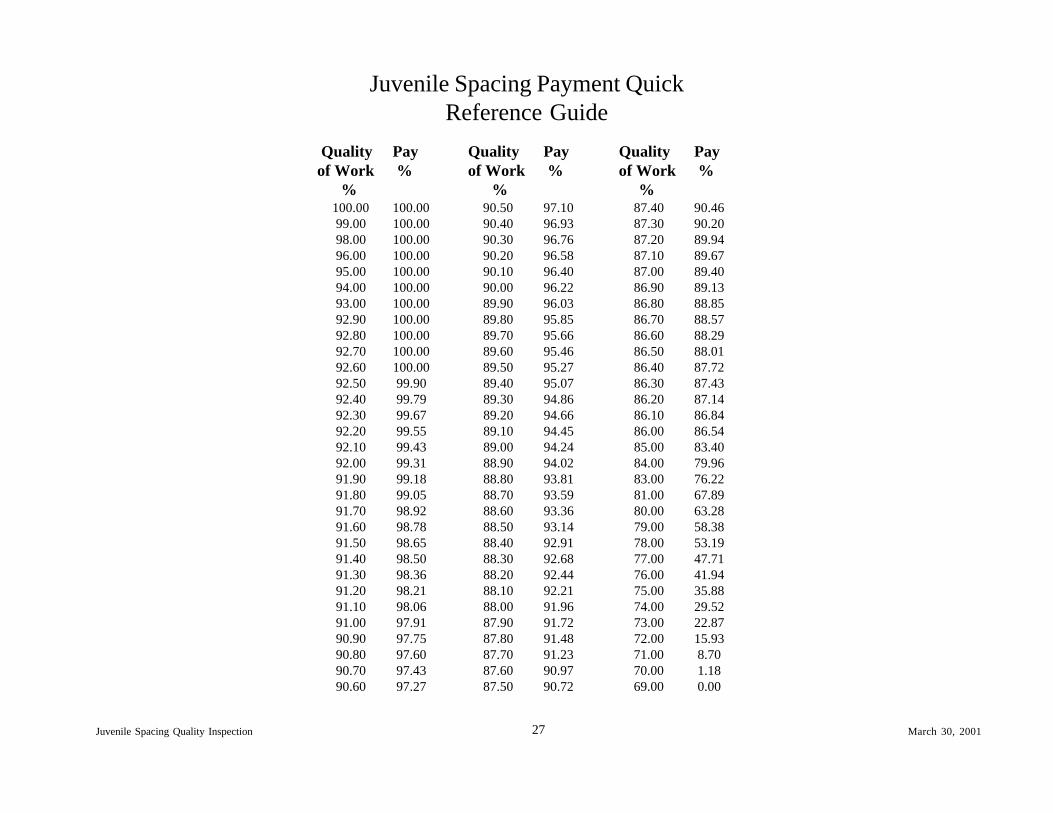
Juvenile Spacing Payment QuickReference Guide
Quality Pay Quality Pay Quality Payof Work % of Work % of Work % % % %
100.00 100.00 90.50 97.10 87.40 90.46 99.00 100.00 90.40 96.93 87.30 90.20 98.00 100.00 90.30 96.76 87.20 89.94 96.00 100.00 90.20 96.58 87.10 89.67 95.00 100.00 90.10 96.40 87.00 89.40 94.00 100.00 90.00 96.22 86.90 89.13 93.00 100.00 89.90 96.03 86.80 88.85 92.90 100.00 89.80 95.85 86.70 88.57 92.80 100.00 89.70 95.66 86.60 88.29 92.70 100.00 89.60 95.46 86.50 88.01 92.60 100.00 89.50 95.27 86.40 87.72 92.50 99.90 89.40 95.07 86.30 87.43 92.40 99.79 89.30 94.86 86.20 87.14 92.30 99.67 89.20 94.66 86.10 86.84 92.20 99.55 89.10 94.45 86.00 86.54 92.10 99.43 89.00 94.24 85.00 83.40 92.00 99.31 88.90 94.02 84.00 79.96 91.90 99.18 88.80 93.81 83.00 76.22 91.80 99.05 88.70 93.59 81.00 67.89 91.70 98.92 88.60 93.36 80.00 63.28 91.60 98.78 88.50 93.14 79.00 58.38 91.50 98.65 88.40 92.91 78.00 53.19 91.40 98.50 88.30 92.68 77.00 47.71 91.30 98.36 88.20 92.44 76.00 41.94 91.20 98.21 88.10 92.21 75.00 35.88 91.10 98.06 88.00 91.96 74.00 29.52 91.00 97.91 87.90 91.72 73.00 22.87 90.90 97.75 87.80 91.48 72.00 15.93 90.80 97.60 87.70 91.23 71.00 8.70 90.70 97.43 87.60 90.97 70.00 1.18 90.60 97.27 87.50 90.72 69.00 0.00
28Juvenile Spacing Quality Inspection March 30, 2001
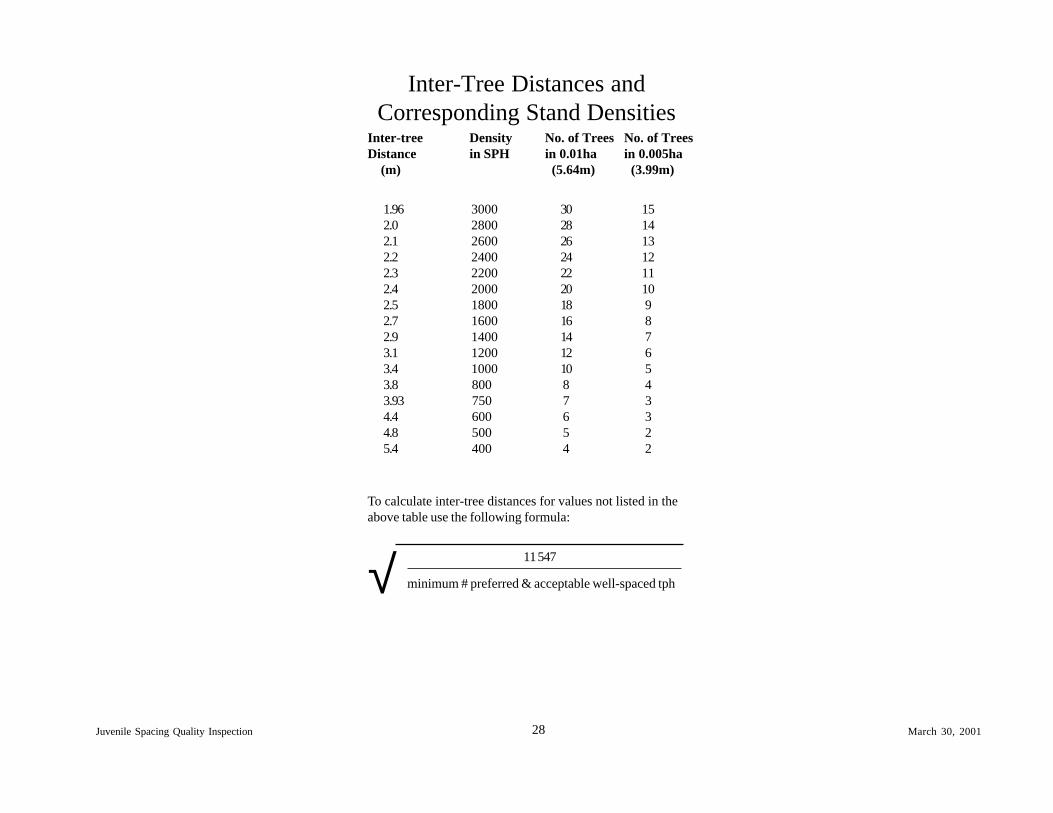
Inter-Tree Distances andCorresponding Stand Densities
1.96 3000 30 152.0 2800 28 142.1 2600 26 132.2 2400 24 122.3 2200 22 112.4 2000 20 102.5 1800 18 92.7 1600 16 82.9 1400 14 73.1 1200 12 63.4 1000 10 53.8 800 8 43.93 750 7 34.4 600 6 34.8 500 5 25.4 400 4 2
Inter-tree Density No. of Trees No. of TreesDistance in SPH in 0.01ha in 0.005ha (m) (5.64m) (3.99m)
To calculate inter-tree distances for values not listed in theabove table use the following formula:
11 547
minimum # preferred & acceptable well-spaced tph√