Embed Size (px)
Citation preview
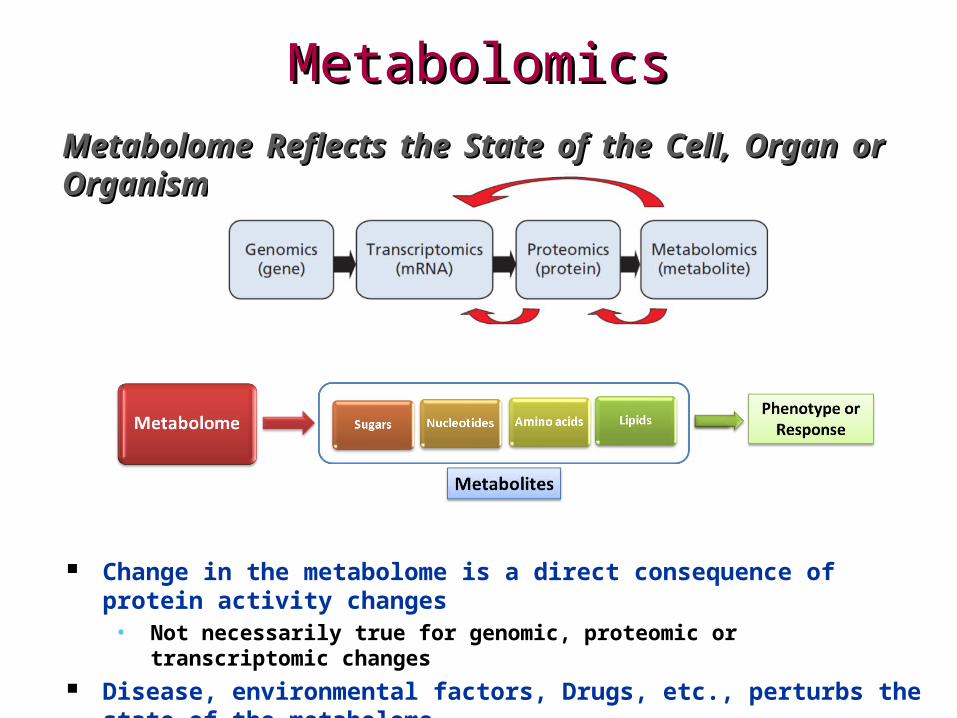
MetabolomicsMetabolomicsMetabolome Reflects the State of the Cell, Organ or OrganismMetabolome Reflects the State of the Cell, Organ or Organism
Change in the metabolome is a direct consequence of protein activity changes • Not necessarily true for genomic, proteomic or transcriptomic changes
Disease, environmental factors, Drugs, etc., perturbs the state of the metabolome • Provides a system-wide view of the organism or cell’s response
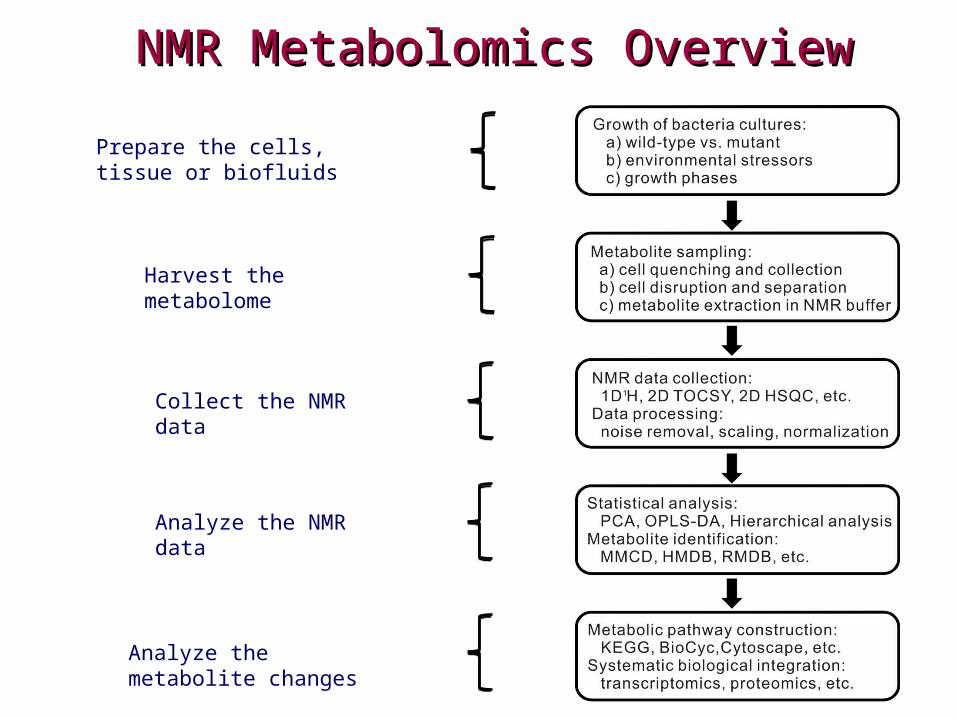
NMR Metabolomics OverviewNMR Metabolomics Overview
Prepare the cells, tissue or biofluids
Harvest the metabolome
Collect the NMR data
Analyze the NMR data
Analyze the metabolite changes

NMR Metabolomics DataNMR Metabolomics Data
One-dimensional 1H NMR spectrum
Two-dimensional NMR spectra

2D 1H-13C HSQC Experiment – workhorse of metabolomics
Correlates all directly bonded 13C-1H pairs
generally requires 13C-labeling (1.1% natural abundance)
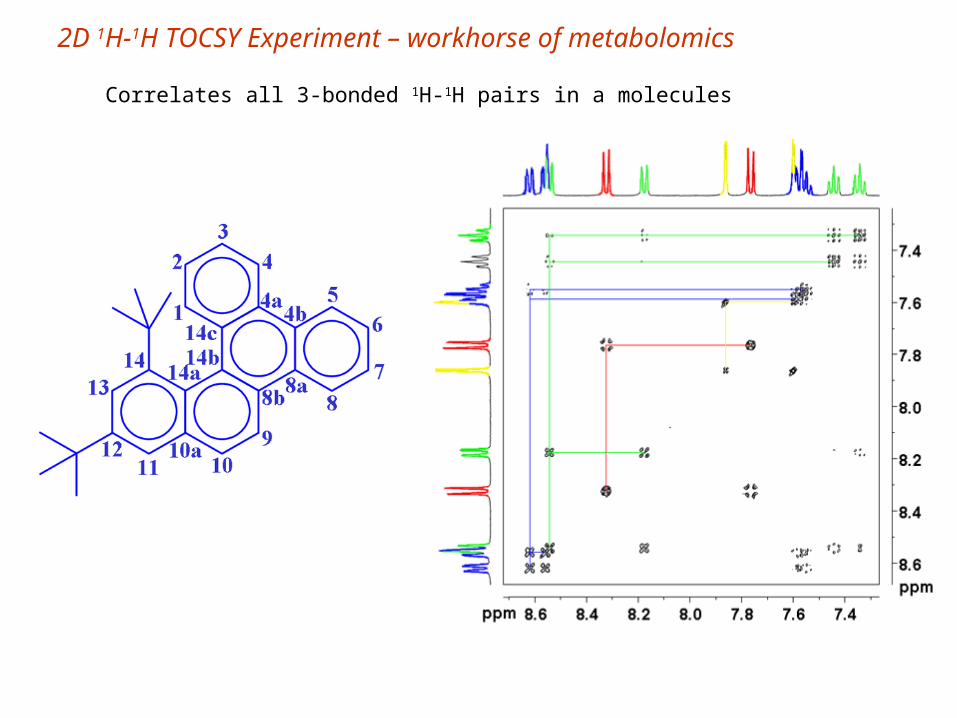
2D 1H-1H TOCSY Experiment – workhorse of metabolomics
Correlates all 3-bonded 1H-1H pairs in a molecules

NMR Metabolomics ProcessNMR Metabolomics Process
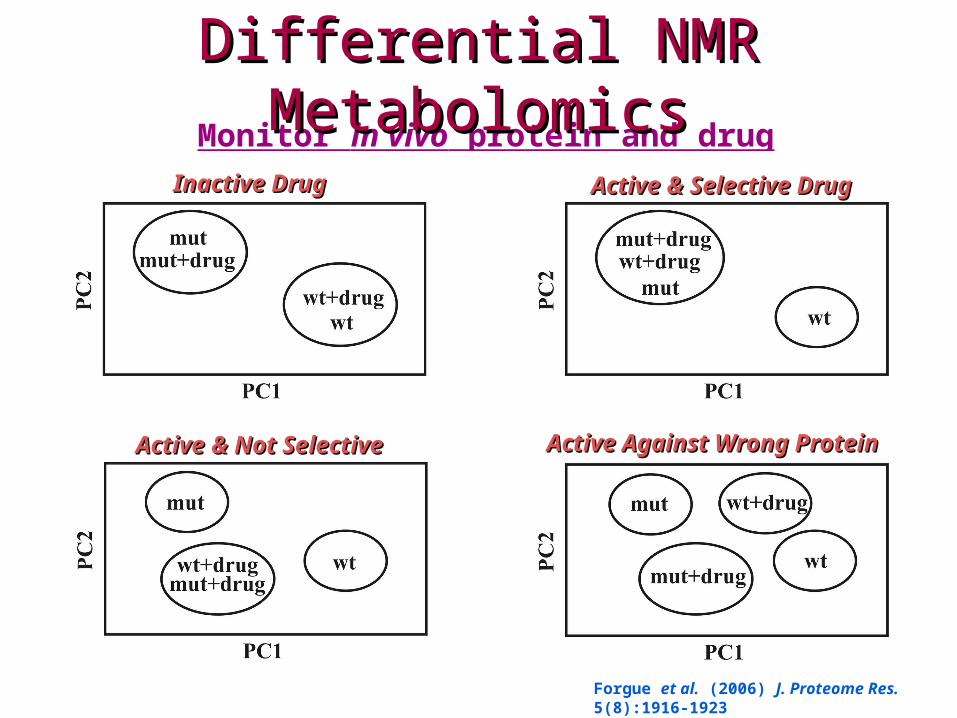
Monitor in vivo protein and drug activity
Forgue et al. (2006) J. Proteome Res. 5(8):1916-1923Halouska & Powers (2006) J. Mag. Res. 178:88-95
Inactive Inactive DrugDrug
Active & Selective Active & Selective DrugDrug
Active & Not Active & Not SelectiveSelective
Active Against Wrong Active Against Wrong ProteinProtein
Differential NMR MetabolomicsDifferential NMR Metabolomics

NMR and Multivariate StatisticsNMR and Multivariate StatisticsExtreme Sensitivity to Experimental Differences
Want PCA Clustering to Result from Metabolome Change NOT Experimental Variability
EVERYTHING should be a CONSTANT between samples or the study is invalid
NMRexperimental parameters
temperature Buffer (pH) shimming Tuning & matching
lock 90o pulse
acquisition parameters
Spectral width
Data points Recycle time
Acquisition time
Solvent removal
Receiver gain
processing parameter
Zero filling Baseline correction
Window function
Linear prediction
Solvent removal
phasing
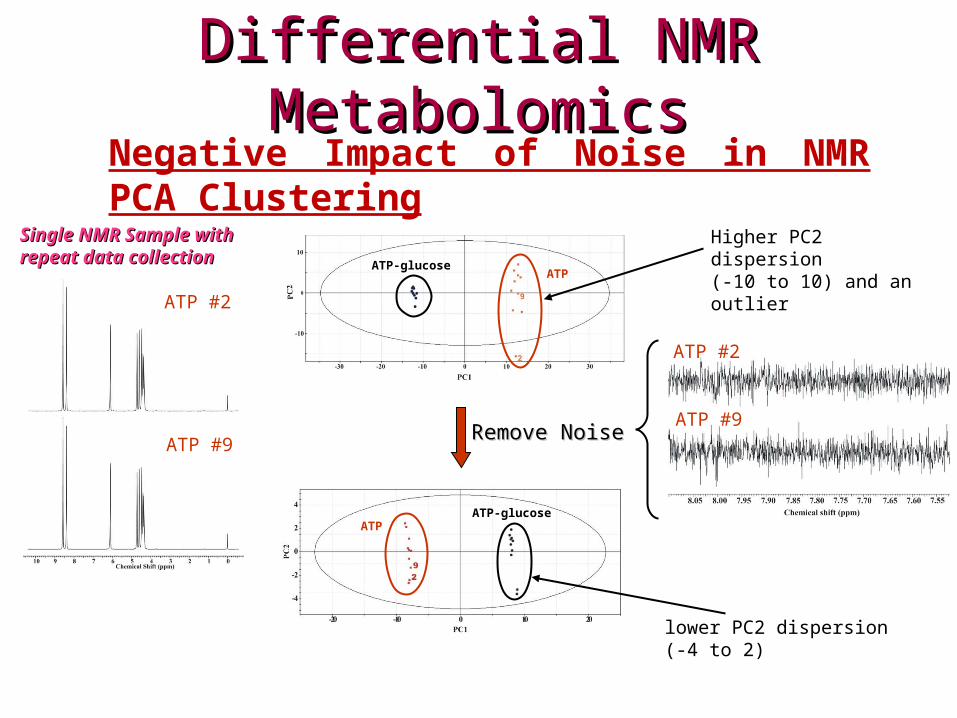
Negative Impact of Noise in NMR PCA Clustering
ATPATP-glucose
ATP-glucoseATP
Remove NoiseRemove Noise
ATP #2
ATP #9
Single NMR Sample Single NMR Sample with repeat data with repeat data collectioncollection
ATP #2
ATP #9
Higher PC2 dispersion (-10 to 10) and an outlier
lower PC2 dispersion (-4 to 2)
Differential NMR MetabolomicsDifferential NMR Metabolomics

Differential NMR MetabolomicsDifferential NMR MetabolomicsThe Role of NMR Signal-to-Noise in PCA Clustering
Increasing Number of NMR Scans Increasing Number of NMR Scans (S/N)(S/N)
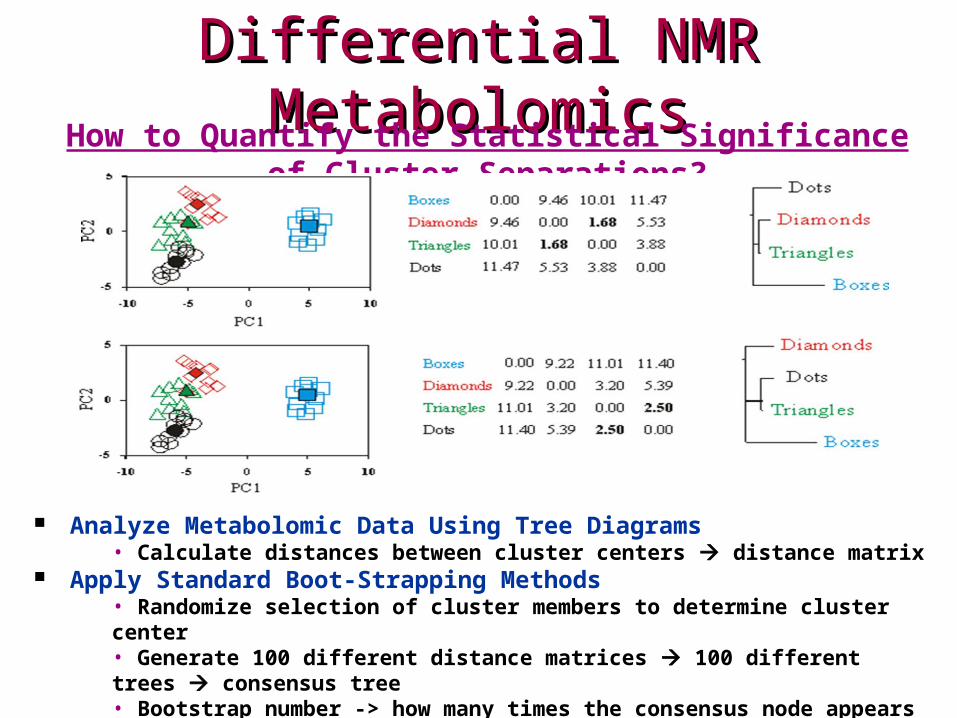
Differential NMR MetabolomicsDifferential NMR MetabolomicsHow to Quantify the Statistical Significance of Cluster Separations?
Analyze Metabolomic Data Using Tree Diagrams• Calculate distances between cluster centers distance matrix
Apply Standard Boot-Strapping Methods• Randomize selection of cluster members to determine cluster center• Generate 100 different distance matrices 100 different trees consensus tree• Bootstrap number -> how many times the consensus node appears in the set of 100 trees
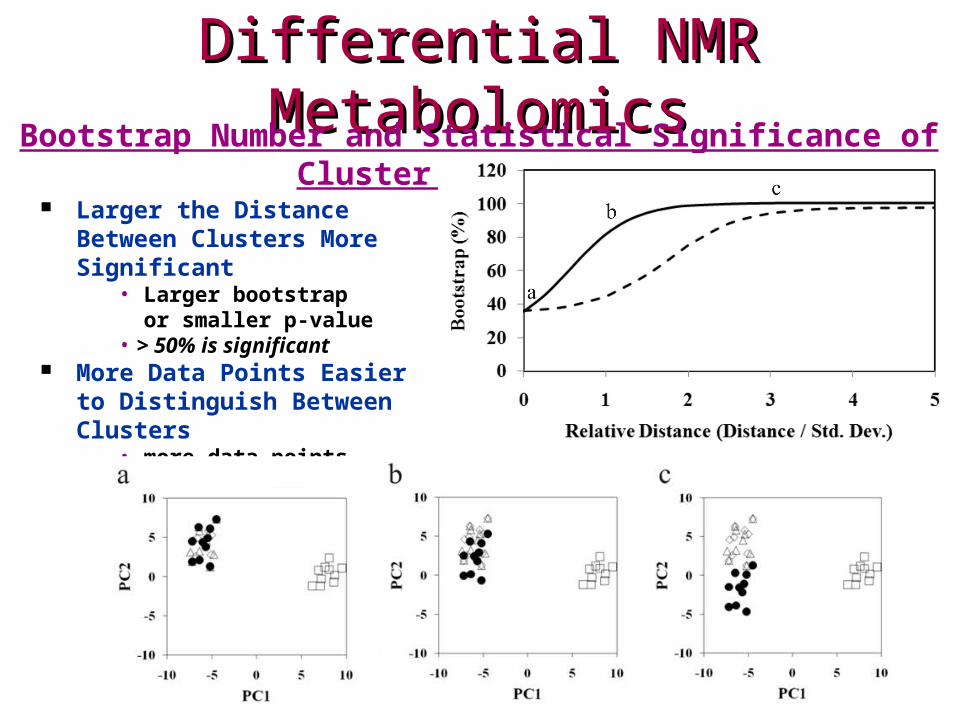
Differential NMR MetabolomicsDifferential NMR MetabolomicsBootstrap Number and Statistical Significance of Cluster Separations
Larger the Distance Between Clusters More Significant
• Larger bootstrap or smaller p-value• > 50% is significant
More Data Points Easier to Distinguish Between Clusters
• more data points (solid line)
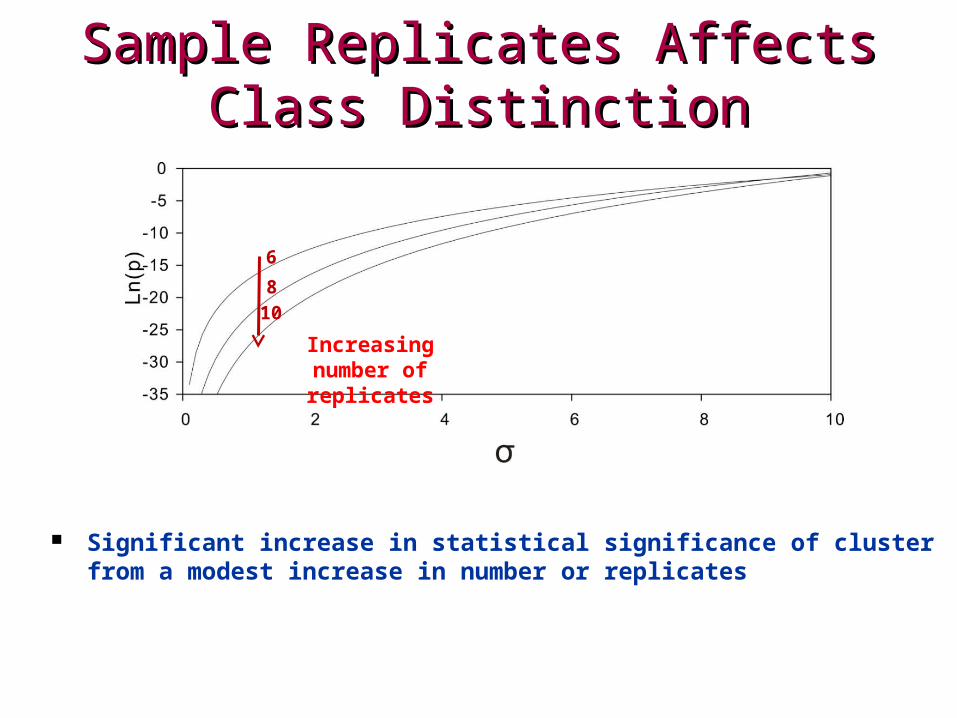
Sample Replicates Affects Class DistinctionSample Replicates Affects Class Distinction
Increasing number of replicates
6
810
Significant increase in statistical significance of cluster from a modest increase in number or replicates
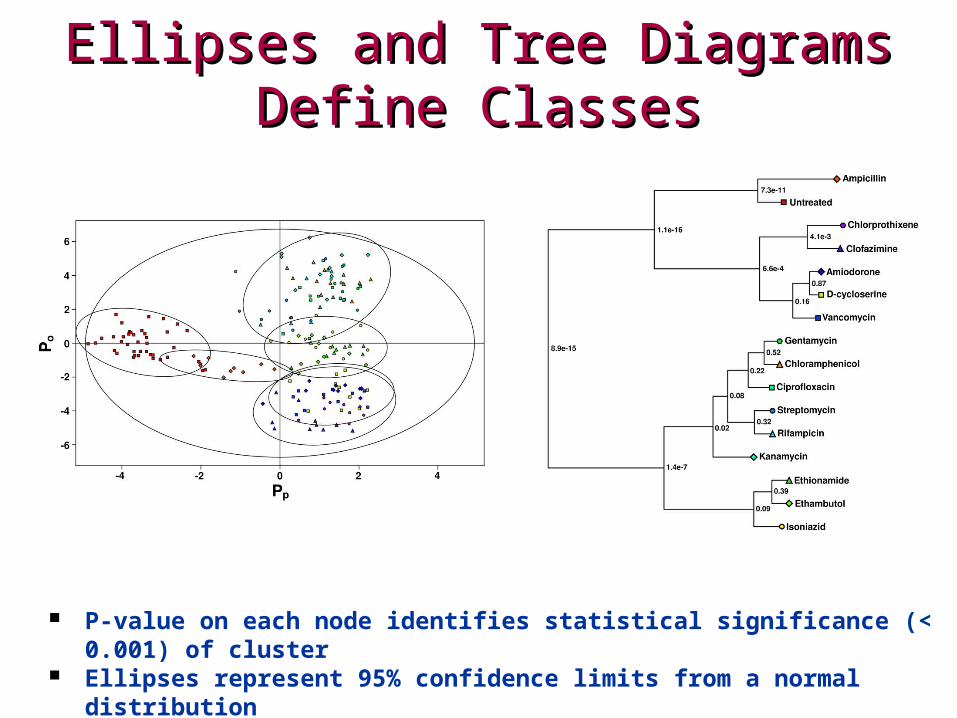
Ellipses and Tree Diagrams Define ClassesEllipses and Tree Diagrams Define Classes
P-value on each node identifies statistical significance (< 0.001) of cluster Ellipses represent 95% confidence limits from a normal distribution
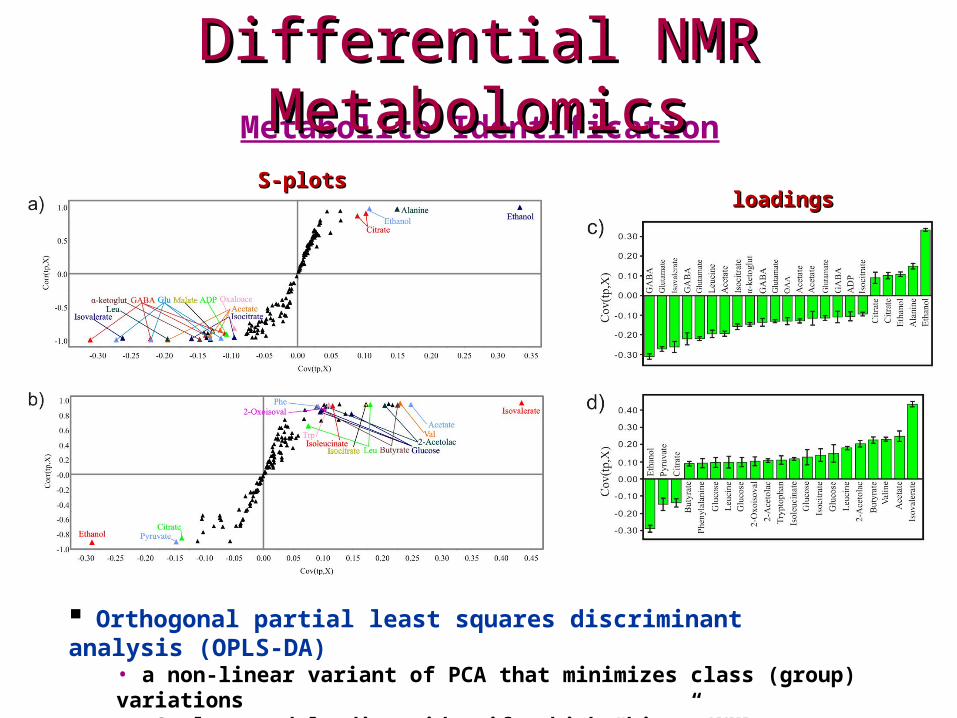
Metabolite IdentificationDifferential NMR MetabolomicsDifferential NMR Metabolomics
Orthogonal partial least squares discriminant analysis (OPLS-DA)• a non-linear variant of PCA that minimizes class (group) variations• S-plots and loadings identify which “bins” (NMR chemical shifts – metabolites) are strongly correlated with class separation
S-plotsS-plotsloadingsloadings
Metabolite Identification
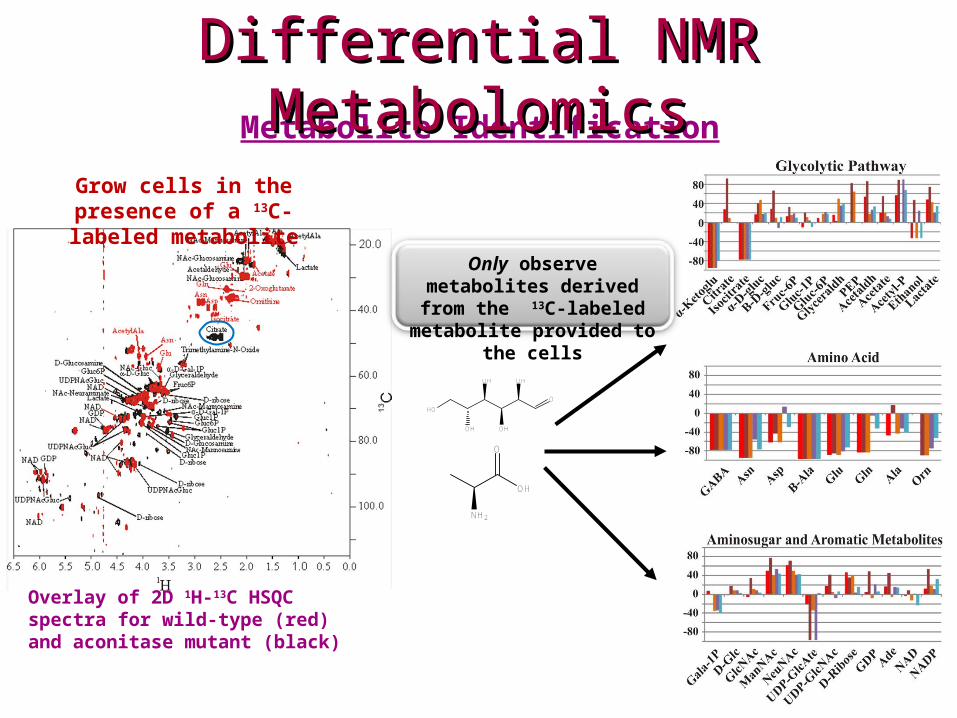
Overlay of 2D 1H-13C HSQC spectra for wild-type (red) and aconitase mutant (black)
Differential NMR MetabolomicsDifferential NMR Metabolomics
Grow cells in the presence of a 13C-labeled metabolite
Only observe metabolites derived from the 13C-labeled
metabolite provided to the cells
O
OH
OH
OH
OH
HO
NH2
O
OH
Hu et al. (2011) J. Am. Chem. Soc. 133:1662-1665
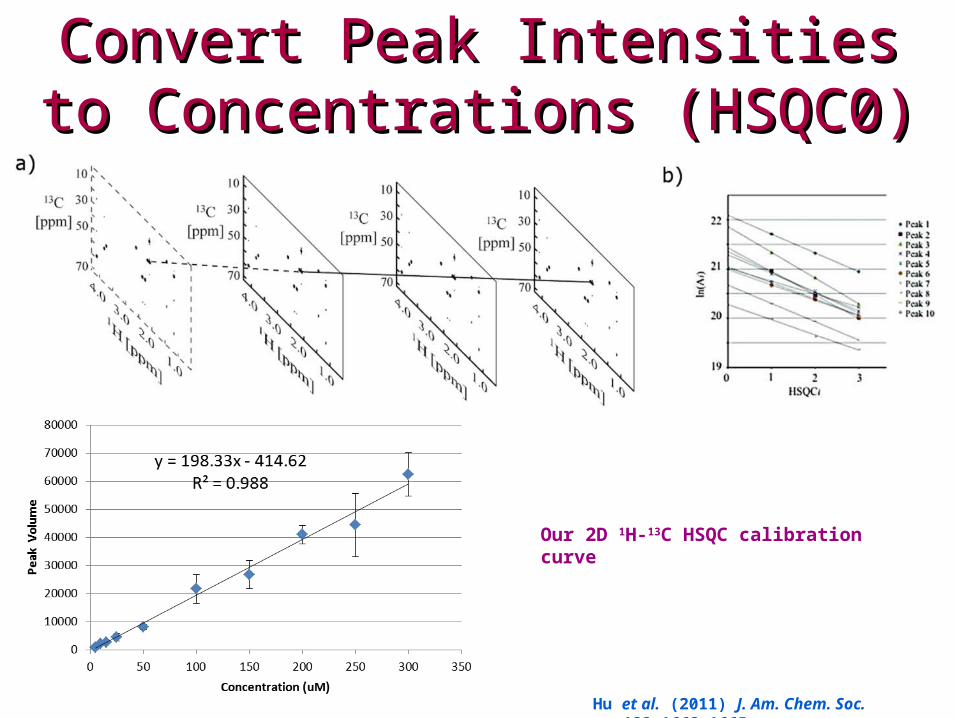
Convert Peak Intensities to Convert Peak Intensities to Concentrations (HSQC0)Concentrations (HSQC0)
Our 2D 1H-13C HSQC calibration curve
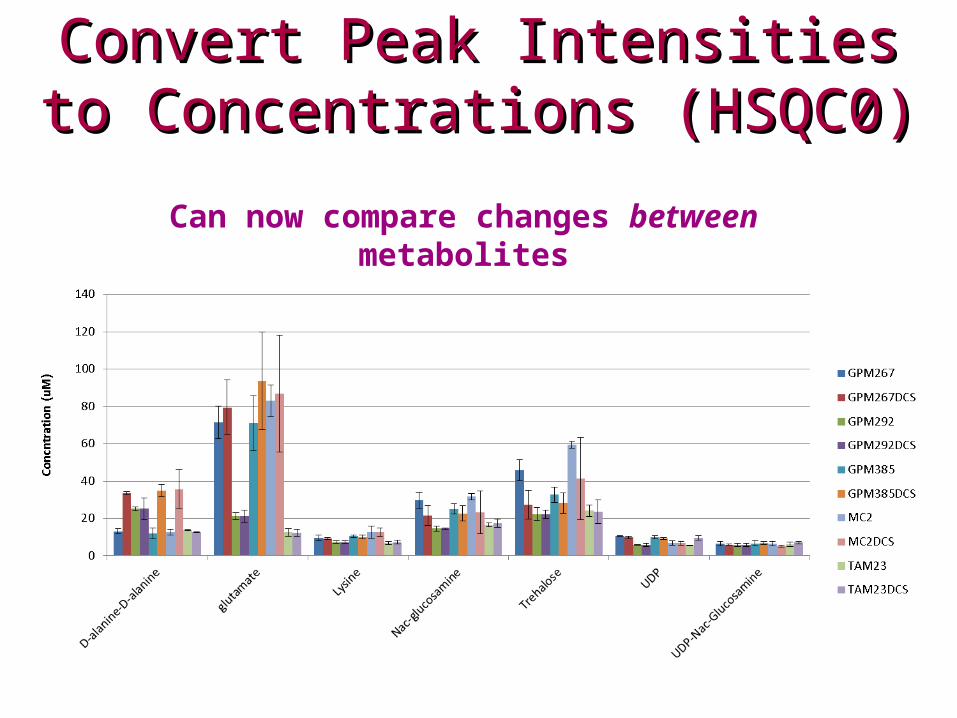
Convert Peak Intensities to Convert Peak Intensities to Concentrations (HSQC0)Concentrations (HSQC0)
Can now compare changes between metabolites
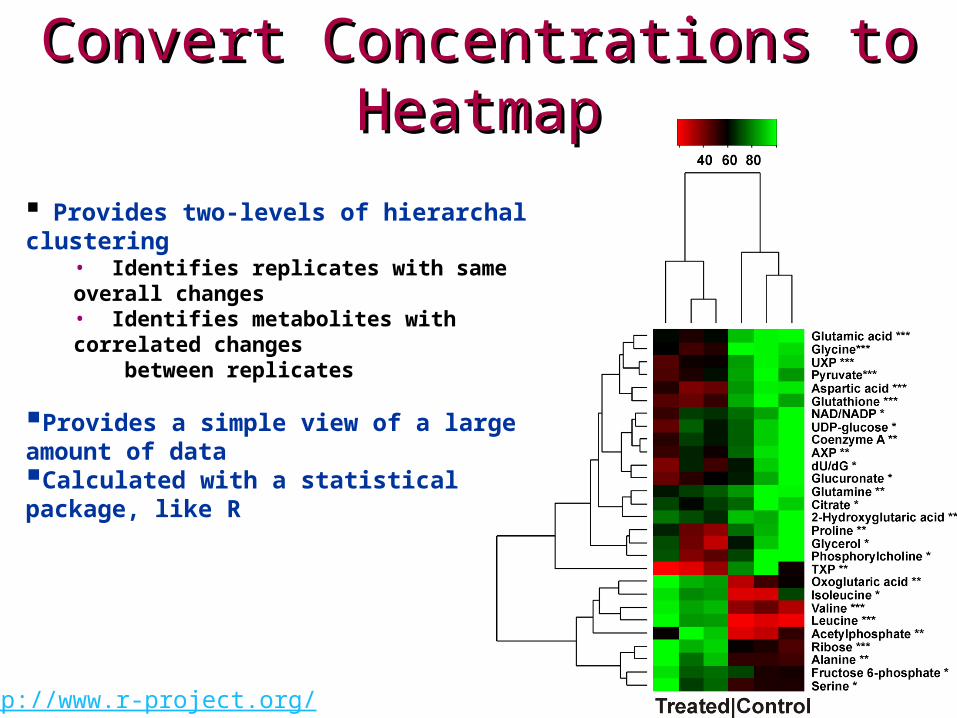
Convert Concentrations to HeatmapConvert Concentrations to Heatmap
Provides two-levels of hierarchal clustering• Identifies replicates with same overall changes• Identifies metabolites with correlated changes between replicates
Provides a simple view of a large amount of dataCalculated with a statistical package, like R
http://www.r-project.org/

Differential NMR MetabolomicsDifferential NMR MetabolomicsMetabolite Network Mapping (Cytoscape)
Metabolites increased (red), decreased (green) or unperturbed/undetected (grey)
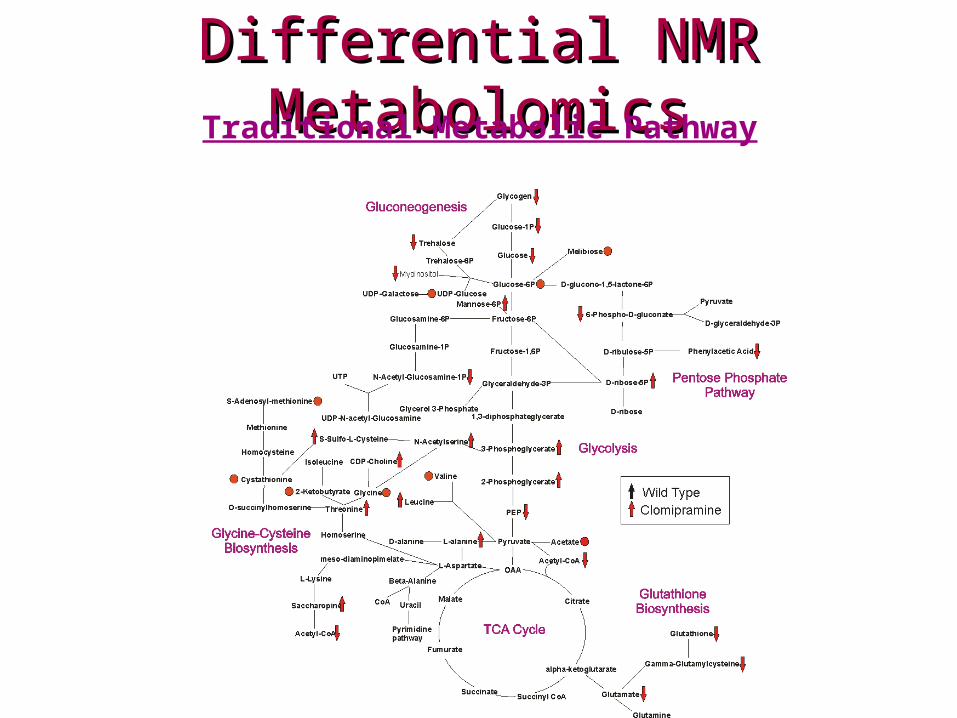
Differential NMR MetabolomicsDifferential NMR MetabolomicsTraditional Metabolic Pathway

Some Final thoughtsSome Final thoughts A number of different analytical methods can be used to analyze the metabolome
• NMR, GC-MS, LC-MS, CE-MS, FTIR, etc.
A variety of statistical techniques can be used to analyze metabolomics data•PCA, PLS, OPLS-DA, HCM, SOM, SVN, etc.
Can combine multiple datasets (NMR and MS) for multivariate statistical analysis
Can incorporate proteomics, genomics and any other data source with metabolomics data to generate system-wide view of the organism or cell response