Embed Size (px)
Citation preview

ORIGINAL ARTICLE
Metabolomics identifies a biological response to chronic low-dosenatural uranium contamination in urine samples
Stephane Grison • Gaelle Fave • Matthieu Maillot • Line Manens •
Olivia Delissen • Eric Blanchardon • Nathalie Banzet • Catherine Defoort •
Romain Bott • Isabelle Dublineau • Jocelyne Aigueperse • Patrick Gourmelon •
Jean-Charles Martin • Maamar Souidi
Received: 7 February 2013 / Accepted: 4 May 2013 / Published online: 21 May 2013
� The Author(s) 2013. This article is published with open access at Springerlink.com
Abstract Because uranium is a natural element present
in the earth’s crust, the population may be chronically
exposed to low doses of it through drinking water.
Additionally, the military and civil uses of uranium can
also lead to environmental dispersion that can result in
high or low doses of acute or chronic exposure. Recent
experimental data suggest this might lead to relatively
innocuous biological reactions. The aim of this study was
to assess the biological changes in rats caused by inges-
tion of natural uranium in drinking water with a mean
daily intake of 2.7 mg/kg for 9 months and to identify
potential biomarkers related to such a contamination.
Subsequently, we observed no pathology and standard
clinical tests were unable to distinguish between treated
and untreated animals. Conversely, LC–MS metabolomics
identified urine as an appropriate biofluid for discrimi-
nating the experimental groups. Of the 1,376 features
detected in urine, the most discriminant were metabolites
involved in tryptophan, nicotinate, and nicotinamide
metabolic pathways. In particular, N-methylnicotinamide,
which was found at a level seven times higher in
untreated than in contaminated rats, had the greatest dis-
criminating power. These novel results establish a proof
of principle for using metabolomics to address chronic
low-dose uranium contamination. They open interesting
perspectives for understanding the underlying biological
mechanisms and designing a diagnostic test of exposure.
Keywords Uranium � Low-dose � Chronic �Metabolomics � Urine � N-methylnicotinamide
1 Introduction
Above and beyond acute accidental pollution by various
substances, the chronic low-rate dispersion of pollutants to
the environment is a serious health issue that raises ques-
tions about the effects on humans of such continuous low-
grade exposure. The potential health repercussions are not
always satisfactorily addressed. Thus both the public and
Stephane Grison and Gaelle Fave contributed equally to the project.
Electronic supplementary material The online version of thisarticle (doi:10.1007/s11306-013-0544-7) contains supplementarymaterial, which is available to authorized users.
S. Grison � L. Manens � O. Delissen � I. Dublineau � M. Souidi (&)
Institut de Radioprotection et de Surete Nucleaire (IRSN),
PRP-HOM, SRBE, LRTOX, Fontanay-aux-Roses, France
e-mail: [email protected]
G. Fave � M. Maillot � N. Banzet � C. Defoort � R. Bott �J.-C. Martin
Aix Marseille Universite, NORT, 13005 Marseille, France
G. Fave � M. Maillot � N. Banzet � C. Defoort � R. Bott �J.-C. Martin
Inserm, UMR_S 1062, 13005 Marseille, France
G. Fave � M. Maillot � N. Banzet � C. Defoort � R. Bott �J.-C. Martin
Inra, UMR_INRA 1260, 13005 Marseille, France
E. Blanchardon
Institut de Radioprotection et de Surete Nucleaire (IRSN),
PRP-HOM, SDI, LEDI, Fontanay-aux-Roses, France
J. Aigueperse � P. Gourmelon
Institut de Radioprotection et de Surete Nucleaire (IRSN),
PRP-HOM, Fontanay-aux-Roses, France
123
Metabolomics (2013) 9:1168–1180
DOI 10.1007/s11306-013-0544-7

more directly involved stakeholders request studies to
evaluate the environmental risks related to exposure to
these various low-grade pollutants (European-Commission
2011). Radionuclides are among the most interesting of
the environmental chemical compounds for experimental
studies because of the societal concerns they raise. They
can be dispersed after major nuclear power plant accidents
(for example, cesium 137) (Gagnaire et al. 2010) or by
military activity with depleted uranium (Handley-Sidhu
et al. 2010). Other radionuclides are naturally occurring
elements present in rocks, water, and the food chain, such
as uranium (Bleise et al. 2003; Craft et al. 2004), which
can also be dispersed in higher quantities by pit mining
(Arogunjo et al. 2009). The consequences of acute high
doses of uranium on health are relatively well known
(Kathren and Burklin 2008) and have been described in
particular in kidneys. However, the long-term effects of
low-dose uranium contamination remain unknown and
require more investigation. Several in vivo studies have
shown that uranium can affect various physiological sys-
tems, including intestinal inflammatory pathways, the
reproductive system, brain pro- and anti-oxidant activity,
and xenobiotic metabolisms (Briner 2010; Dublineau et al.
2006, 2007; Feugier et al. 2008; Lestaevel et al. 2009;
Paquet et al. 2006; Souidi et al. 2009; Wade-Gueye et al.
2012). Nonetheless, a still more sensitive approach is
necessary to overcome the specific limitations due to low
doses. Metabolomics, a noninvasive technology suitable
for clinical studies (Zhang et al. 2012; Corona et al. 2012;
Senn et al. 2012), has recently been proven quite powerful
for identifying a discriminant metabolic signature of
chronic low-dose cesium 137 contamination in rats (Gri-
son et al. 2012). The aim of this study was thus to use a
metabolomic approach, combined with conventional tox-
icology, to characterize the biological impact of chronic
low-dose exposure to natural uranium (nat.U) in rats by an
exhaustive metabolite analysis and to attempt to decipher
potential underlying molecular mechanisms. To mimic
environmental contamination of drinking water, especially
among children, who are known to be a sensitive sub-
group in toxicology (Schwenk et al. 2003; Wang and
Pinkerton 2007) and radiobiology (De Santis et al. 2007;
Magdo et al. 2007), rats were exposed from birth to
adulthood through drinking water containing a concen-
tration of nat.U known not to be toxic to the kidneys.
Standard clinical and biological characteristics, including
body and organ weight, food and water consumption,
blood cell counts, and plasma and urine biochemistry
were assessed to verify the absence of toxicity. At the
same time, we used liquid chromatography–mass spec-
trometry (LC–MS) to acquire exhaustive urine metabolite
profiles, which we analyzed by multivariate statistical
methods.
2 Materials and methods
2.1 Animals and contamination procedure
2.1.1 Animals
Sprague–Dawley rats, 12 weeks old and 16 days pregnant,
were obtained from Charles River Laboratories (L’Arbre-
sle, France). They were housed individually and main-
tained in a 12-h light/12-h dark cycle (regular cycle) at
21 �C and 50 % humidity, with access to a standard rodent
pellet diet and water ad libitum. After weaning, male off-
spring were housed, each paired with a rat from a different
mother (assigned by randomization). Female offspring and
mothers were euthanized. All experimental procedures
were approved by the Animal Care Committee of the
Institute of Radioprotection and Nuclear Safety (IRSN) and
complied with French regulations for animal experimen-
tation (Ministry of Agriculture Act No. 87-848, October
19, 1987, modified May 20, 2001).
2.1.2 Contamination procedure
Rats were contaminated through their drinking water: nat.U
in a solution of uranyl nitrate hexahydrate (UO2(NO3)2�6H2O) was prepared to a final uranium concentration of
40 mg L-1 (daily uranium intake: 1 mg/rat/day) and dis-
solved in mineral water. This dose corresponds to three
time as much as the highest uranium concentration found
naturally in well waters in Finland (Salonen 1994). nat.U
(Olympic) was obtained from CERCA (Pierrelatte,
France). Control animals drank uncontaminated mineral
water. The specific activity of the nat.U was 2.42 9 10?4
Bq/g and its isotopic composition was 238U = 99.307,235U = 0.688, and 234U = 0.005 %. Mothers of the off-
spring in the treated group were also exposed to nat.U
through drinking water from birth to euthanasia (mothers
of the control rats received uncontaminated mineral water).
Until weaning, offspring were theoretically contaminated
by mother’s milk [human offspring receive *5 % of the
mother’s daily dose (Wappelhorst et al. 2002)]. The food
and water intake of both groups were monitored weekly
throughout the contamination period.
2.2 Collection of organs and biofluids
One morning when the rats were 9 months old, they were
placed in metabolic cages (one per cage), with access to a
rodent ground pellet diet and water (contaminated or not)
ad libitum. Urine was collected twice a day for 48 h, with
sodium azide (0.01 %) added to prevent bacterial growth
(Griffin et al. 2001), and refrigerated at ?4 �C. Each rat’s
fractions were pooled, mixed, and centrifuged; supernatants
Metabolomics identifies a biological response 1169
123

were frozen at -80 �C. The rats were then moved to con-
ventional cages (one per cage) with food and drink ad libi-
tum until the evening to reduce stress. To control the diet
cycle, food was removed in the evening until the next
morning. Five hours before euthanasia, around 12 g of
standard rodent pellet food was added directly to each cage
to stimulate the desire to eat before sleep. Rats were anes-
thetized by inhalation of 5 % isoflurane (Abbot France,
Rungis, France) and euthanized by intracardiac puncture,
with blood collected in heparinized tubes. Whole blood was
centrifuged (5,000 rpm) and plasma supernatants were
immediately frozen at -80 �C. Organs were dissected
on ice, weighed, deep-frozen in liquid nitrogen, and stored at
-80 �C.
2.3 Biological and uranium analyses
2.3.1 Measurement of biological characteristics
2.3.1.1 Blood cell counts Complete blood counts (CBC)
were performed with an MS-9 vet automatic counter
(Melet-Schlossing, Osny, France). Remaining blood was
centrifuged at 400 g for 10 min, and plasma was frozen
(-80 �C) for later use.
2.3.1.2 Biochemical panel Biochemical measurements
were made from thawed plasma samples by an automated
spectrometric system (Konelab 20 from Thermo Electron
Corporation, Cergy-Pontoise, France), with the manufac-
turer’s biological chemistry reagents and protocols. The
markers measured in plasma included glucose, albumin,
total protein, lactate dehydrogenase (LDH), alkaline
phosphatase (ALP), cholesterol, high-density lipoprotein
(HDL), low-density lipoprotein (LDL), phospholipids, tri-
glycerides, alanine aminotransferase (ALT), aspartate
aminotransferase (AST), total and direct bilirubin, trans-
ferrin, ferritin, ceruloplasmin iron, phosphorus, calcium,
chlorine, potassium, magnesium, sodium, urea, creatinine,
and creatine kinase.
2.3.2 Measurement of uranium accumulation and dose
calculation
2.3.2.1 Measurement of natural uranium organ contami-
nation Samples were mineralized (Ejnik et al. 2000) and
then analyzed for their uranium content by ICP-MS
(XSERIE 2, Thermoelectron, France). A multielement
standard solution (Analab, France) was used to optimize
experimental conditions and apparatus parameters to obtain
the best signal/noise ratio for 238U. In all solutions likely to
be analyzed (biological samples or calibration solutions),
bismuth 209 was added as an internal standard at 1 lg L-1.
Six standard solutions for the calibration curve (0, 0.005,
0.01, 0.1, 0.5, and 1 lg L-1) were freshly prepared by
dilution of a standard solution at 10 mg L-1 in 2 % nitric
acid (NORMATOM for trace metal analysis, VWR Pro-
labo). A linear relation—count number (iU) = f([iU])—can
thus be set up for each isotope, i = [235; 238] with [iU]
equal to the isotope concentration in lg L-1. Isotopy and
dosage reliability were regularly verified with standard
solutions (six quality controls of different concentrations
and isotopy distributed throughout the analysis). Blank
samples were run every five samples to check the stability
of the background and prevent potential contamination. For238U, the detection and quantification limits were respec-
tively 0.5 and 1.5 ng/L, and for 235U, 0.01 and 0.03 ng/L.
The limits for 238U were applied to total uranium.
2.3.2.2 Renal dose estimation (9 months post-natal) The
radiation yields and energies of radiation emitted in nuclear
transformation of the isotopes forming nat.U were taken
from ICRP (1983). Alpha particles and Auger and internal
conversion electrons were assumed to be locally absorbed
in the source organ. Photons were transported with the code
MCNPX in a voxel phantom of an adult male rat from the
same strain. In view of the preponderant concentration of
nat.U in kidneys (Table 1) and the small fraction of energy
emitted as penetrating radiation, kidney irradiation by nat.U
from the rest of the body was ignored because negligible.
The absorbed dose rate to the kidney was thus determined
at 9 months of age based on the kidney concentration of
nat.U and kidney mass indicated in Table 1 and assuming a
homogeneous concentration of nat.U throughout the entire
9 months.
2.3.3 Statistical analysis
This animal protocol of nat.U contamination used two groups
each of 10 rats. Health diagnostic values were reported as
means ± standard errors of the means (SEM). The control
and contaminated groups were compared with student’s
t test in normal populations or the rank sum test in non-
normal populations. Statistical significance was defined by a
P value \ 0.05. Statistical analyses were performed with
Sigmastat statistical software (SPSS, Paris, France).
2.4 Metabolomic analysis
2.4.1 Sample preparation
Urine samples were diluted immediately before analysis.
After centrifugation for 15 min at 11,000 rpm and 4 �C,
100 lL of thawed urine was mixed and shaken for 1 min
with 400 lL of deionized water. After a second centrifu-
gation for 5 min at 3,000 rpm, 50 lL of supernatant was
transferred into HPLC vials for analysis.
1170 S. Grison et al.
123

To check for data quality, a blank sample (deionized
water) and a pool sample (a mixture of all samples) were
extracted/diluted and analyzed repeatedly along with the
sample series.
2.4.2 LC–MS analyses
The samples were analyzed on an Agilent 1200 RRLC
coupled to a Bruker microTOF ESI-hybrid quadrupole-
time of flight mass spectrometer (Wissembourg, France).
For polar compounds from plasma, the LC conditions
were: autosampler temperature, 4 �C; column type, EC
100/2 Nucleodur C18 pyramid; particle size, 1.8 lm
(Macherey–Nagel, Les Ulis, France); column temperature,
40 �C; solvent flow, 0.4 mL/min (solvent A: 95 % water,
5 % acetonitrile, 0.1 % formic acid, and solvent B: 95 %
acetonitrile, 5 % water, 0.1 % formic acid); gradient, 3 %
B for 1 min, 3–50 % B for 2 min, 50–100 % B for 6 min,
100 % B for 2 min, 100–3 % B for 1 min, and 3 % B for
4 min (running time, 16 min).
The MS conditions were as follows: acquisition mode,
positive electrospray ionization (ESI?) and full scan
50–1,500 m/z; capillary voltage, 4.5 kV; capillary temper-
ature, 200 �C; cone voltage, 40 V; drying gas flow,
9.5 L min-1; nebulizing gas pressure (nitrogen), 2.9 bar.
For metabolite identification purpose, MS/MS analyses
were performed on selected urine samples and standard
molecules. LC and MS methods were used for the MS anal-
yses, and MRM parameters were set at 8.0 for isolation width,
2.0 for acquisition factor, and 10.0, 20.0 and 30.0 eV for
collision energies. Creatine (MET250A), 4,6-dihydroxy-
quinoline (424048—250MG), and 5-hydroxyindoleacetate
Table 1 Mean ± SEM of (i) uranium concentration in plasma, urine
and kidneys, (ii) dietary consumption measured over the 4 months
before euthanasia, (iii) whole-body weight, kidney weight and mean
ratio of kidney to whole-body weight in each group, (iv) 48-h urine
collection, (v) plasma enzymes, proteins, carbohydrates, lipids, ions
and other metabolites, (vi) urine proteins, carbohydrates, ions, other
metabolites and creatinine clearance evaluation in control and
contaminated (nat.U) groups after 9 months of chronic radionuclide
ingestion through drinking water (40 mg/L)
Uranium concentrations Control (10) nat.U (10) Plasma analysis Control (9) nat.U (10)
Plasma (ng U/g) 0.86 ± 0.05 0.92 ± 0.06 ALAT/GPT (U/L) 37.2 ± 4.5 36.5 ± 2.6
Kidney (ng U/g) 5.45 ± 0.64 358.94 ± 84.02*** ASAT/GOT (U/L) 69.8 ± 4.6 89.5 ± 5.0**
Urine (ng U/g) 2.00 ± 0.24 14.99 ± 1.08*** CK (U/L) 184.0 ± 19.9 259.9 ± 36.2
Dietary consumption CK-MB (U/L) 335.2 ± 44.9 386.2 ± 42.5
Drinking (mL/day/rat) 27.1 ± 0.3 28.8 ± 0.2 LDH (U/L) 512.2 ± 87.1 532.5 ± 56.2
Food consumption (g/day/rat) 28.0 ± 0.3 26.0 ± 0.3 ALP (U/L) 76.7 ± 4.7 66.4 ± 5.4
Weight measured at sacrifice CERU (mg/L) 98.3 ± 7.7 91.6 ± 10.0
Total body (g) 615 ± 26 563 ± 18* CHE (U/L) 154.6 ± 43.1 98.2 ± 6.9
Kidney (g) 1.72 ± 0.04 1.77 ± 0.05 Albumin (g/L) 30.4 ± 0.4 30.7 ± 0.6
Ratio kidney/total body (%) 0.28 0.32* Total proteins (g/L) 61.4 ± 1.0 54.7 ± 5.9
48-h urine collection Transferrin (g/L) 1.5 ± 0.1 1.5 ± 0.0
Urine volume (g) 28 ± 2 32 ± 1 Glucose (g/L) 11.7 ± 0.6 11.8 ± 0.4
Triglycerides (mM) 1.0 ± 0.2 0.9 ± 0.1
Urine analysis Control (10) nat.U (10) Cholesterol (mM) 2.5 ± 0.2 2.4 ± 0.2
Amylase (U) 335.90 ± 24.60 342.47 ± 21.12 HDL-cholesterol (mM) 1.1 ± 0.1 1.2 ± 0.1
Glucose (mmol) 0.06 ± 0.01 0.06 ± 0.00 LDL-cholesterol (mM) 0.4 ± 0.0 0.3 ± 0.0
Calcium (mmol) 0.06 ± 0.00 0.08 ± 0.01 Phospholipids B (g/L) 1.5 ± 0.1 1.4 ± 0.1
Potassium (mmol) 0.55 ± 0.28 1.56 ± 0.35** Calcium (mM) 2.6 ± 0.1 2.6 ± 0.0
Sodium (mmol) 0.63 ± 0.33 1.71 ± 0.39** Iron (lM) 21.8 ± 1.3 23.4 ± 1.4
Phosphorus (mmol) 0.81 ± 0.10 0.55 ± 0.07 Chlorine (mM) 93.0 ± 1.9 93.8 ± 1.0
Total proteins (g) 0.11 ± 0.03 0.08 ± 0.02 Potassium (mM 4.2 ± 0.1 4.5 ± 0.2
Urea (mmol) 26.56 ± 2.08 26.23 ± 1.11 Magnesium (mM) 0.7 ± 0.0 0.6 ± 0.1
Uric acid (lmol) 45.97 ± 2.22 47.51 ± 2.80 Phosphorus (mM) 1.3 ± 0.1 1.4 ± 0.1
Creatinine (lmol) 333.17 ± 19.83 328.79 ± 20.41 Creatinine (lM) 43.7 ± 1.0 47.6 ± 1.5*
Creatinine clearance (ml/min/kg) 4.4 ± 0.2 4.3 ± 0.2 Direct bilirubin (lM) 3.0 ± 0.3 3.0 ± 0.2
Total bilirubin (lM) 2.1 ± 0.3 2.3 ± 0.2
Urea (mM) 5.7 ± 0.2 5.7 ± 0.2
The number of rats for each measurement is indicated in parentheses
Results are significantly different for: * P \ 0.05; ** P \ 0.01; *** P \ 0.001
Metabolomics identifies a biological response 1171
123
(H8876—100MG) were purchased from Sigma (St. Quentin
Fallavier, France) and N1-methylnicotinamide (M0375—
10 g) from TCI Europe (Zwijndrecht, Belgium). Solutions of
1 mg/mL were prepared in different solvent mixtures
according to each molecule’s Log P value (water with 0.1 %
formic acid for creatine, with 2 % acetonitrile for N1-meth-
ylnicotinamide, and with 10 % acetonitrile for the others) and
injected at a 10 lg/mL concentration.
2.4.3 Data preprocessing and filtering
LC–MS raw data were exported to ‘‘.cdf’’ file format with
the manufacturer’s software DataAnalysis (Bruker, Wiss-
embourg, France) and preprocessed with the freely avail-
able XCMS software including the CAMERA script (Smith
et al. 2006). Peak picking was performed with the ‘cent-
Wave’ method (‘peakwidth’ parameter reduced to 3–15 s
to fit to UPLC performance, and ‘snthresh’ to 5 to detect
more peaks), retention time correction with the obiwarp
method (‘profStep’ reduced to 0.1 m/z as recommended for
QTOF mass spectrometers), peak grouping with ‘bw’ and
‘mzwidth’ parameters reduced to 5 and 0.025, respectively,
and gap filling with the default parameters.
To check for and ensure data quality, three successive
filtering steps were applied to the pre-processed data using
an in-house script ran on R, based on the signal/noise ratio
of each MS feature in the pool samples (cutoff set at 5
between features matching both in biological and blank
samples), the coefficient of variation of the intensity of the
variables in the pool samples (cutoff set at 20 %) and the
coefficient of the autocorrelation of the variables in a given
‘pcgroup’ (cutoff set at 0.8). Preprocessing and filtering of
the raw LC–MS data reduced the number of variables from
3,446 to 1,376 (40 %) in urine.
2.4.4 Statistical analyses
The most discriminatory metabolites were sought in the
dataset based on partial least-square discriminant analysis
(PLS-DA) using the variable importance in projection (VIP)
procedure. All multivariate statistical analyses were performed
with SIMCA-P? 12.0 software (Umetrics, Umea, Sweden).
For each discriminatory compound, a receiver operating
characteristic (ROC) curve as well as the area under this
ROC curve (AUC) were computed with the R package
pROC. A 95 % confidence interval was assessed for sen-
sitivity with 2000 bootstrap replicates. A boxplot by group
was calculated for each compound selected.
2.4.5 Metabolite identification
The 40 most discriminatory metabolites were searched in
the MZedDB, a web browser screening several databases
simultaneously, for tentative annotation using the accurate
measured mass (accuracy \15 ppm) (http://maltese.dbs.
aber.ac.uk:8888/hrmet/index.html) (Draper et al. 2009) and
the Bruker Data Analysis molecular formula engine, using
isotopic patterns. The KEGG compound ID of any hits was
recorded, and all recorded IDs were inserted into the
KEGG Mapper (http://www.genome.jp/kegg/tool/map_
pathway2.html) for tentative pathway identification. For
the compounds involved in the first four proposed path-
ways, a standard molecule was purchased, when available,
and subjected to MS/MS analysis. We compared spectral
data obtained with standard molecules and experimental
samples to one another and searched for matches in the
Metlin (http://metlin.scripps.edu/spec_search.php), Mass-
Bank databases (http://www.massbank.eu/MassBank/), or
HMDB (http://www.hmdb.ca/spectra/ms/search).
3 Results
3.1 Uranium intake and dose calculations
Results confirmed that the kidney is a preferential target
organ for uranium accumulation (Table 1); uranium con-
centration was very low in plasma (close to the natural
background) and significantly higher in urine.
At 9 months of age, the absorbed dose rate in the kid-
neys of the contaminated rats was estimated at
5.4 9 10-7 Gy d-1. Under the maximizing assumption of
a constant dose rate over 9 months, the maximum dose
absorbed by the kidneys at sacrifice should still be as low
as 0.15 mGy (considering a homogeneous concentration of
nat.U throughout the entire 9-month period).
3.2 Effect of uranium contamination on biological
characteristics
We monitored drinking water and food consumption during
the 4 months preceding the end of the contamination (once
a week). Control and contaminated rats did not differ in
their food consumption or water intake (Table 1).
To identify any toxic morphological changes, we
weighed the whole body and one kidney (on the same side
for each) for all rats and compared the groups. Calculation of
relative organ weights showed a slight statistical difference
but excluded any appreciable physiological effect (Table 1).
No difference between the groups was observed for the
urine volume collected during the 48-h period shortly
before sacrifice (Table 1).
Blood counts did not differ between the groups after
contamination (supplemental Table 1).
Several biochemical markers in plasma were also assessed,
including proteins, ions, and liver, cardiovascular, and kidney
1172 S. Grison et al.
123

markers (Table 1). Except for slightly elevated AST-GOT
(P B 0.01) and creatinine (P B 0.05) levels in the contami-
nated rats (nonetheless within the physiological range), no
differences were observed between the groups.
Similarly, urine sodium and potassium levels were sta-
tistically higher in contaminated than in control rats, but
remained in the normal range as did the measurement of
creatinine clearance, which showed no significant differ-
ence between the groups (Table 1).
3.3 Effect of uranium contamination on urinary
metabolites
3.3.1 Discrimination between control and contaminated
rats by urine samples
The PLS-DA performed on the 1,376 features detected in
urine samples resulted in robust, validated discrimination
between the control rats and those contaminated with the
nat.U (R2 = 92 %, Q2 = 55 %, CV-ANOVA = 0.009).
The 95 most discriminating variables, selected according to
their VIP score (above 1.8), were used for another PCA.
The first principal component described 40 % of total
variance and could be interpreted as the inter-group vari-
ation, while the second principal component described
14 % of total variance and showed the interindividual
variability (Fig. 1a). Of the discriminant features, 60 %
were characteristic of the contaminated group (Fig. 1b).
Using the same 95 features, a new PLS-DA model was
fitted to identify the top 40 discriminating features
(Table 2). According to the PCA results, only one PLS-DA
component was necessary for significant discrimination
between control and contaminated rats (R2 = 89 %,
Q2 = 74 %, CV-ANOVA\0.0005) (plot not shown). The
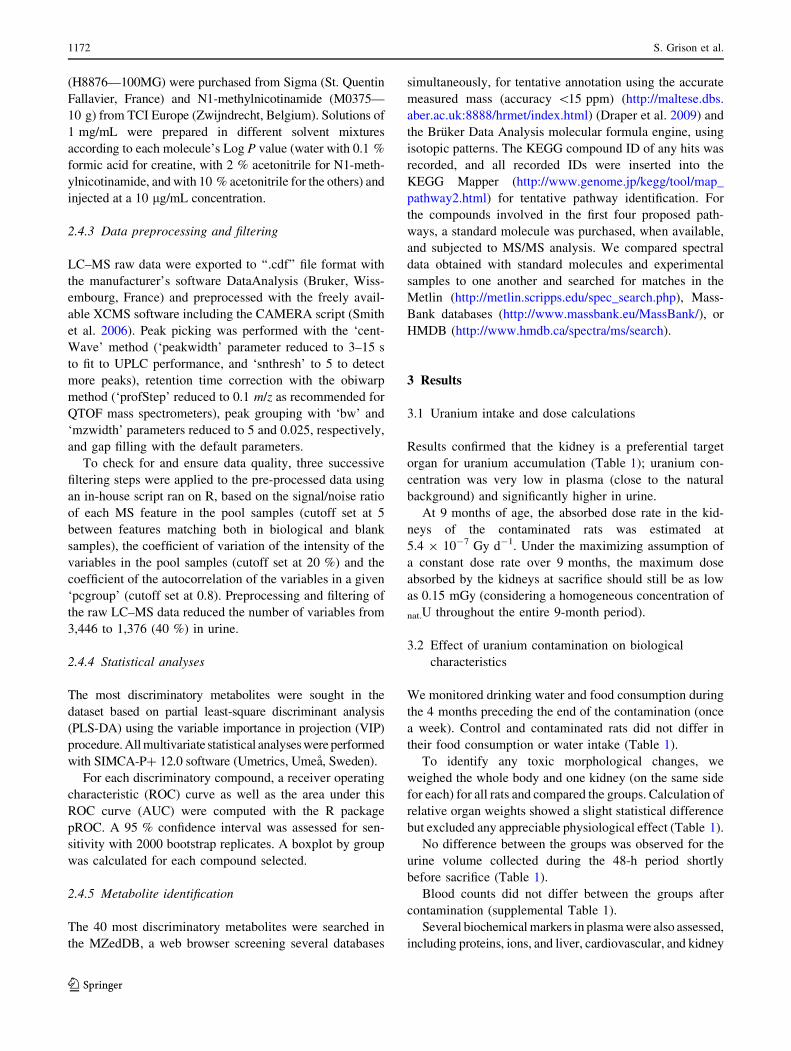
discriminatory power of the top 40 features is quite satis-
factory as their AUC under the ROC curve was above
71 % (above 80 % for the top 27). The AUC of the first
discriminatory metabolite was even 100 % (Fig. 2).
3.3.2 Urinary metabolites responsible for discriminating
between control and contaminated rats
Of the top 40 discriminatory metabolites in urine samples
(Table 2), 36 were tentatively annotated with the MZedDB
database browser, and 28 had a corresponding KEGG ID.
Fourteen of these 28 were mapped in pathways according
to the KEGG Mapper search: 8 in the tryptophan metab-
olism pathway, 7 in global metabolic pathways, and 2 in
the nicotinate and nicotinamide metabolism pathway. Eight
of these 14 molecules were available from suppliers and
purchased for further analytical confirmation.
N1-methylnicotinamide (also called trigonellinamide),
creatine and 4,6-dihydroxyquinoline were proposed to be
[M?H]1? forms of the molecules, so the target masses for
MS/MS analyses were the same for the standards and the
U50 urine sample, which had the highest intensities for
these metabolites.
The Metlin spectrum search result for N-methylnicoti-
namide was a match for both the standard and U50 sample
(supplemental Fig. 1) samples. In U50, the main fragments
obtained at 20 eV collision energy were the precursor
(m/z 137.073) and m/z 94 (loss of the carbamaldehyde
group). Such a spectrum was also found in MassBank and
HMDB. Matched retention time at 30 s between the
authentic standard and the m/z 137.07 ion trace in the urine
samples was additionally confirmatory.
The Metlin spectrum search result for creatine was also
a match for both the standard and U50 (supplemental
Fig. 2) samples. The main fragments obtained at 20 eV
collision energy were the precursor (m/z 132.07) and
m/z 90.053 (loss of the methanimidamide group). Such a
Fig. 1 Principal component analysis (PCA) performed on the 95
most discriminatory urine metabolites (VIP score C 1.8 in the PLS-
DA model built with the 1,376 urine metabolites). a Score scatter
plot; PC1 and PC2 describe 40 and 13 % of the total variance,
respectively. b Loading scatter plot; 60 % of the discriminant features
characterize the contaminated rats (left-hand side on the plot)
Metabolomics identifies a biological response 1173
123

Ta
ble
2T
op
40
met
abo
lite
sin
vo
lved
ind
iscr
imin
atin
gb
etw
een
the
con
tro
lan
dco
nta
min
ated
rats
LC
–M
SID
Sam
ple
stat
usa
Gen
erat
edfo
rmula
bA
dduct
Sig
mafi
tcppm
Chem
ical
form
ula
Iden
tifi
cati
on
Dat
abas
eID
Funct
ion
M137T
30
Contr
ol
C7H
9N
2O
[Ml?
.]1
?10.5
4.7
C7H
8N
2O
1-M
ethyln
icoti
nam
ide
C02918
Nic
oti
nat
ean
dnic
oti
nam
ide
met
aboli
sm,
regula
te
thro
mboti
cas
wel
las
infl
amm
atory
pro
cess
esin
the
card
iovas
cula
rsy
stem
M340T
269
Contr
ol
C9H
10N
O2
[M?
H]l
?0.7
5.8
C9H
9N
O2
4-(
3-P
yri
dyl)
-3-b
ute
noic
acid
moie
tyof
gly
cine-
cyst
eine
conju
gat
e
HM
DB
01424
Nic
oti
ne
deg
radat
ion
IIan
d
nic
oti
ne
deg
radat
ion
III
M136T
46
nat.U
C7H
6N
O2
[M-
NH
3?
H]1
?5.6
7C
7H
8N
2O
2N
l-M
ethyl-
2-p
yri
done-
5-
carb
oxam
ide
HM
DB
04193
Nic
oti
nat
ean
dnic
oti
nam
ide
met
aboli
smen
dpro
duct
sof
nic
oti
nam
ide-
aden
ine
din
ucl
eoti
de
(NA
D)
deg
radat
ion
M338T
217
Contr
ol
C9H
8N
O2
[M?
H]l
?3.9
11.4
C9H
7N
O2
4.6
-Dih
ydro
xyquin
oli
ne
C05639
Try
pto
phan
met
aboli
sm
M402T
328
nat.U
Unknow
n
M132T
32
Contr
ol
C4H
10N
3O
2[M
?H
]l?
3.2
17.7
C4H
9N
3O
2C
reat
ine
C00300
Gly
cine,
argin
ine,
pro
line,
seri
ne
met
aboli
sm
M143T
32
Contr
ol
C7H
15N
2O
[M?
H-
H2O
]l?
25.8
1.6
C7H
17N
2O
2N
6-M
ethyl-
L-l
ysi
ne
C02728
M185T
351
nat.U
Unknow
n
M157T
276
nat.U
C8H
13O
3[M
?H
-H
2O
]l?
26.8
0.6
C8H
14O
4S
uber
icac
idag
lyco
ne
C08278
DIc
arboxyli
cac
ids
M209T
66
Contr
ol
C10H
13N
2O
3[M
?H
-H
2O
]l?
8.8
11.3
C10H
14N
2O
4P
orp
hobil
inogen
C00931
Pro
phyri
nm
etab
oli
sm
M162T
107
Contr
ol
C9H
8N
O2
[M?
H]l
?5.9
5.1
C9H
6N
O2
4.6
-Dih
ydro
xy
quin
oli
ne
C05639
Try
pto
phan
met
aboli
sm
M129T
328
nat.U
C7H
13O
2[M
-H
CO
2H
?H
]1?
8.3
6.3
C8H
14O
4S
uber
icac
id
moie
ty(d
esulf
ated
)
C08278
Dic
arboxyli
cac
ids
M175T
277
nat.U
C8H
15O
4[M
?H
]l?
18.6
3.9
C8H
14O
4S
uber
icac
idC
08278
Dic
arboxyli
cac
ids
M175T
451
Contr
ol
C13H
19
[M-
2H
2O
?H
]1?
10.4
1.6
C13H
22O
23Z
.5E
-tri
dec
adie
noic
acid
agly
cone
(glu
curo
nid
e)
Lip
idm
etab
oli
sm
M257T
384
Contr
ol
Unknow
nag
lyco
ne
M299T
496
Contr
ol
C18H
19O
4[M
?H
]l?
5.6
2.3
C18H
18O
47C
-agly
cone
HM
DB
04808
Phyll
oquin
one
(Vit
amin
K1)
and
men
aquin
ones
(Vit
amin
K2)
met
aboli
sm
M164T
347
nat.U
Unknow
n
M164T
420
Contr
ol
C9H
10N
O2
Des
ulf
ated
moie
ty
[M?
H]1
?
33.7
5.5
C9H
9N
O2
4-(
3-P
yri
dyl)
-3-b
ute
noic
acid
moie
ty(d
esulf
ated
)
HM
DB
01424
Nic
oti
ne
deg
radat
ion
IIan
d
nic
oti
ne
deg
radat
ion
III
M316T
348
nat.U
Unknow
n
M342T
284
Contr
ol
Unknow
n
M161T
287
nat.U
C8H
15O
2[M
?H
]l?
15.4
9.9
C8H
16O
3H
ydro
xyoct
anoic
acid
(agly
cone)
HM
DB
00711
Fat
tyac
idm
etab
oli
sm
M143T
287
nat.U
C8H
15O
2[M
?H
-H
2O
]l?
15.4
9.9
C8H
16O
3H
ydro
xyoct
anoic
acid
(agly
cone)
HM
DB
00711
Fat
tyac
idm
etab
oli
sm
M175T
269
nat.U
C8H
15O
4[M
?H
]l?
33.2
0.2
C8H
14O
4S
uber
icac
idm
oie
ty
(cyst
eine-
gly
cine
conju
gat
e)
C08278
M389T
275
nat.U
Unknow
n
1174 S. Grison et al.
123

Ta
ble
2co
nti
nu
ed
LC
–M
SID
Sam
ple
stat
usa
Gen
erat
edfo
rmula
bA
dduct
Sig
mafi
tcppm
Chem
ical
form
ula
Iden
tifi
cati
on
Dat
abas
eID
Funct
ion
M311T
347
nat.U
Unknow
n
M181T
346
nat.U
Unknow
n
M447T
410
Contr
ol
C15H
11O
5[M
?H
]l?
6.7
4.4
C15H
10O
5F
lavonoid
-glu
curo
nid
eC
10023
Fla
vonoid
s
M164T
188
Contr
ol
C9H
10O
2[M
?H
]l?
13.4
15.8
C9H
9N
O2
4-(
3-P
yri
dyl)
-3-b
ute
noic
acid
HM
DB
01424
Nic
oti
ne
deg
radat
ion
IIan
d
nic
oti
ne
deg
radat
ion
III
M461T
347
Contr
ol
C16H
13O
5[M
?H
]l?
10.3
11.7
C16H
12O
5F
lavonoid
-glu
curo
nid
eC
10047
Fla
vonoid
s
M153T
47
nat.U
C7H
9N
2O
2[M
?H
]l?
13.1
2.5
C7H
8N
2O
2N
l-M
ethyl-
2-p
yri
done-
5-
carb
oxam
ide
C05842
Nic
oti
nat
ean
dnic
oti
nam
ide
met
aboli
sm,
det
erio
rati
on
of
kid
ney
funct
ion
M206T
158
Contr
ol
C10H
8N
O4
[M?
H]l
?8.3
2.8
C10H
7N
O4
6-h
ydro
xykynure
nat
eC
05663
Try
pto
phan
met
aboli
sm
M146T
262
nat.U
C9H
8N
O[M
-C
O2?
H]l
?4.2
4.1
C10H
9N
O3
5-H
ydro
xyin
dole
acet
icac
idC
05635
Try
pto
phan
met
aboli
sm
M385T
423
nat.U
Unknow
nglu
curo
nid
e
M174T
296
nat.U
C10H
8N
O2
[M-
H2O
?JH
]1?
10.5
2.2
C10H
7N
O2
Quin
aldic
acid
C06325
Try
pto
phan
cata
boli
smvia
kynure
nic
acid
M162T
164
nat.U
C9H
8N
O2
[M-
CO
2?
H]l
?5.6
2.1
C10H
7N
O4
Xan
thure
nic
acid
C02470
Try
pto
phan
cata
boli
sm
M146T
323
Contr
ol
Unknow
n
M387T
432
nat.U
C16H
28N
aO9
[M?
Na]
l?15.6
13.5
C10H
20O
3H
ydro
xy-d
ecan
oic
acid
agly
cone
(glu
curo
nid
e)
LM
FA
0105015
Fat
tyac
idm
etab
oli
sm
M197T
324
nat.U
Unknow
n
M373T
270
nat.U
C17H
21N
4O
6[M
?H
]l?
62.1
C17H
2O
N4O
6R
ibofl
avin
C00255
Rib
ofl
avin
met
aboli
sm
Lis
ted
from
the
PL
S-D
Am
odel
buil
ton
the
var
iable
sex
hib
itin
ga
VIP
score
C1.8
aM
ost
lyab
undan
tin
indic
ated
sam
ple
type
bF
orm
ula
calc
ula
ted
from
the
accu
rate
mas
san
dth
esi
gm
a-fi
tsc
ore
by
dat
aan
alysi
sc
Mas
sac
cura
cyre
late
dto
isoto
pic
dec
ay(s
igm
afi
t\20
isco
nsi
der
edas
rele
van
t)
Metabolomics identifies a biological response 1175
123
spectrum was also found in MassBank and HMDB.
Another fragment, m/z 111.057, is present in U50 at a high
intensity (and also in MassBank database at a much lower
intensity). The commensurate increase of creatine peak
height at 31 s by spiking the urine sample with various
amount of an authentic standard also brought a supple-
mentary chromatographic confirmation.
There was no spectrum match for 4,6-dihydroxyquino-
line in either Metlin, MassBank or HMDB, due to the lack
of MS/MS data in these databases for this particular
compound. Nevertheless two quite superimposable frag-
ment spectra were obtained for the standard and U50
samples at 138.6 s retention time (supplemental Fig. 3).
The main fragments obtained at 20 eV collision energy
were the precursor ion (m/z 162.05) and a fragment at
m/z 144.05 (loss of a water molecule). Spiking the urine
sample with the authentic standard also brought a chro-
matographic confirmation.
MZedDB proposed adduct/fragment ions for 5-hydrox-
yindoleacetic acid, the other tentatively annotated
molecules. The Metlin spectrum search result was a match
for both the standard and (supplemental Fig. 4) samples:
both fragment and precursor were clearly co-detected in the
urine sample, at the same retention time. The main frag-
ments obtained at 10 eV collision energy were the pre-
cursor (m/z 192.07) and an ion at m/z 146.06 (loss of a
formic acid molecule). Such a spectrum was also found in
HMDB, but there was no QTOF spectrum in MassBank for
this metabolite. At 30 eV, 2 other fragments appeared in
the standard: m/z 128.05 (loss of a carbonic acid) and
118.07 (loss of a formaldehyde group from the 146.06 ion).
Again spiking the urine sample with increasing amount of
an authentic standard additionally argued for identification
(supplemental Fig. 4).
According to the minimum metadata relative to metab-
olite identification of non-novel compounds proposed by
the metabolomics standard initiative (Sumner et al. 2007),
we have thus far identified 4 metabolites, the concentra-
tions of which were modified after chronic low-dose
uranium contamination: 1-methylnicotinamide, creatine,
Fig. 2 Receiver operating
characteristic (ROC) curve and
area under the curve (AUC) of
the 4 metabolites identified
among the top 40 for
discriminating the control from
the contaminated rats.
According to their VIP score,
these metabolites were ranked
1st (M137T30), 6th (M132T32),
11th (M162T107) and 32th
(M146T272)
1176 S. Grison et al.
123

4,6-dihydroxyquinoline (reduced concentration in the urine
of contaminated rats) and 5-hydroxyindoleacetic acid
(increased concentration in the urine of the contaminated
rats).
4 Discussion
Thus far, experimental studies of rat models exposed to
chronic low-dose uranium contamination have shown
metabolic changes without the onset of any morbidity. For
example, targeted analysis of biochemical systems has
revealed deregulation of the xenobiotic, cytochrome P450,
Vitamin D, cholesterol, iron, and acetyl choline metabo-
lisms (Berradi et al. 2008; Bussy et al. 2006; Gueguen et al.
2007; Racine et al. 2010; Souidi et al. 2005; Tissandie et al.
2007). Nevertheless, documentation of the effects of low-
dose nat.U contamination remains poor, likely due to the
difficulty in demonstrating any health impact of a com-
pound absorbed at a very low dose, possibly over a long
period. A very sensitive method is required to investigate
such potentially low-grade effects. We previously applied
untargeted metabolomics in similar conditions to examine
chronic low-dose 137Cs contamination and found that this
approach showed promise for revealing metabolic disrup-
tion where other conventional methods failed to discrimi-
nate between exposed and unexposed rats (Grison et al.
2012).
Here, we sought to evaluate the effects of chronic low-
dose exposure to nat.U on rat health, both with conventional
toxicological tests, such as organ weighing and urine/
plasma biochemical assays, and with a metabolomic
approach based on analysis of urinary LC–MS profiles. To
mimic the potential natural exposure of human populations,
rats were chronically contaminated through drinking water
at a daily intake of about 1 mg per animal. This dose
corresponds to three times as much as the maximum nat-
ural concentration measured in Finnish wells and can be
considered a realistic level of natural contamination
(Salonen 1994). Moreover, no renal toxicity has been
demonstrated at this dose in rats.
As previously described after 9 months of uranium
contamination (Souidi et al. 2005), our results confirmed
the absence of disease in these animals. Measurements of
standard clinical biomarkers and biometric variables during
and after treatment were similar in both experimental
groups. We did not observe any problem such as anorexia,
substantial weight loss, or macroscopically observable
tissue damage (including in the kidneys, which are well
known as a biological target of uranium in acute high-dose
contamination) and were thus able to rule out any deteri-
oration in health status. Nor did we observe any imbalance
between the groups for CBC, in hepatic, heart, and kidney
enzyme activities, or in lipid, protein, and ion concentra-
tions in plasma. Markers of potential nephropathy, such as
urine volume, liver enzyme concentration, carbohydrates
and creatinine clearance were also measured and showed
no changes (the few statistically significant changes
observed nonetheless still remained within the range of
physiologically normal).
It is well recognized that uranium has a dual toxicity,
radiological (as an alpha emitter) and chemical (as a heavy
metal) (Craft et al. 2004). When it includes substantial
proportions of isotope 234 or 235, as enriched uranium
does, it may be more radiologically than chemically toxic.
For depleted or nat.U, however, chemical toxicity is more
important. Our data confirmed the absence of both types of
toxicity. In fact, the low renal burden of uranium (around
300 ng/g of tissue) in this study, compared to the 3 lg/g
value traditionally assumed as the threshold of renal tox-
icity (Leggett 1989), confirms the low-dose nature of the
contamination of the rats in this study, as does the very low
total absorbed dose calculated (150 lGy). In conclusion,
this level of contamination is consistent with the measured
renal effects, which did not demonstrate any associated
disease or deterioration in general health status after
9 months of contamination with nat.U.
Nonetheless, the absence of toxicity does not imply a
lack of biological effects that might be detected by more
sensitive techniques. This was clearly demonstrated when
we used metabolomics to identify chronic low-dose expo-
sure to cesium 137. As with 137Cs, the metabolomics
approach applied here was quite able to discriminate the
control animals from the uranium-contaminated rats. Ura-
nium, as a heavy metal, accumulates specifically in target
organs, especially the kidneys (Paquet et al. 2006). The
significant discrimination between nat.U non-exposed and
exposed rats that we found in urine thus appears consistent
with tubular accumulation of uranium and its consequent
nephrotoxicity on exposure to higher doses (Blantz 1975;
Haley et al. 1982). A similar metabolomics plasma inves-
tigation would be nevertheless worth to perform.
The most discriminatory metabolite was identified as N1-
methylnicotinamide, found at a concentration seven times
higher in the urine of control versus contaminated rats. A
decrease in this metabolite has previously been described as
an indicator of induced nephropathy, by administration of a
single high dose of uranium (Shim et al. 1984). Our results
might thus suggest early biological nephron response after
9 months of chronic low-dose ingestion of nat.U. They also
indicate that the nicotinamide pathway is a potential target
for uranium. For instance, the urine content of several
metabolites belonging to this pathway were changed by nat.U
contamination. Among them was N1-methyl-pyridone-
5carboxamide that increased by nat.U (Table 2), which is the
product of N1-methylnicotinamide oxydo-reduction by the
Metabolomics identifies a biological response 1177
123

aldehyde oxidase EC:1.2.3.1 (supplemental Fig. 5). Thus
suggesting that this converting enzyme can be a target for
nat.U biological effect. In addition, as pointed out above
uranium interferes with the cytochrome P450, Vitamin D,
cholesterol, and xenobiotic metabolisms: all these pathways
use the enzyme cofactor nicotinamide adenine dinucleotide
phosphate (NADP). Further targeted searches on this path-
way would probably be especially useful to decrypt the
underlying mechanisms by which uranium acts on these
metabolisms.
We also identified creatine, 4,6-dihydroxyquinoline, and
5-hydroxyindoleacetic acid as highly discriminatory fea-
tures (ranked 6th, 11th, and 32nd in the PLS-DA model,
respectively). Based on these identified metabolites and 10
tentatively annotated ones (based on database searching),
chronic low-dose nat.U contamination appears to affect
mainly the tryptophan and the nicotinamide metabolism
pathways. N1-methylnicotinamide alone allowed 100 %
discrimination with 100 % specificity and selectivity.
Nevertheless, the risk of inaccuracy in relying on only one
bioindicator could be high, since conditions other than
uranium contamination might affect the level of this
metabolite in urine. It would thus be wiser to use a com-
bination of bioindicators, so that the potential failure of one
would be offset by the others in the calculation of a global
score reflecting uranium contamination more specifically.
Such a strategy would be advantageous for designing a
diagnostic test. In that perspective, we used the top 40
discriminatory metabolites from the PLS-DA model to
build a composite score, and calculated its AUC under the
ROC curve; this reached 98 % (CI 92–100 %) (Fig. 3).
In conclusion, this study confirms that the application of
metabolomics is relevant to the field of chronic low-dose
radiotoxicology, more so than more traditional techniques
that lack sensitivity and seem unsuitable to exploring rel-
atively minor or uneventful biological effects. Further work
is needed to validate our findings. Such work should
include a replication study with validation cohorts, radio-
nuclide dose–response assessment, contamination kinetics,
and a comparison of response by sex to investigate the
physiological mechanisms responsible for the biological
changes highlighted by metabolomics. The intensity of the
biological effects measured and whether it exceeds the
threshold of disease must also be clarified.
The noninvasive use of urine as a reproducible biofluid
and validation of our other findings should make it possible
to design a diagnostic tool able to sort populations poten-
tially contaminated by environmental nat.U.
Acknowledgments This study was part of the ENVIRHOM
research program supported by the Institut de Radioprotection et de
Surete Nucleaire (IRSN). We wish to thank F. Voyer and T. Loiseau
for expert animal care and J.-M. Bertho for reviewing the manuscript.
Open Access This article is distributed under the terms of the
Creative Commons Attribution License which permits any use, dis-
tribution, and reproduction in any medium, provided the original
author(s) and the source are credited.
References
Arogunjo, A. M., Hollriegl, V., Giussani, A., Leopold, K., Gerstmann,
U., Veronese, I., et al. (2009). Uranium and thorium in soils,
mineral sands, water and food samples in a tin mining area in
Nigeria with elevated activity. Journal of Environmental
Radioactivity, 100(3), 232–240.
Berradi, H., Bertho, J. M., Dudoignon, N., Mazur, A., Grandcolas, L.,
Baudelin, C., et al. (2008). Renal anemia induced by chronic
ingestion of depleted uranium in rats. Toxicological Sciences,
103(2), 397–408.
Blantz, R. C. (1975). The mechanism of acute renal failure after
uranyl nitrate. [Clinical Trial Research Support, US Gov’t, Non-
P.H.S. Research Support, US Gov’t, P.H.S.]. Journal of Clinical
Investigation, 55(3), 621–635. doi:10.1172/JCI107970.
Fig. 3 Receiver operating
characteristic (ROC) curve, area
under the curve (AUC), and box
plots of the composite score
built on the top 40 metabolites
discriminating the control from
the contaminated rats
1178 S. Grison et al.
123
Bleise, A., Danesi, P. R., & Burkart, W. (2003). Properties, use and
health effects of depleted uranium (DU): A general overview.
Journal of Environmental Radioactivity, 64(2–3), 93–112.
Briner, W. (2010). The toxicity of depleted uranium. International
Journal of Environmental Research and Public Health, 7(1),
303–313.
Bussy, C., Lestaevel, P., Dhieux, B., Amourette, C., Paquet, F.,
Gourmelon, P., et al. (2006). Chronic ingestion of uranyl nitrate
perturbs acetylcholinesterase activity and monoamine metabo-
lism in male rat brain. Neurotoxicology, 27(2), 245–252.
Corona, G., Rizzolio, F., Giordano, A., & Toffoli, G. (2012).
Pharmaco-metabolomics: an emerging ‘‘omics’’ tool for the
personalization of anticancer treatments and identification of
new valuable therapeutic targets. Journal of Cellular Physiology,
227(7), 2827–2831.
Craft, E., Abu-Qare, A., Flaherty, M., Garofolo, M., Rincavage, H., &
Abou-Donia, M. (2004). Depleted and natural uranium: chem-
istry and toxicological effects. Journal of Toxicology and
Environmental Health, Part B. Critical Reviews, 7(4), 297–317.
De Santis, M., Cesari, E., Nobili, E., Straface, G., Cavaliere, A. F., &
Caruso, A. (2007). Radiation effects on development. Birth
Defects Research Part C: Embryo Today, 81(3), 177–182.
Draper, J., Enot, D. P., Parker, D., Beckmann, M., Snowdon, S., Lin,
W., et al. (2009). Metabolite signal identification in accurate
mass metabolomics data with MZedDB, an interactive m/z
annotation tool utilising predicted ionisation behaviour ‘rules’.
BMC Bioinformatics, 10, 227.
Dublineau, I., Grandcolas, L., Grison, S., Baudelin, C., Paquet, F.,
Voisin, P., et al. (2007). Modifications of inflammatory pathways
in rat intestine following chronic ingestion of depleted uranium.
[Research Support, Non-US Gov’t]. Toxicological Sciences,
98(2), 458–468. doi:10.1093/toxsci/kfm132.
Dublineau, I., Grison, S., Grandcolas, L., Baudelin, C., Tessier, C.,
Suhard, D., et al. (2006). Absorption, accumulation and biolog-
ical effects of depleted uranium in Peyer’s patches of rats. [In
Vitro Research Support, Non-US Gov’t]. Toxicology, 227(3),
227–239. doi:10.1016/j.tox.2006.08.010.
Ejnik, J. W., Hamilton, M. M., Adams, P. R., & Carmichael, A. J.
(2000). Optimal sample preparation conditions for the determi-
nation of uranium in biological samples by kinetic phosphores-
cence analysis (KPA). Journal of Pharmaceutical and
Biomedical Analysis, 24(2), 227–235.
European-Commission. (2011). EUR 24756 EN - Study on the longer-
term impact of European Union funding of research in the field
of Environment and Health. Luxembourg: Publications Office of
the European Union.
Feugier, A., Frelon, S., Gourmelon, P., & Claraz, M. (2008). Alteration
of mouse oocyte quality after a subchronic exposure to depleted
Uranium. Reproductive Toxicology, 26(3–4), 273–277.
Gagnaire, B., Adam-Guillermin, C., Bouron, A., & Lestaevel, P.
(2010). The effects of radionuclides on animal behavior. Reviews
of Environmental Contamination and Toxicology, 210, 35–58.
Griffin, J. L., Walker, L. A., Shore, R. F., & Nicholson, J. K. (2001).
Metabolic profiling of chronic cadmium exposure in the rat.
Chemical Research in Toxicology, 14(10), 1428–1434.
Grison, S., Martin, J. C., Grandcolas, L., Banzet, N., Blanchardon, E.,
Tourlonias, E., et al. (2012). The metabolomic approach
identifies a biological signature of low-dose chronic exposure
to cesium 137. Journal of Radiation Research, 53(1), 33–43.
Gueguen, Y., Grandcolas, L., Baudelin, C., Grison, S., Tissandie, E.,
Jourdain, J. R., et al. (2007). Effect of acetaminophen admin-
istration to rats chronically exposed to depleted uranium.
Toxicology, 229(1–2), 62–72.
Haley, D. P., Bulger, R. E., & Dobyan, D. C. (1982). The long-term
effects of uranyl nitrate on the structure and function of the rat
kidney. [Research Support, US Gov’t, P.H.S.]. Virchows Archiv.
B, Cell pathology including molecular pathology, 41(1–2),
181–192.
Handley-Sidhu, S., Keith-Roach, M. J., Lloyd, J. R., & Vaughan, D. J.
(2010). A review of the environmental corrosion, fate and
bioavailability of munitions grade depleted uranium. Science of
the Total Environment, 408(23), 5690–5700.
Kathren, R. L., & Burklin, R. K. (2008). Acute chemical toxicity of
uranium. Health Physics, 94(2), 170–179.
Leggett, R. W. (1989). The behavior and chemical toxicity of U in the
kidney: a reassessment. [Review]. Health Physics, 57(3), 365–383.
Lestaevel, P., Romero, E., Dhieux, B., Ben Soussan, H., Berradi, H.,
Dublineau, I., et al. (2009). Different pattern of brain pro-/anti-
oxidant activity between depleted and enriched uranium in
chronically exposed rats. Toxicology, 258(1), 1–9.
Magdo, H. S., Forman, J., Graber, N., Newman, B., Klein, K., Satlin,
L., et al. (2007). Grand rounds: nephrotoxicity in a young child
exposed to uranium from contaminated well water. [Case
Reports Research Support, N.I.H., Extramural Research Support,
Non-US Gov’t Research Support, US Gov’t, Non-P.H.S.].
Environmental Health Perspectives, 115(8), 1237–1241. doi:
10.1289/ehp.9707.
Paquet, F., Houpert, P., Blanchardon, E., Delissen, O., Maubert, C.,
Dhieux, B., et al. (2006). Accumulation and distribution of
uranium in rats after chronic exposure by ingestion. Health
Physics, 90(2), 139–147.
Racine, R., Grandcolas, L., Grison, S., Stefani, J., Delissen, O.,
Gourmelon, P., et al. (2010). Cholesterol 7alpha-hydroxylase
(CYP7A1) activity is modified after chronic ingestion of
depleted uranium in the rat. Journal of Steroid Biochemistry
and Molecular Biology, 120(1), 60–66.
Salonen, L. (1994). 238U series radionuclides as a source of increased
radioactivity in groundwater originating from Finnish bedrock:
Proceedings of the Helsinki Conference. IAHS Publ, 222, 71.
Schwenk, M., Gundert-Remy, U., Heinemeyer, G., Olejniczak, K.,
Stahlmann, R., Kaufmann, W., et al. (2003). Children as a
sensitive subgroup and their role in regulatory toxicology: DGPT
workshop report. Archives of Toxicology, 77(1), 2–6.
Senn, T., Hazen, S. L., & Tang, W. H. (2012). Translating
metabolomics to cardiovascular biomarkers. [Research Support,
N.I.H., Extramural Review]. Progress in Cardiovascular Dis-
eases, 55(1), 70–76. doi:10.1016/j.pcad.2012.06.004.
Shim, C. K., Sawada, Y., Iga, T., & Hanano, M. (1984). Estimation of
renal secretory function for organic cations by endogenous N1-
methylnicotinamide in rats with experimental renal failure.
Journal of Pharmacokinetics and Biopharmaceutics, 12(1),
23–42.
Smith, C. A., Want, E. J., O’Maille, G., Abagyan, R., & Siuzdak, G.
(2006). XCMS: processing mass spectrometry data for metab-
olite profiling using nonlinear peak alignment, matching, and
identification. Analytical Chemistry, 78(3), 779–787.
Souidi, M., Gueguen, Y., Linard, C., Dudoignon, N., Grison, S.,
Baudelin, C., et al. (2005). In vivo effects of chronic contam-
ination with depleted uranium on CYP3A and associated nuclear
receptors PXR and CAR in the rat. Toxicology, 214(1–2),
113–122.
Souidi, M., Tissandie, E., Racine, R., Ben Soussan, H., Rouas, C.,
Grignard, E., et al. (2009). Uranium: Properties and biological
effects after internal contamination. Annals of Clinical Biology
(Paris), 67(1), 23–38.
Sumner, L. W., Amberg, A., Barrett, D., Beale, M. H., Beger, R.,
Daykin, C. A., et al. (2007). Proposed minimum reporting
standards for chemical analysis. Metabolomics, 3(3), 211–221.
Tissandie, E., Gueguen, Y., Lobaccaro, J. M., Grandcolas, L., Voisin,
P., Aigueperse, J., et al. (2007). In vivo effects of chronic
contamination with depleted uranium on vitamin D3 metabolism
in rat. Biochimica et Biophysica Acta, 1770(2), 266–272.
Metabolomics identifies a biological response 1179
123
Wade-Gueye, N. M., Delissen, O., Gourmelon, P., Aigueperse, J.,
Dublineau, I., & Souidi, M. (2012). Chronic exposure to natural
uranium via drinking water affects bone in growing rats.
[Comparative Study Research Support, Non-US Gov’t]. Biochi-
mica et Biophysica Acta, 1820(7), 1121–1127. doi:10.1016/
j.bbagen.2012.04.019.
Wang, L., & Pinkerton, K. E. (2007). Air pollutant effects on fetal and
early postnatal development. Birth Defects Research Part C:
Embryo Today, 81(3), 144–154.
Wappelhorst, O., Kuhn, I., Heidenreich, H., & Markert, B. (2002).
Transfer of selected elements from food into human milk.
Nutrition, 18(4), 316–322.
Zhang, A., Sun, H., & Wang, X. (2012). Serum metabolomics as a
novel diagnostic approach for disease: a systematic review.
[Research Support, Non-US Gov’t]. Analytical and Bioanalyt-
ical Chemistry, 404(4), 1239–1245. doi:10.1007/s00216-012-
6117-1.
1180 S. Grison et al.
123


![Disease monitoring of hepatocellular carcinoma through ... · Metabolomics as an HCC biomarker discovery tool ... amino acid, and lipid metabolism[25,26], chronic liver diseases undoubtedly](https://img.pdfslide.us/doc/110x75/5f8d7d5eeaebff027b23dc44/disease-monitoring-of-hepatocellular-carcinoma-through-metabolomics-as-an-hcc.jpg)


![Metabolomics Basics[1]](https://img.pdfslide.us/doc/110x75/553de2815503466f378b4864/metabolomics-basics1.jpg)