Embed Size (px)
Citation preview
Metabolomic and transcriptomicdata analysis of
Bioplastic-producing Arabidopsis using R, exploRase and GGobi
Iowa State University
Suh-Yeon Choi, Michael Lawrence, Dianne Cook,Heike Hofmann, Lauralynn Kourtz, Kristi Snell,
Basil J. Nikolau and Eve Syrkin Wurtele
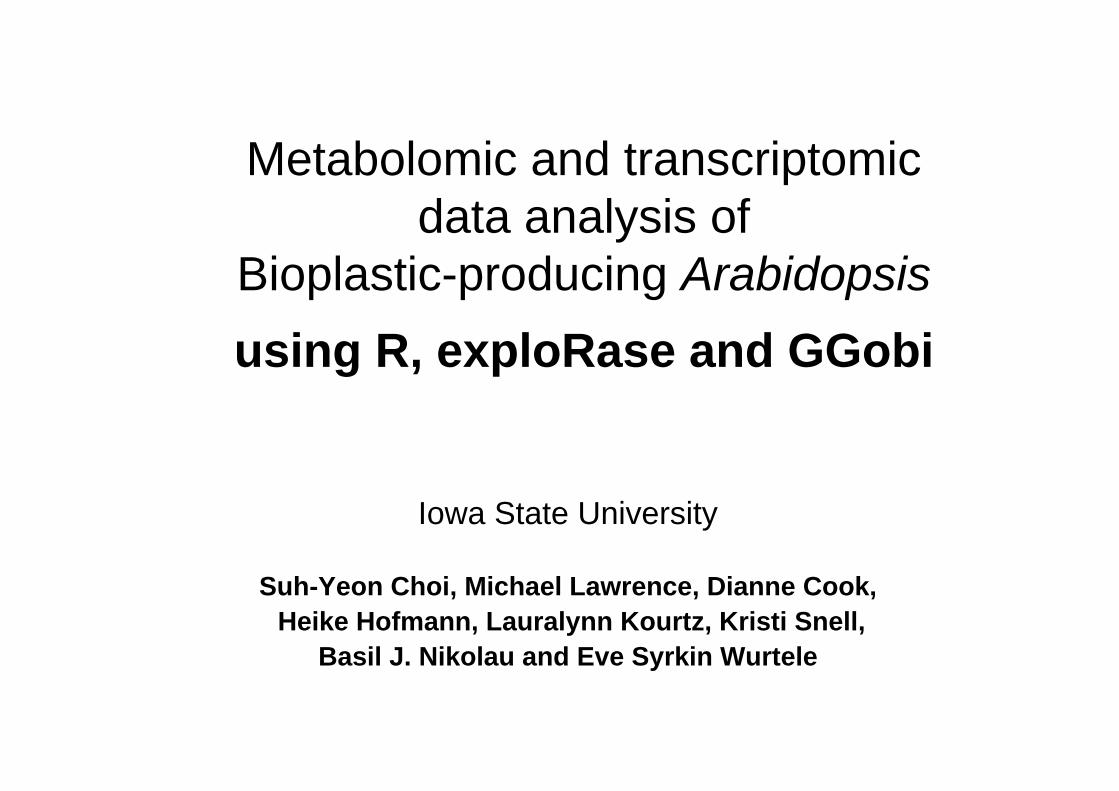
o Introduction to bioplastic-producing plants
o Challenges in metabolomic data analysis
o Development of R based preprocessing tool for metabolomic data analysis
o Omics data analysis using exploRase
Outline
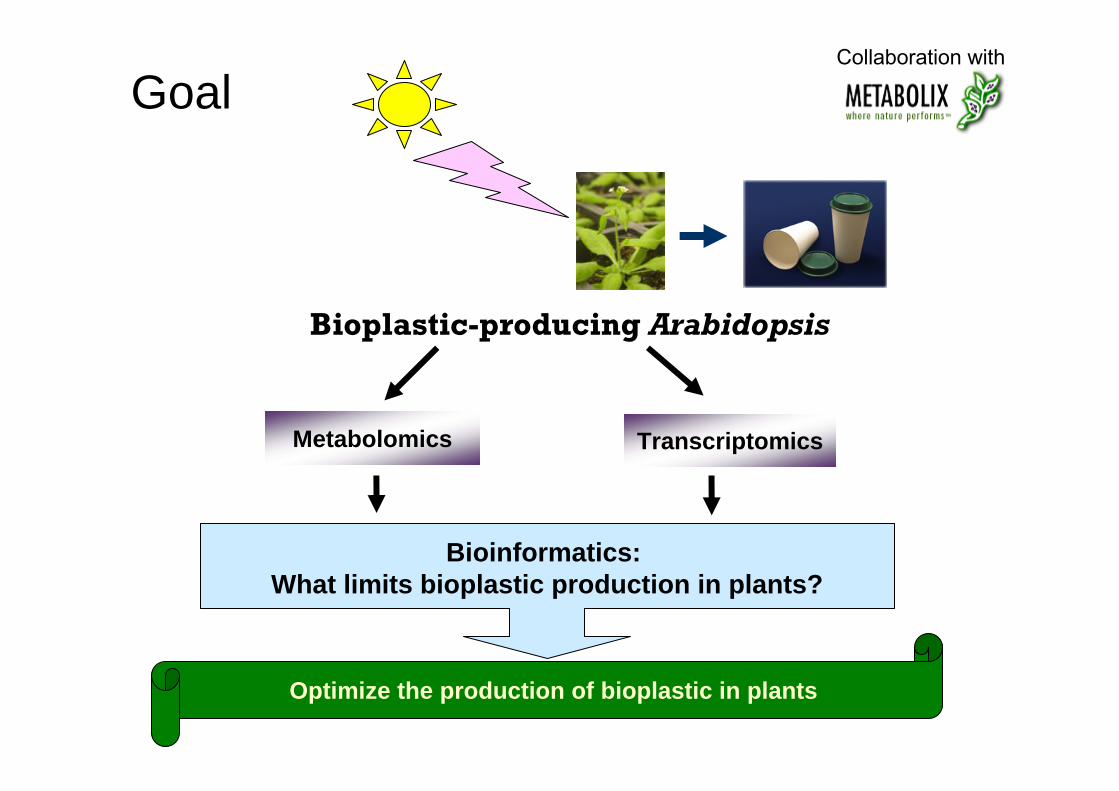
Bioinformatics: What limits bioplastic production in plants?
Bioplastic-producing Arabidopsis
TranscriptomicsMetabolomics
Optimize the production of bioplastic in plants
Collaboration with
Goal
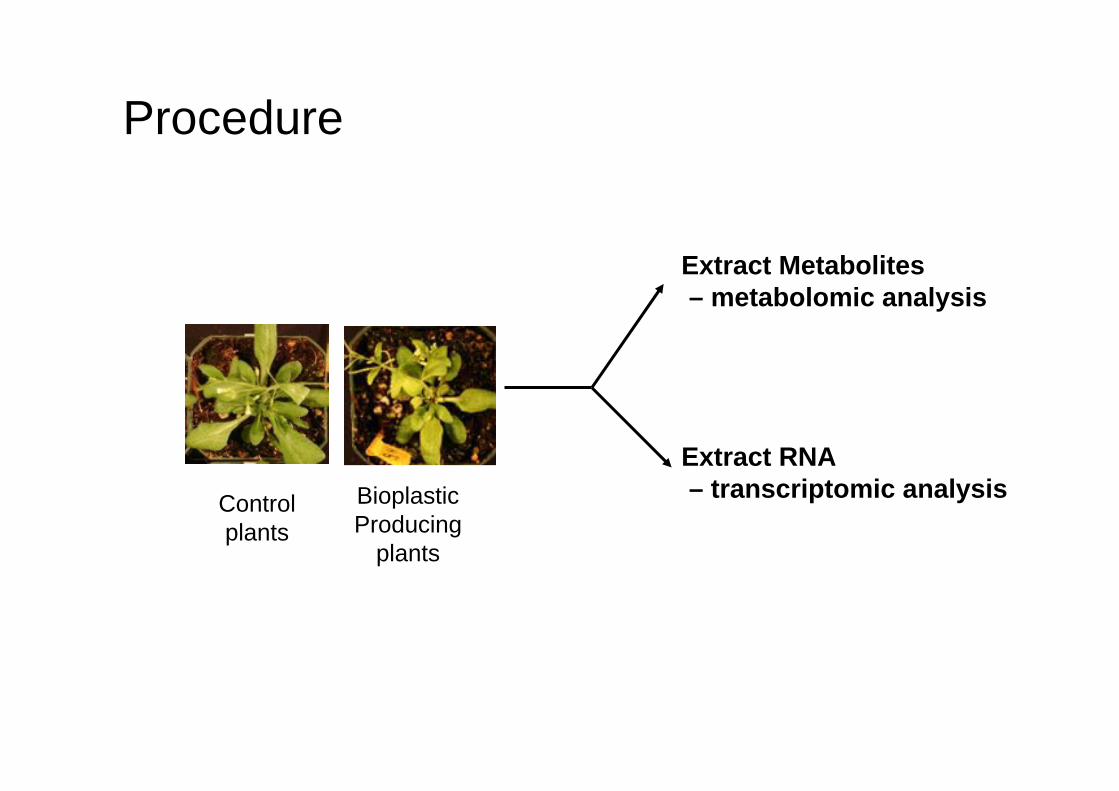
Procedure
CONT
CONT
CONT
BioplasticProducing
plants
Extract RNA – transcriptomic analysis
Extract Metabolites – metabolomic analysis
Controlplants
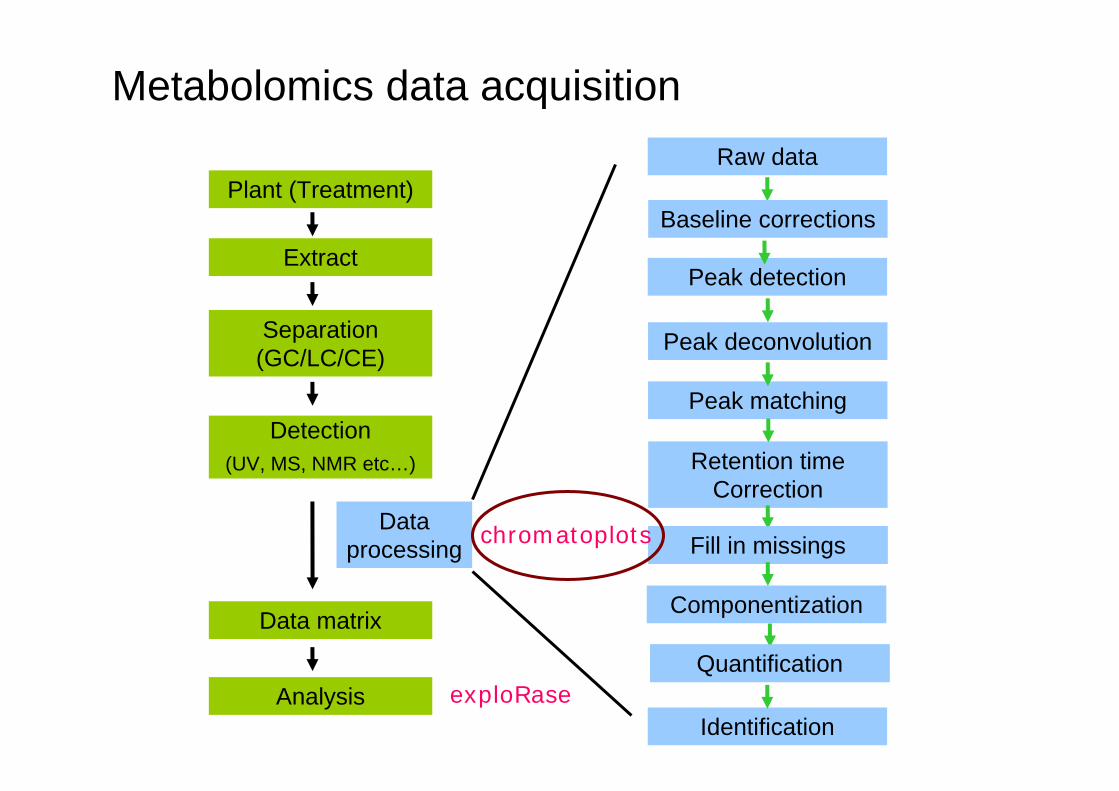
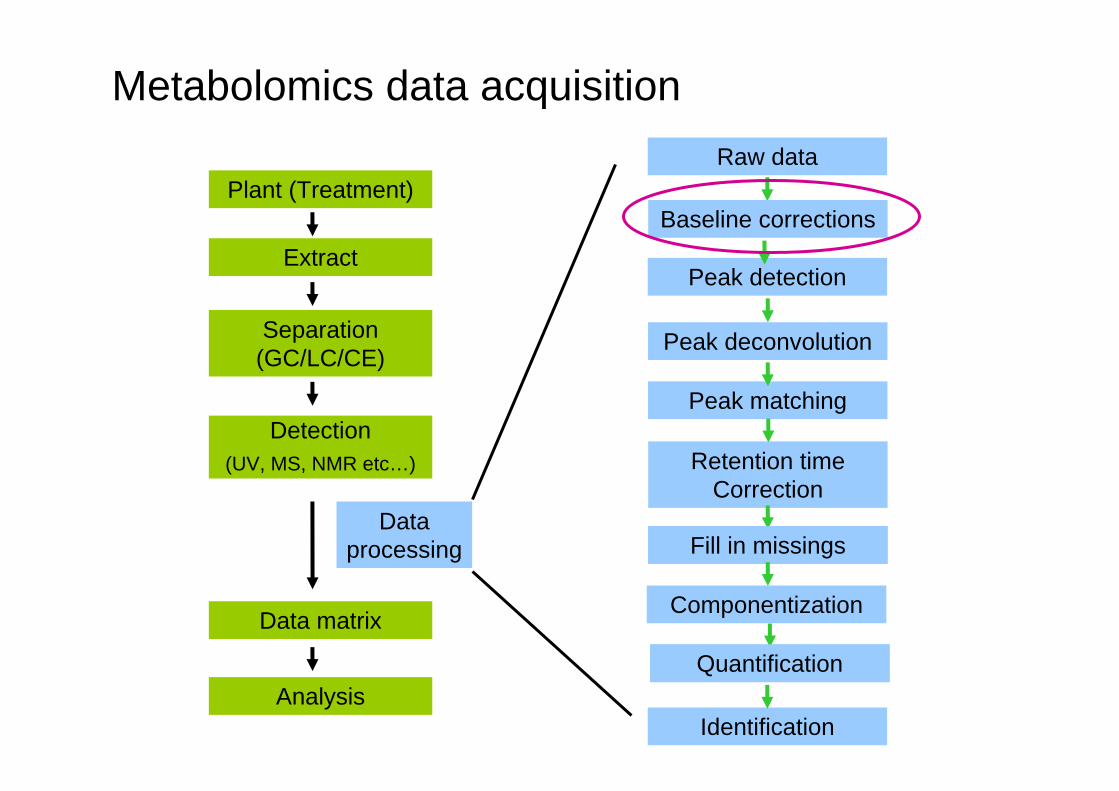
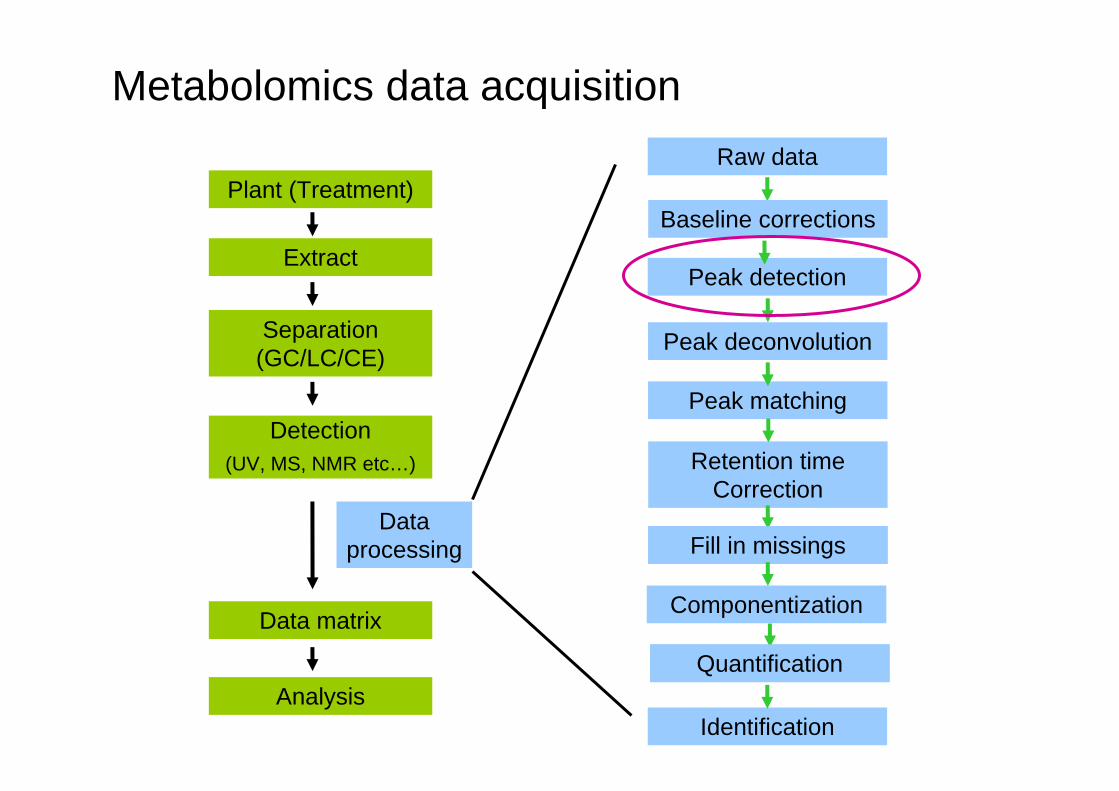
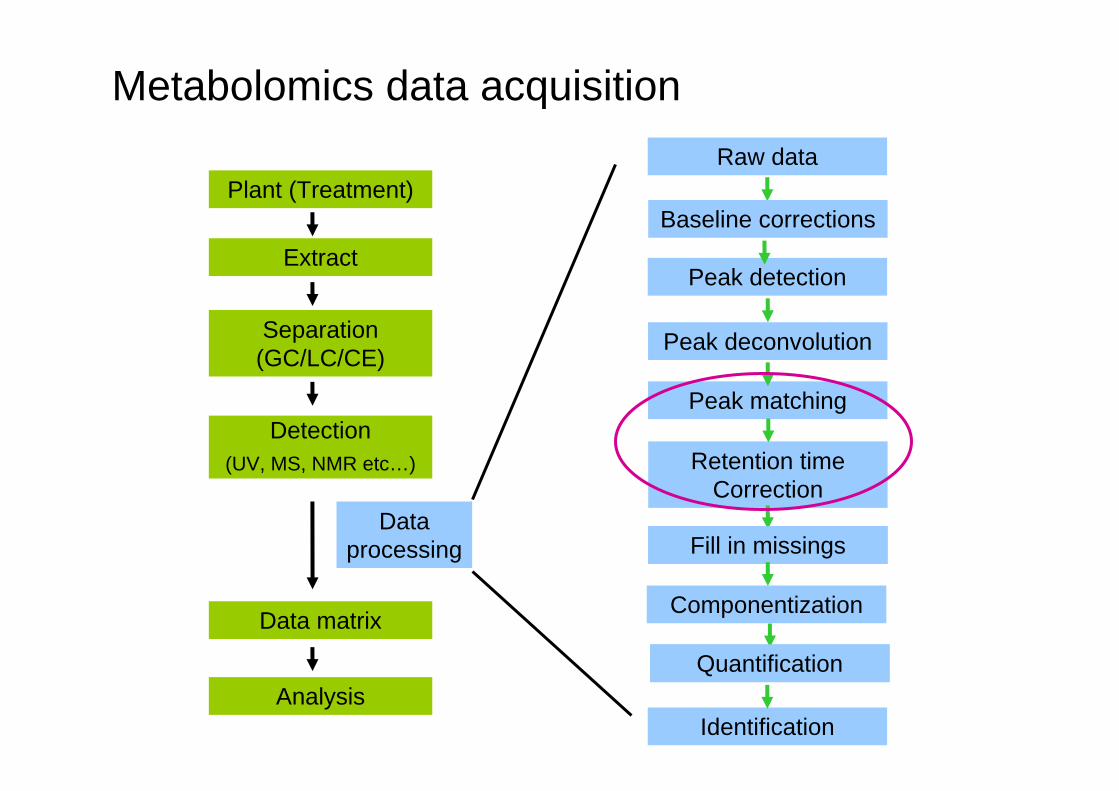
Metabolomics data acquisition
Plant (Treatment)
Extract
Separation (GC/LC/CE)
Detection(UV, MS, NMR etc…)
Data processing
Data matrix
Analysis
Raw data
Peak detection
Peak deconvolution
Quantification
Peak matching
Identification
Retention time Correction
Componentization
Baseline corrections
Quantification
QuantificationFill in missingschromatoplots
exploRase
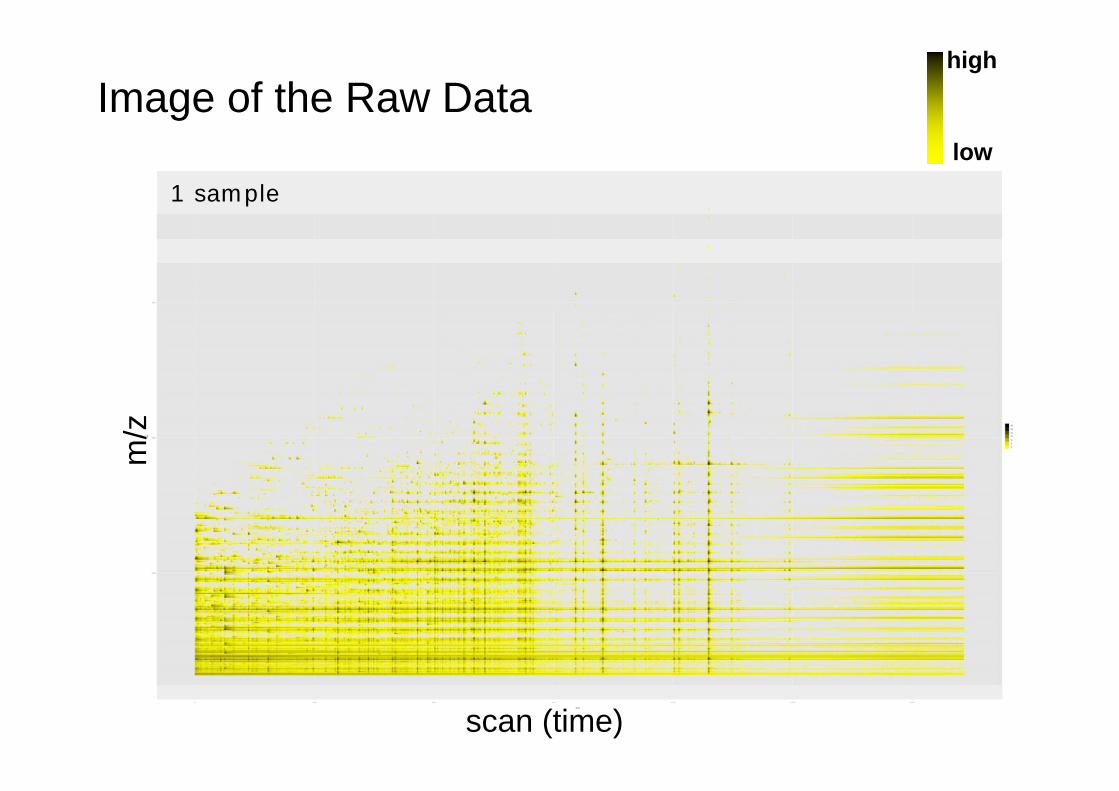
Image of the Raw Datam
/z
scan (time)
m/z
scan (time)
1 sample
high
low
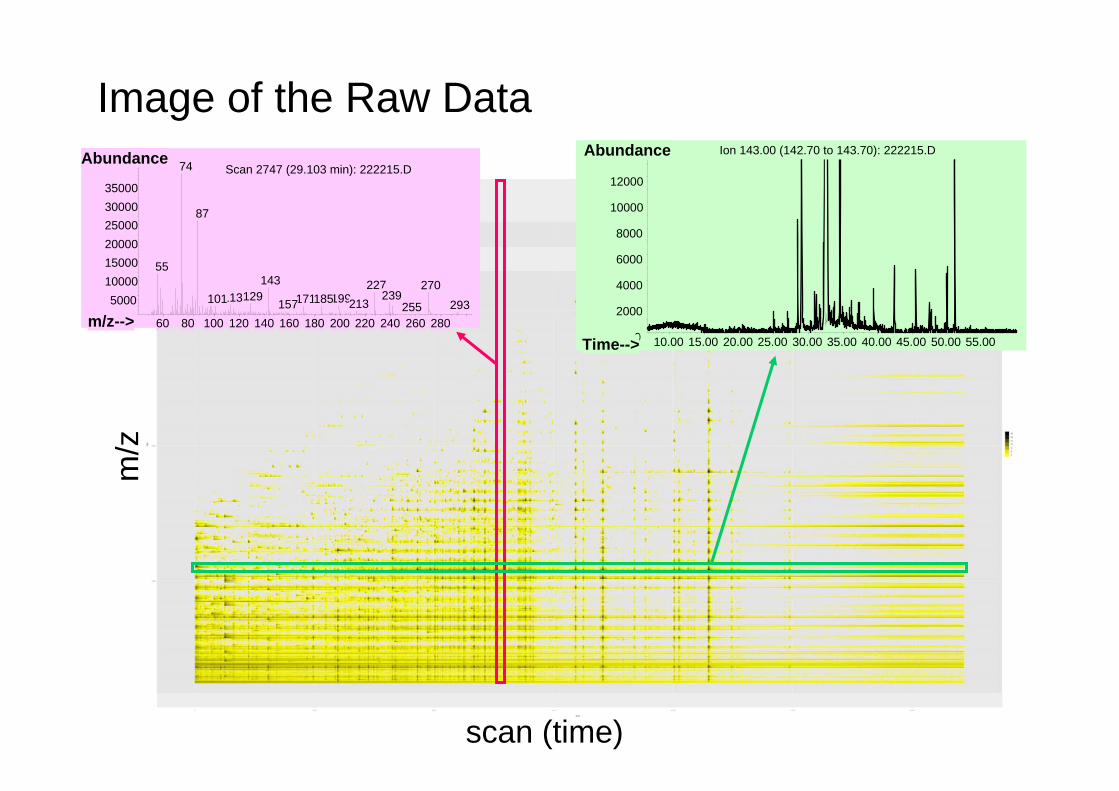
Image of the Raw Datam
/z
scan (time)
m/z
scan (time)
1 sample
60 80 100 120 140 160 180 200 220 240 260 28005000
100001500020000250003000035000
m/z-->
AbundanceScan 2747 (29.103 min): 222215.D74
87
55143 227 270
239129113 199171185101 213157 293255
10.00 15.00 20.00 25.00 30.00 35.00 40.00 45.00 50.00 55.000
2000
4000
6000
8000
10000
12000
Time-->
Abundance Ion 143.00 (142.70 to 143.70): 222215.D
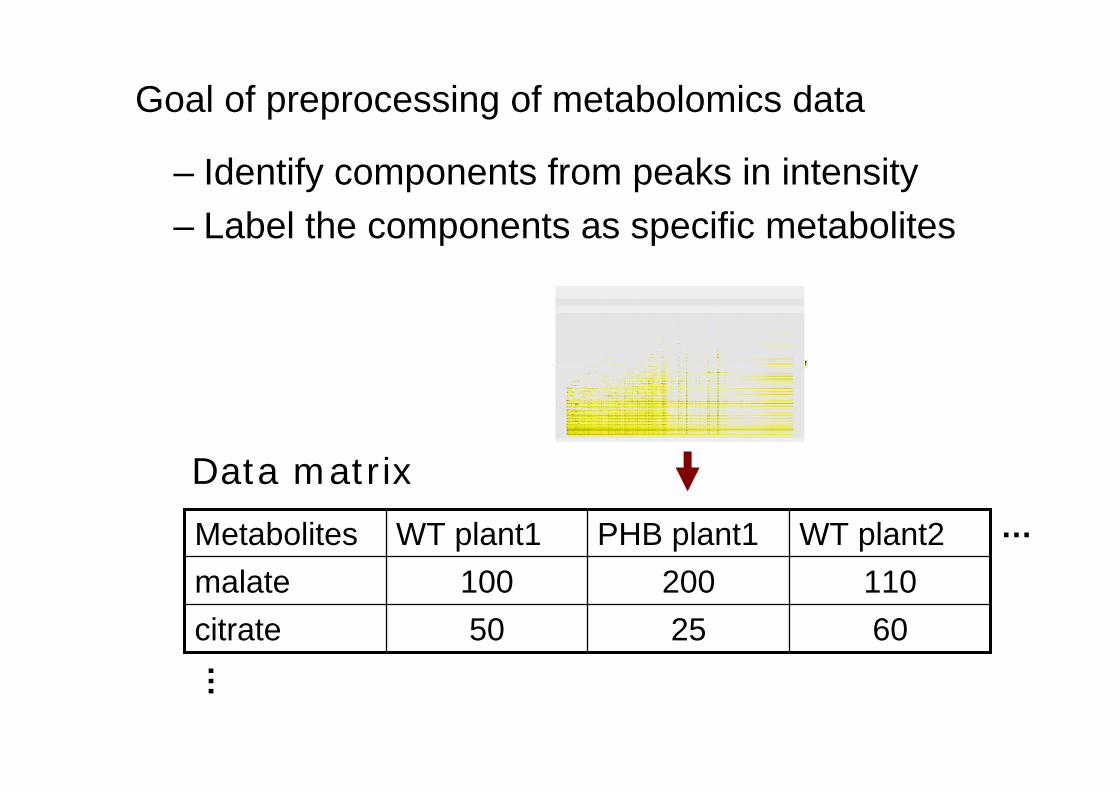
Goal of preprocessing of metabolomics data
– Identify components from peaks in intensity– Label the components as specific metabolites
602550citrate110200100malate
WT plant2PHB plant1WT plant1Metabolites …
…
Data matrix
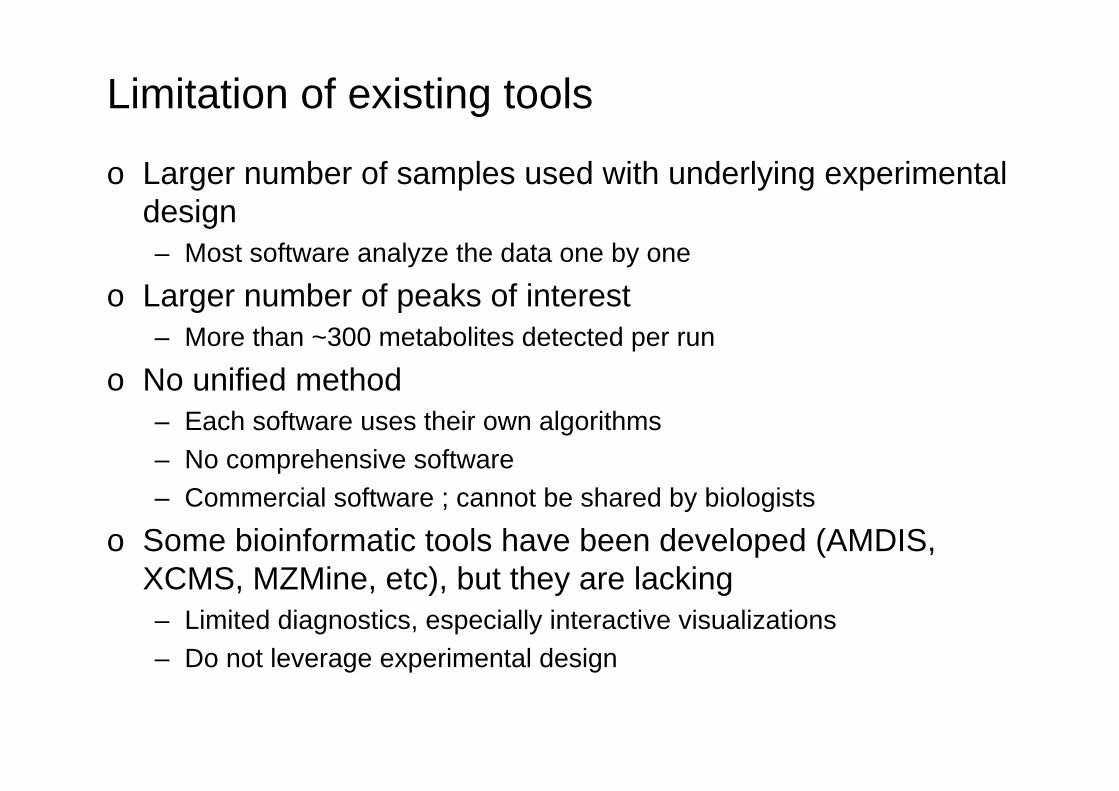
Limitation of existing tools
o Larger number of samples used with underlying experimental design– Most software analyze the data one by one
o Larger number of peaks of interest– More than ~300 metabolites detected per run
o No unified method– Each software uses their own algorithms– No comprehensive software– Commercial software ; cannot be shared by biologists
o Some bioinformatic tools have been developed (AMDIS, XCMS, MZMine, etc), but they are lacking– Limited diagnostics, especially interactive visualizations– Do not leverage experimental design
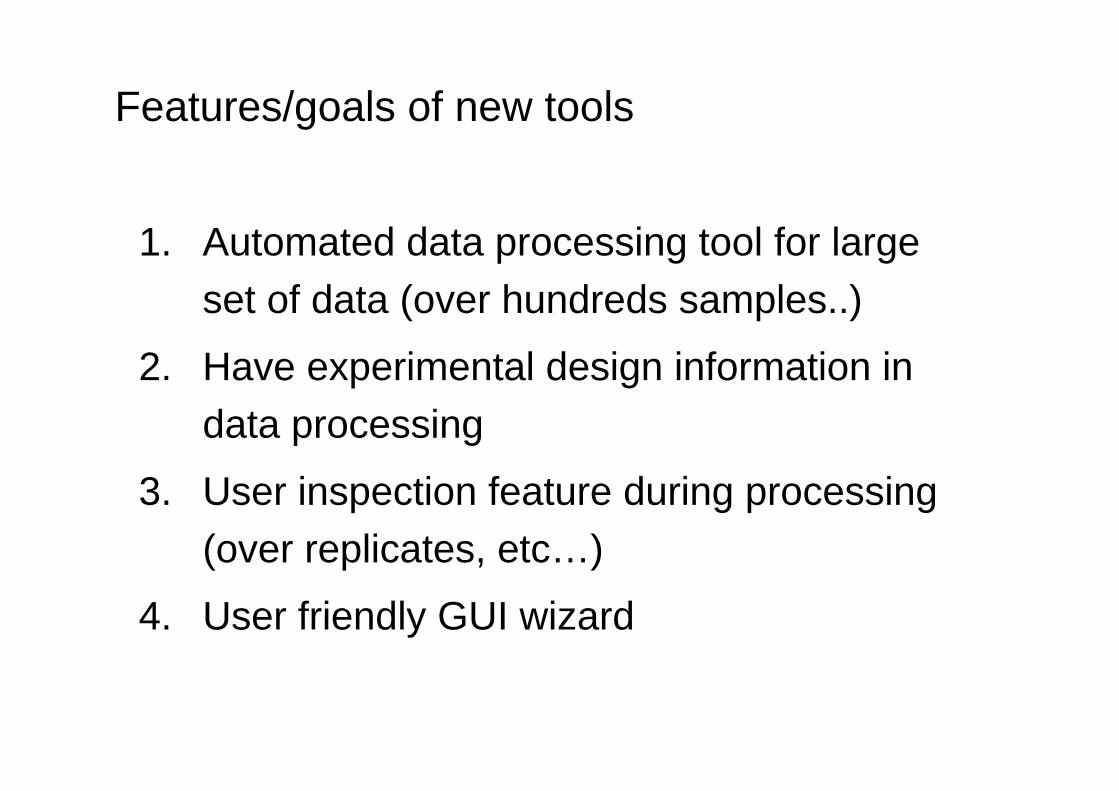
1. Automated data processing tool for large set of data (over hundreds samples..)
2. Have experimental design information in data processing
3. User inspection feature during processing (over replicates, etc…)
4. User friendly GUI wizard
Features/goals of new tools
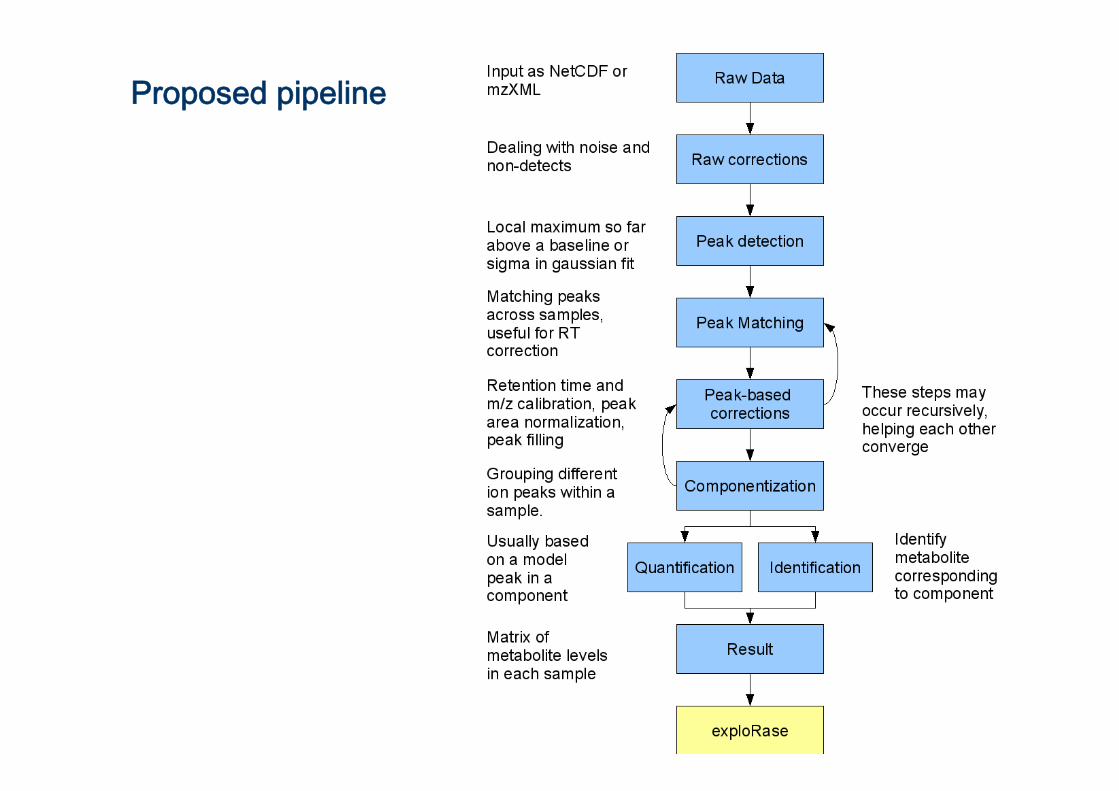
Proposed pipeline
Metabolomics data acquisition
Plant (Treatment)
Extract
Separation (GC/LC/CE)
Detection(UV, MS, NMR etc…)
Data processing
Data matrix
Analysis
Raw data
Peak detection
Peak deconvolution
Quantification
Peak matching
Identification
Retention time Correction
Componentization
Baseline corrections
Quantification
QuantificationFill in missings
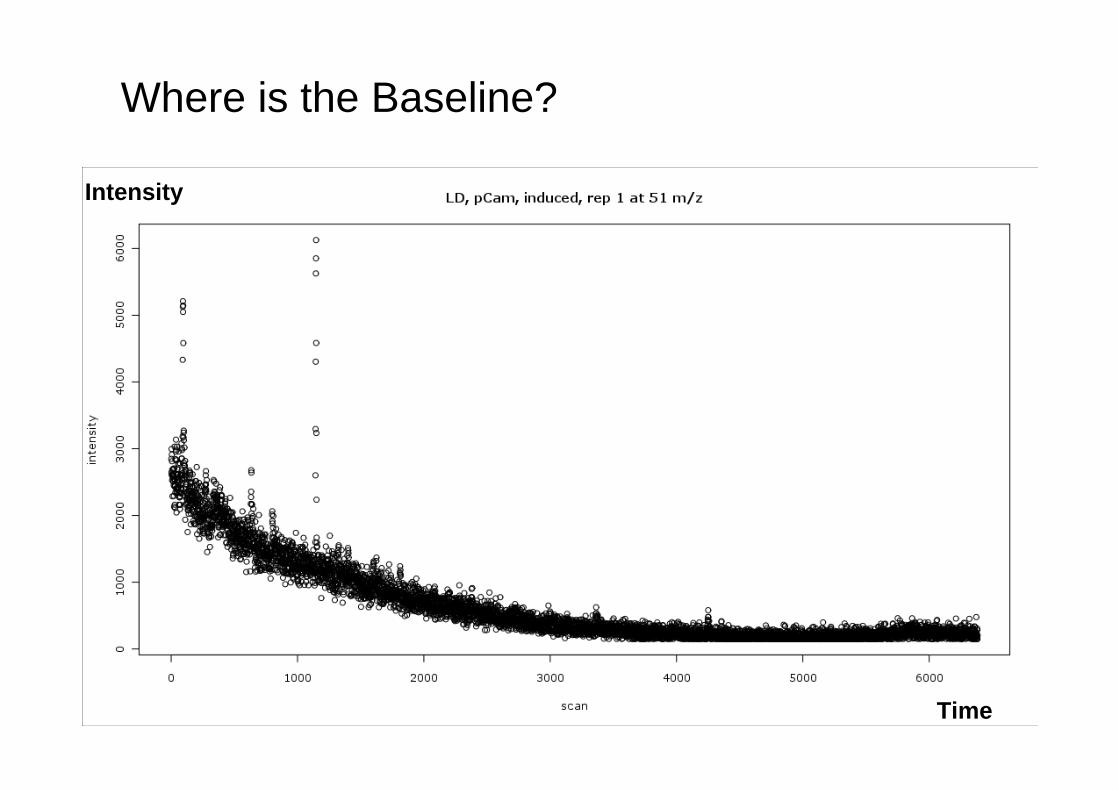
Where is the Baseline?
Time
Intensity
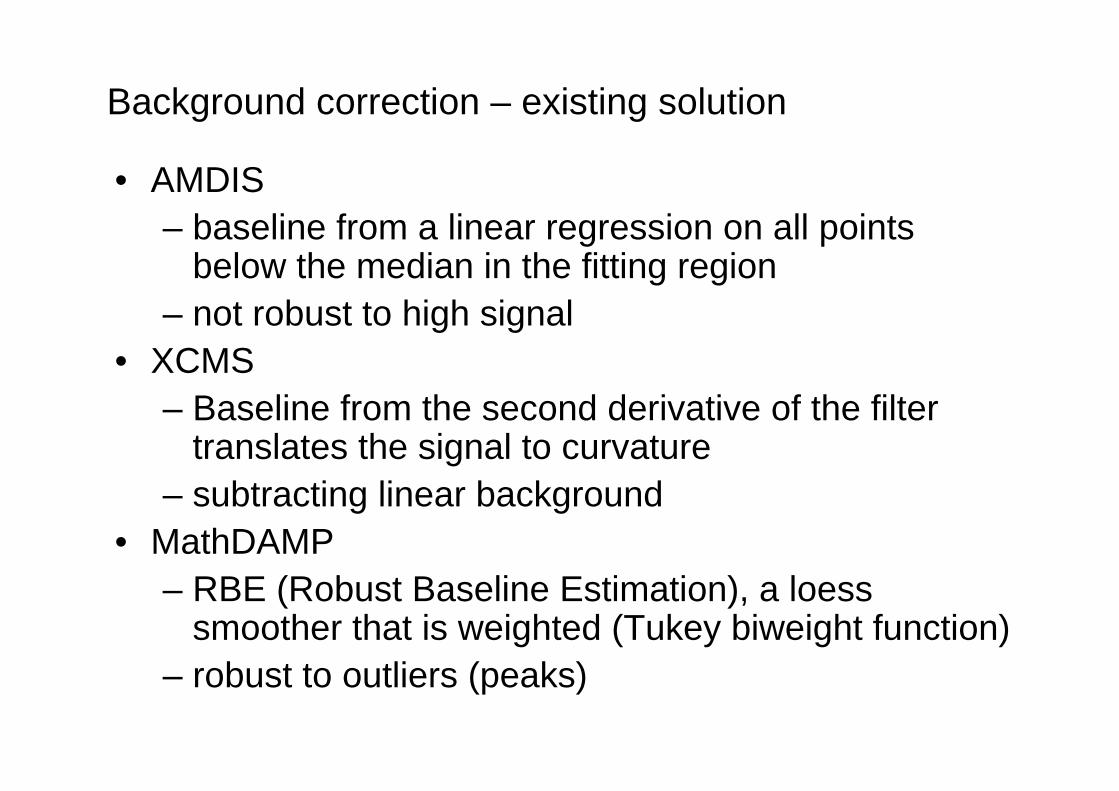
Background correction – existing solution
• AMDIS– baseline from a linear regression on all points
below the median in the fitting region– not robust to high signal
• XCMS– Baseline from the second derivative of the filter
translates the signal to curvature – subtracting linear background
• MathDAMP– RBE (Robust Baseline Estimation), a loess
smoother that is weighted (Tukey biweight function)– robust to outliers (peaks)
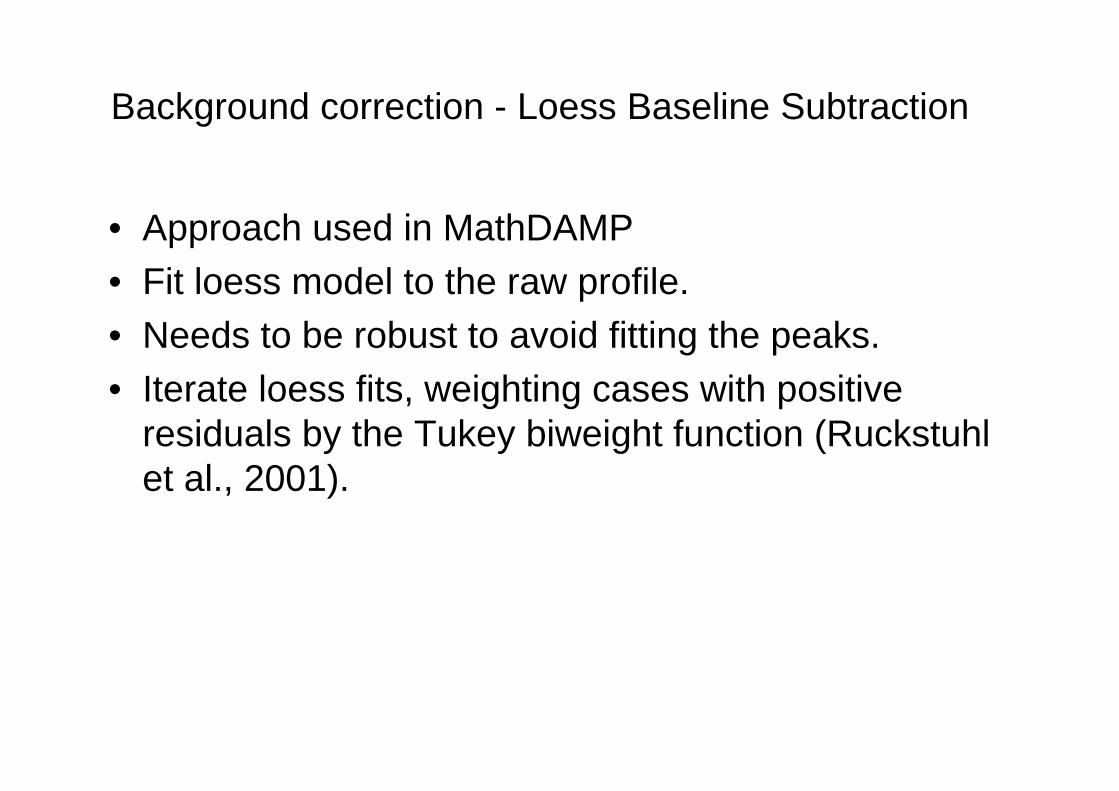
Background correction - Loess Baseline Subtraction
• Approach used in MathDAMP• Fit loess model to the raw profile. • Needs to be robust to avoid fitting the peaks.• Iterate loess fits, weighting cases with positive
residuals by the Tukey biweight function (Ruckstuhl et al., 2001).
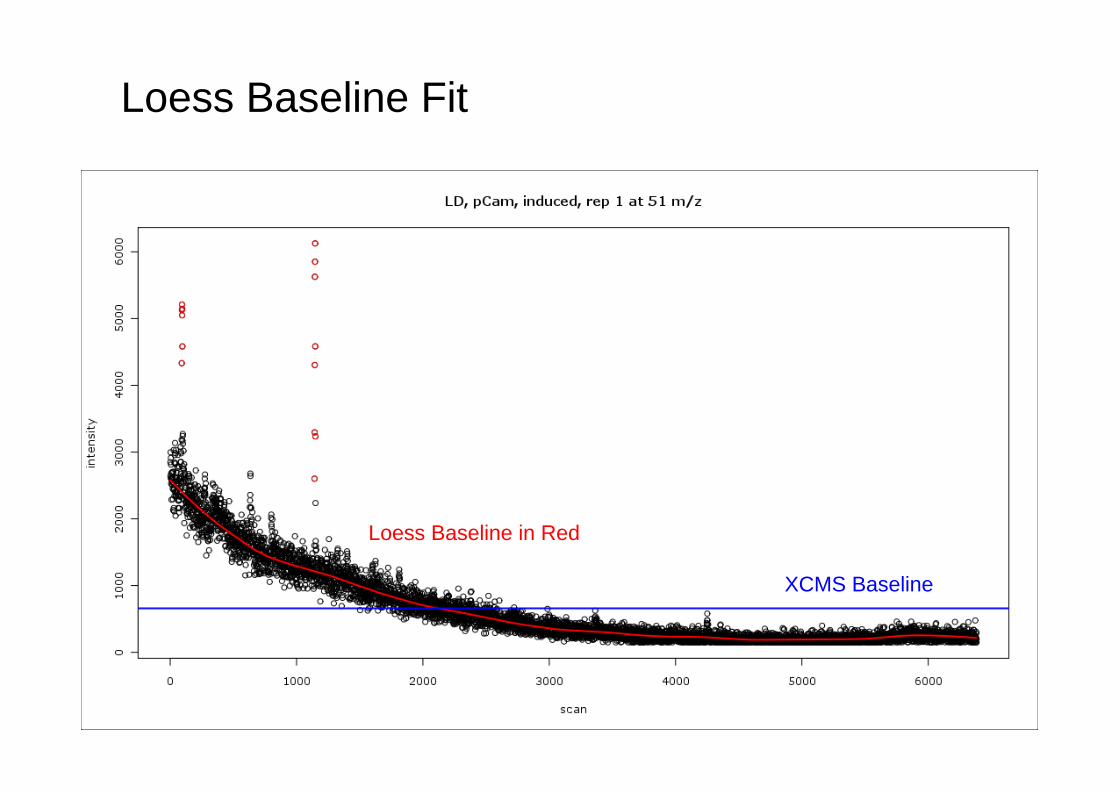
Loess Baseline Fit
XCMS Baseline
Loess Baseline in Red
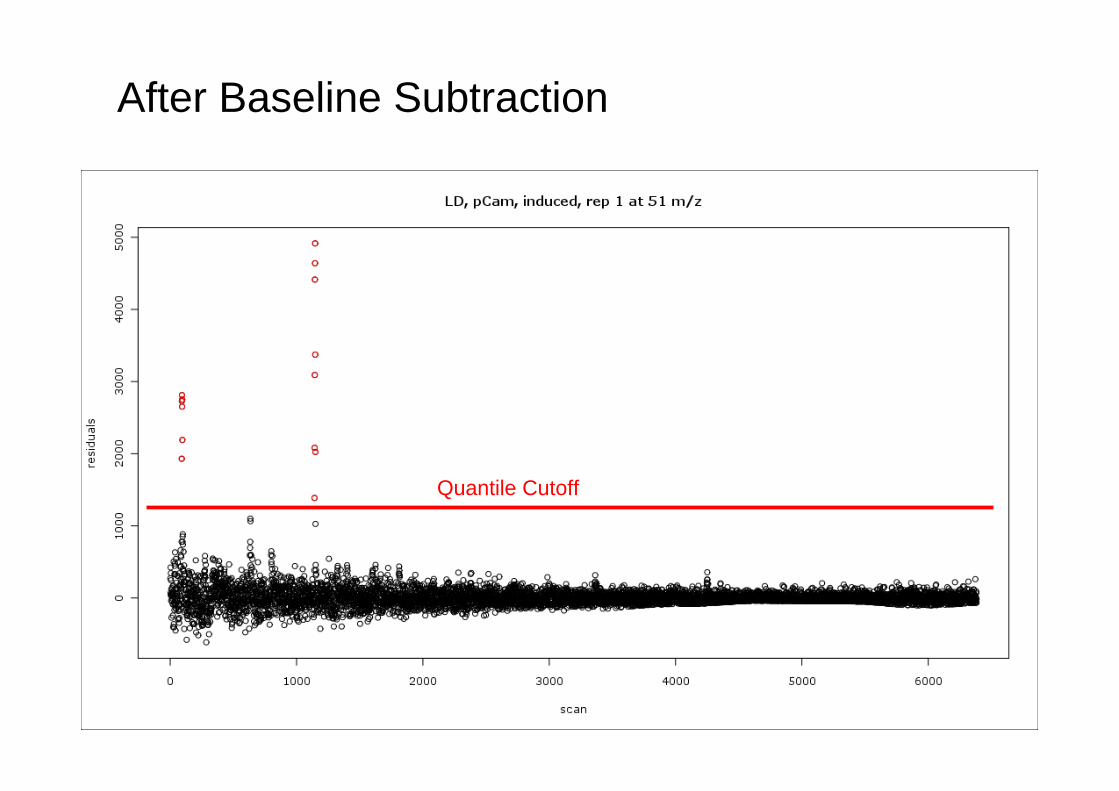
After Baseline Subtraction
Quantile Cutoff
Peaks
Quantile Cutoff
Metabolomics data acquisition
Plant (Treatment)
Extract
Separation (GC/LC/CE)
Detection(UV, MS, NMR etc…)
Data processing
Data matrix
Analysis
Raw data
Peak detection
Peak deconvolution
Quantification
Peak matching
Identification
Retention time Correction
Componentization
Baseline corrections
Quantification
QuantificationFill in missings
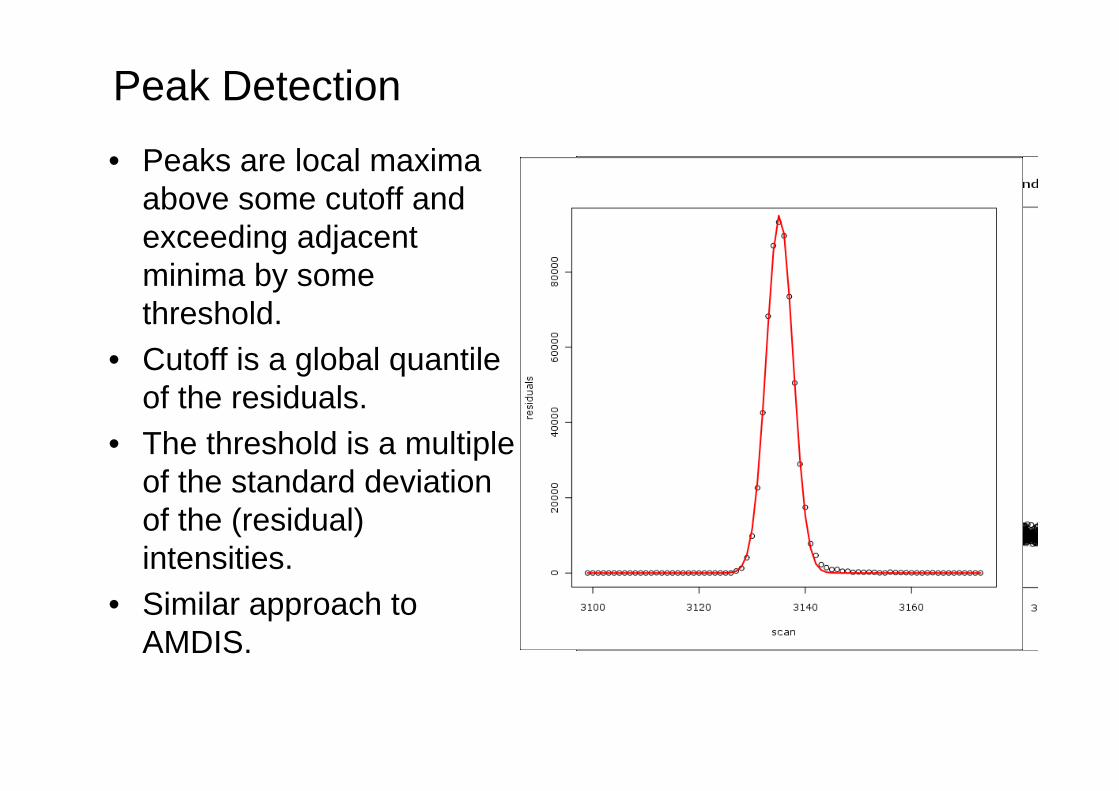
Peak Detection
• Peaks are local maxima above some cutoff and exceeding adjacent minima by some threshold.
• Cutoff is a global quantile of the residuals.
• The threshold is a multiple of the standard deviation of the (residual) intensities.
• Similar approach to AMDIS.
Peak Fit Window
Considering the Peak Shape
• We expect a peak to have a gaussian shape, so we fit a gaussian function to the neighborhood around each maxima.
• Neighborhoods are not allowed to overlap.• Fits with extremely large sigma are
discarded. • About 4000 peaks detected per sample.
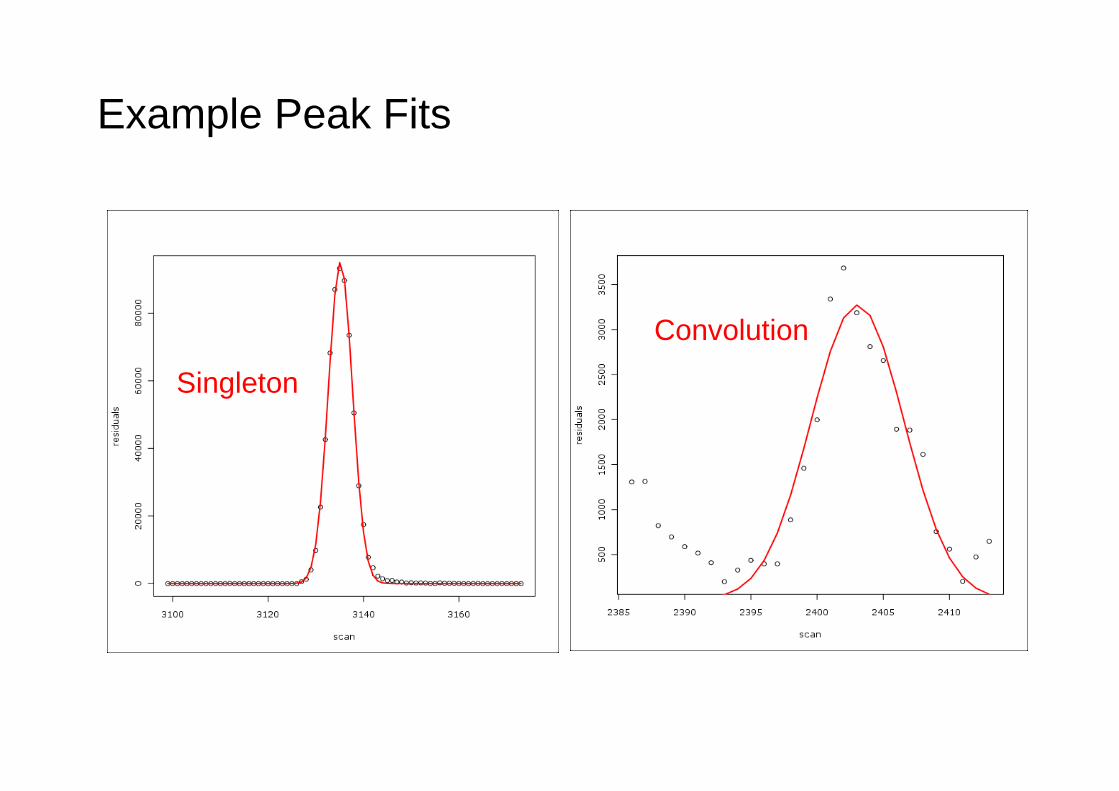
Example Peak Fits
Convolution
Singleton
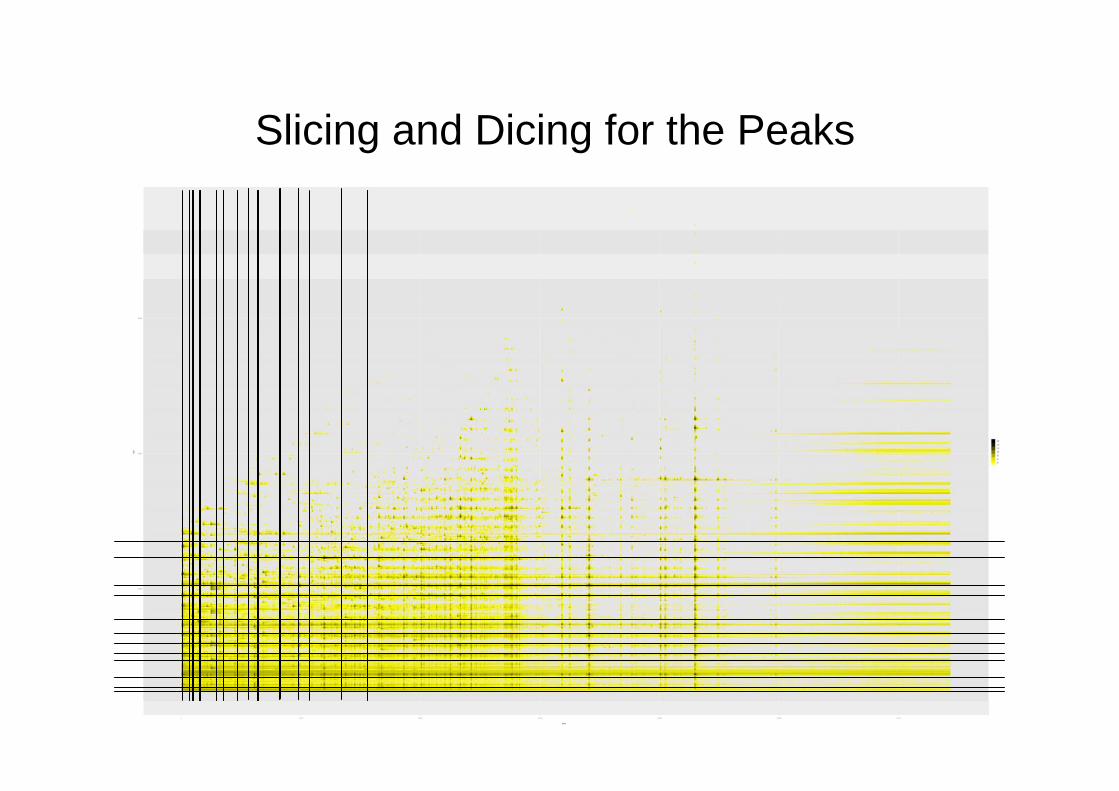
Slicing and Dicing for the Peaksm
/z
scan (time)
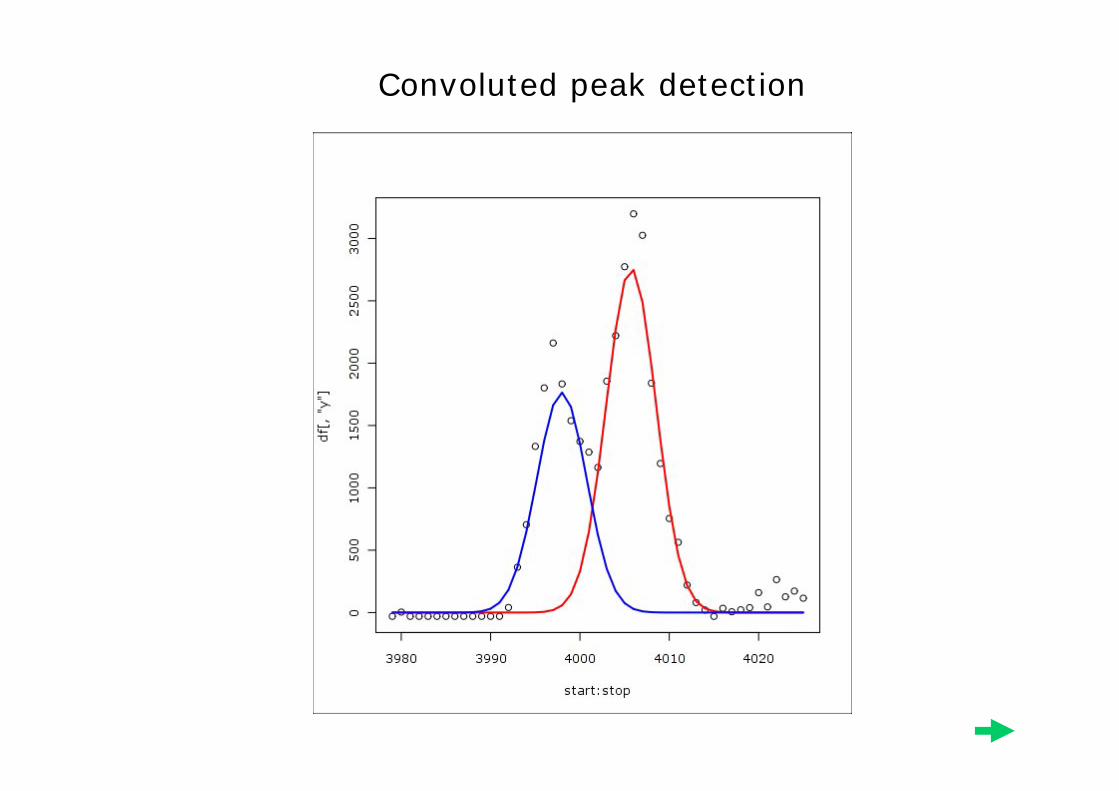
Convoluted peak detection
Metabolomics data acquisition
Plant (Treatment)
Extract
Separation (GC/LC/CE)
Detection(UV, MS, NMR etc…)
Data processing
Data matrix
Analysis
Raw data
Peak detection
Peak deconvolution
Quantification
Peak matching
Identification
Retention time Correction
Componentization
Baseline corrections
Quantification
QuantificationFill in missings
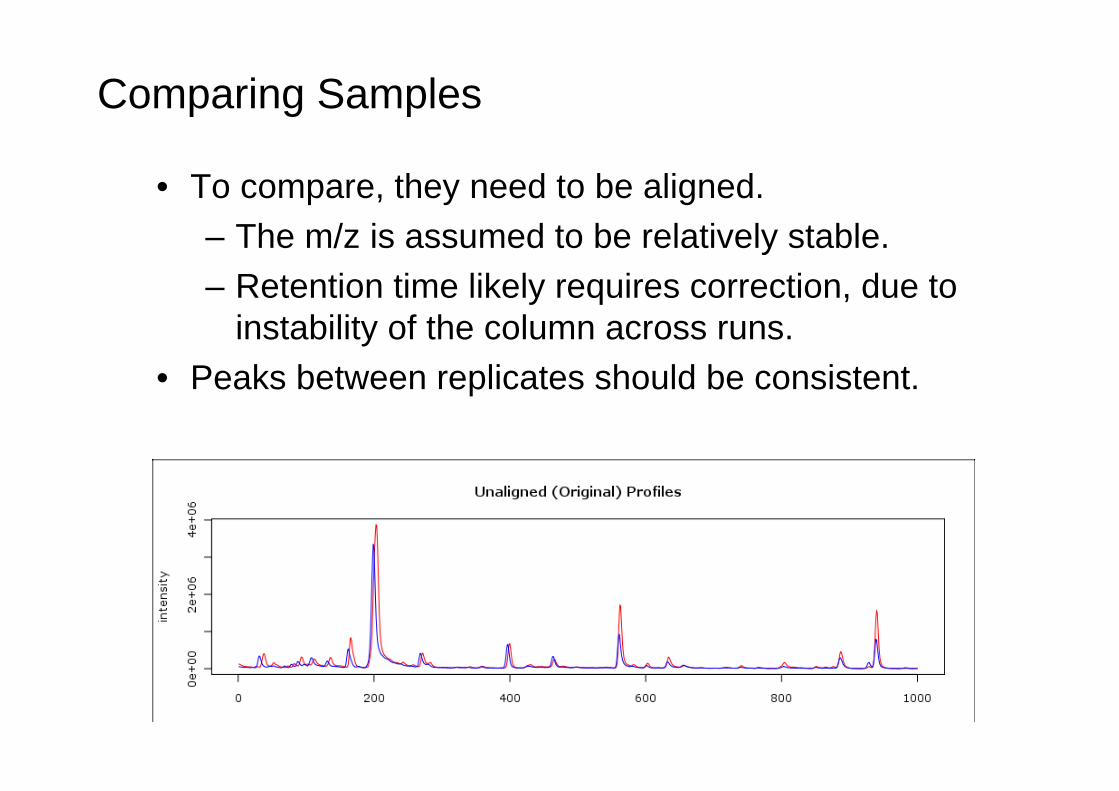
Comparing Samples
• To compare, they need to be aligned.– The m/z is assumed to be relatively stable.– Retention time likely requires correction, due to
instability of the column across runs.• Peaks between replicates should be consistent.
Retention time correction – existing solutions
• AMDIS – RI based (not precise)• METIDEA – AMDIS + selective ion matching• MetAlign – selective ion matching + back
and forth..• XCMS – fitting by Gaussian density
estimation function
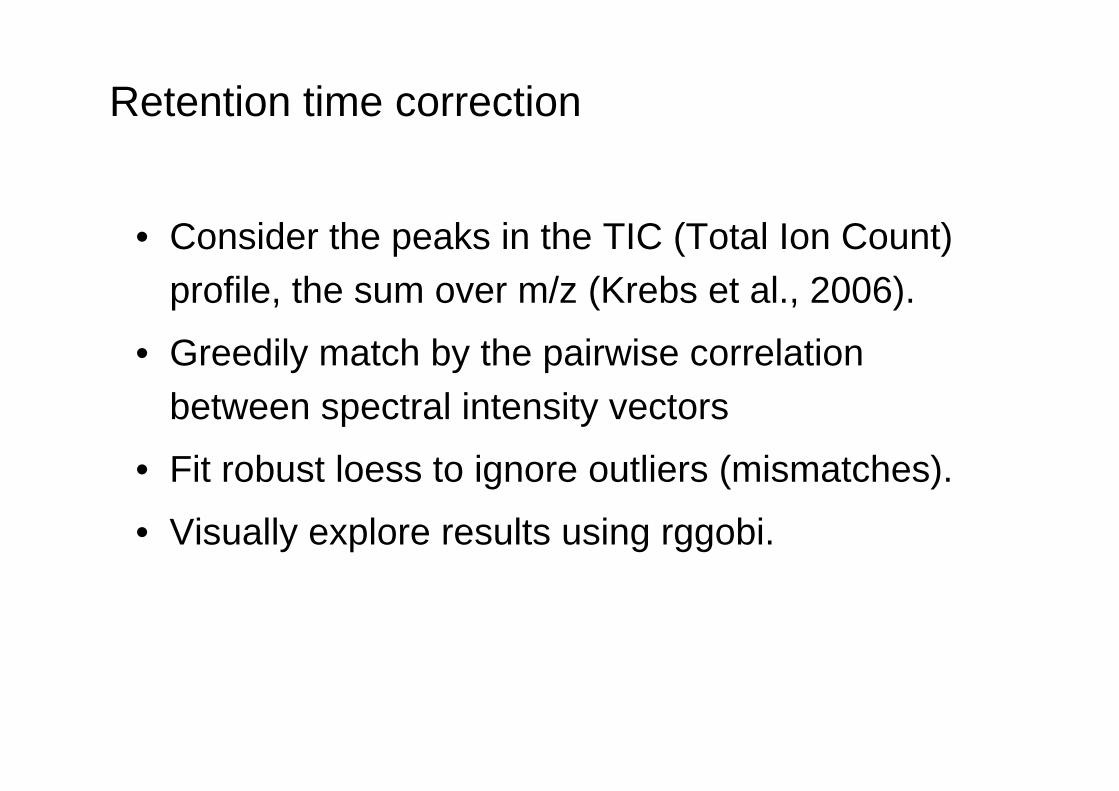
Retention time correction
• Consider the peaks in the TIC (Total Ion Count) profile, the sum over m/z (Krebs et al., 2006).
• Greedily match by the pairwise correlation between spectral intensity vectors
• Fit robust loess to ignore outliers (mismatches).
• Visually explore results using rggobi.
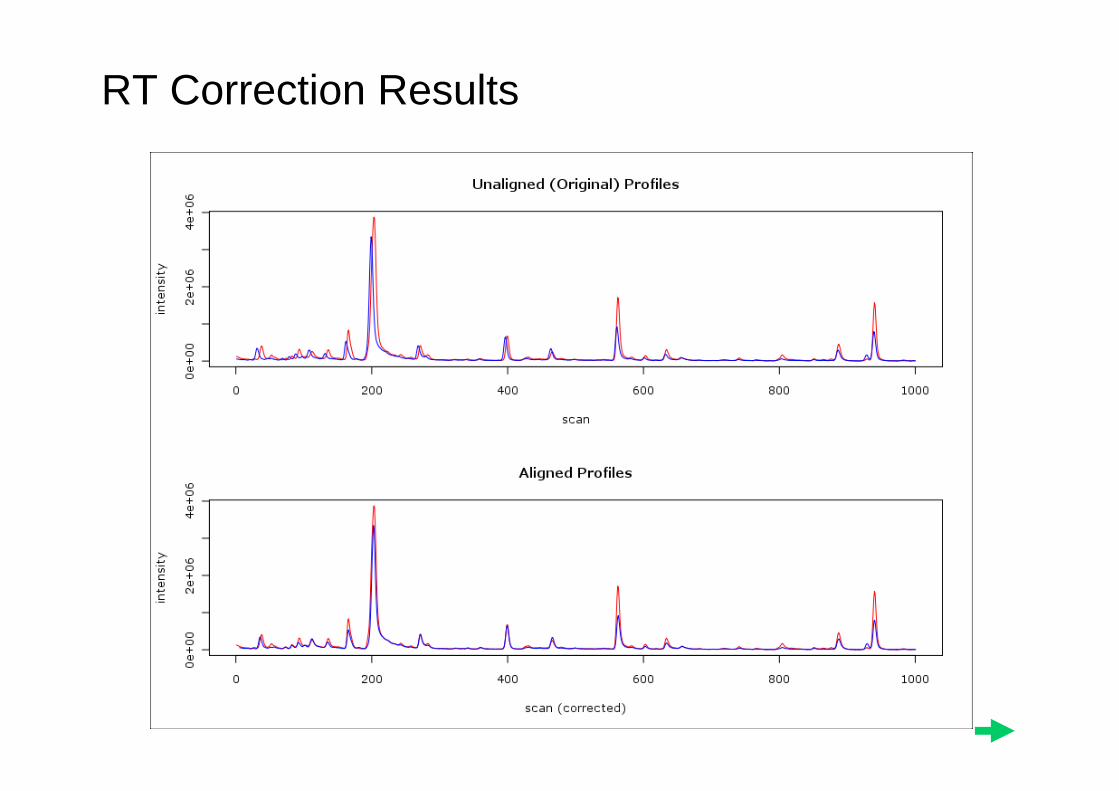
RT Correction Results
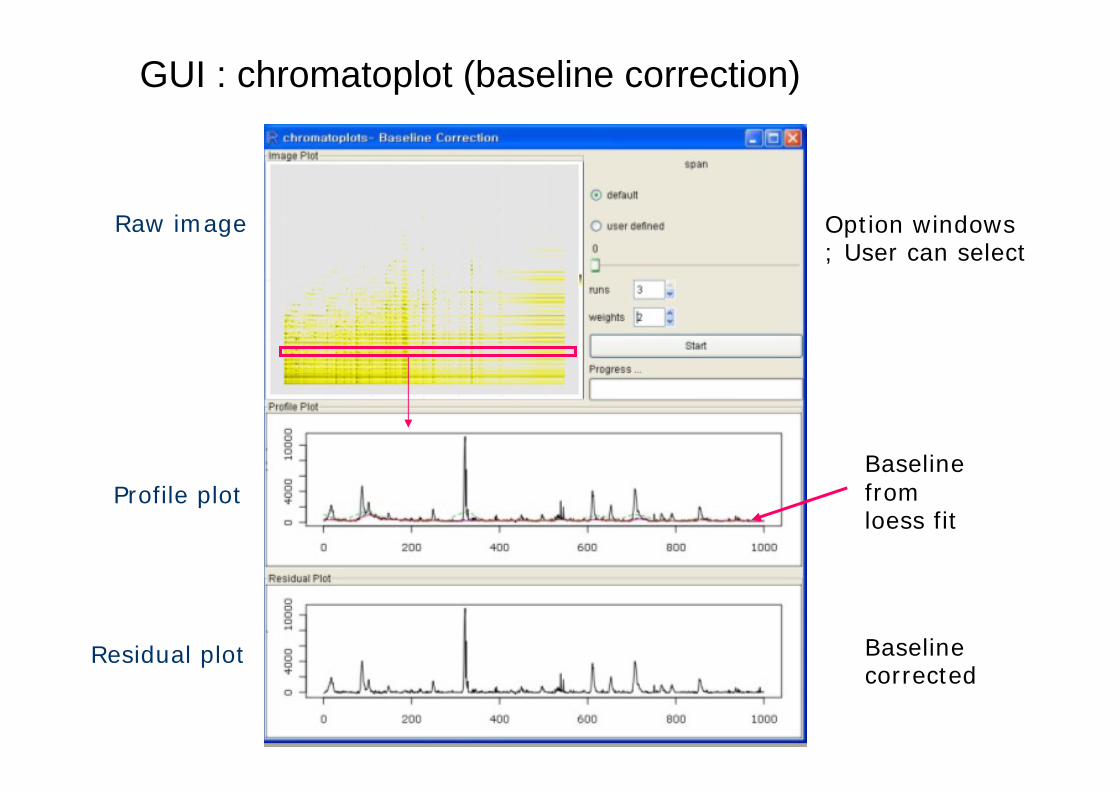
GUI : chromatoplot (baseline correction)
Raw image
Profile plot
Residual plot
Baseline from loess fit
Baseline corrected
Option windows ; User can select
Next Steps
• Deconvolution of the peaks• Matching the peaks across data set• Identify and quantify the metabolites
– A scriptable implementation of the methods– A biologist-accessible GUI– Plenty of interactive graphics for diagnostics– Integration with Bioconductor (xcms,
MassSpecWavelet)
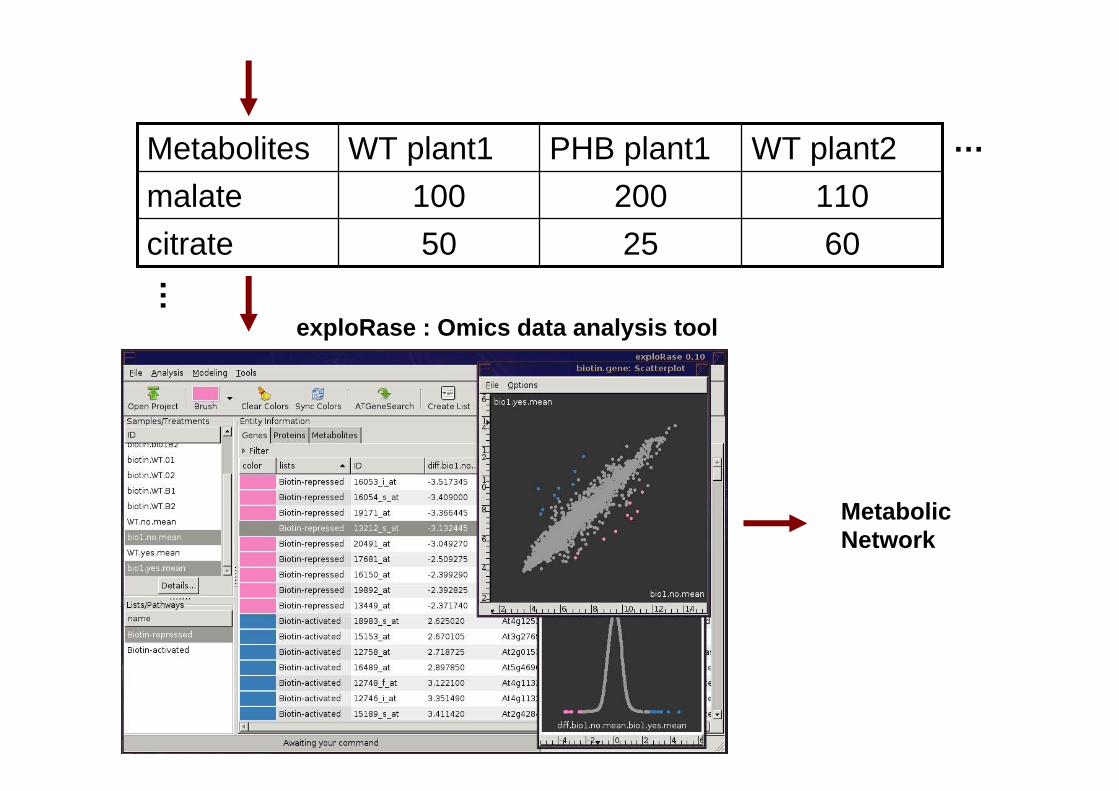
602550citrate110200100malate
WT plant2PHB plant1WT plant1Metabolites …
…
exploRase : Omics data analysis tool
Metabolic Network
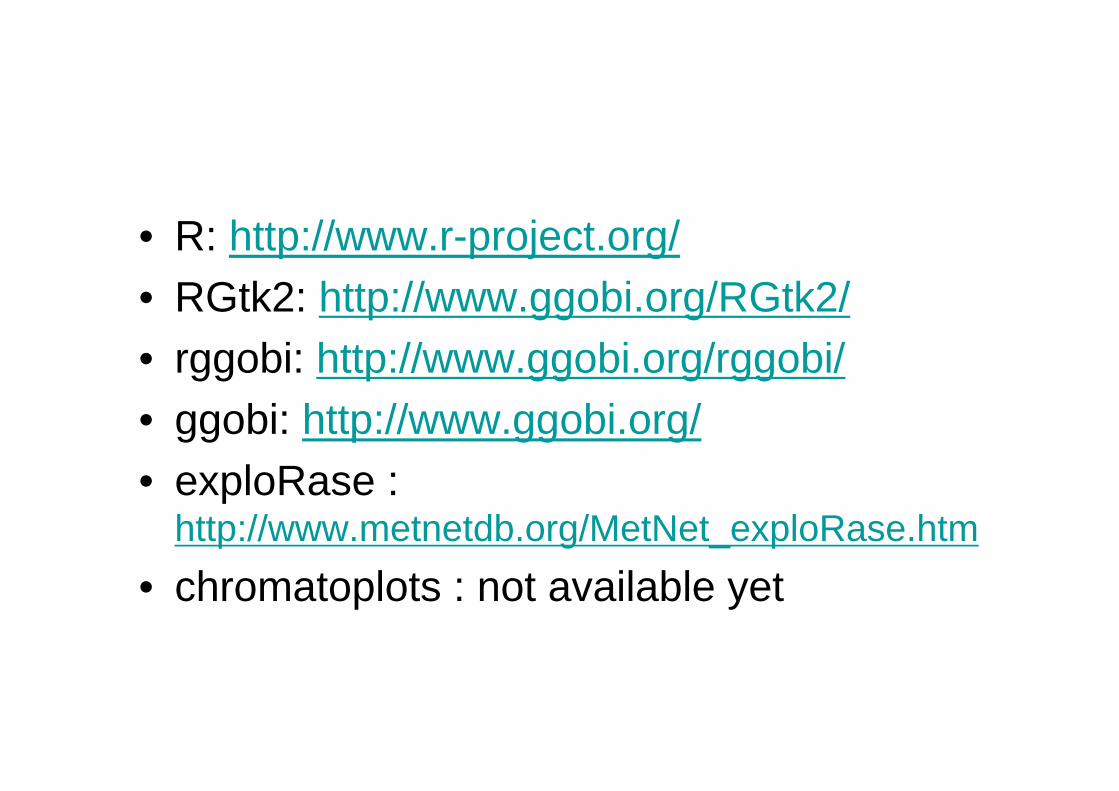
• R: http://www.r-project.org/• RGtk2: http://www.ggobi.org/RGtk2/• rggobi: http://www.ggobi.org/rggobi/• ggobi: http://www.ggobi.org/• exploRase :
http://www.metnetdb.org/MetNet_exploRase.htm• chromatoplots : not available yet
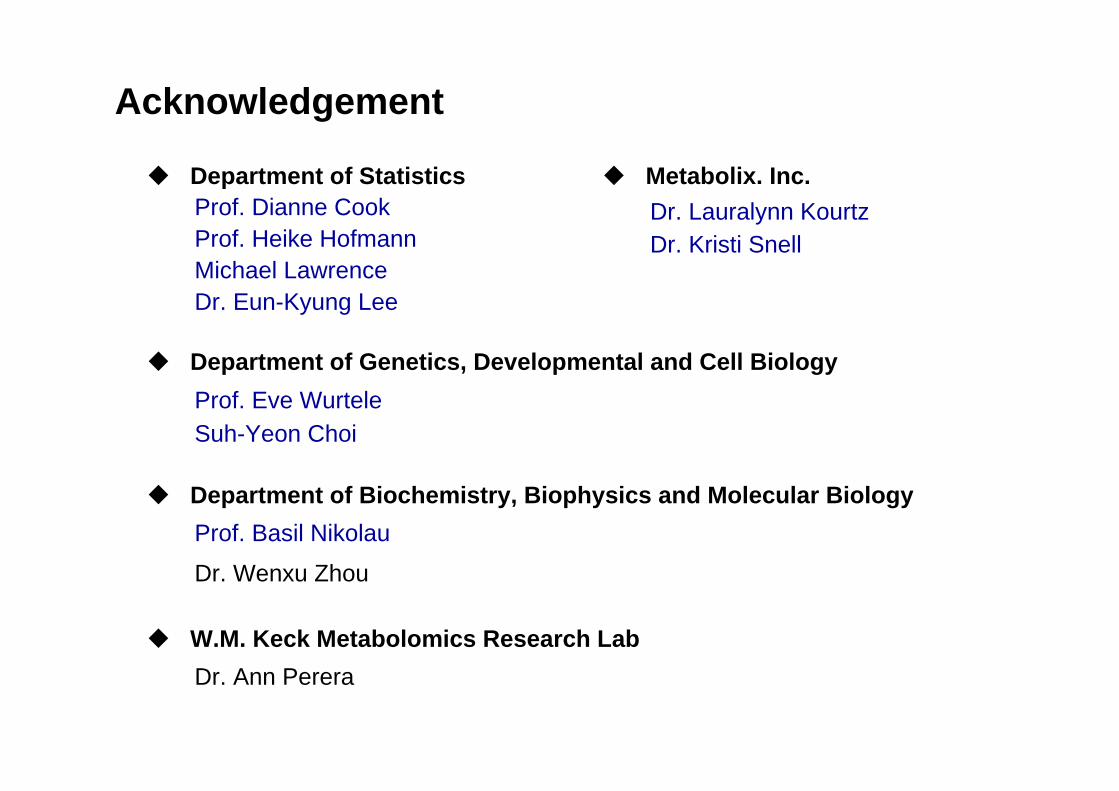
Acknowledgement
Department of Genetics, Developmental and Cell BiologyProf. Eve WurteleSuh-Yeon Choi
Metabolix. Inc.Dr. Lauralynn KourtzDr. Kristi Snell
W.M. Keck Metabolomics Research LabDr. Ann Perera
Department of StatisticsProf. Dianne Cook Prof. Heike HofmannMichael LawrenceDr. Eun-Kyung Lee
Department of Biochemistry, Biophysics and Molecular BiologyProf. Basil Nikolau
Dr. Wenxu Zhou


![OnPLS integration of transcriptomic, proteomic and metabolomic … · 2017. 4. 6. · tegrating multidimensional information into networks [4]. Numerous strategies have been proposed](https://img.pdfslide.us/doc/110x75/5fd6894d800ff85f5412cd92/onpls-integration-of-transcriptomic-proteomic-and-metabolomic-2017-4-6-tegrating.jpg)


![Transcriptomic and metabolomic analyses reveal that …...for controlling SNC because of their non-selective na-ture, low efficiency, and high cost [2, 3]. In contrast, there are many](https://img.pdfslide.us/doc/110x75/610d2baf3b492e41d36dc8bc/transcriptomic-and-metabolomic-analyses-reveal-that-for-controlling-snc-because.jpg)