Embed Size (px)
Citation preview
Khan, Faraz and Chai, Hui Hui and Ajmera, Ishan and Hodgman, Charlie and Mayes, Sean and Lu, Chungui (2017) A transcriptomic comparison of two Bambara groundnut landraces under dehydration stress. Genes, 8 (4). 121/1-121/19. ISSN 2073-4425
Access from the University of Nottingham repository: http://eprints.nottingham.ac.uk/42287/1/genes-08-00121.pdf
Copyright and reuse:
The Nottingham ePrints service makes this work by researchers of the University of Nottingham available open access under the following conditions.
This article is made available under the Creative Commons Attribution licence and may be reused according to the conditions of the licence. For more details see: http://creativecommons.org/licenses/by/2.5/
A note on versions:
The version presented here may differ from the published version or from the version of record. If you wish to cite this item you are advised to consult the publisher’s version. Please see the repository url above for details on accessing the published version and note that access may require a subscription.
For more information, please contact [email protected]

Seediscussions,stats,andauthorprofilesforthispublicationat:https://www.researchgate.net/publication/316191429
ATranscriptomicComparisonofTwoBambaraGroundnutLandracesunderDehydrationStress
ArticleinGenes·April2017
DOI:10.3390/genes8040121
CITATIONS
0
READS
27
6authors,including:
Someoftheauthorsofthispublicationarealsoworkingontheserelatedprojects:
InternationalfieldtrialsofbambaragroundnutViewproject
GRASP(GeospatialResourcesforAgriculturalSpeciesandPests)forAgriGISViewproject
FarazKhan
UniversityofNottingham
3PUBLICATIONS3CITATIONS
SEEPROFILE
IshanAjmera
UniversityofNottingham
12PUBLICATIONS87CITATIONS
SEEPROFILE
CharlieHodgman
UniversityofNottingham
99PUBLICATIONS4,430CITATIONS
SEEPROFILE
SeanMayes
UniversityofNottingham
108PUBLICATIONS707CITATIONS
SEEPROFILE
AllcontentfollowingthispagewasuploadedbyFarazKhanon18April2017.
Theuserhasrequestedenhancementofthedownloadedfile.Allin-textreferencesunderlinedinblueareaddedtotheoriginaldocument
andarelinkedtopublicationsonResearchGate,lettingyouaccessandreadthemimmediately.
genesG C A T
T A C G
G C A T
Article
A Transcriptomic Comparison of Two BambaraGroundnut Landraces under Dehydration Stress
Faraz Khan 1, Hui Hui Chai 2, Ishan Ajmera 3, Charlie Hodgman 3, Sean Mayes 1,2,*and Chungui Lu 4
1 School of Biosciences, University of Nottingham, Sutton Bonington Campus, Nottingham LE12 5RD, UK;[email protected]
2 Crops for the Future, Jalan Broga, 43500 Semenyih, Selangor Darul Ehsan, Malaysia;[email protected]
3 Centre for Plant Integrative Biology, University of Nottingham, Sutton Bonington Campus,Nottingham LE12 5RD, UK; [email protected] (I.A.);[email protected] (C.H.)
4 School of Animal Rural and Environmental Sciences, Nottingham Trent University, Clifton Campus,Nottingham NG11 8NS, UK; [email protected]
* Correspondence: [email protected]; Tel.: +44-0115-951-8062
Academic Editor: Qingyi YuReceived: 20 February 2017; Accepted: 10 April 2017; Published: 18 April 2017
Abstract: The ability to grow crops under low-water conditions is a significant advantage in relationto global food security. Bambara groundnut is an underutilised crop grown by subsistence farmersin Africa and is known to survive in regions of water deficit. This study focuses on the analysisof the transcriptomic changes in two bambara groundnut landraces in response to dehydrationstress. A cross-species hybridisation approach based on the Soybean Affymetrix GeneChip arrayhas been employed. The differential gene expression analysis of a water-limited treatment, however,showed that the two landraces responded with almost completely different sets of genes. Hence,both landraces with very similar genotypes (as assessed by the hybridisation of genomic DNA ontothe Soybean Affymetrix GeneChip) showed contrasting transcriptional behaviour in response todehydration stress. In addition, both genotypes showed a high expression of dehydration-associatedgenes, even under water-sufficient conditions. Several gene regulators were identified as potentiallyimportant. Some are already known, such as WRKY40, but others may also be considered, namelyPRR7, ATAUX2-11, CONSTANS-like 1, MYB60, AGL-83, and a Zinc-finger protein. These dataprovide a basis for drought trait research in the bambara groundnut, which will facilitate functionalgenomics studies. An analysis of this dataset has identified that both genotypes appear to be in adehydration-ready state, even in the absence of dehydration stress, and may have adapted in differentways to achieve drought resistance. This will help in understanding the mechanisms underlyingthe ability of crops to produce viable yields under drought conditions. In addition, cross-specieshybridisation to the soybean microarray has been shown to be informative for investigating thebambara groundnut transcriptome.
Keywords: Bambara groundnut; landraces; dehydration stress; cross-species microarray analysis
1. Introduction
Dehydration is one of the major stresses that inhibits plant growth and can reduce cropproductivity. Hence, drought resistance is a key target in helping to ensure global food supply. Plantsrespond to dehydration stress in three broad approaches: (1) Dehydration escape; (2) Dehydrationavoidance; and (3) Dehydration tolerance. Such mechanisms are seen in a range of leguminous
Genes 2017, 8, 121; doi:10.3390/genes8040121 www.mdpi.com/journal/genes
Genes 2017, 8, 121 2 of 19
species, including the mung bean [1] and pigeon pea [2]. Dehydration escape is the ability of plantsto complete their growth cycle and reach maturity with successful reproduction before the shortageof water reaches damaging levels [3]. Mechanisms of avoidance include improved root traits for agreater extraction of soil moisture, stomatal closure, a decreased radiation absorption through leafrolling, a decreased leaf area for reduced water loss, and the accumulation of osmoprotectants suchas proline, trehalose, and dehydrins [4]. Dehydration tolerance allows plants to survive throughimproved water-use efficiency, i.e., performing all of the biological, molecular, and cellular functionswith minimal water. Numerous studies on the effects of dehydration stress on staple crops have beenreported [1,2,4–10].
Reduced water availability causes the production of abscisic acid (ABA), the phyto-hormonewhich initiates stomatal closure and influences other aspects of plant growth and physiology. It isresponsible for regulating a broad range of genes during the dehydration response. The SNF1-relatedprotein kinase, AREB (ABA-responsive element)/ABF are the key regulators of ABA signalling [11].Improving the dehydration tolerance has also been linked to a reduction in shoot growth, while rootgrowth is maintained, leading to an altered partition between the root and shoot. This process isachieved by cell-wall synthesis and remodelling. The formation of reactive oxygen species (ROS) andlignin peroxidases are the key steps involved in cell wall thickening.
Stomatal closure limits the CO2 uptake by leaves, which leads to a reduction in photosynthesisas the leaf’s internal CO2 is depleted. Severe dehydration stress also limits photosynthesis bydown-regulating the expression of ribulose-1, 5-bisphosphate carboxylase/oxygenase (Rubisco),fructose-1,6-bisphosphatase (FBPase), phosphoenolpyruvate carboxylase (PEPCase), pyruvateorthophosphate dikinase (PPDK), and NADP-malic enzyme (NADP-ME) [12]. Plant responses todehydration affect vegetative growth by reducing the leaf-area expansion and total dry matter, whichin turn decreases light interception [13]. Under dehydration stress, wheat (Triticum dicoccoides) shows areduction in the number of grains, grain yield, shoot dry weight, and harvest index [8]. In soybeanspecimens (Glycine max), the loss of seed yield was reported to be greatest when dehydration appearedduring anthesis and the early reproductive stages [6–9].
A range of dehydration stress-related genes have been identified in Arabidopsis thaliana, rice(Oryza sativa), and other model plants [14]. These can be classified into two main groups: (i) Effectorproteins, whose role is to alleviate the effect of the stress (such as water channel proteins, detoxificationenzymes, LEA proteins, chaperones, and osmoprotectants); and (ii) Regulatory proteins, which alterthe expression or activity of effector genes and modify plant growth, such as the transcription factorsDREB2 and AREB, and also protein kinases and phosphatases [15].
In recent years, plant breeders have turned to landraces (i.e., locally adapted genetically mixedpopulations) for trait improvement in various crops, including barley [16], sorghum [17], sesame [18],and soybean [19]. An early attempt to investigate the use of landraces in addressing the problem ofdehydration tolerance has been carried out in wheat [20], although this did not delve into the specificgenetics conferring the desirable traits. An alternative approach to identifying the genes conferringdehydration avoidance and tolerance is to study species that are already resilient under arid conditions.In this regard, bambara groundnut (Vigna subterranea (L) Verdc.) is a potential candidate. It is anunderutilised, drought-resistant African legume, which is mainly grown in sub-Saharan Africa [5–21]and is sometimes used as an intercrop with major cereals, such as maize, because of its nitrogenfixing potential [22]. Bambara groundnut is considered as a drought resistant crop with a reasonableprotein content (18% to 22%), a high carbohydrate content (65%), and some level of lipids (6.5%) [23],with a similar overall composition to chickpea. A number of bambara groundnut landraces havewell-developed tap roots which grow up to a height of 30–35 cm [24].
From the results of Mabhaudhi et al. [25], bambara groundnut has been shown to adoptdehydration-escape mechanisms, including a shortened vegetative growth period, early flowering,a reduced duration of the reproductive stage, and early maturity under dehydration stress.Such responses are likely to be employed where the initial plant growth is based on stored soil water,
Genes 2017, 8, 121 3 of 19
but further rain is unlikely. It has been reported that bambara groundnut responds to dehydrationstress by partitioning more assimilate into the root, relative to the shoots, so that a greater soil volumecan be exploited [26,27]. Nyamudeza [27] also observed that bambara groundnut allocated a greaterfraction of its total dry weight to the roots than the groundnut, irrespective of the available soilmoisture. This would suggest that bambara groundnut commits a greater supply of assimilates to rootgrowth, irrespective of the soil moisture status. This strategy may have clear advantages when watersubsequently becomes limited, but there could be a trade-off with the yield under benign environments.A greater root dry-weight was also reported when the bambara landrace, Burkina, was subjectedto dehydration stress [28]. Dehydration-avoidance traits have also been observed, especially theaccumulation of proline [21] and a reduced leaf area [29].
This study aims to investigate the effects of dehydration on gene expression in this reportedlydrought-resistant species. The transcriptomes of two genotypes (DipC and Tiga Nicuru (TN)) weresampled, to identify what is common and how they differ in their response to a prolonged, but slowlyintensifying, dehydration treatment. The climatic conditions in their native regions (Botswana andMali, respectively) suggest that they are likely to have evolved in regions which would select fordrought resistance, while potentially exhibiting some variation in the mechanisms employed to dealwith dehydration, as they are morphologically and phenologically distinct [30]. Chai et al. [30,31]reported that transgressive segregation was observed in the segregating F5 population derived fromthe TNxDipC cross. The contrast between the two parental lines for a number of traits such asthe days-to-maturity, stomatal conductance, 100-seed weight, leaf area, internode length, pedunclelength, pod number per plant, and leaf carbon (delta C13) isotope analysis, suggest that some of thesemechanisms for adaptation to dehydration could be non-identical in the two genotypes. For example,delta C13 was associated with a higher yield as observed in DipC, compared to TN [30]. In addition,the results showed that there were lines in the segregating population that performed better in termsof the ability to produce higher yields under drought conditions than the parental genotypes. Hence,evaluating the transcriptome of the two parental lines under dehydration stress could be a goodindicator to investigate the molecular mechanism occurring in the two genotypes and its relationshipto phenology and phenotype.
As a complete genome sequence is not available and microarray tools are still to be developed inthis species, cross-species hybridisation with the Affymetrix Glycine-max microarray was investigatedto test if this approach is acceptable for bambara groundnut transcriptomics, as it has been successfulfor other species [32–34].
2. Materials and Methods
2.1. Plant Materials
In this study, the experiment was conducted in the FutureCrop controlled tropical glasshouses atthe School of Biosciences, Sutton Bonington Campus, University of Nottingham, UK. Two genotypesof bambara groundnut, DipC and TN, were planted in both ‘Water-limited’ and ‘Water-sufficient’control plots.
2.2. Site Descriptions and Experimental Design
Plants were grown over a period of five months. A 12-hour photoperiod was created using anautomated blackout system (Cambridge Glasshouses, Newport, UK), with day and night temperaturesset at 28 ◦C and 23 ◦C respectively. Trickle tape irrigation with PVC micro-porous tubing was placedbeside each plant row. The plants were irrigated at 06:00 h and 18:00 h for 20 min, with a measured flowrate of 1 L/h per tube, and each tube was 5 m in length. Two independent soil pits (5 m × 5 m × 1 m)containing sandy loam soil were used in the glasshouses. These were isolated from the surroundingsoil by a Butyl liner and concrete pit structure with gravel drainage for separate water-limited andwater-sufficient plots. The PR2 water profile probe (Delta-T devices, Cambridge, UK) was used to
Genes 2017, 8, 121 4 of 19
measure the soil moisture content. A randomised block design (RBD) with three blocks for each soil pitwas implemented for this experiment. Three replicate plants for the water-sufficient plot (continuouslyirrigated) and four replicates for the water-limited treatment plot were used. Three seeds were sownper replicate at a depth of 3–4 cm with a spacing of 25 cm × 25 cm between each final plant position andmultiple plants were later thinned to one plant per replicate at 20 days after sowing (DAS). Figure S1shows the treatment regime. The irrigation system for the water limited treatment plot was turnedoff at 50 DAS and resumed at 92 DAS for plant recovery (in total, six weeks of treatment after 100%flowering). Normal irrigation continued for the water-sufficient plot throughout. The water-limitedtreatment was continued until an average of a 50% reduction in stomatal conductance was observed.Leaves from water-sufficient and water-limited plants were collected at 92 DAS before recommencingirrigation, while those from ‘recovered’ plants were collected at 107 DAS after watering was resumedat 92 DAS. Labelled aluminium foil was used to wrap the harvested leaves, which was then transferredinto liquid nitrogen for long term storage. All samples were stored in a −80 ◦C freezer before RNAextraction. DNA extraction from the two parental genotypes was completed using the DNA extractionQiagen kit handbook.
2.3. RNA Extraction
RNA was extracted using the RNeasy Qiagen kit (Qiagen, Manchester, UK), according to themanufacturer’s instructions. DNA was eliminated using DNase. A total of 80 µL of DNase I incubationmix, containing 10 µL DNase I stock solution and 70 µL buffer RDD, was added and incubated atroom temperature for 15 min. Nanodrop readings and gel electrophoresis were performed to check thequality and quantity of RNA, as RNA samples required 100 ng/µL for 10 µL for microarray analysis.To make sure that the samples were free from active RNAse, 0.63 µL of 40 U/µL RNasin (Promega,Southampton, UK) was added for every 25 µL of the RNA sample. All samples were tested on anNanodrop and Agilent bioanalyser for integrity (looking at the quality (ratio of 2.0) and integrity(a ratio of 2 for 28S/18S) for respective quantitation) before preparation for the microarray.
2.4. cRNA and Genomic DNA Affymetrix Labelling and Hybridisation
The above RNA extracts were reverse transcribed to synthesize double stranded complementaryDNA (cDNA). After purification of the double-stranded cDNA products, the sample was transcribedin vitro to generate Biotinylated complementary RNAs (cRNAs), followed by purification andfragmentation. The purified and fragmented cRNAs were then hybridised to the Affymetrix SoybeanGene Chip array (ThermoFisher Scientific, Lutterworth, UK). The scanned arrays produced CEL rawdata files that were loaded onto Genespring GX version 13.1 (Agilent Genomics, Santa Clara, CA, USA)for further analysis. The extraction of genomic DNA (gDNA) from the two genotypes was performedusing the DNA extraction Qiagen kit according to manufacturer’s instructions. Extracted DNA waslabelled and hybridised to the Affymetrix Soybean TEST3 array and resulted in the generation ofgDNA cell-intensity files (CEL files), after scanning. To identify probe pairs that efficiently hybridise tothe gDNA, a series of user defined threshold values were evaluated for the signal intensity. The perfectmatch (PM) probes were selected for interpreting the GeneChip arrays challenged with RNA from thespecies of interest [35].
2.5. Probe Selection and Identification of Differentially Expressed Genes
The soybean array contained 37,500 probe sets, each containing 11 probe pairs per probe-set.For each genotype, custom CDF files were obtained, with reference to their gDNA hybridisation signalstrength [36] for a subsequent estimation of the transcript levels. RNA CEL files were normalised inGeneSpring [37] using the Robust Multi-array Average. Differentially expressed genes (DEGs) werecalculated using a t-test test (corrected by Benjamin Hochberg false discovery rate (FDR) multipletesting). Probe-sets with a FDR corrected p-value ≤ 0.05 and fold change of >2 were considered to bedifferentially expressed (either up or down regulated). Principal Component Analysis (PCA) was also
Genes 2017, 8, 121 5 of 19
carried out in GeneSpring and Bioconductor package “prcomp”. BINGO was used for discovering(from input gene lists) over-represented terms from the Gene Ontology [38].
2.6. Construction of the Co-Expression Network
Co-expression network analysis was carried out using the DeGNserver [39] and cytoscape 3.4 [40].Separate networks were generated for each genotype. The input probe-sets were restricted to thosethat were differentially expressed between each pair of treatments (water-limited, water-sufficient andrecovery) and RMA (Robust Multi-Array Average)-normalised values were used across all samples.Links were assigned between pairs of nodes (i.e., probe-sets) when their Spearman’s Rank correlationwas 0.9. The co-expression network was imported into cytoscape for visual representation and networkanalysis. For each genotype, another input file was made which, for each probe-set, defined the parent(DipC or TN), the direction of differential expression caused by dehydration (up or down), and therole identified through homology in relation to drought resistance. This aided the interpretation of thecombined network derived from both genotypes.
2.7. Expression Validation of Differentially Expressed Genes Using Real-Time qPCR
Four genes which were potential candidate dehydration-associated genes (based on their functionalannotations) with a differential expression level of >2-fold change and FDR corrected p-value ≤ 0.05 fromthe differential expression analysis, were chosen for quantitative PCR (qPCR) validation. The actin-11from the available bambara groundnut transcriptome sequence was used as a housekeeping gene.The actin-11 gene is known to be one of the most stable reference genes for gene expressionnormalisation and has been used in soybean and rice specimens [41,42]. PCR forward and reverseprimers were designed using Primer-BLAST [43] for the chosen genes. The primers were designedin three steps. Firstly, the target gene sequence to which the primers needed to be designed wasdownloaded from the soybean database. Secondly, the soybean-specific target gene sequence wasblasted against a bambara groundnut transcriptome generated from RNA-sequencing data for alow-temperature stress experiment [44], by creating a BLAST database. Thirdly, the target genesequence obtained from the bambara groundnut BLAST database was used to search through theBLAST database at NCBI to add weight to the selection of this sequence. Once the gene sequencewas identified in the BLAST database, it was utilised to design primers with an appropriate primersize, GC content, and melting temperature (Tm) using Primer-BLAST. PCR was performed to checkthe quality of all the primers designed for the four dehydration-associated genes. PCR analysiswas performed using the 7000 Sequence Detection System (Applied Biosystems, Cheshire, UK).The annealing temperature was set to 60 ◦C for the primer designed for the genes for PAL1(Phenylalanine ammonia-lyase 1) and COMT (3-Caffeic acid o methyltransferase), and 58 ◦C for theBeta-fructofuranosidase and UBC-2 (ubiquitin conjugating enzyme-2) genes. The cycling parameterswere set as: 95 ◦C for 10 min, 40 cycles of denaturing at 95 ◦C for 30 s, annealing at 60 ◦C/58 ◦Cfor 30 s, and extension at 72 ◦C for 30 s. First strand cDNA synthesis for all the RNA samples wascarried out using a SuperScript III First-Strand Synthesis kit (ThermoFisher Scientific, Lutterworth,UK). The first-strand cDNA was prepared for analysis by qPCR using PerfeCta SYBR Green SuperMix(Quantabio, Beverly, MA, USA) containing 2X reaction buffer (with optimized concentrations ofMgCl2), dNTPs (dATP, dCTP, dGTP, dTTP), AccuStart Tag DNA Polymerase (Quantabio, Beverly, MA,USA) SYBR Green 1 dye, and stabilizers. The synthesized cDNA was cleaned from the remainingRNA using the enzyme mix included in the kit (Escherichia coli RNase H). The qPCR components wereprepared for 10 µL reactions and Melt-curve analysis was performed. The sample cycle threshold (Ct)was standardized for each template based on the actin-11 gene control amplicon behaviour. The 2−∆∆Ct
method was used to analyse the relative changes in gene expression from the qRT-PCR experiment [45].To validate whether the right PCR product was generated for the expression studies, the desiredfragment of intact cDNA for all genes was sent for sequencing after the gel extraction using a QIAquickGel Extraction Kit (Qiagen, Manchester, UK).
Genes 2017, 8, 121 6 of 19
3. Results
3.1. Probe Selection Based on gDNA
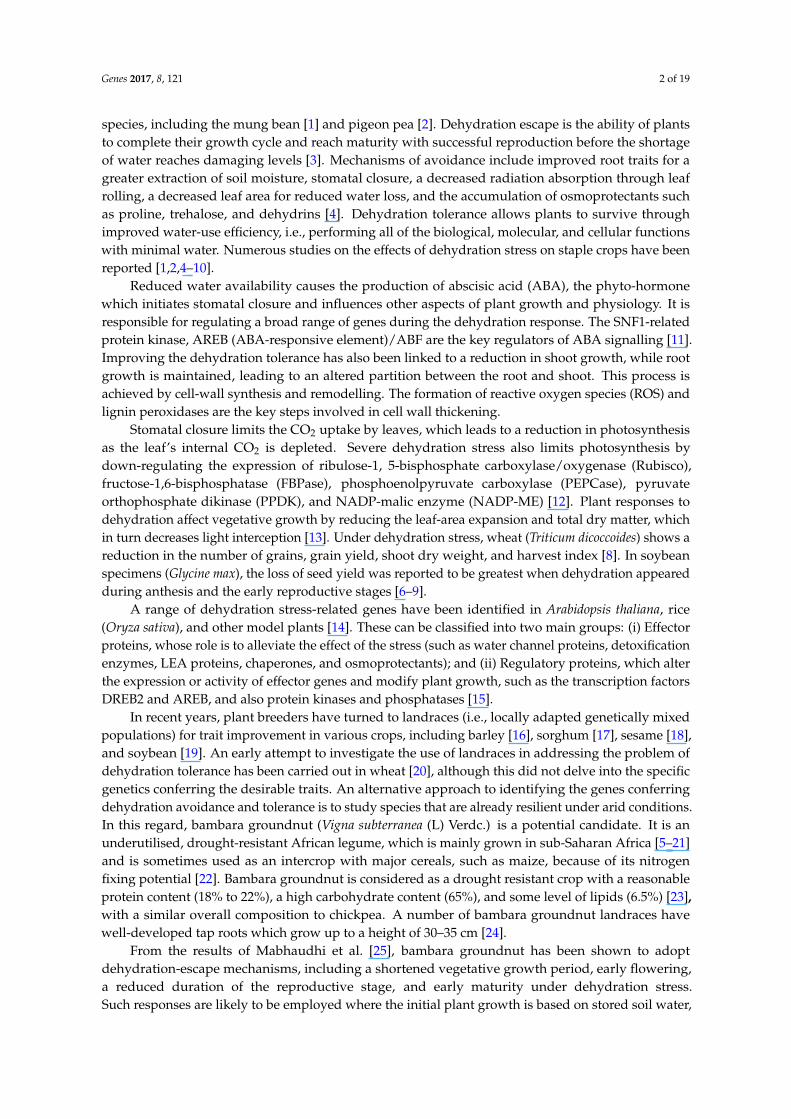
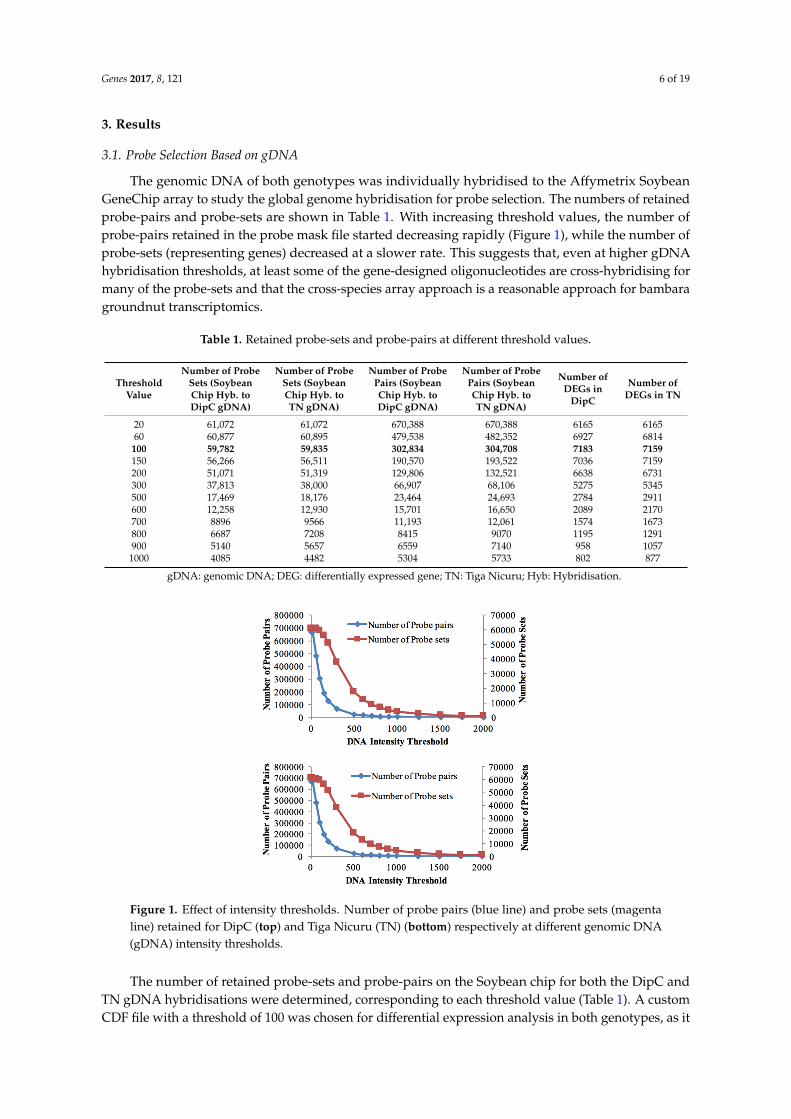
The genomic DNA of both genotypes was individually hybridised to the Affymetrix SoybeanGeneChip array to study the global genome hybridisation for probe selection. The numbers of retainedprobe-pairs and probe-sets are shown in Table 1. With increasing threshold values, the number ofprobe-pairs retained in the probe mask file started decreasing rapidly (Figure 1), while the number ofprobe-sets (representing genes) decreased at a slower rate. This suggests that, even at higher gDNAhybridisation thresholds, at least some of the gene-designed oligonucleotides are cross-hybridising formany of the probe-sets and that the cross-species array approach is a reasonable approach for bambaragroundnut transcriptomics.
Table 1. Retained probe-sets and probe-pairs at different threshold values.
ThresholdValue
Number of ProbeSets (SoybeanChip Hyb. toDipC gDNA)
Number of ProbeSets (SoybeanChip Hyb. toTN gDNA)
Number of ProbePairs (SoybeanChip Hyb. toDipC gDNA)
Number of ProbePairs (SoybeanChip Hyb. toTN gDNA)
Number ofDEGs in
DipC
Number ofDEGs in TN
20 61,072 61,072 670,388 670,388 6165 616560 60,877 60,895 479,538 482,352 6927 6814
100 59,782 59,835 302,834 304,708 7183 7159150 56,266 56,511 190,570 193,522 7036 7159200 51,071 51,319 129,806 132,521 6638 6731300 37,813 38,000 66,907 68,106 5275 5345500 17,469 18,176 23,464 24,693 2784 2911600 12,258 12,930 15,701 16,650 2089 2170700 8896 9566 11,193 12,061 1574 1673800 6687 7208 8415 9070 1195 1291900 5140 5657 6559 7140 958 10571000 4085 4482 5304 5733 802 877
gDNA: genomic DNA; DEG: differentially expressed gene; TN: Tiga Nicuru; Hyb: Hybridisation.
Genes 2017, 8, 121 6 of 19
higher gDNA hybridisation thresholds, at least some of the gene-designed oligonucleotides are cross-hybridising for many of the probe-sets and that the cross-species array approach is a reasonable approach for bambara groundnut transcriptomics.
Table 1. Retained probe-sets and probe-pairs at different threshold values.
Threshold Value
Number of Probe Sets (Soybean Chip Hyb. to DipC gDNA)
Number of Probe Sets (Soybean
Chip Hyb. to TN gDNA)
Number of Probe Pairs (Soybean Chip Hyb. to DipC gDNA)
Number of Probe Pairs (Soybean
Chip Hyb. to TN gDNA)
Number of DEGs in
DipC
Number of DEGs in TN
20 61,072 61,072 670,388 670,388 6165 6165 60 60,877 60,895 479,538 482,352 6927 6814 100 59,782 59,835 302,834 304,708 7183 7159150 56,266 56,511 190,570 193,522 7036 7159 200 51,071 51,319 129,806 132,521 6638 6731 300 37,813 38,000 66,907 68,106 5275 5345 500 17,469 18,176 23,464 24,693 2784 2911 600 12,258 12,930 15,701 16,650 2089 2170 700 8896 9566 11,193 12,061 1574 1673 800 6687 7208 8415 9070 1195 1291 900 5140 5657 6559 7140 958 1057 1000 4085 4482 5304 5733 802 877
gDNA: genomic DNA; DEG: differentially expressed gene; TN: Tiga Nicuru; Hyb: Hybridisation.
Figure 1. Effect of intensity thresholds. Number of probe pairs (blue line) and probe sets (magenta line) retained for DipC (top) and Tiga Nicuru (TN) (bottom) respectively at different genomic DNA (gDNA) intensity thresholds.
The number of retained probe-sets and probe-pairs on the Soybean chip for both the DipC and TN gDNA hybridisations were determined, corresponding to each threshold value (Table 1). A custom CDF file with a threshold of 100 was chosen for differential expression analysis in both genotypes, as it allowed for a good sensitivity to detect the maximum number of differentially-expressed transcripts (Table 1). Furthermore, both genotypes were found to be highly similar in terms of the probe-sets detected at this threshold. A total of 59,533 probe-sets were common to both genotypes at the threshold of 100, while 249 and 302 probe-sets were specific to DipC and TN, respectively. These results therefore suggest a high sequence similarity (>99%) at this level of sequence sampling.
3.2. Principal Component Analysis
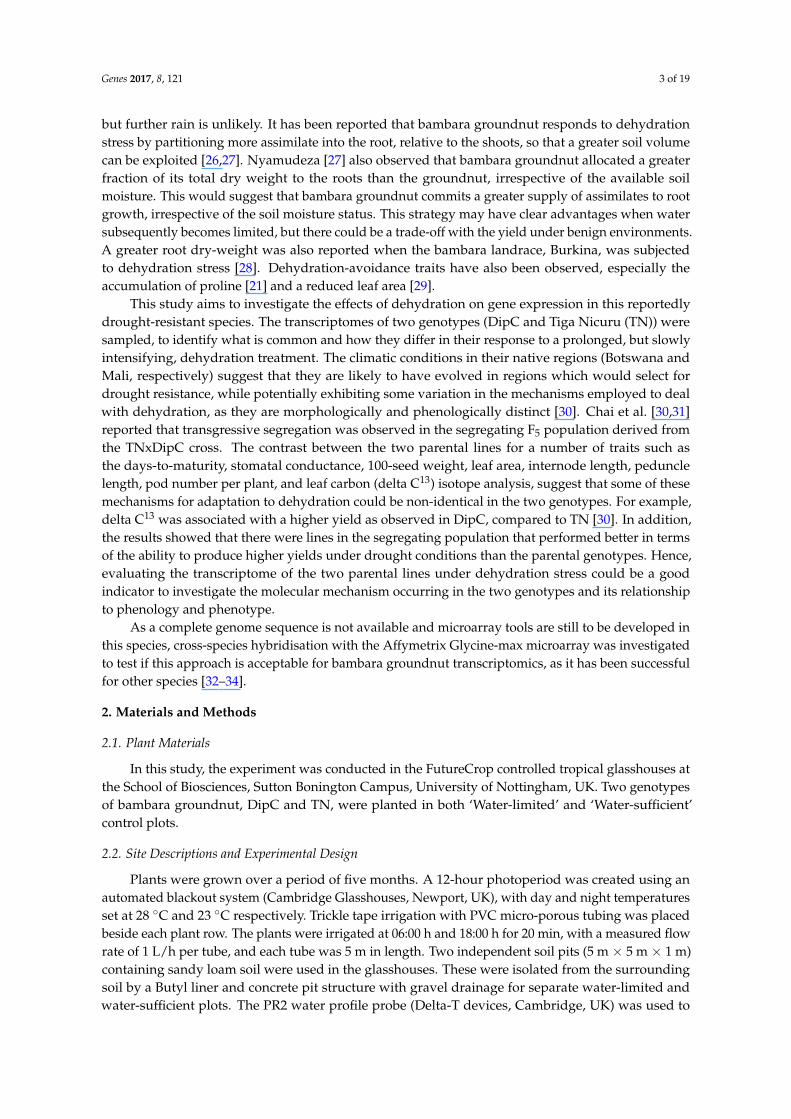
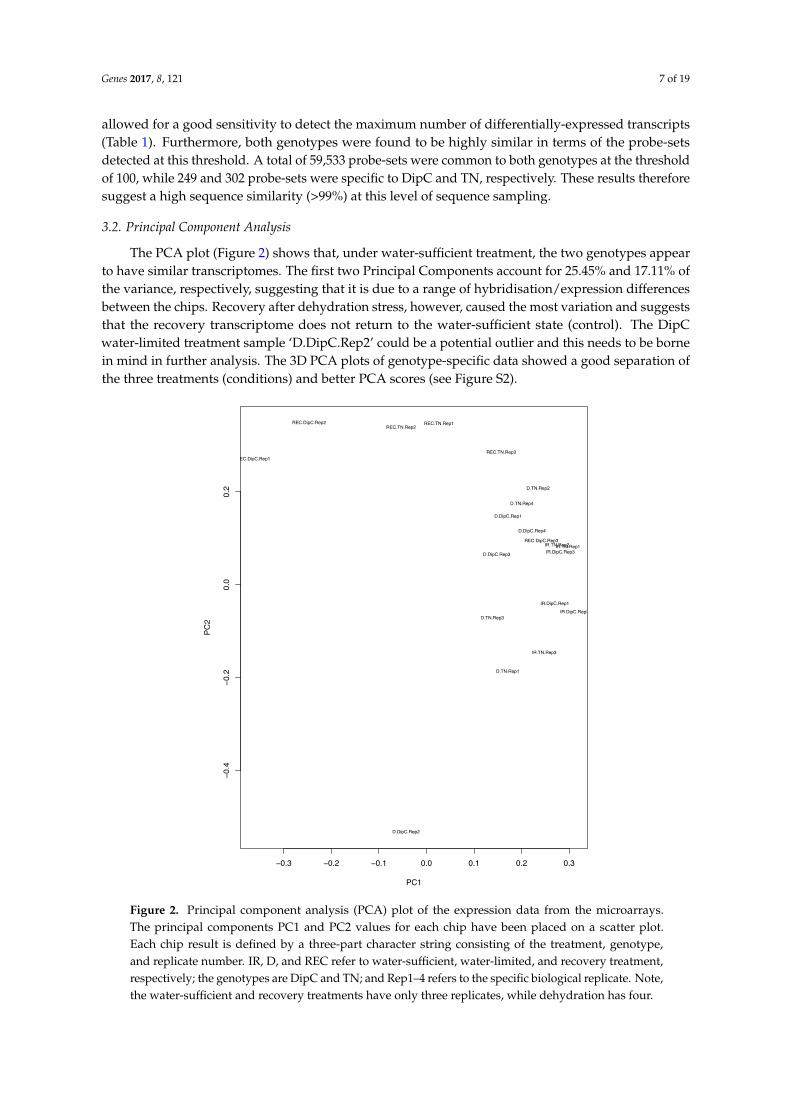
The PCA plot (Figure 2) shows that, under water-sufficient treatment, the two genotypes appear to have similar transcriptomes. The first two Principal Components account for 25.45% and 17.11% of the variance, respectively, suggesting that it is due to a range of hybridisation/expression
Figure 1. Effect of intensity thresholds. Number of probe pairs (blue line) and probe sets (magentaline) retained for DipC (top) and Tiga Nicuru (TN) (bottom) respectively at different genomic DNA(gDNA) intensity thresholds.
The number of retained probe-sets and probe-pairs on the Soybean chip for both the DipC andTN gDNA hybridisations were determined, corresponding to each threshold value (Table 1). A customCDF file with a threshold of 100 was chosen for differential expression analysis in both genotypes, as it
Genes 2017, 8, 121 7 of 19
allowed for a good sensitivity to detect the maximum number of differentially-expressed transcripts(Table 1). Furthermore, both genotypes were found to be highly similar in terms of the probe-setsdetected at this threshold. A total of 59,533 probe-sets were common to both genotypes at the thresholdof 100, while 249 and 302 probe-sets were specific to DipC and TN, respectively. These results thereforesuggest a high sequence similarity (>99%) at this level of sequence sampling.
3.2. Principal Component Analysis
The PCA plot (Figure 2) shows that, under water-sufficient treatment, the two genotypes appearto have similar transcriptomes. The first two Principal Components account for 25.45% and 17.11% ofthe variance, respectively, suggesting that it is due to a range of hybridisation/expression differencesbetween the chips. Recovery after dehydration stress, however, caused the most variation and suggeststhat the recovery transcriptome does not return to the water-sufficient state (control). The DipCwater-limited treatment sample ‘D.DipC.Rep2’ could be a potential outlier and this needs to be bornein mind in further analysis. The 3D PCA plots of genotype-specific data showed a good separation ofthe three treatments (conditions) and better PCA scores (see Figure S2).
Genes 2017, 8, 121 7 of 19
differences between the chips. Recovery after dehydration stress, however, caused the most variation and suggests that the recovery transcriptome does not return to the water-sufficient state (control). The DipC water-limited treatment sample ‘D.DipC.Rep2’ could be a potential outlier and this needs to be borne in mind in further analysis. The 3D PCA plots of genotype-specific data showed a good separation of the three treatments (conditions) and better PCA scores (see Figure S2).
Figure 2. Principal component analysis (PCA) plot of the expression data from the microarrays. The principal components PC1 and PC2 values for each chip have been placed on a scatter plot. Each chip result is defined by a three-part character string consisting of the treatment, genotype, and replicate number. IR, D, and REC refer to water-sufficient, water-limited, and recovery treatment, respectively; the genotypes are DipC and TN; and Rep1–4 refers to the specific biological replicate. Note, the water-sufficient and recovery treatments have only three replicates, while dehydration has four.
3.3. Gene Expression Under Water-Sufficient Conditions
It is pertinent to consider the state of the genotype transcriptomes before any dehydration treatment has taken place. However, owing to the high background noise in microarray studies, it is unclear what intensity level defines a gene as being transcribed. Figure S3 shows that the ranked intensity values follow a roughly sigmoidal curve. The point of inflection (at which the declining gradient is at its shallowest) covers the top two-thirds of the probe-sets, and corresponds to an RMA value of 0.97. This may be a stringent cut-off, given that an RMA value of one corresponds to the average across all probe-sets on the array, but it ensures that there were few, if any, false positives. This left 39,855 probe-sets for DipC and 39,890 for TN. There are 26,496 probe-sets in common between the two genotypes, suggesting differences in the general transcriptional behaviour of the two genotypes.
Figure 2. Principal component analysis (PCA) plot of the expression data from the microarrays.The principal components PC1 and PC2 values for each chip have been placed on a scatter plot.Each chip result is defined by a three-part character string consisting of the treatment, genotype,and replicate number. IR, D, and REC refer to water-sufficient, water-limited, and recovery treatment,respectively; the genotypes are DipC and TN; and Rep1–4 refers to the specific biological replicate. Note,the water-sufficient and recovery treatments have only three replicates, while dehydration has four.
Genes 2017, 8, 121 8 of 19
3.3. Gene Expression Under Water-Sufficient Conditions
It is pertinent to consider the state of the genotype transcriptomes before any dehydrationtreatment has taken place. However, owing to the high background noise in microarray studies, it isunclear what intensity level defines a gene as being transcribed. Figure S3 shows that the rankedintensity values follow a roughly sigmoidal curve. The point of inflection (at which the declininggradient is at its shallowest) covers the top two-thirds of the probe-sets, and corresponds to an RMAvalue of 0.97. This may be a stringent cut-off, given that an RMA value of one corresponds to theaverage across all probe-sets on the array, but it ensures that there were few, if any, false positives.This left 39,855 probe-sets for DipC and 39,890 for TN. There are 26,496 probe-sets in common betweenthe two genotypes, suggesting differences in the general transcriptional behaviour of the two genotypes.
Each genotype had a little over 90 probe sets with functional annotations related to ABA signallingand dehydration responses (see Tables S1 and S2), of which 60 were common to both. These includehomologues of much of the ABA synthesis and response network, the DREB1 transcription factor,Early-Response to Dehydration proteins 3, 4, 8, 14–16, and 18, four osmoprotectant genes, twodehydration-response genes influencing photosynthesis, and 21 other probe sets corresponding todehydration-associated proteins of an unknown function (see Table S3). Table S4 lists the genesdifferentially expressed between the two water-sufficient treated genotypes, but at this stage, nothingstands out as remarkable.
3.4. Identification of Differentially Expressed Genes
For DipC and TN, the numbers of genes differentially expressed as a result of the dehydration andrecovery treatments, and detected by the cross-species microarray approach, are shown in Table 2, withthe full lists of probe-sets and functional annotations presented in Tables S5–S8. The top upregulatedand downregulated genes in DipC and TN are shown in Tables 3 and 4, respectively. The numbers forDipC were consistently higher than for TN, and the water-limited treatment caused more down- thanupregulation, while recovery had the reverse effect.
Table 2. Differentially expressed gene numbers.
Water-Limited versus Water-Sufficient Water-Limited versus Recovery
Up-Regulatedunder
Dehydration
Down-Regulatedunder Recovery
Down-Regulatedunder
Dehydration
Up-Regulatedunder Recovery Up-Regulated Down-Regulated
DipC 80 68 109 94 340 146Tiga Nicuru 28 22 53 42 294 97
Recovery led to many more differentially expressed genes (486 and 391) than dehydration stress(189 and 81). There were six possible system effects that can be gleaned from these data (Figure S4).The upregulated genes under the water-limited treatment that returned to a water-sufficient stateon recovery and the downregulated genes that returned to a normal expression at recovery are thestrictly dehydration-responsive genes (~75% in both genotypes), while those that significantly changedand did not return to the pretreatment levels (~25%) correspond to a dehydration-induced statechange. The latter may be due to epigenetic effects, such as a change in the methylation state ofgene-regulatory regions. The larger numbers of differentially expressed genes from water-limitedconditions to recovery may be accounted for by aging and other highly variable factors (see Figure 2),such as the soil conditions in each pit.
The fold changes of the upregulated genes under dehydration stress in both genotypes arerelatively small (mostly < 4-fold). Furthermore, there were only nine differentially expressed geneswhich were common to both genotypes (see Table 5). The only common upregulated gene wasbeta-fructofuranosidase, which hydrolyses sucrose to provide more glucose, hence playing a potentialrole in osmoprotection and energy production. In contrast, half of the common downregulated genes
Genes 2017, 8, 121 9 of 19
were related to transcription and also play roles in stomatal regulation. Excluding the potential outlier,‘D.DipC.Rep2’ had little effect upon the common gene analysis (Table S9), so it has been included insubsequent analyses.
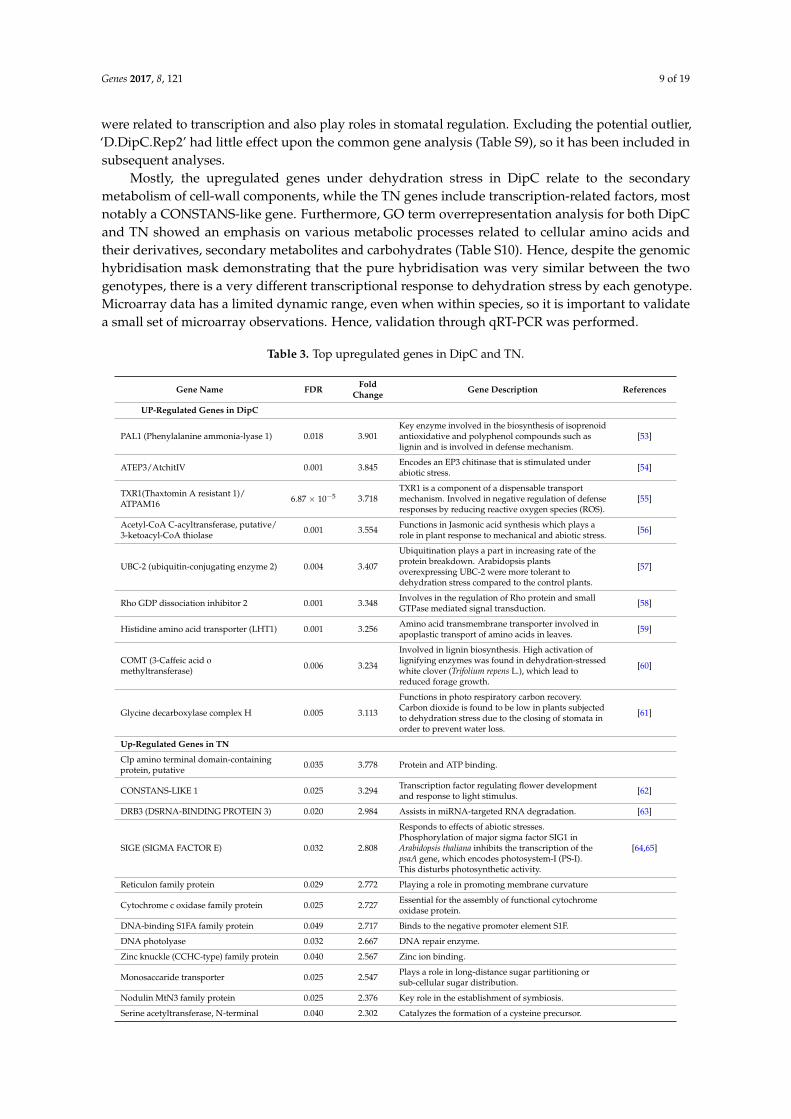
Mostly, the upregulated genes under dehydration stress in DipC relate to the secondarymetabolism of cell-wall components, while the TN genes include transcription-related factors, mostnotably a CONSTANS-like gene. Furthermore, GO term overrepresentation analysis for both DipCand TN showed an emphasis on various metabolic processes related to cellular amino acids andtheir derivatives, secondary metabolites and carbohydrates (Table S10). Hence, despite the genomichybridisation mask demonstrating that the pure hybridisation was very similar between the twogenotypes, there is a very different transcriptional response to dehydration stress by each genotype.Microarray data has a limited dynamic range, even when within species, so it is important to validatea small set of microarray observations. Hence, validation through qRT-PCR was performed.
Table 3. Top upregulated genes in DipC and TN.
Gene Name FDR FoldChange Gene Description References
UP-Regulated Genes in DipC
PAL1 (Phenylalanine ammonia-lyase 1) 0.018 3.901Key enzyme involved in the biosynthesis of isoprenoidantioxidative and polyphenol compounds such aslignin and is involved in defense mechanism.
[53]
ATEP3/AtchitIV 0.001 3.845 Encodes an EP3 chitinase that is stimulated underabiotic stress. [54]
TXR1(Thaxtomin A resistant 1)/ATPAM16 6.87 × 10⁻⁵ 3.718
TXR1 is a component of a dispensable transportmechanism. Involved in negative regulation of defenseresponses by reducing reactive oxygen species (ROS).
[55]
Acetyl-CoA C-acyltransferase, putative/3-ketoacyl-CoA thiolase 0.001 3.554 Functions in Jasmonic acid synthesis which plays a
role in plant response to mechanical and abiotic stress. [56]
UBC-2 (ubiquitin-conjugating enzyme 2) 0.004 3.407
Ubiquitination plays a part in increasing rate of theprotein breakdown. Arabidopsis plantsoverexpressing UBC-2 were more tolerant todehydration stress compared to the control plants.
[57]
Rho GDP dissociation inhibitor 2 0.001 3.348 Involves in the regulation of Rho protein and smallGTPase mediated signal transduction. [58]
Histidine amino acid transporter (LHT1) 0.001 3.256 Amino acid transmembrane transporter involved inapoplastic transport of amino acids in leaves. [59]
COMT (3-Caffeic acid omethyltransferase) 0.006 3.234
Involved in lignin biosynthesis. High activation oflignifying enzymes was found in dehydration-stressedwhite clover (Trifolium repens L.), which lead toreduced forage growth.
[60]
Glycine decarboxylase complex H 0.005 3.113
Functions in photo respiratory carbon recovery.Carbon dioxide is found to be low in plants subjectedto dehydration stress due to the closing of stomata inorder to prevent water loss.
[61]
Up-Regulated Genes in TN
Clp amino terminal domain-containingprotein, putative 0.035 3.778 Protein and ATP binding.
CONSTANS-LIKE 1 0.025 3.294 Transcription factor regulating flower developmentand response to light stimulus. [62]
DRB3 (DSRNA-BINDING PROTEIN 3) 0.020 2.984 Assists in miRNA-targeted RNA degradation. [63]
SIGE (SIGMA FACTOR E) 0.032 2.808
Responds to effects of abiotic stresses.Phosphorylation of major sigma factor SIG1 inArabidopsis thaliana inhibits the transcription of thepsaA gene, which encodes photosystem-I (PS-I).This disturbs photosynthetic activity.
[64,65]
Reticulon family protein 0.029 2.772 Playing a role in promoting membrane curvature
Cytochrome c oxidase family protein 0.025 2.727 Essential for the assembly of functional cytochromeoxidase protein.
DNA-binding S1FA family protein 0.049 2.717 Binds to the negative promoter element S1F.
DNA photolyase 0.032 2.667 DNA repair enzyme.
Zinc knuckle (CCHC-type) family protein 0.040 2.567 Zinc ion binding.
Monosaccaride transporter 0.025 2.547 Plays a role in long-distance sugar partitioning orsub-cellular sugar distribution.
Nodulin MtN3 family protein 0.025 2.376 Key role in the establishment of symbiosis.
Serine acetyltransferase, N-terminal 0.040 2.302 Catalyzes the formation of a cysteine precursor.
Genes 2017, 8, 121 10 of 19
Table 4. Top downregulated genes in DipC and TN.
Gene name FDR Fold Change Gene Description References
Down-Regulated Genes in DipC
Dihydroxyacetone kinase 0.003 6.489 Glycerone kinase activity.
Phosphoglucomutase, putative/glucosephosphomutase, putative 0.007 6.471
Involved in controlling photosynthetic carbon flow and plays essentialrole starch synthesis. Down regulation of photosynthesis-related genewill lead to significant reduction in plant growth.
[66]
Auxin-induced protein 22D AUXX-IAA 0.003 4.627Involved in stress defense response. Many AUXX-IAA genes werefound to be down-regulated in Sorghum bicolor underdrought conditions.
[67]
CP12-1, putative 0.014 4.390Involved in calvin cycle, therefore linked to photosynthesis. Mostdrastic down-regulated genes which were photosynthesis-related wasobserved in barley (Hordeum vulgare L.).
[68]
PHS2 (ALPHA-GLUCANPHOSPHORYLASE 2). 0.014 4.375 Encodes a cytosolic alpha-glucan phosphorylase.
APRR5 (PSEUDO-RESPONSEREGULATOR 5), Pseudo ARR-B family 0.001 4.145 Linked to cytokinin-mediated regulation.
Thiamine biosynthesis family protein 0.002 4.132 Catalyses the activation of small proteins, such as ubiquitin orubiquitin-like proteins.
Zinc finger (C3HC4-type RING finger) 0.007 3.611 Mediate ubiquitin-conjugating enzyme (UBC-2)dependent ubiquitation. [69]
WRKY40 0.033 3.104 Regulator of ABA signalling. It inhibits the expression ofABA-responsive genes ABF4, AB14, AB15, DREB1A, MYB2 and RAB18. [70]
Down-Regulated Genes in TN
AGL83 (AGAMOUS-LIKE 83) 0.025 4.374 DNA-binding transcription factor.
CRR23 (chlororespiratory reduction 23) 0.025 3.625
A subunit of the chloroplast NAD(P)H dehydrogenase complex,involved in PS-I cyclic electron transport. Located on the thylakoidmembrane. Mutant has impaired NAD(P)H dehydrogenase activity.Part of dehydration repressing photosynthesis.
[71]
MYB30 (MYB DOMAIN PROTEIN 30) 0.032 3.250Acts as a positive regulator of hypersensitive cell death and salicylicacid synthesis. Involved in the regulation of abscisic acid(ABA) signalling.
[72]
Photosystem II family protein, putative 0.029 3.158Linked to photosynthesis. Down-regulation of photosynthesis-relatedgenes during dehydration stress was observed in maize (Zea mays),which in turn leads to significant reduction in plant growth.
[73]
Phosphoesterase 0.047 3.136 Hydrolase activity, acting on ester bonds.
Zing-finger (C3HC4-type) 0.045 2.947 Mediate ubiquitin-conjugating enzyme (UBC-2)dependent ubiquitation. [69]
NHX2 (Sodium proton exchanger 2) 0.040 2.742
Involved in antiporter activity. Also involved in potassium ionhomoeostasis and regulation of stomatal closure. Involved in theaccumulation of K+ that drives the rapid stomatal opening.Down-regulation of genes related to stomatal regulation has beenobserved in soybean, which appears to be a part of dehydrationresponse, leading to a reduction in the amount of stomata in leaves.
[74]
Inositol 1,3,4-trisphosphate 5/6-kinase 0.035 2.090 Part of IP3 signal transduction pathway. [75]
Table 5. Overlapping up- and downregulated genes.
Gene Name FDR Fold Change Gene Description References
Up-Regulated Genes
Beta-fructofuranosidase 8.90 × 10⁻⁴ 3.193
Catalyses the hydrolysis of sucrose. A rise inmonosaccharide content caused by theBeta-fructofuranosidase can compensate for thedecline in photosynthetic carbon assimilationindicated by the decrease in net photosynthesis.
[46,47]
Down-Regulated Genes
MEE59 (maternal effectembryo arrest 59) 8.94 × 10⁻⁴ 8.580 Embryo development ending in seed dormancy.
Calcineurin-likephosphoesterase familyprotein (CPPED1)
6.72 × 10⁻⁴ 5.857Plays inhibitory role in glucose uptake.Down-regulation of CPPED1 improvesglucose metabolism.
[48]
Putative lysine-specificdemethylase JMJD5Jumonji/Zinc-finger-classdomain containing protein
0.003 4.971
Plays role in a histone demethylation mechanismthat is conserved from yeast to human.Down-regulation may lead to an increase inmethylated histones and hence generaldown-regulation of transcription.
[49]
MYB-like transcription factor 0.024 4.103Arabidopsis homolog is known to regulatestomatal opening, flower development,and plays role in circadian rhythm.
[50]
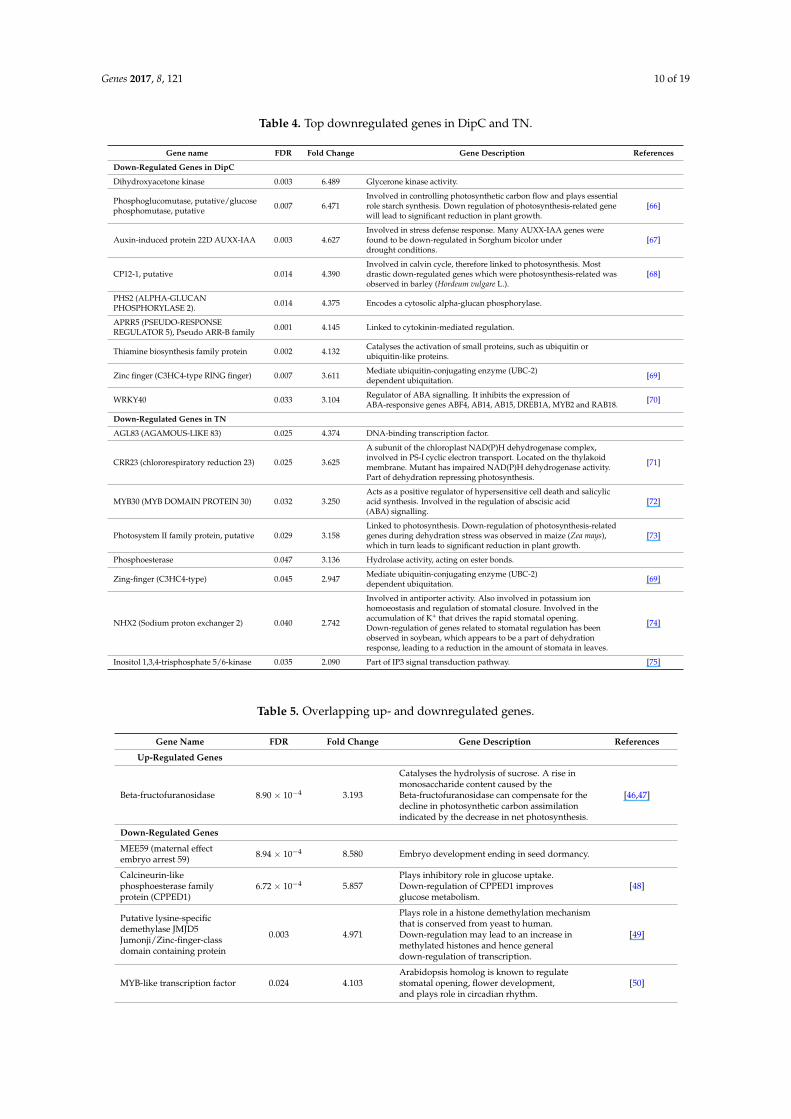
Genes 2017, 8, 121 11 of 19
Table 5. Cont.
Gene Name FDR Fold Change Gene Description References
Down-Regulated Genes
F-box family protein (FBL14) 0.001 3.744 Functions in signal transduction and regulationof cell cycle.
BRH1 (BRASSINOSTEROID-RESPONSIVE RING-H2) 0.007 2.899 BRH1 is known to influence stomatal density. [51]
Bundle-sheath defectiveprotein 2 family/bsd2 family 0.003 2.441 Protein required for post-translational regulation
of Rubisco large subunit (rbcL). [52]
Mitochondrial substratecarrier family protein. 0.030 2.435 Involved in energy transfer.
FDR: false discovery rate.
3.5. Confirmation of Candidate Dehydration-Associated Genes by Real-Time qRT-PCR
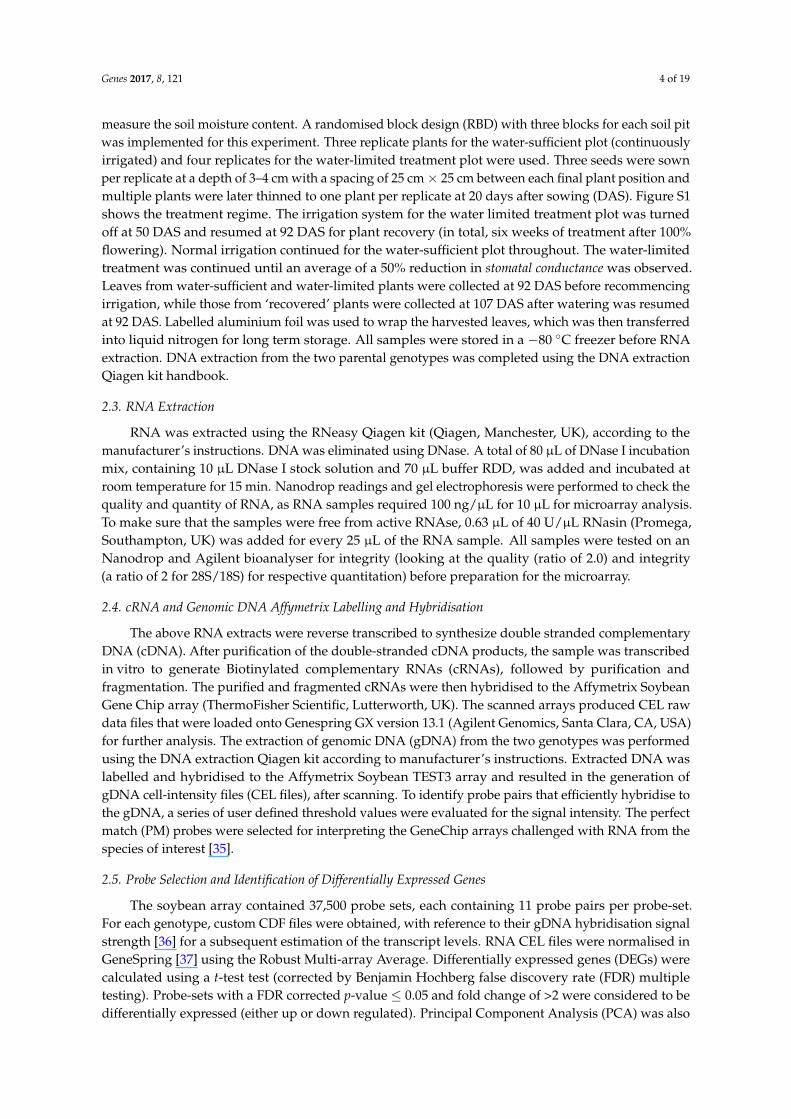
Four differentially expressed genes (PAL1, Beta-fructofuranosidase, COMT and UBC-2) were chosenfor further analysis, as they showed high levels of expression under water-limited treatment [46–53,57–60](Tables 4 and 5) and are dehydration-associated genes based on their functional annotations. Figure 3shows the results of qPCR analysis. The transcript levels of Beta-fructofuranosidase, COMT, and UBC-2confirmed the expression trends seen in the microarray data. PAL1 showed the expected increasein DipC, and an increase in TN was observed, which was not observed in the microarray results.The reason for this is unclear.
Genes 2017, 8, 121 11 of 19
and TN showed an emphasis on various metabolic processes related to cellular amino acids and their derivatives, secondary metabolites and carbohydrates (Table S10). Hence, despite the genomic hybridisation mask demonstrating that the pure hybridisation was very similar between the two genotypes, there is a very different transcriptional response to dehydration stress by each genotype. Microarray data has a limited dynamic range, even when within species, so it is important to validate a small set of microarray observations. Hence, validation through qRT-PCR was performed.
3.5. Confirmation of Candidate Dehydration-Associated Genes by Real-Time qRT-PCR
Four differentially expressed genes (PAL1, Beta-fructofuranosidase, COMT and UBC-2) were chosen for further analysis, as they showed high levels of expression under water-limited treatment [46–53,57–60] (Tables 3 and 4) and are dehydration-associated genes based on their functional annotations. Figure 3 shows the results of qPCR analysis. The transcript levels of Beta-fructofuranosidase, COMT, and UBC-2 confirmed the expression trends seen in the microarray data. PAL1 showed the expected increase in DipC, and an increase in TN was observed, which was not observed in the microarray results. The reason for this is unclear.
Figure 3. Comparison of qPCR and microarray intensity values: Rows (A) and (B) respectively refer to results for DipC and TN. The left- and right-hand pairs of columns correspond to the qPCR and microarray values for DipC and TN, respectively. The gene under study is named at the top of each panel. In order, the investigated genes are Beta-fructofuranosidase, COMT, UBC-2, and PAL1. qPCR and Microarray values are shown as fold changes with respect to the water-sufficient treatment (Irrigated). Error bars denote the standard error. Single and double asterisks indicate that p-value is less than 0.05 and 0.01, respectively, which was assessed by the paired t-test between groups. Irrigated and Drought refer to water-sufficient and water-limited treatments, respectively.
3.6. Transcription Factors Associated with Dehydration Stress
The DEGs genes from both genotypes identified various transcription-related factors (TFs). Common to both genotypes are the downregulation of BRH1, an MYB, MEE59, and JMJD5. The latter is a histone demethylase, so could suggest changes at the epigenetic level of gene expression. Its
Figure 3. Comparison of qPCR and microarray intensity values: Rows (A) and (B) respectively referto results for DipC and TN. The left- and right-hand pairs of columns correspond to the qPCR andmicroarray values for DipC and TN, respectively. The gene under study is named at the top of eachpanel. In order, the investigated genes are Beta-fructofuranosidase, COMT, UBC-2, and PAL1. qPCR andMicroarray values are shown as fold changes with respect to the water-sufficient treatment (Irrigated).Error bars denote the standard error. Single and double asterisks indicate that p-value is less than 0.05and 0.01, respectively, which was assessed by the paired t-test between groups. Irrigated and Droughtrefer to water-sufficient and water-limited treatments, respectively.
Genes 2017, 8, 121 12 of 19
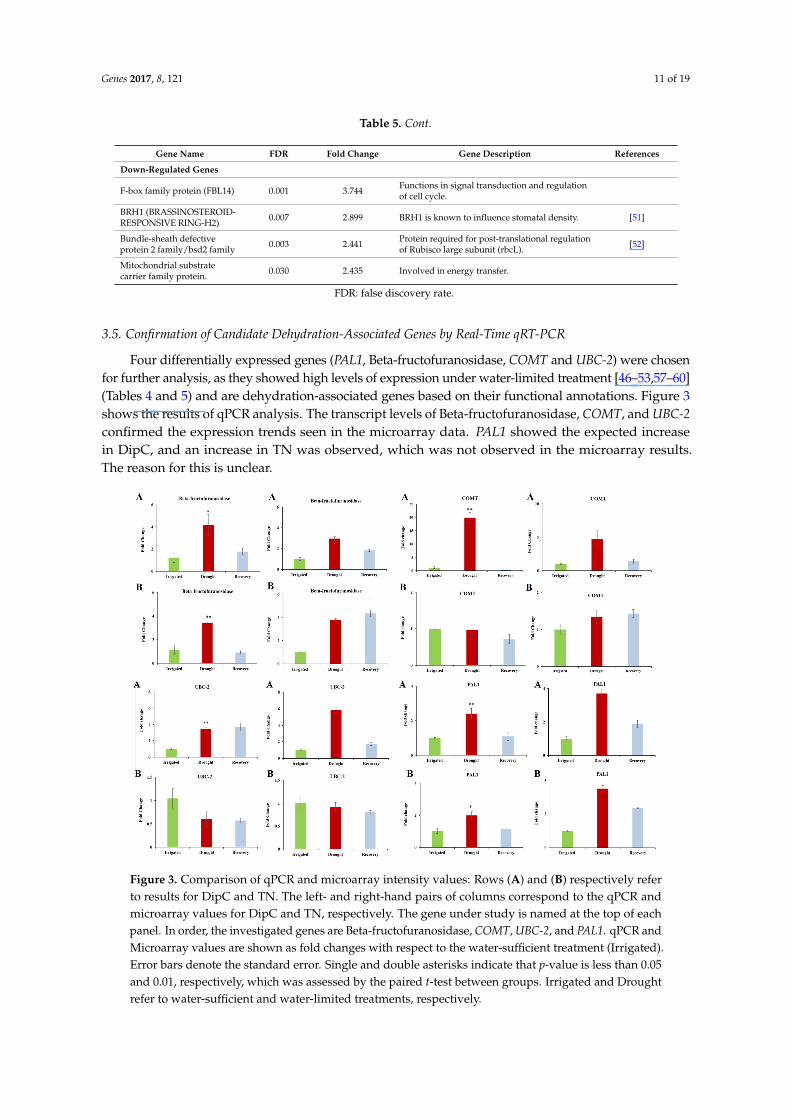
3.6. Transcription Factors Associated with Dehydration Stress
The DEGs genes from both genotypes identified various transcription-related factors (TFs).Common to both genotypes are the downregulation of BRH1, an MYB, MEE59, and JMJD5. The latteris a histone demethylase, so could suggest changes at the epigenetic level of gene expression.Its downregulation could result in the indirect repression of multiple genes. On top of the commongenes, DipC shows the upregulation of two TFs (WRKY51 and a bHLH TF) and the downregulationof four others (ATAUX2-11, WRKY40, a C2H2 Zn-finger, and three probe-sets for GIGANTEA). TN,on the other hand, shows the upregulation of genes for CONSTANS1-like, S1FA DNA-binding,and a double-strand RNA-binding protein (which can aid microRNA-mediated RNA degradation).The downregulated TFs in TN are MYB60 and a second MEE59.
Co-expression networks were individually built for DipC and TN (see Tables S11 and S12), and thedehydration-specific network of each were merged. This resulted in more TFs being included, whichare features of recovery treatment. By looking at the number of links that each node has in thegenotype-specific and merged networks, it is possible to rank the potential importance of the differentTFs (see Table 6). The DipC TFs had a higher number of links than TN. In the case of DipC, WRKY40stands out as being the TF with the most co-expressed genes, with ATAUX2-11, PRR7, and a Zinc-fingerprotein (GmaAffx.33796.3.S1_at) also looking relevant. For TN, however, the TFs are not ranked sohighly, with CONSTANS-like 1 and MYB60 showing the greatest involvement. For this genotype,the differentially expressed TFs in common with DipC seem almost as important.
Table 6. Vertex degrees of differentially expressed transcription factors.
DipC TN
Probe-Set Name V◦Whole V◦Drought Probe-Set Name V◦Whole V◦Drought
Gma.16733.1.S1_at WRKY40 68 17 GmaAffx.45249.1.S1_at CONSTANS-like 1 16 3Gma.6670.1.S1_at PRR7 49 7 GmaAffx.84566.2.S1_at MYB60 8 3
GmaAffx.33796.3.S1_at Zinc-fingerlike C2H2 45 7 GmaAffx.86517.1.S1_at AGL83 6 1
GmaAffx.92679.1.S1_s_at ATAUX2-11 41 9 Gma.1576.1.S1_at Zinc-finger C3HC4 5 1GmaAffx.35309.1.S1_s_at GRF2 35 6GmaAffx.65059.1.S1_at bHLH 32 7
GmaAffx.90399.1.S1_at C3HC4Zinc-finger 31 9
Gma.15774.1.S1_at Zinc-fingerC3HC4 26 3
GmaAffx.53180.1.S1_at PRR7 25 9GmaAffx.80492.1.S1_at PRR5 9 2GmaAffx.73009.2.S1_at WRKY51 7 5Common TFsGmaAffx.60283.1.S1_at BRH1 42 6GmaAffx.9286.1.S1_s_at MYB 27 4
Gma.17248.1.A1_at JMJD5 26 3GmaAffx.10162.1.S1_at MEE59 13 3
V◦ refers to the number of links of each transcription factor (TF) node, in either the whole genotype-specific network,or merged dehydration-specific network.
4. Discussion
Landraces are a potentially valuable resource for finding genes conferring useful agricultural andprocessing traits. Bambara groundnut is an underutilised African legume whose landraces are adapted,in many cases, to arid conditions. We have developed single genotypes derived from landraces foranalysis. There have been several dehydration studies carried out on bambara groundnut, but themolecular mechanisms of how the crop responds and adapts to dehydration stress are still underinvestigation. This study has carried out transcriptomic comparisons in two genotypes of bambaragroundnut, DipC and TN, in an attempt to identify potential genes conferring advantageous traits forcrop growth and yields in marginal environments.
Cross-species hybridisation to the soybean microarray has been shown to be informative forinvestigating the bambara groundnut transcriptome, as good gene (probe-set) retention was observedat high gDNA hybridisation thresholds. In support of the results, Bonthala et al. [44], reported a high

Genes 2017, 8, 121 13 of 19
correlation between cross-species microarray data and RNA-sequencing approaches for detectingdifferentially expressed genes under a cold temperature stress experiment in bambara groundnut.Probe-sets retained by the mask after genomic hybridisation are almost identical (>99%), suggestingthat, at this level of resolution, the two genotypes are highly similar at the sequence level. Four knowndehydration-associated genes, seen to be differentially expressed in these data, were subjected to qPCR,and supported the notion that the observed trends in the microarray data are valid.
The 26,496 probe sets common between the two genotypes, under irrigated conditions,(with a RMA cut-off of 0.97), include some sixty dehydration- and ABA-related genes. The latterinclude genes for producing osmoprotectants. They might provide two components of the dehydrationavoidance capability of these genotypes, by retaining normal cell functioning when water accessbecomes limited. Clearly, if the plant has already activated part of the dehydration response,it could have multiple effects. The presence of osmoprotectants might draw in even more waterthan otherwise might be the case, and there will be a greater proportion of biomass devoted to rootgrowth, resulting in even deeper roots that are better able to survive dehydration later on. Bambaragroundnut is known to allocate a greater fraction of its dry weight to the roots than to the shoots,irrespective of the soil moisture status [27]. This strategy may have clear advantages when watersubsequently becomes limited, suggesting an adaptation to harsh environments and a decision toprioritise survival. In addition, as bambara groundnut is grown in harsh environments and hasnot undergone intensive breeding for the yield and above ground biomass, this suggests that it stillallocates more effort to developing root architecture to handle dehydration when it happens. Moreover,Nayamudeza [27] also stated that the fraction of total dry weight allocated to the roots in bambaragroundnut is greater than that allocated to the groundnut. In addition, a relatively higher expression ofdehydration-associated genes in both genotypes under water-sufficient treatment including ABI1 (ABAInsensitive 1), ABF1 (ABRE binding factor 1), ERD4 (Early responsive to dehydration 4), and RD19(Response to dehydration 19), compared to other species such as Soybean [76] (see Figure S5), suggestthat bambara groundnut could at least be in a partially ready state for dehydration, even in the absenceof dehydration stress. However, further research is needed to validate this hypothesis.
Given that 59,782 and 59,835 probe-sets were used to evaluate the transcriptome changes afterprobe-masking in DipC and TN, respectively, there were only very small numbers of genes significantlydifferentially expressed (189 in DipC and 81 in TN) under water-limited treatment. It could bespeculated that the slow and progressive dehydration stress might not cause significant shock tothe plants.
The upregulated genes in both genotypes were subdivided into ~75% dehydration responsive(with expression levels returning to normal after recovery) and ~25% dehydration perturbed (wherethe expression levels remained altered). In the case of downregulated genes, 80–85% of the expressionlevels returned to being comparable with the non-stressed state. The dehydration-perturbed expressionlevels might be caused by changes at the chromatin level, through DNA methylation or histonemodification, and it is therefore interesting to note that a protein-lysine demethylase is repressedby dehydration.
The above observations show that the two genotypes appear to be very similar in terms of theirgenotype (validating the comparability of the transcriptome data compared using the microarray),while exhibiting differences in their general transcriptional behaviour in water-sufficient conditionsand in response to dehydration stress. However, when the sets of differentially expressed genes arecompared, there is almost no overlap. Out of 189 and 91 genes differentially expressed in DipC andTN, respectively, only nine were common between the two genotypes, suggesting that some of themechanisms for adaption to dehydration are substantially different in the two genotypes. Of these,Beta-fructofuranosidase contributes to osmoprotection [46,47], an MYB gene is associated with thestomatal opening in Arabidopsis thaliana [50], BRH1 affects the stomatal density [51], and bsd2 affectsphotosynthesis in maize [52], while JMJD5 plays an epigenetic role [49], as mentioned above. Figure 4illustrates how two genotypes with very similar genomes may have adapted to achieve dehydration
Genes 2017, 8, 121 14 of 19
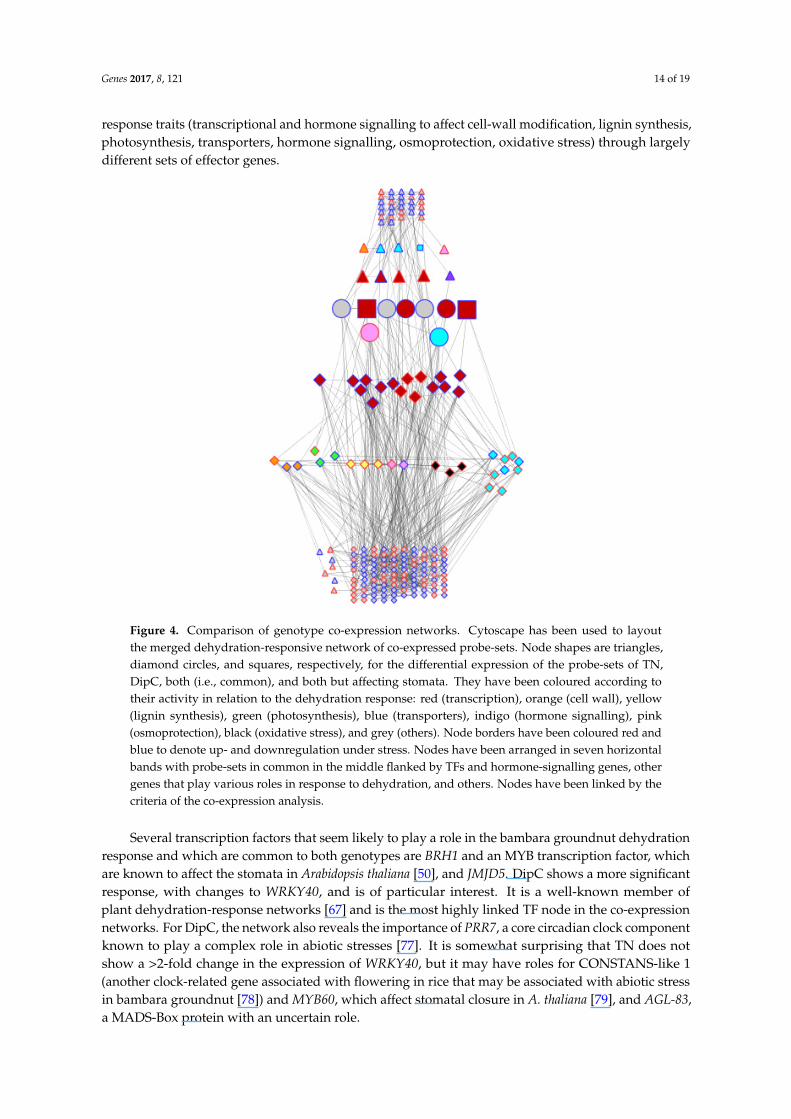
response traits (transcriptional and hormone signalling to affect cell-wall modification, lignin synthesis,photosynthesis, transporters, hormone signalling, osmoprotection, oxidative stress) through largelydifferent sets of effector genes.Genes 2017, 8, 121 14 of 19
Figure 4. Comparison of genotype co-expression networks. Cytoscape has been used to layout the merged dehydration-responsive network of co-expressed probe-sets. Node shapes are triangles, diamond circles, and squares, respectively, for the differential expression of the probe-sets of TN, DipC, both (i.e., common), and both but affecting stomata. They have been coloured according to their activity in relation to the dehydration response: red (transcription), orange (cell wall), yellow (lignin synthesis), green (photosynthesis), blue (transporters), indigo (hormone signalling), pink (osmoprotection), black (oxidative stress), and grey (others). Node borders have been coloured red and blue to denote up- and downregulation under stress. Nodes have been arranged in seven horizontal bands with probe-sets in common in the middle flanked by TFs and hormone-signalling genes, other genes that play various roles in response to dehydration, and others. Nodes have been linked by the criteria of the co-expression analysis.
Several transcription factors that seem likely to play a role in the bambara groundnut dehydration response and which are common to both genotypes are BRH1 and an MYB transcription factor, which are known to affect the stomata in Arabidopsis thaliana [50], and JMJD5. DipC shows a more significant response, with changes to WRKY40, and is of particular interest. It is a well-known member of plant dehydration-response networks [67] and is the most highly linked TF node in the co-expression networks. For DipC, the network also reveals the importance of PRR7, a core circadian clock component known to play a complex role in abiotic stresses [77]. It is somewhat surprising that TN does not show a >2-fold change in the expression of WRKY40, but it may have roles for CONSTANS-like 1 (another clock-related gene associated with flowering in rice that may be associated with abiotic stress in bambara groundnut [78]) and MYB60, which affect stomatal closure in A. thaliana [79], and AGL-83, a MADS-Box protein with an uncertain role.
5. Conclusions
Understanding the mechanisms underlying the ability of crops to produce viable yields under drought conditions is a priority for global food security. This study has examined the transcriptomic reponse to dehydration and recovery in two genotypes derived from landraces of bambara
Figure 4. Comparison of genotype co-expression networks. Cytoscape has been used to layoutthe merged dehydration-responsive network of co-expressed probe-sets. Node shapes are triangles,diamond circles, and squares, respectively, for the differential expression of the probe-sets of TN,DipC, both (i.e., common), and both but affecting stomata. They have been coloured according totheir activity in relation to the dehydration response: red (transcription), orange (cell wall), yellow(lignin synthesis), green (photosynthesis), blue (transporters), indigo (hormone signalling), pink(osmoprotection), black (oxidative stress), and grey (others). Node borders have been coloured red andblue to denote up- and downregulation under stress. Nodes have been arranged in seven horizontalbands with probe-sets in common in the middle flanked by TFs and hormone-signalling genes, othergenes that play various roles in response to dehydration, and others. Nodes have been linked by thecriteria of the co-expression analysis.
Several transcription factors that seem likely to play a role in the bambara groundnut dehydrationresponse and which are common to both genotypes are BRH1 and an MYB transcription factor, whichare known to affect the stomata in Arabidopsis thaliana [50], and JMJD5. DipC shows a more significantresponse, with changes to WRKY40, and is of particular interest. It is a well-known member ofplant dehydration-response networks [67] and is the most highly linked TF node in the co-expressionnetworks. For DipC, the network also reveals the importance of PRR7, a core circadian clock componentknown to play a complex role in abiotic stresses [77]. It is somewhat surprising that TN does notshow a >2-fold change in the expression of WRKY40, but it may have roles for CONSTANS-like 1(another clock-related gene associated with flowering in rice that may be associated with abiotic stressin bambara groundnut [78]) and MYB60, which affect stomatal closure in A. thaliana [79], and AGL-83,a MADS-Box protein with an uncertain role.
Genes 2017, 8, 121 15 of 19
5. Conclusions
Understanding the mechanisms underlying the ability of crops to produce viable yieldsunder drought conditions is a priority for global food security. This study has examined thetranscriptomic reponse to dehydration and recovery in two genotypes derived from landracesof bambara groundnut, in an attempt to investigate the molecular mechanisms occurring in thetwo landraces. In addition, this study also tested whether the cross-species hybridisation to the soybeanmicroarray is suitable for investigating the bambara groundnut transcriptome. It was shown thatmany potential dehydration-responsive genes are expressed, even under water-sufficient conditions,in both landraces, suggesting that bambara groundnut could at least be in a partially ready state fordehydration, even in the absence of dehydration stress. In terms of differential expression, there wereonly a very small number of genes differentially expressed under water-limited treatment in bothlandraces, suggesting that the slow and progressive dehydration stress might not cause a significantshock to the plants. Although the transcription factors and dehydration-response genes were largelydifferent between the two landraces, they may achieve the same effect in terms of survival underdrought conditions. The DipC genotype displayed the differential expression of some well-knowndehydration-associated transcriptions factors (especially WRKY40), while TN showed the differentialexpression of CONSTANS-LIKE 1 and MYB60. Cross-species hybridisation to the soybean microarrayhas been shown to be informative for investigating the bambara groundnut transcriptome, as goodgene retention was observed at high gDNA hybridisation thresholds.
Supplementary Materials: The following are available online at www.mdpi.com/2073-4425/8/4/121/s1.Figure S1: Treatment Regimes, Figure S2: Genotype specific 3D PCA scatter plots, Figure S3: Ranked meanintensities of water-sufficient genotype samples, Figure S4: Categories of system response in gene expression,Figure S5: Comparison between bambara groundnut and soybean for expression levels for dehydration-associatedgenes under water-sufficient conditions. Table S1: Dehydration-associated genes expressed under water-sufficientcondition in DipC, Table S2: Dehydration-associated genes expressed under water-sufficient condition in TN,Table S3: Dehydration-associated genes expressed under water-sufficient condition in both DipC and TN, Table S4:Comparison of water-sufficient conditions transcriptomes of DipC and TN, Table S5: Upregulated DipC genesas a result of water-limited treatment (p-value <= 0.05, Abs. F.C > 2), Table S6: Downregulated DipC genesas a result of water-limited treatment (p-value <= 0.05, Abs. F.C > 2), Table S7: Upregulated TN genes as aresult of water-limited treatment (p-value <= 0.05, Abs. F.C > 2), Table S8: Downregulated TN genes as aresult of water-limited treatment (p-value <= 0.05, Abs. F.C > 2), Table S9: List of differentially expressed genes(water-limited versus water-sufficient) common to DipC and TN when sample D.DipC.rep2 is excluded from theanalysis, Table S10: GO-term overrepresentation of all the gene-sets in Soybean GeneChip array to compare DipC,TN, and Soybean datasets, Table S11: DipC Co-expression network, Table S12: TN Co-expression network.
Acknowledgments: Faraz Khan thank Kevin Ryan and Jiang Lu for their guidance and comments on themanuscript. Faraz Khan thank Crops for the Future (CFF) and the University of Nottingham for providingfunding for the research. Faraz Khan thank the NASC arabidopsis centre for Microarray hybridisation andPresidor Kendabie for the help in the dehydration experiment. Charlie Hodgman thanks the support from theEuropean Research Council Advanced Grant funding (FUTUREROOTS 294729).
Author Contributions: F.K. analysed the microarray data, created custom CDF files, performed qPCR experiments,constructed and analysed the co-expression network, interpreted the results, and drafted the manuscript. C.H.created the merged dehydration-responsive network, co-analysed the co-expression network, interpreted theresults, and critically reviewed the manuscript. H.H.C. performed the dehydration experiment and RNA extraction.S.M. and C.L. conceived the project and critically reviewed the manuscript. I.A. helped with the network andmicroarray analysis.
Conflicts of Interest: The authors declare no conflict of interest.
References
1. Ocampo, E.; Robles, R. Drought tolerance in mungbean. I. Osmotic adjustment in drought stressed mungbean.Philipp. J. Crop Sci. 2000, 25, 1–5.
2. Subbarao, G.V.; Chauhan, Y.S.; Johansen, C. Patterns of osmotic adjustment in pigeonpea—Its importance asa mechanism of drought resistance. Eur. J. Agron. 2000, 12, 239–249. [CrossRef]
3. Kooyers, N.J. The evolution of drought escape and avoidance in natural herbaceous populations. Plant Sci.2015, 234, 155–162. [CrossRef] [PubMed]
Genes 2017, 8, 121 16 of 19
4. Harb, A.; Krishnan, A.; Ambavaram, M.M.R.; Pereira, A. Molecular and physiological analysis of droughtstress in Arabidopsis reveals early responses leading to acclimation in plant growth. Plant Physiol. 2010, 154,1254–1271. [CrossRef] [PubMed]
5. Al Shareef, I.; Sparkes, D.; Azam-Ali, S. Temperature and drought stress effects on growth and developmentof bambara groundnut (Vigna subterranea L.). Exp. Agric. 2013, 50, 72–89. [CrossRef]
6. Eslami, S.V.; Gill, G.S.; McDonald, G. Effect of water stress during seed development on morphometriccharacteristics and dormancy of wild radish (Raphanus raphanistrum L.) seeds. Int. J. Plant Prod. 2012, 4,159–168.
7. Gaur, M.P.; Krishnamurthy, L.; Kashiwagi, J. Improving drought-avoidance root traits in chickpea(Cicer arietinum); current status of research at ICRISAT. Plant Prod. Sci. 2008, 11, 3–11. [CrossRef]
8. Gupta, N.K.; Gupta, S.; Kumar, A. Effect of water stress on physiological attributes and their relationshipwith growth and yield of wheat cultivars at different stages. J. Agron. Crop Sci. 2001, 186, 55–62. [CrossRef]
9. Liu, F.; Jensen, C.R.; Andersen, M.N. Hydraulic and chemical signals in the control of leaf expansion andstomatal conductance in soybean exposed to drought stress. Funct. Plant Biol. 2003, 30, 65–73. [CrossRef]
10. Ludlow, M. Strategies of response to water stress. In Structural and Functional Responses to EnvironmentalStresses: Water Shortage; Kreeeb, K.H., Richter, H., Hinckley, T.M., Eds.; SPB Academic publishing: The Hague,The Netherlands, 1989; pp. 269–282.
11. Nakashima, K.; Yamaguchi-Shinozaki, K.; Shinozaki, K. The transcriptional regulatory network in the droughtresponse and its crosstalk in abiotic stress responses including drought, cold, and heat. Front Plant Sci. 2014,5, 170. [CrossRef] [PubMed]
12. Farooq, M.; Wahid, A.; Kobayashi, N.; Fujita, D.; Basra, S.M.A. Plant drought stress: Effects, mechanismsand management. Agron. Sustain. Dev. 2009, 29, 185–212. [CrossRef]
13. Mwale, S.S.; Azam-Ali, S.N.; Massawe, F.J. Growth and development of bambara groundnut(Vigna subterranea) in response to soil moisture. Eur. J. Agron. 2007, 26, 345–353. [CrossRef]
14. Umezawa, T.; Fujita, M.; Fujita, Y.; Yamaguchi-Shinozaki, K.; Shinozaki, K. Engineering drought tolerancein plants: Discovering and tailoring genes to unlock the future. Curr. Opin. Biotechnol. 2006, 17, 113–122.[CrossRef] [PubMed]
15. Todaka, D.; Shinozaki, K.; Yamaguchi-Shinozaki, K. Recent advances in the dissection of drought-stressregulatory networks and strategies for development of drought-tolerant transgenic rice plants. Front Plant Sci.2015, 6, 84. [CrossRef] [PubMed]
16. Poets, A.M.; Fang, Z.; Clegg, M.T.; Morrell, P.L. Barley landraces are characterized by geographicallyheterogeneous genomic origins. Genome Biol. 2015, 16, 173. [CrossRef] [PubMed]
17. Lasky, J.R.; Upadhyaya, H.D.; Ramu, P.; Deshpande, S.; Hash, C.T.; Bonnette, J.; Juenger, T.E.; Hyma, K.;Acharya, C.; Mitchell, S.E.; et al. Genome-environment associations in sorghum landraces predict adaptivetraits. Sci. Adv. 2015, 1, e1400218. [CrossRef] [PubMed]
18. Wei, X.; Zhu, X.; Yu, J.; Wang, L.; Zhang, Y.; Li, D.; Zhou, R.; Zhang, X. Identification of sesame genomicvariations from genome comparison of landrace and variety. Front. Plant Sci. 2016, 7, 1169. [CrossRef][PubMed]
19. Valliyodan, B.; Nguyen, H.T. Understanding regulatory networks and engineering for enhanced droughttolerance in plants. Curr. Opin. Plant Biol. 2006, 9, 189–195. [CrossRef] [PubMed]
20. Dodig, D.; Zoric, M.; Kandic, V.; Perovic, D.; Šurlan-Momirovic, G. Comparison of responses to drought stressof 100 wheat accessions and landraces to identify opportunities for improving wheat drought resistance.Plant Breed. 2012, 131, 369–379. [CrossRef]
21. Collinson, S.T.; Clawson, E.J.; Azam-Ali, S.N.; Black, C.R. Effects of soil moisture deficits on the waterrelations of bambara groundnut (Vigna subterranea L. Verdc.). J. Exp. Bot. 1997, 48, 877–884. [CrossRef]
22. Linnemann, A.; Azam-ALI, S. Bambara groundnut (Vigna subterraneanea); Williams, J.T., Ed.; Chapman andHall: London, UK, 1993.
23. Mazahib, A.M.; Nuha, M.O.; Salawa, I.S.; Babiker, E.E. Some nutritional attributes of bambara groundnut asinfluenced by domestic processing. Int. Food Res. J. 2013, 20, 1165–1171.
24. Heller, J. Bambara Groundnut: Vigna subterranea (l.) Verdc. Promoting the Conservation and Use of Under-Utilizedand Neglected Crops; IPGRI: Harare, Zimbabwe, 1997.
Genes 2017, 8, 121 17 of 19
25. Mabhaudhi, T.; Modi, A.T.; Beletse, Y.G. Growth, phenological and yield responses of a bambara groundnut(Vigna subterranea L. Verdc) landrace to imposed water stress: II. Rain shelter conditions. Afr. Crop Sci. J.2013, 39, 191–198. [CrossRef]
26. Collinson, S.T.; Azam-Ali, S.N.; Chavula, K.M.; Hodson, D.A. Growth, development and yield of bambaragroundnut (Vigna subterranea) in response to soil moisture. J. Agric. Sci. 1996, 126, 307. [CrossRef]
27. Nayamudeza, P. Crop water use and the root systems of bambara groundnut (Vigna subterranea (L.) verdc.)and groundnut (Arachis hypogaea (L.)) in response to irrigation and drought. Master’s Thesis, The Universityof Nottingham, Nottingham, UK, 1989.
28. Berchie, J.N. Evaluation of five bambara groundnut (Vigna subterranea (L.) verdc.) landraces to heat anddrought stress at Tono-Navrongo, Upper East Region of Ghana. Afr. J. Agric. Res. 2012, 7, 250–256. [CrossRef]
29. Vurayai, R.; Emongor, V.; Moseki, B.; Emongor, V.; Moseki, B. Physiological responses of bambara groundnut(Vigna subterranea L. Verdc) to short periods of water stress during different developmental stages. Asian J.Agric. Sci. 2011, 3, 37–43.
30. Chai, H.H. Developing new approaches for transcriptomics and genomics—Using major resources developedin model species for research in crop species. Ph.D. Thesis, The University of Nottingham, Nottingham,UK, 2014.
31. Chai, H.H.; Massawe, F.; Mayes, S. Effects of mild drought stress on the morpho-physiological characteristicsof a bambara groundnut segregating population. Euphytica 2015, 208, 225–236. [CrossRef]
32. Buckley, B.A. Comparative environmental genomics in non-model species: Using heterologous hybridizationto DNA-based microarrays. J. Exp. Biol. 2007, 210, 1602–1606. [CrossRef] [PubMed]
33. Davey, M.W.; Graham, N.S.; Vanholme, B.; Swennen, R.; May, S.T.; Keulemans, J. Heterologousoligonucleotide microarrays for transcriptomics in a non-model species; a proof-of-concept study of droughtstress in musa. BMC Genomics 2009, 10, 436. [CrossRef] [PubMed]
34. Pariset, L.; Chillemi, G.; Bongiorni, S.; Spica, V.R.; Valentini, A. Microarrays and high-throughputtranscriptomic analysis in species with incomplete availability of genomic sequences. New Biotechnol.2009, 25, 272–279. [CrossRef] [PubMed]
35. Hammond, J.P.; Broadley, M.R.; Craigon, D.J.; Higgins, J.; Emmerson, Z.F.; Townsend, H.J.; White, P.J.;May, S.T. Using genomic DNA-based probe-selection to improve the sensitivity of high-densityoligonucleotide arrays when applied to heterologous species. Plant Methods 2005, 1, 10. [CrossRef] [PubMed]
36. Graham, N.S.; May, S.T.; Daniel, Z.C.; Emmerson, Z.F.; Brameld, J.M.; Parr, T. Use of the affymetrix humangenechip array and genomic DNA hybridisation probe selection to study ovine transcriptomes. Animal 2011,5, 861–866. [CrossRef] [PubMed]
37. Chu, L.; Scharf, E.; Kondo, T. Genespring tm: Tools for analyzing data microarray expression. Genome Inform.2001, 12, 227–229.
38. Maere, S.; Heymans, K.; Kuiper, M. Bingo: A cytoscape plugin to assess overrepresentation of gene ontologycategories in biological networks. Bioinformatics 2005, 21, 3448–3449. [CrossRef] [PubMed]
39. Li, J.; Wei, H.; Zhao, P.X. DeGNServer: Deciphering genome-scale gene networks through high performancereverse engineering analysis. Biomed. Res. Int. 2013, 2013, 856325. [CrossRef] [PubMed]
40. Smoot, M.E.; Ono, K.; Ruscheinski, J.; Wang, P.-L.; Ideker, T. Cytoscape 2.8: New features for data integrationand network visualization. Bioinformatics 2011, 27, 431–432. [CrossRef] [PubMed]
41. Hu, R.; Fan, C.; Li, H.; Zhang, Q.; Fu, Y.-F. Evaluation of putative reference genes for gene expressionnormalization in soybean by quantitative real-time RT-PCR. BMC Mol. Biol. 2009, 10, 93. [CrossRef][PubMed]
42. Jain, M.; Nijhawan, A.; Tyagi, A.K.; Khurana, J.P. Validation of housekeeping genes as internal control forstudying gene expression in rice by quantitative real-time pcr. Biochem. Biophys. Res. Commun. 2006, 345,646–651. [CrossRef] [PubMed]
43. Ye, J.; Coulouris, G.; Zaretskaya, I.; Cutcutache, I.; Rozen, S.; Madden, T.L. Primer-blast: A tool to designtarget-specific primers for polymerase chain reaction. BMC Bioinform. 2012, 13, 134. [CrossRef] [PubMed]
44. Bonthala, V.S.; Mayes, K.; Moreton, J.; Blythe, M.; Wright, V.; May, S.T.; Massawe, F.; Mayes, S.; Twycross, J.Identification of gene modules associated with low temperatures response in bambara groundnut bynetwork-based analysis. PLoS ONE 2016, 11, e0148771. [CrossRef] [PubMed]
45. Livak, K.J.; Schmittgen, T.D. Analysis of relative gene expression data using real-time quantitative PCR andthe 2−∆∆ct method. Methods 2001, 25, 402–408. [CrossRef] [PubMed]
Genes 2017, 8, 121 18 of 19
46. Li, Y.C.; Meng, F.R.; Zhang, C.Y.; Zhang, N.; Sun, M.S.; Ren, J.P.; Niu, H.B.; Wang, X.; Yin, J.Comparative analysis of water stress-responsive transcriptomes in drought-susceptible and -tolerant wheat(Triticum aestivum L.). J. Plant Biol. 2012, 55, 349–360. [CrossRef]
47. Majlath, I.; Darko, E.; Palla, B.; Nagy, Z.; Janda, T.; Szalai, G. Reduced light and moderate water deficiencysustain nitrogen assimilation and sucrose degradation at low temperature in durum wheat. J. Plant Physiol.2016, 191, 149–158. [CrossRef] [PubMed]
48. Vaittinen, M.; Kaminska, D.; Kakela, P.; Eskelinen, M.; Kolehmainen, M.; Pihlajamaki, J.; Uusitupa, M.;Pulkkinen, L. Downregulation of cpped1 expression improves glucose metabolism in vitro in adipocytes.Diabetes 2013, 62, 3747–3750. [CrossRef] [PubMed]
49. Tsukada, Y.-i.; Fang, J.; Erdjument-Bromage, H.; Warren, M.E.; Borchers, C.H.; Tempst, P.; Zhang, Y. Histonedemethylation by a family of JMJC domain-containing proteins. Nature 2006, 439, 811–816. [CrossRef][PubMed]
50. Ding, Y.; Liu, N.; Virlouvet, L.; Riethoven, J.-J.; Fromm, M.; Avramova, Z. Four distinct types of dehydrationstress memory genes in Arabidopsis thaliana. BMC Plant Biol. 2013, 13, 229. [CrossRef] [PubMed]
51. Kim, T.W.; Michniewicz, M.; Bergmann, D.C.; Wang, Z.Y. Brassinosteroid regulates stomatal development byGSK3-mediated inhibition of a MAPK pathway. Nature 2012, 482, 419–422. [CrossRef] [PubMed]
52. Brutnell, T.P.; Sawers, R.J.H.; Mant, A.; Langdale, J.A. Bundle sheath defective2, a novel protein required forpost-translational regulation of the RBCL gene of maize. Plant Cell 1999, 11, 849–864. [CrossRef] [PubMed]
53. Gholizadeh, A. Effects of drought on the activity of phenylalanine ammonia lyase in the leaves and roots ofmaize inbreds. Aust. J. Basic Appl. Sci. 2011, 5, 952–956.
54. Gerhardt, L.B.d.A.; Magioli, C.; Perez, A.B.U.C.M.; Margis, R.; Sachetto-Martins, G.; Margis-Pinheiro, M.AtCHITIV gene expression is stimulated under abiotic stresses and is spatially and temporally regulatedduring embryo development. Genetics Mol. Biol. 2004, 27, 118–123. [CrossRef]
55. Huang, Y.; Chen, X.; Liu, Y.; Roth, C.; Copeland, C.; McFarlane, H.E.; Huang, S.; Lipka, V.; Wiermer, M.;Li, X. Mitochondrial atPAM16 is required for plant survival and the negative regulation of plant immunity.Nat. Commun. 2013, 4, 2558. [CrossRef] [PubMed]
56. Wasternack, C. Jasmonates: An update on biosynthesis, signal transduction and action in plant stressresponse, growth and development. Ann. Bot. 2007, 100, 681–697. [CrossRef] [PubMed]
57. Zhou, L.; Liu, Y.; Liu, Z.; Kong, D.; Duan, M.; Luo, L. Genome-wide identification and analysis ofdrought-responsive micrornas in Oryza sativa. J. Exp. Bot. 2010, 61, 4157–4168. [CrossRef] [PubMed]
58. Scherle, P.; Behrens, T.; Staudt, L.M. Ly-gdi, a gdp-dissociation inhibitor of the rhoa GTP-binding protein,is expressed preferentially in lymphocytes. Proc. Natl. Acad. Sci. USA 1993, 90, 7568–7572. [CrossRef][PubMed]
59. Chen, L.; Bush, D.R. Lht1, a lysine- and histidine-specific amino acid transporter in arabidopsis. Plant Physiol.1997, 115, 1127–1134. [CrossRef] [PubMed]
60. Hu, Y.; Li, W.C.; Xu, Y.Q.; Li, G.J.; Liao, Y.; Fu, F.L. Differential expression of candidate genes for ligninbiosynthesis under drought stress in maize leaves. J. Appl. Genetics 2009, 50, 213–223. [CrossRef] [PubMed]
61. Srinivasan, R.; Oliver, D.J. H-protein of the glycine decarboxylase multienzyme complex: ComplementaryDNA encoding the protein from Arabidopsis thaliana. Plant Physiol. 1992, 98, 1518–1519. [CrossRef] [PubMed]
62. Ledger, S.; Strayer, C.; Ashton, F.; Kay, S.A.; Putterill, J. Analysis of the function of two circadian-regulatedconstans-like genes. Plant J. 2001, 26, 15–22. [CrossRef] [PubMed]
63. Eamens, A.L.; Wook Kim, K.; Waterhouse, P.M. Drb2, drb3 and drb5 function in a non-canonical microRNApathway in Arabidopsis thaliana. Plant Signal. Behav. 2012, 7, 1224–1229. [CrossRef] [PubMed]
64. Ades, S.E.; Grigorova, I.L.; Gross, C.A. Regulation of the alternative sigma factor σ(e) during initiation,adaptation, and shutoff of the extracytoplasmic heat shock response in Escherichia coli. J. Bacteriol. 2003, 185,2512–2519. [CrossRef] [PubMed]
65. Shimizu, M.; Kato, H.; Ogawa, T.; Kurachi, A.; Nakagawa, Y.; Kobayashi, H. Sigma factor phosphorylation inthe photosynthetic control of photosystem stoichiometry. Proc. Natl. Acad. Sci. USA 2010, 107, 10760–10764.[CrossRef] [PubMed]
66. Periappuram, C.; Steinhauer, L.; Barton, D.L.; Taylor, D.C.; Chatson, B.; Zou, J. The plastidicphosphoglucomutase from arabidopsis. A reversible enzyme reaction with an important role in metaboliccontrol. Plant Physiol. 2000, 122, 1193–1200. [CrossRef] [PubMed]
Genes 2017, 8, 121 19 of 19
67. Singh, D.; Laxmi, A. Transcriptional regulation of drought response: A tortuous network of transcriptionalfactors. Front. Plant Sci. 2015, 6, 895. [CrossRef] [PubMed]
68. Wedel, N.; Soll, J.; Paap, B.K. Cp12 provides a new mode of light regulation of Calvin cycle activity in higherplants. Proc. Natl. Acad. Sci. USA 1997, 94, 10479–10484. [CrossRef] [PubMed]
69. Lorick, K.L.; Jensen, J.P.; Fang, S.; Ong, A.M.; Hatakeyama, S.; Weissman, A.M. Ring fingers mediateubiquitin-conjugating enzyme (E2)-dependent ubiquitination. Proc. Natl. Acad. Sci. USA 1999, 96,11364–11369. [CrossRef] [PubMed]
70. Lindemose, S.; Shea, C.; Jensen, K.M.; Skriver, K. Structure, function and networks of transcription factorsinvolved in abiotic stress responses. Int. J. Mol. Sci. 2013, 14, 5842–5878. [CrossRef] [PubMed]
71. Peng, L.; Yamamoto, H.; Shikanai, T. Structure and biogenesis of the chloroplast NAD(P)H dehydrogenasecomplex. BBA Bioenerg. 2011, 1807, 945–953. [CrossRef] [PubMed]
72. Liu, L.; Zhang, J.; Adrian, J.; Gissot, L.; Coupland, G.; Yu, D.; Turck, F. Elevated levels of MYB30 in thephloem accelerate flowering in arabidopsis through the regulation of flowering locus t. PLoS ONE 2014, 9,e89799. [CrossRef] [PubMed]
73. Marshall, A.; Aalen, R.B.; Audenaert, D.; Beeckman, T.; Broadley, M.R.; Butenko, M.A.; Cano-Delgado, A.I.;de Vries, S.; Dresselhaus, T.; Felix, G.; et al. Tackling drought stress: Receptor-like kinases present newapproaches. Plant Cell 2012, 24, 2262–2278. [CrossRef] [PubMed]
74. Tripathi, P.; Rabara, R.C.; Reese, R.N.; Miller, M.A.; Rohila, J.S.; Subramanian, S.; Shen, Q.J.; Morandi, D.;Bucking, H.; Shulaev, V.; et al. A toolbox of genes, proteins, metabolites and promoters for improving droughttolerance in soybean includes the metabolite coumestrol and stomatal development genes. BMC Genomics2016, 17, 102. [CrossRef] [PubMed]
75. Xia, H.J.; Guang, Y. Inositol 1,4,5-trisphosphate 3-kinases: Functions and regulations. Cell Res 2005, 15, 83–91.[CrossRef] [PubMed]
76. Le, D.T.; Nishiyama, R.; Watanabe, Y.; Tanaka, M.; Seki, M.; Ham le, H.; Yamaguchi-Shinozaki, K.;Shinozaki, K.; Tran, L.S. Differential gene expression in soybean leaf tissues at late developmental stagesunder drought stress revealed by genome-wide transcriptome analysis. PLoS ONE 2012, 7, e49522. [CrossRef][PubMed]
77. Grundy, J.; Stoker, C.; Carré, I.A. Circadian regulation of abiotic stress tolerance in plants. Front. Plant Sci.2015, 6, 648. [CrossRef] [PubMed]
78. Liu, J.; Shen, J.; Xu, Y.; Li, X.; Xiao, J.; Xiong, L. Ghd2, a constans-like gene, confers drought sensitivitythrough regulation of senescence in rice. J. Exp. Bot. 2016, 67, 5785–5798. [CrossRef] [PubMed]
79. Oh, J.E.; Kwon, Y.; Kim, J.H.; Noh, H.; Hong, S.-W.; Lee, H. A dual role for myb60 in stomatal regulationand root growth of Arabidopsis thaliana under drought stress. Plant Mol. Biol. 2011, 77, 91–103. [CrossRef][PubMed]
© 2017 by the authors. Licensee MDPI, Basel, Switzerland. This article is an open accessarticle distributed under the terms and conditions of the Creative Commons Attribution(CC BY) license (http://creativecommons.org/licenses/by/4.0/).
View publication statsView publication stats