Embed Size (px)
Citation preview
Meta-analysis and databasing of neuroimaging
studies
Finn Arup Nielsen
Lundbeck Foundation Center for Integrated Molecular Brain Imaging
at
Informatics and Mathematical Modelling
Technical University of Denmark
and
Neurobiology Research Unit,
Copenhagen University Hospital Rigshospitalet
October 13, 2009
Meta-analysis and databasing
When you have published a study you haven’t published the study!
Finn Arup Nielsen 1 October 13, 2009
Meta-analysis and databasing
Publishing a study means:
Writing a ‘paper’ in a text processing environment, submitting it to a
journal and let the journal publish the paper.
Finn Arup Nielsen 2 October 13, 2009
Meta-analysis and databasing
Publishing a study means:
Writing a ‘paper’ in a text processing environment, submitting it to a
journal and let the journal publish the paper.
What is wrong with that?
Finn Arup Nielsen 3 October 13, 2009
Meta-analysis and databasing
Publishing a study means:
Writing a ‘paper’ in a text processing environment, submitting it to a
journal and let the journal publish the paper.
What is wrong with that?
The results is typically a neuroimage volume, but the paper cannot display
volume. ©..⌢
Finn Arup Nielsen 4 October 13, 2009

Meta-analysis and databasing
Publishing a study means:
Writing a ‘paper’ in a text processing environment, submitting it to a
journal and let the journal publish the paper.
What is wrong with that?
The results is typically a neuroimage volume, but the paper cannot display
volume. ©..⌢
Even without the volume the data and the meta-data of the study in the
paper are not in a form where it is readable for a computer. ©..⌢
Finn Arup Nielsen 5 October 13, 2009
Meta-analysis and databasing
Publishing a study means:
Writing a ‘paper’ in a text processing environment, submitting it to a
journal and let the journal publish the paper.
What is wrong with that?
The results is typically a neuroimage volume, but the paper cannot display
volume. ©..⌢
Even without the volume the data and the meta-data of the study in the
paper are not in a form where it is readable for a computer. ©..⌢
The paper is not published for computers to read its specialized data. ©..⌢
Finn Arup Nielsen 6 October 13, 2009
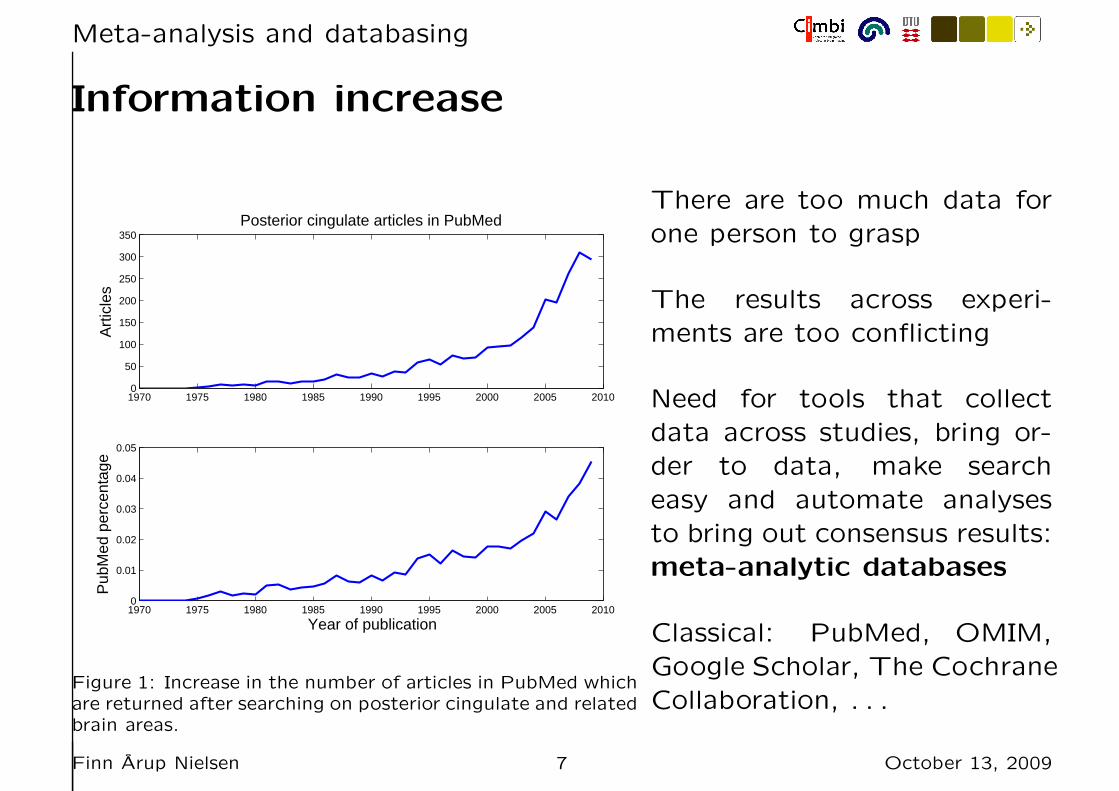
Meta-analysis and databasing
Information increase
1970 1975 1980 1985 1990 1995 2000 2005 20100
50
100
150
200
250
300
350Posterior cingulate articles in PubMed
Art
icle
s
1970 1975 1980 1985 1990 1995 2000 2005 20100
0.01
0.02
0.03
0.04
0.05
Year of publication
Pub
Med
per
cent
age
Figure 1: Increase in the number of articles in PubMed whichare returned after searching on posterior cingulate and relatedbrain areas.
There are too much data for
one person to grasp
The results across experi-
ments are too conflicting
Need for tools that collect
data across studies, bring or-
der to data, make search
easy and automate analyses
to bring out consensus results:
meta-analytic databases
Classical: PubMed, OMIM,
Google Scholar, The Cochrane
Collaboration, . . .
Finn Arup Nielsen 7 October 13, 2009
Meta-analysis and databasing
When you have published your study you need to publish you data in
neuroinformatics databases.
Finn Arup Nielsen 8 October 13, 2009
Meta-analysis and databasing
Content
Neuroinformatics databases for MRI & Co. results
Searching in databases.
Meta-analysis of coordinates: Supervized with one set of coordinates.
Supervized with two sets of coordinates. Unsupervized.
Text mining
Combining text mining and coordinate-based meta-analysis.
Finn Arup Nielsen 9 October 13, 2009
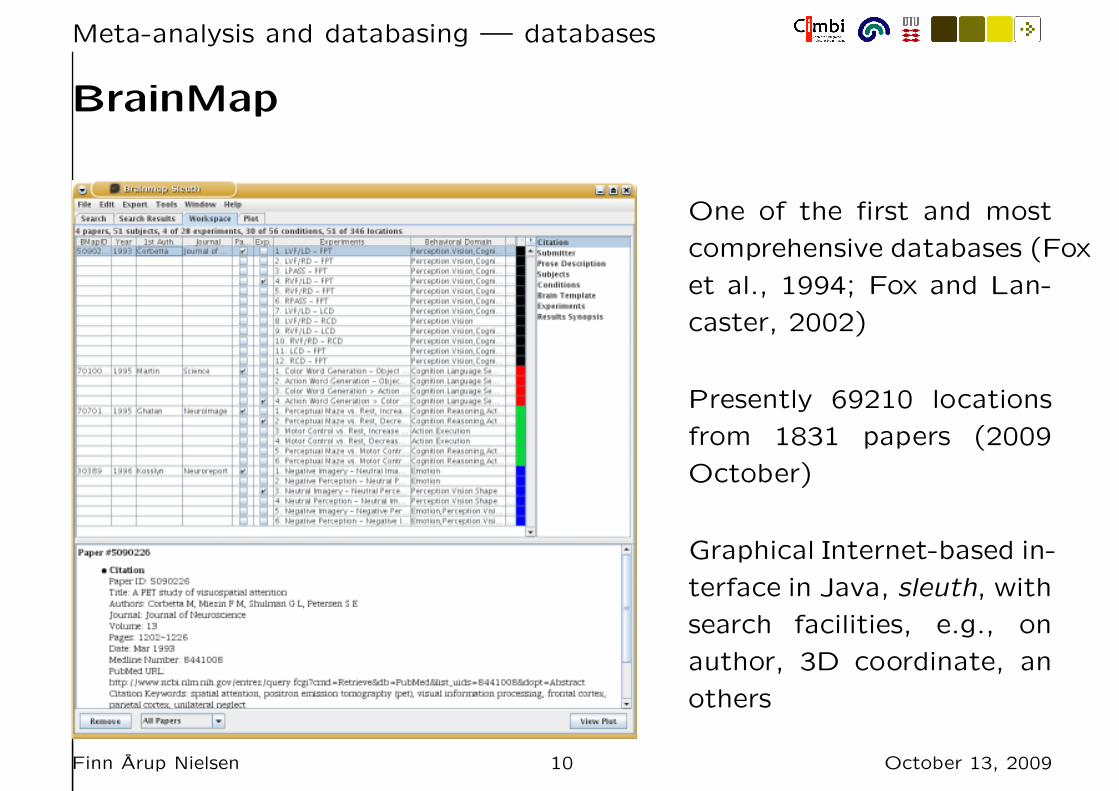
Meta-analysis and databasing — databases
BrainMap
One of the first and most
comprehensive databases (Fox
et al., 1994; Fox and Lan-
caster, 2002)
Presently 69210 locations
from 1831 papers (2009
October)
Graphical Internet-based in-
terface in Java, sleuth, with
search facilities, e.g., on
author, 3D coordinate, an
others
Finn Arup Nielsen 10 October 13, 2009
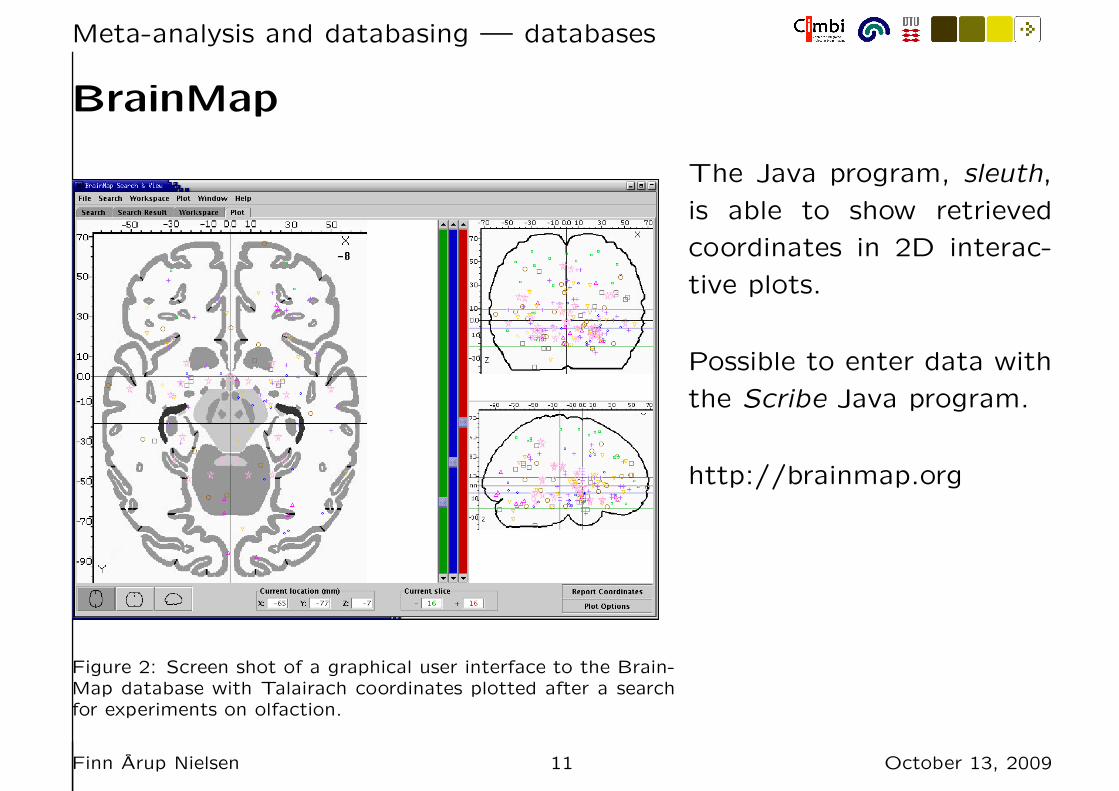
Meta-analysis and databasing — databases
BrainMap
Figure 2: Screen shot of a graphical user interface to the Brain-Map database with Talairach coordinates plotted after a searchfor experiments on olfaction.
The Java program, sleuth,
is able to show retrieved
coordinates in 2D interac-
tive plots.
Possible to enter data with
the Scribe Java program.
http://brainmap.org
Finn Arup Nielsen 11 October 13, 2009
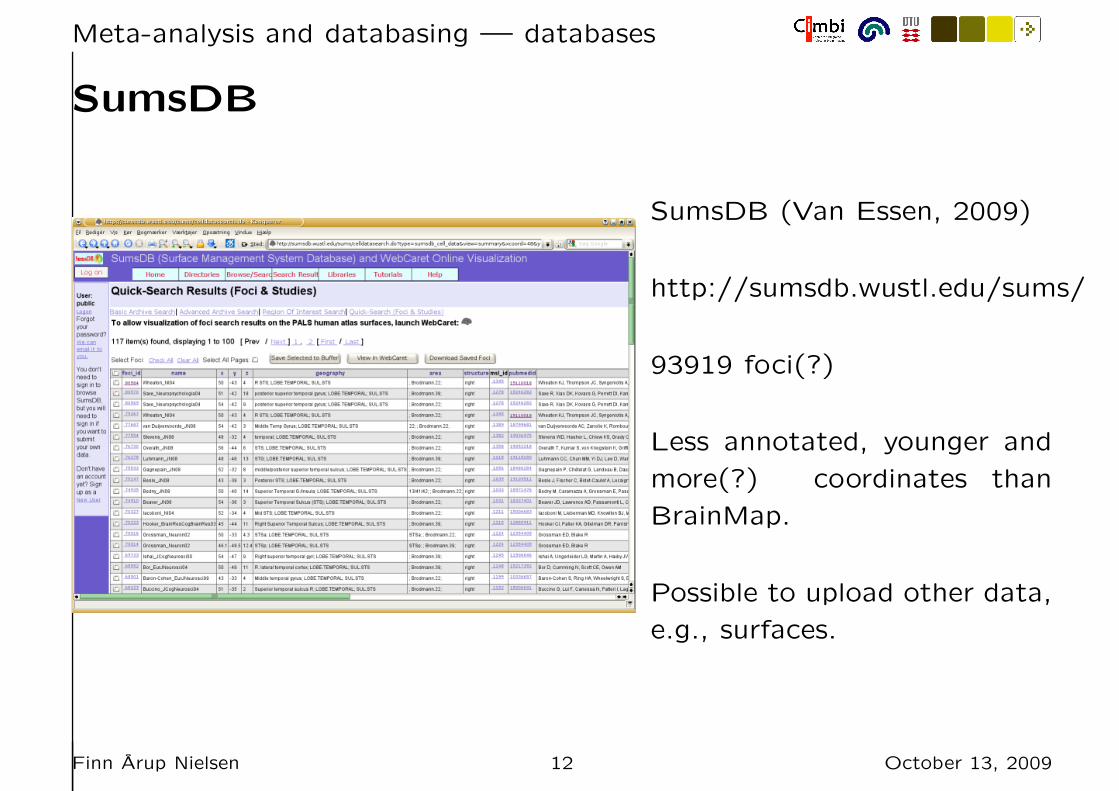
Meta-analysis and databasing — databases
SumsDB
SumsDB (Van Essen, 2009)
http://sumsdb.wustl.edu/sums/
93919 foci(?)
Less annotated, younger and
more(?) coordinates than
BrainMap.
Possible to upload other data,
e.g., surfaces.
Finn Arup Nielsen 12 October 13, 2009
Meta-analysis and databasing — databases
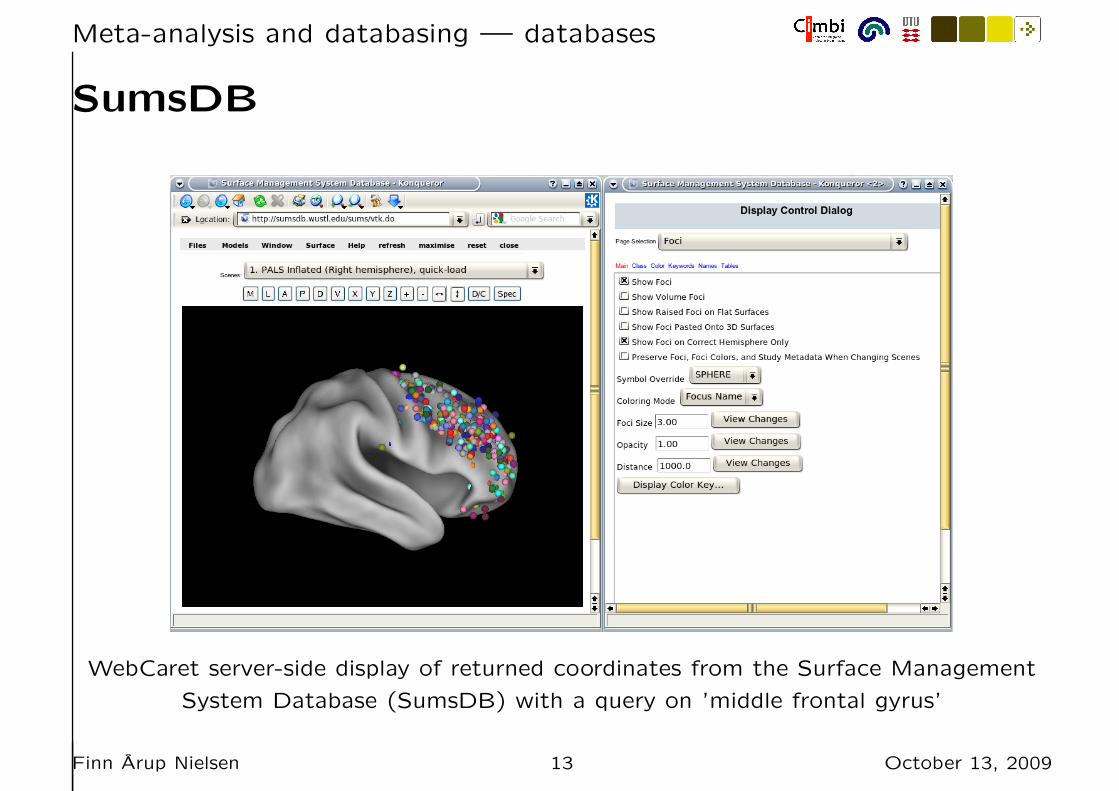
SumsDB
WebCaret server-side display of returned coordinates from the Surface Management
System Database (SumsDB) with a query on ’middle frontal gyrus’
Finn Arup Nielsen 13 October 13, 2009
Meta-analysis and databasing — databases
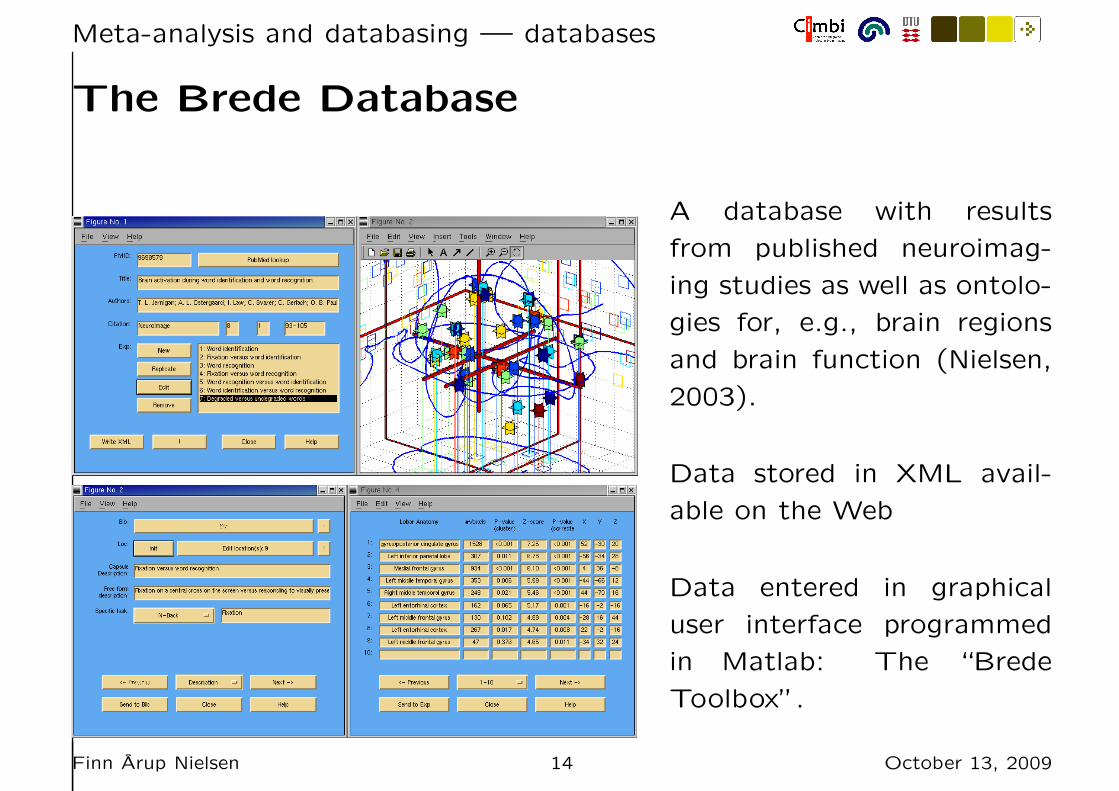
The Brede Database
A database with results
from published neuroimag-
ing studies as well as ontolo-
gies for, e.g., brain regions
and brain function (Nielsen,
2003).
Data stored in XML avail-
able on the Web
Data entered in graphical
user interface programmed
in Matlab: The “Brede
Toolbox”.
Finn Arup Nielsen 14 October 13, 2009
Meta-analysis and databasing — databases
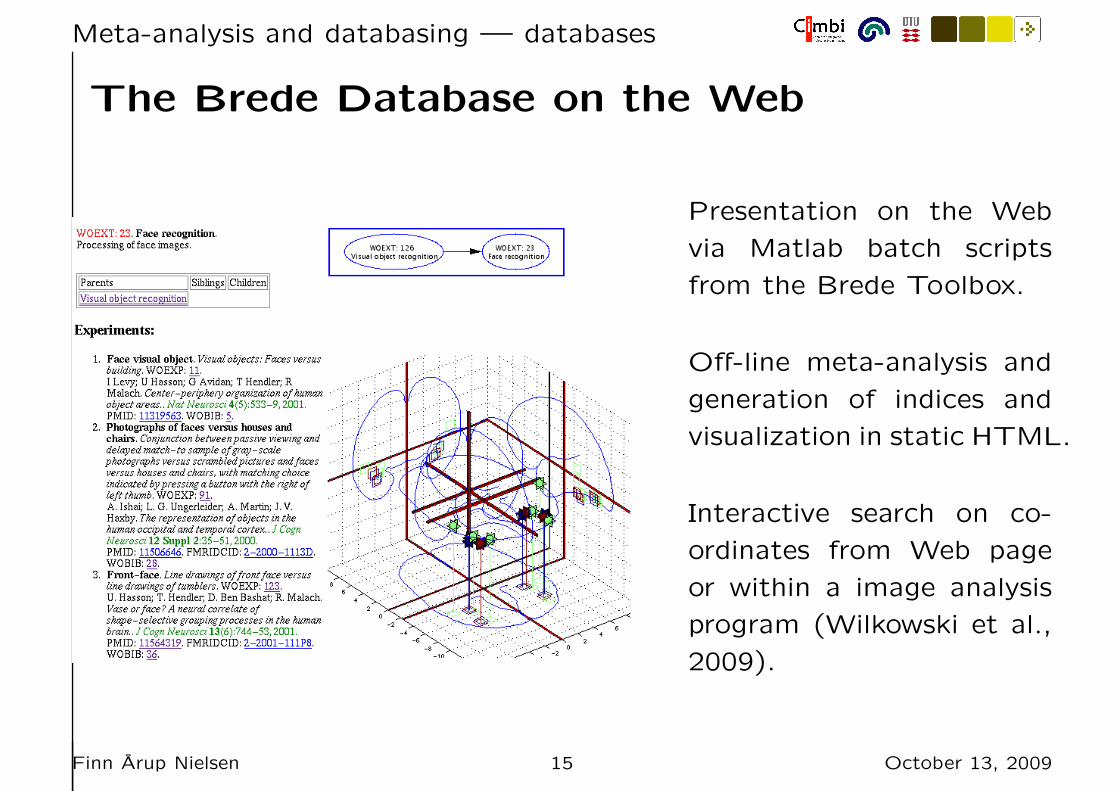
The Brede Database on the Web
Presentation on the Web
via Matlab batch scripts
from the Brede Toolbox.
Off-line meta-analysis and
generation of indices and
visualization in static HTML.
Interactive search on co-
ordinates from Web page
or within a image analysis
program (Wilkowski et al.,
2009).
Finn Arup Nielsen 15 October 13, 2009
Meta-analysis and databasing — databases
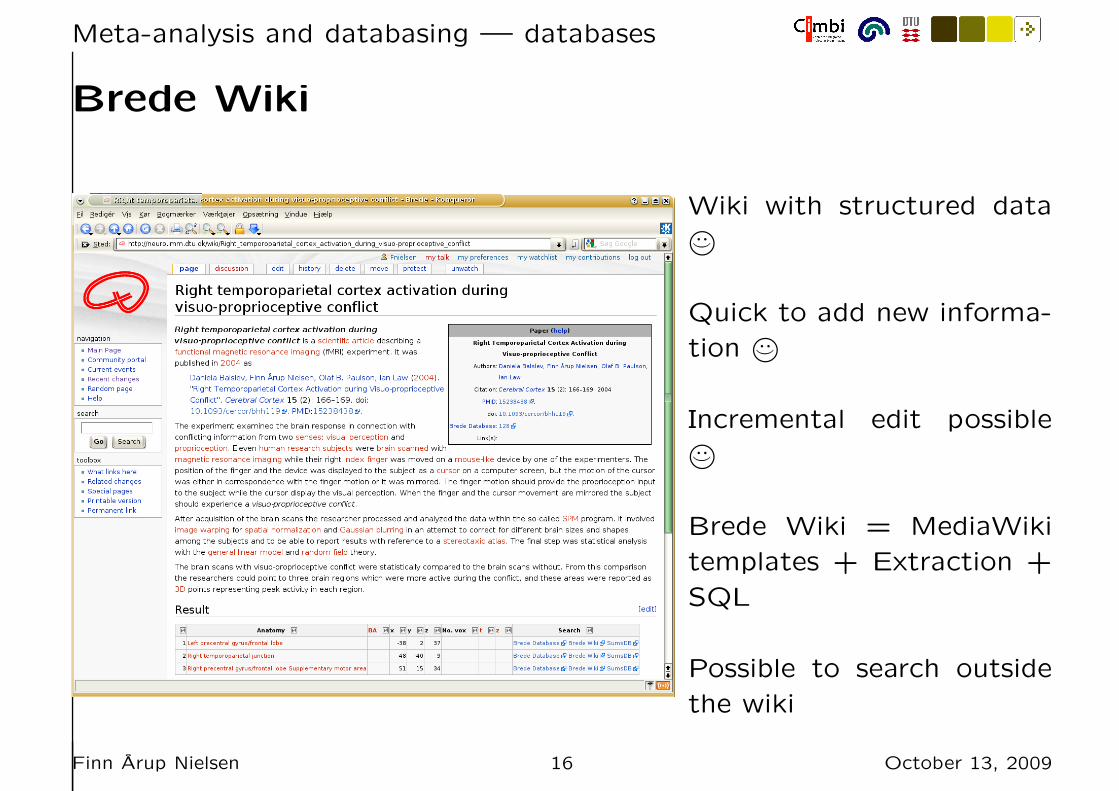
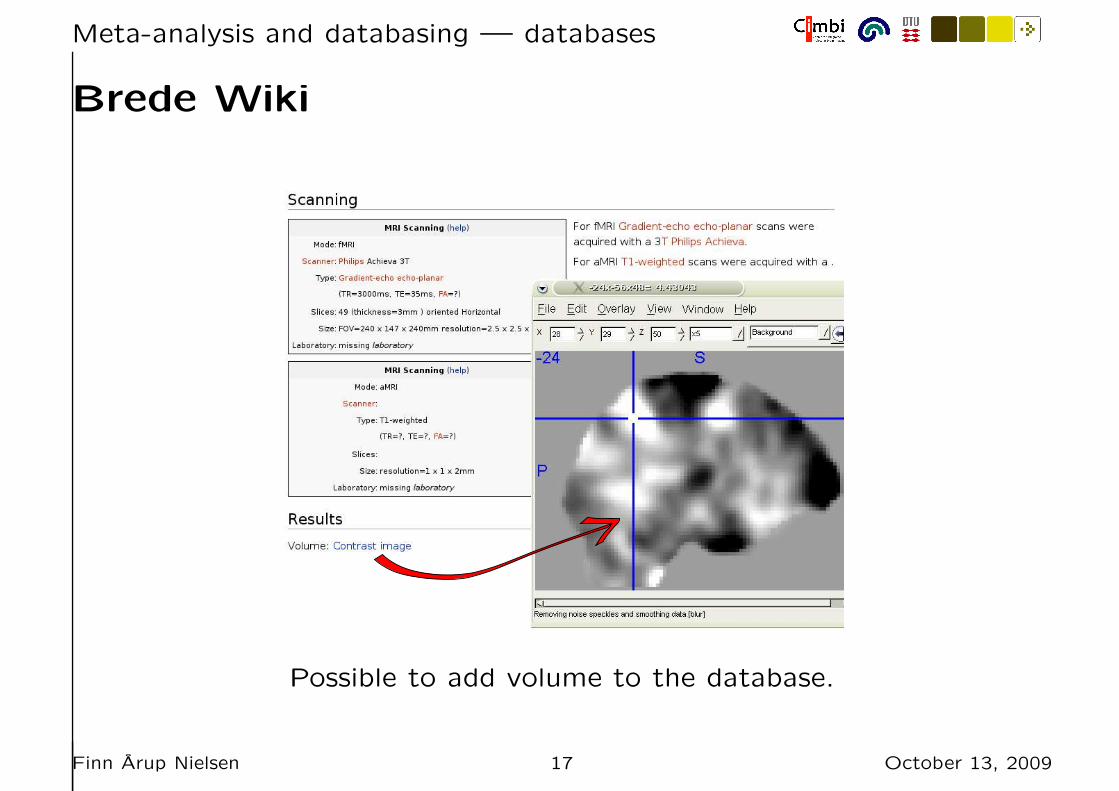
Brede Wiki
Wiki with structured data
©..⌣
Quick to add new informa-
tion ©..⌣
Incremental edit possible
©..⌣
Brede Wiki = MediaWiki
templates + Extraction +
SQL
Possible to search outside
the wiki
Finn Arup Nielsen 16 October 13, 2009
Meta-analysis and databasing — databases
Brede Wiki
Possible to add volume to the database.
Finn Arup Nielsen 17 October 13, 2009
Meta-analysis and databasing — searching
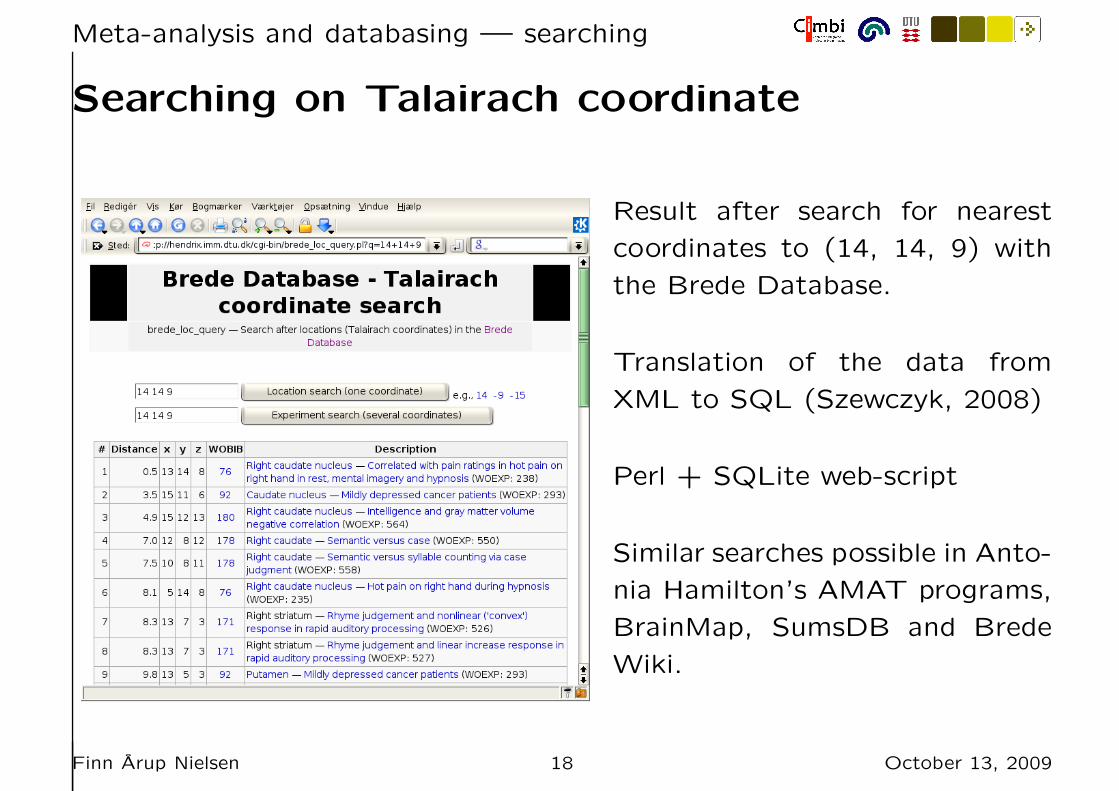
Searching on Talairach coordinate
Result after search for nearest
coordinates to (14, 14, 9) with
the Brede Database.
Translation of the data from
XML to SQL (Szewczyk, 2008)
Perl + SQLite web-script
Similar searches possible in Anto-
nia Hamilton’s AMAT programs,
BrainMap, SumsDB and Brede
Wiki.
Finn Arup Nielsen 18 October 13, 2009
Meta-analysis and databasing — searching
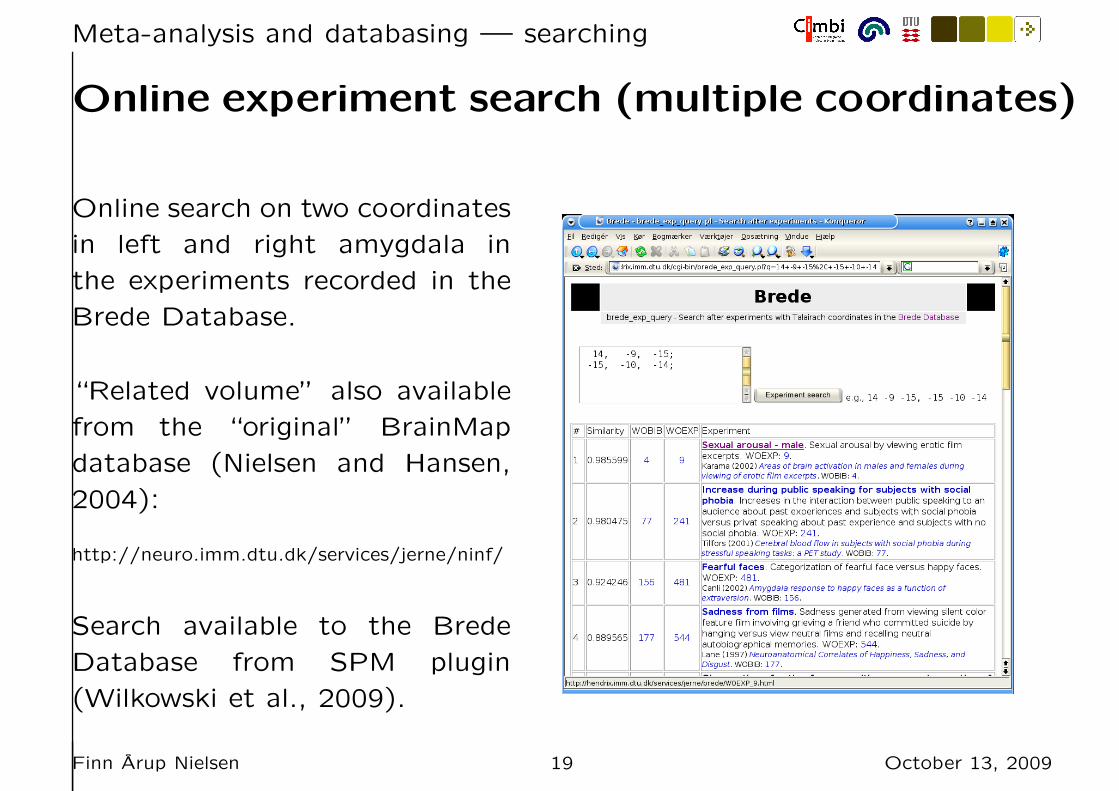
Online experiment search (multiple coordinates)
Online search on two coordinates
in left and right amygdala in
the experiments recorded in the
Brede Database.
“Related volume” also available
from the “original” BrainMap
database (Nielsen and Hansen,
2004):
http://neuro.imm.dtu.dk/services/jerne/ninf/
Search available to the Brede
Database from SPM plugin
(Wilkowski et al., 2009).
Finn Arup Nielsen 19 October 13, 2009
Meta-analysis and databasing — meta-analysis
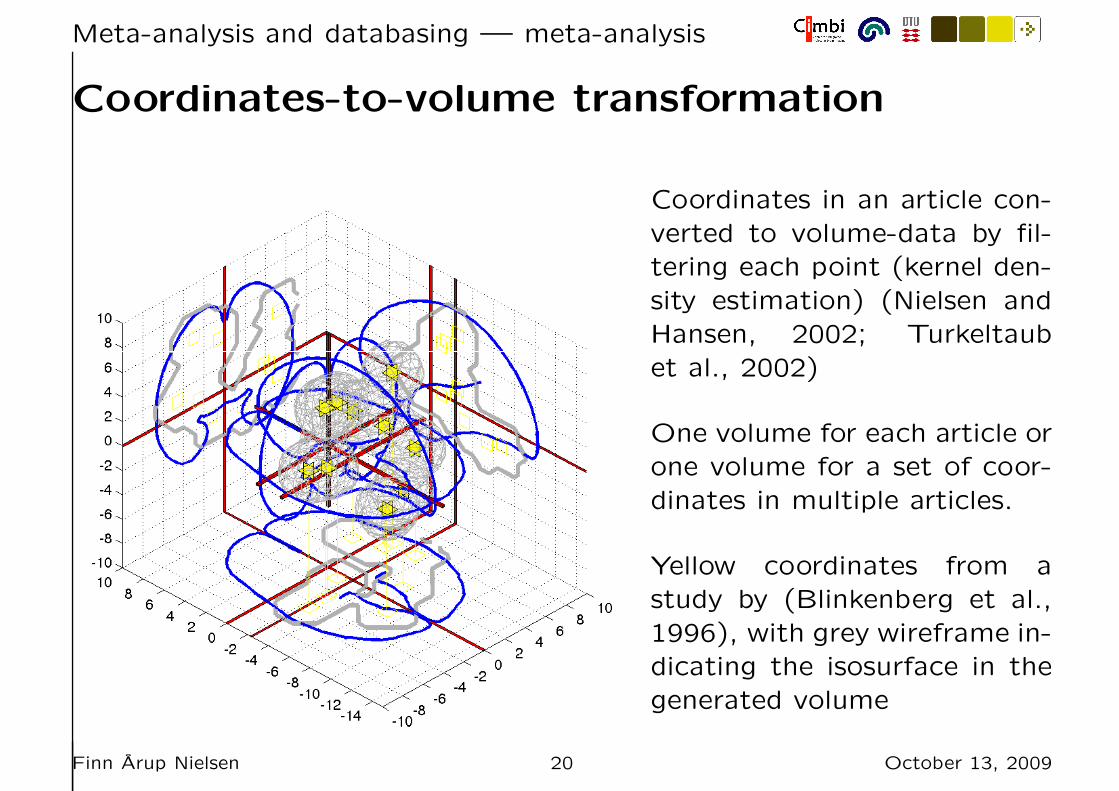
Coordinates-to-volume transformation
Coordinates in an article con-
verted to volume-data by fil-
tering each point (kernel den-
sity estimation) (Nielsen and
Hansen, 2002; Turkeltaub
et al., 2002)
One volume for each article or
one volume for a set of coor-
dinates in multiple articles.
Yellow coordinates from a
study by (Blinkenberg et al.,
1996), with grey wireframe in-
dicating the isosurface in the
generated volume
Finn Arup Nielsen 20 October 13, 2009
Meta-analysis and databasing — meta-analysis
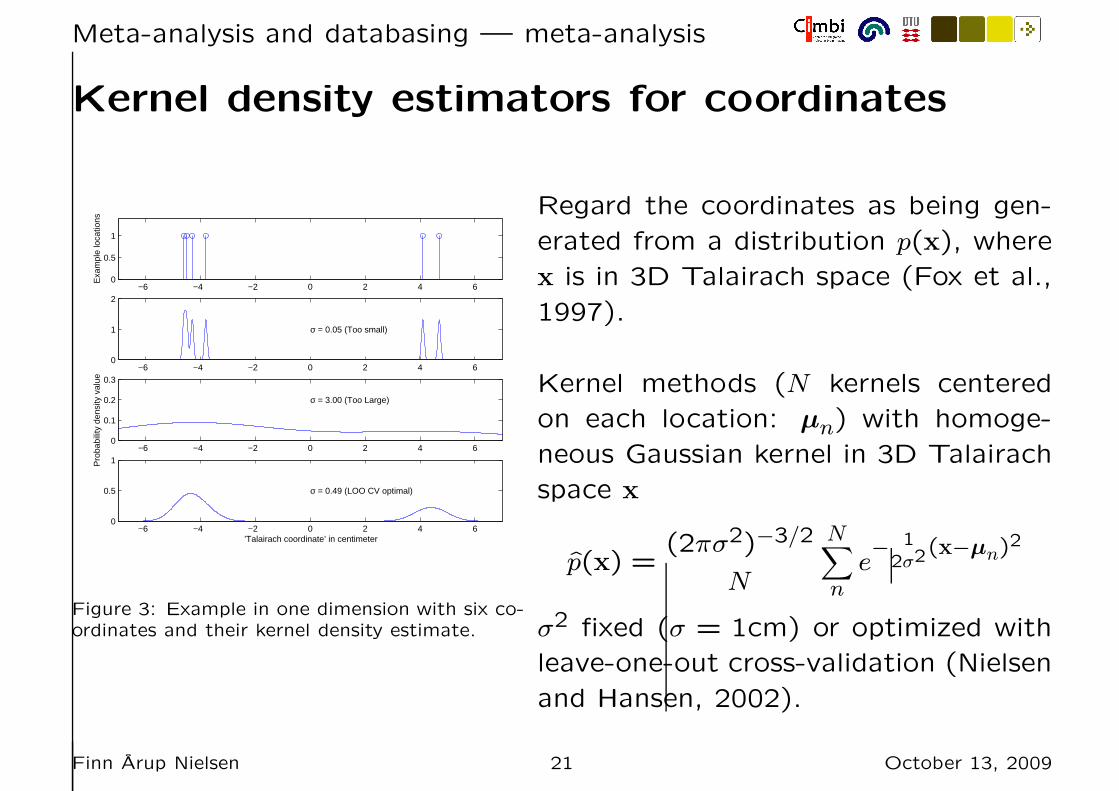
Kernel density estimators for coordinates
−6 −4 −2 0 2 4 60
0.5
1
Exa
mpl
e lo
catio
ns
−6 −4 −2 0 2 4 60
1
2
σ = 0.05 (Too small)
−6 −4 −2 0 2 4 60
0.1
0.2
0.3
σ = 3.00 (Too Large)
−6 −4 −2 0 2 4 60
0.5
1
σ = 0.49 (LOO CV optimal)
’Talairach coordinate’ in centimeter
P
roba
bilit
y de
nsity
val
ue
Figure 3: Example in one dimension with six co-ordinates and their kernel density estimate.
Regard the coordinates as being gen-
erated from a distribution p(x), where
x is in 3D Talairach space (Fox et al.,
1997).
Kernel methods (N kernels centered
on each location: µn) with homoge-
neous Gaussian kernel in 3D Talairach
space x
p(x) =(2πσ2)−3/2
N
N∑
ne− 1
2σ2(x−µn)2
σ2 fixed (σ = 1cm) or optimized with
leave-one-out cross-validation (Nielsen
and Hansen, 2002).
Finn Arup Nielsen 21 October 13, 2009
Meta-analysis and databasing — meta-analysis
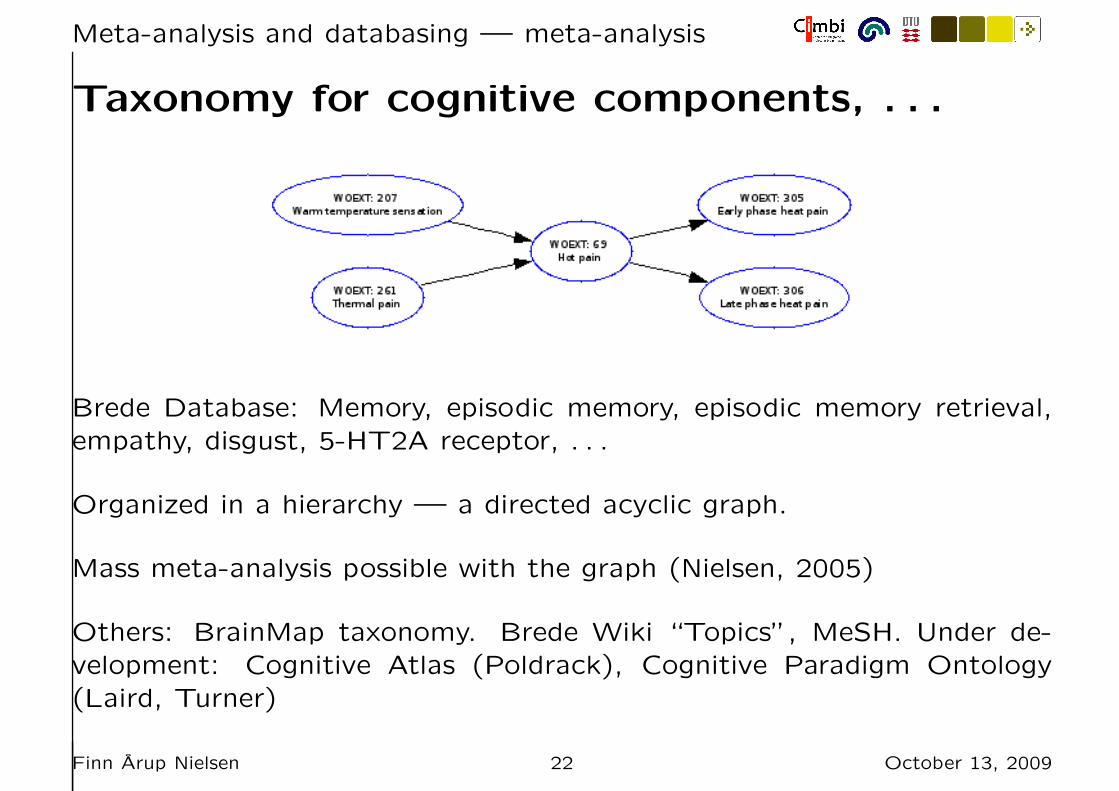
Taxonomy for cognitive components, . . .
Brede Database: Memory, episodic memory, episodic memory retrieval,
empathy, disgust, 5-HT2A receptor, . . .
Organized in a hierarchy — a directed acyclic graph.
Mass meta-analysis possible with the graph (Nielsen, 2005)
Others: BrainMap taxonomy. Brede Wiki “Topics”, MeSH. Under de-
velopment: Cognitive Atlas (Poldrack), Cognitive Paradigm Ontology
(Laird, Turner)
Finn Arup Nielsen 22 October 13, 2009
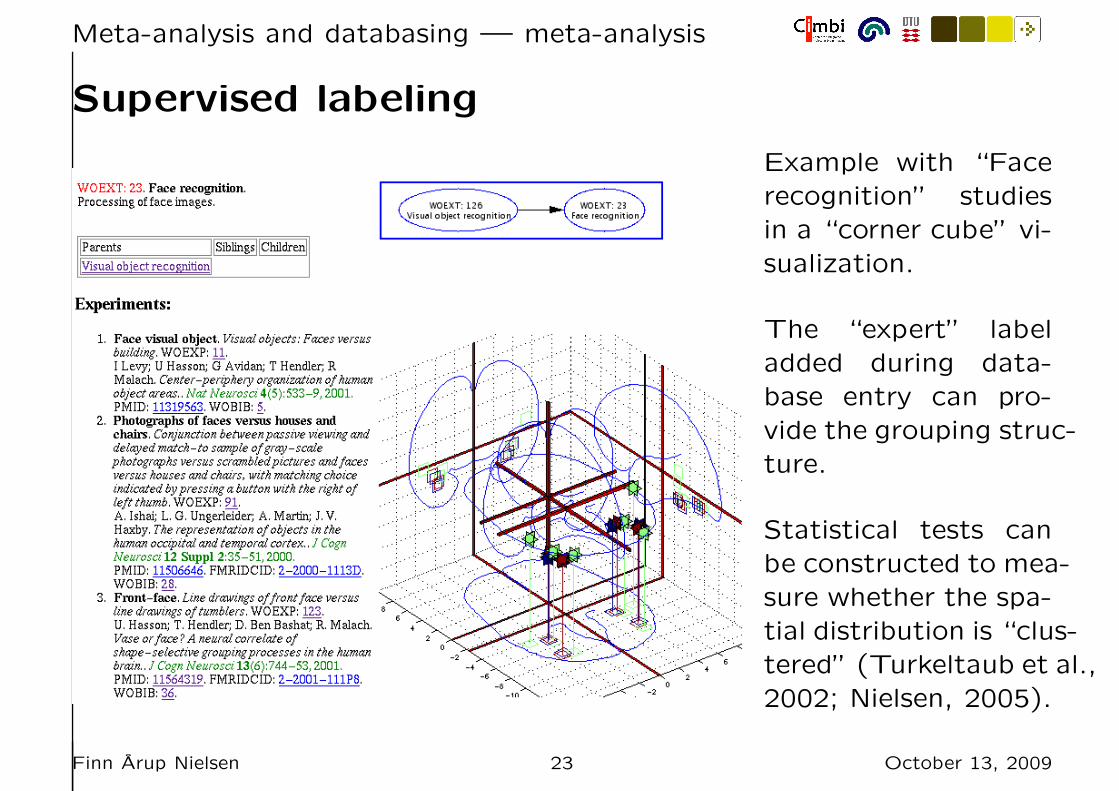
Meta-analysis and databasing — meta-analysis
Supervised labeling
Example with “Face
recognition” studies
in a “corner cube” vi-
sualization.
The “expert” label
added during data-
base entry can pro-
vide the grouping struc-
ture.
Statistical tests can
be constructed to mea-
sure whether the spa-
tial distribution is “clus-
tered” (Turkeltaub et al.,
2002; Nielsen, 2005).
Finn Arup Nielsen 23 October 13, 2009
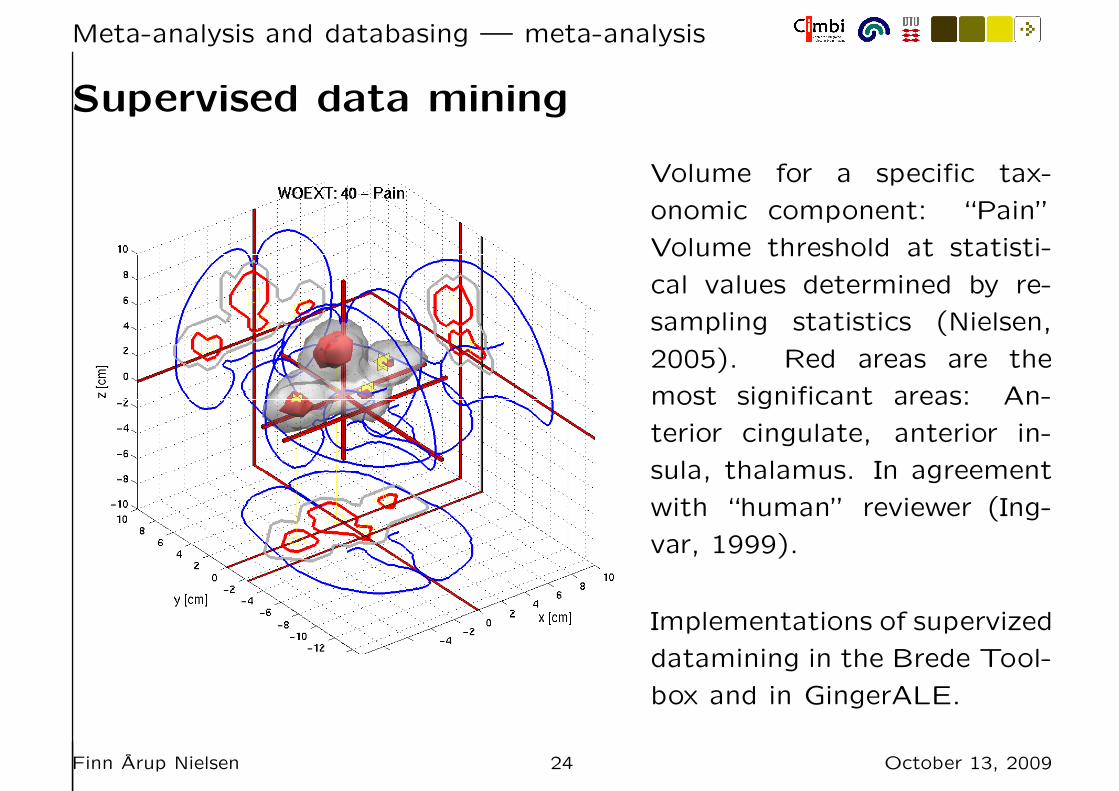
Meta-analysis and databasing — meta-analysis
Supervised data mining
Volume for a specific tax-
onomic component: “Pain”
Volume threshold at statisti-
cal values determined by re-
sampling statistics (Nielsen,
2005). Red areas are the
most significant areas: An-
terior cingulate, anterior in-
sula, thalamus. In agreement
with “human” reviewer (Ing-
var, 1999).
Implementations of supervized
datamining in the Brede Tool-
box and in GingerALE.
Finn Arup Nielsen 24 October 13, 2009
Meta-analysis and databasing — meta-analysis
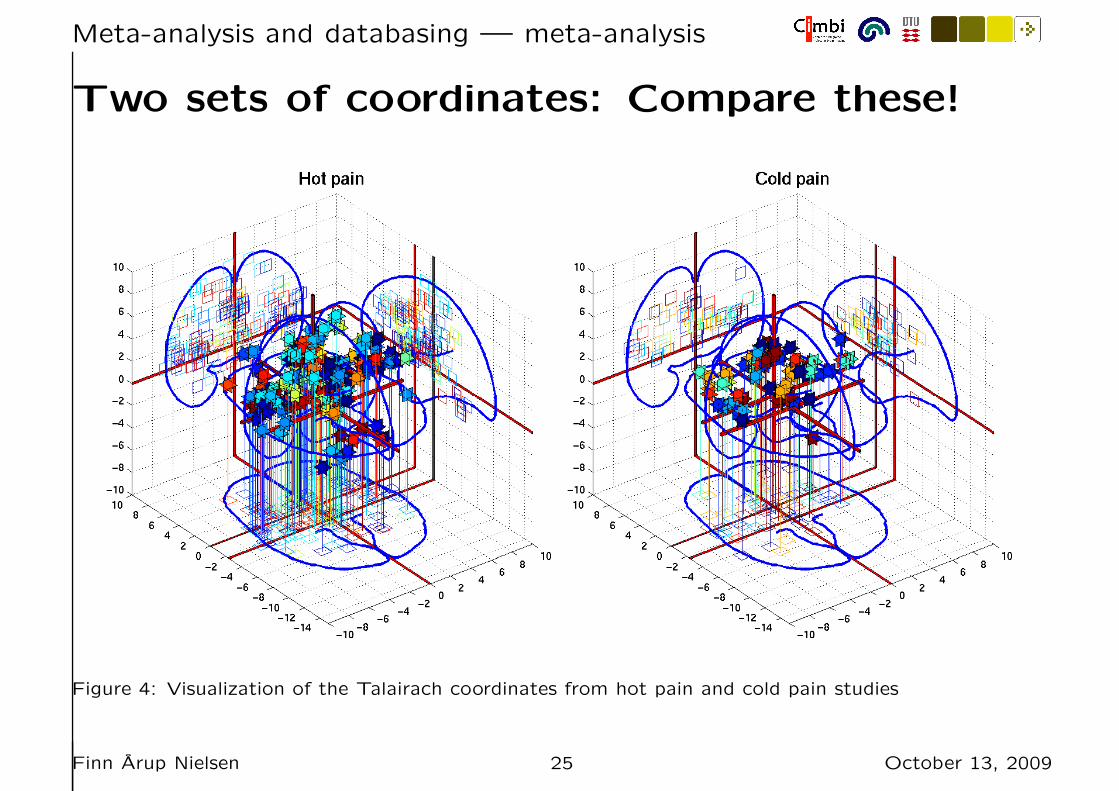
Two sets of coordinates: Compare these!
Figure 4: Visualization of the Talairach coordinates from hot pain and cold pain studies
Finn Arup Nielsen 25 October 13, 2009
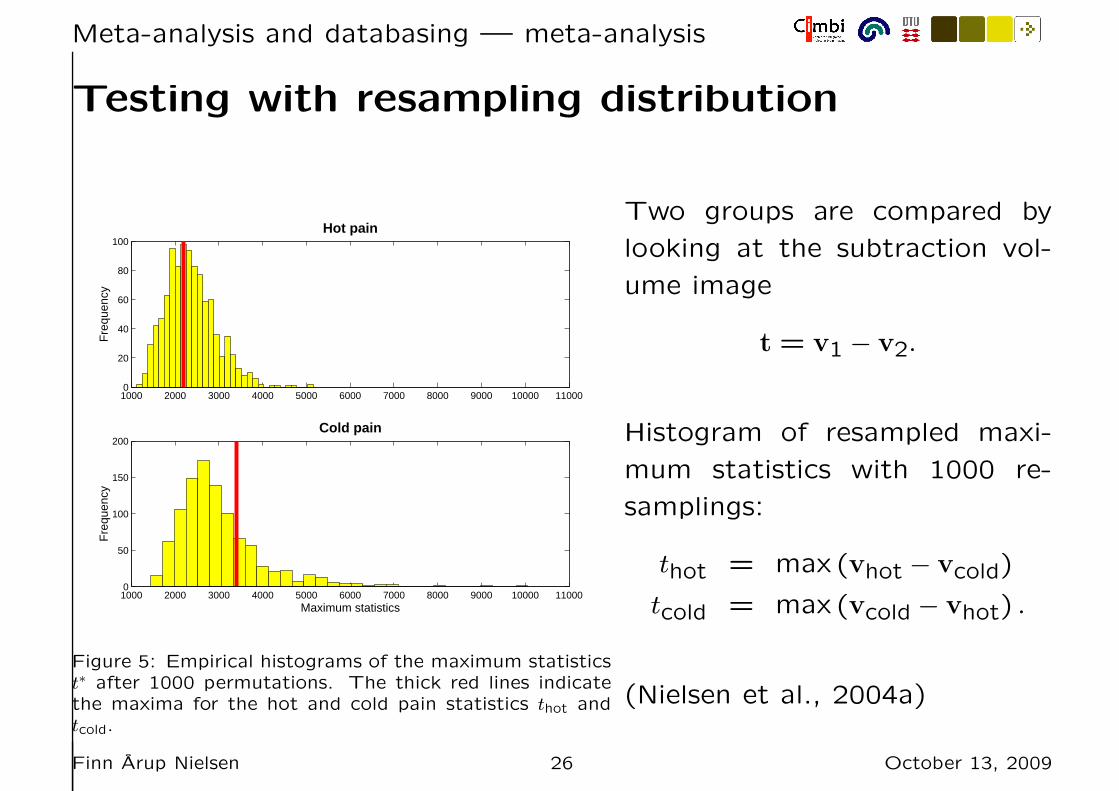
Meta-analysis and databasing — meta-analysis
Testing with resampling distribution
1000 2000 3000 4000 5000 6000 7000 8000 9000 10000 110000
20
40
60
80
100Hot pain
Fre
quen
cy
1000 2000 3000 4000 5000 6000 7000 8000 9000 10000 110000
50
100
150
200Cold pain
Fre
quen
cy
Maximum statistics
Figure 5: Empirical histograms of the maximum statisticst∗ after 1000 permutations. The thick red lines indicatethe maxima for the hot and cold pain statistics thot andtcold.
Two groups are compared by
looking at the subtraction vol-
ume image
t = v1 − v2.
Histogram of resampled maxi-
mum statistics with 1000 re-
samplings:
thot = max (vhot − vcold)
tcold = max (vcold − vhot) .
(Nielsen et al., 2004a)
Finn Arup Nielsen 26 October 13, 2009
Meta-analysis and databasing — meta-analysis
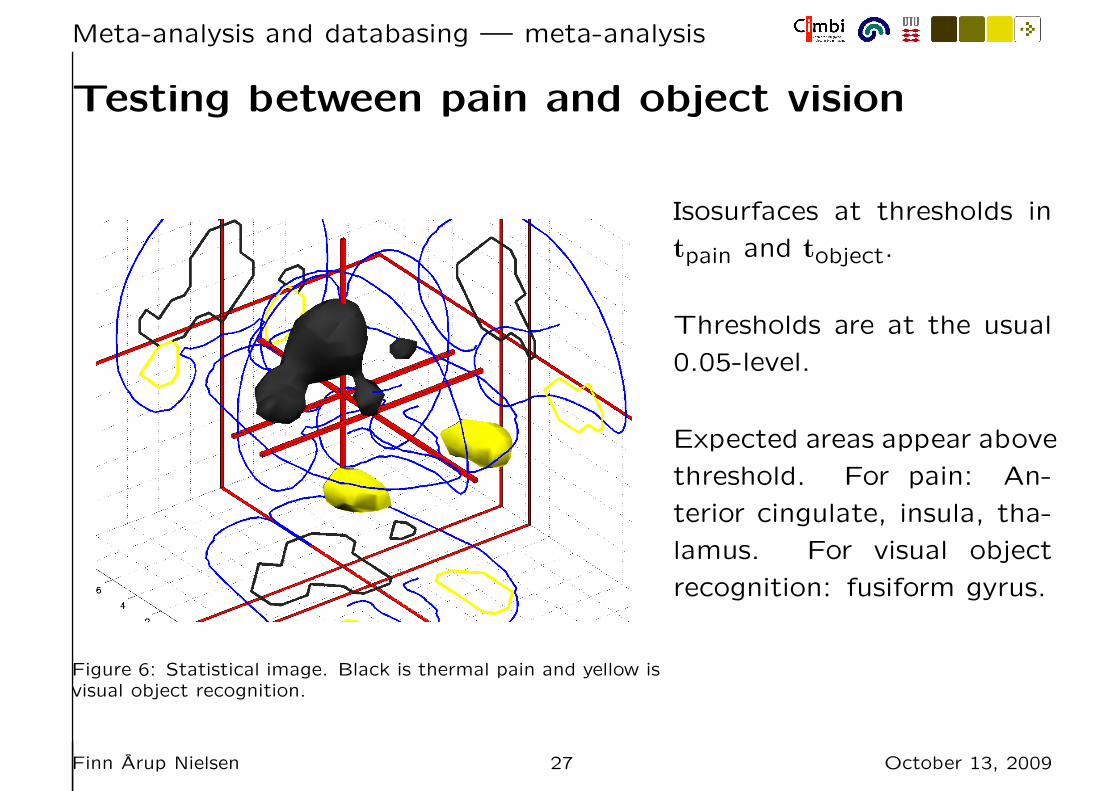
Testing between pain and object vision
Figure 6: Statistical image. Black is thermal pain and yellow isvisual object recognition.
Isosurfaces at thresholds in
tpain and tobject.
Thresholds are at the usual
0.05-level.
Expected areas appear above
threshold. For pain: An-
terior cingulate, insula, tha-
lamus. For visual object
recognition: fusiform gyrus.
Finn Arup Nielsen 27 October 13, 2009
Meta-analysis and databasing — meta-analysis
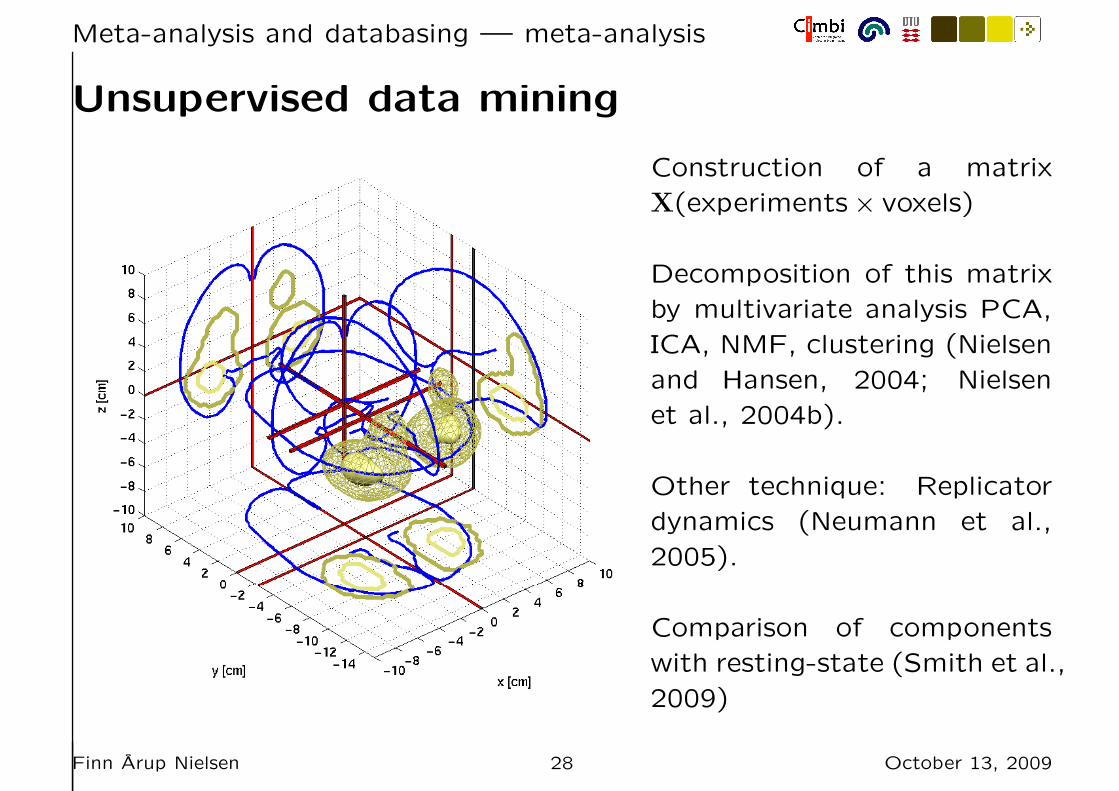
Unsupervised data mining
Construction of a matrix
X(experiments × voxels)
Decomposition of this matrix
by multivariate analysis PCA,
ICA, NMF, clustering (Nielsen
and Hansen, 2004; Nielsen
et al., 2004b).
Other technique: Replicator
dynamics (Neumann et al.,
2005).
Comparison of components
with resting-state (Smith et al.,
2009)
Finn Arup Nielsen 28 October 13, 2009
Meta-analysis and databasing — meta-analysis
Issues with meta-analysis
Variable number of subjects between studies.
Varying brain structures examined and reported: Field of view for the
scanner, scanner sequence regional sensitivities. ©..⌢
Varying statistical levels used. ©..⌢
Small volume correction is bad for whole brain meta-analysis. ©..⌢
Varying strength between individual coordinates. ©..⌢
In summary: Be careful in interpreting the result of a neuroimaging meta-
analysis.
Image-based meta-analysis is coming ©..⌣ Neurogenerator, Brede Wiki up-
load, SumsDB, (Salimi-Khorshidi et al., 2009b; Salimi-Khorshidi et al.,
2009a)
Finn Arup Nielsen 29 October 13, 2009
Meta-analysis and databasing — text-mining
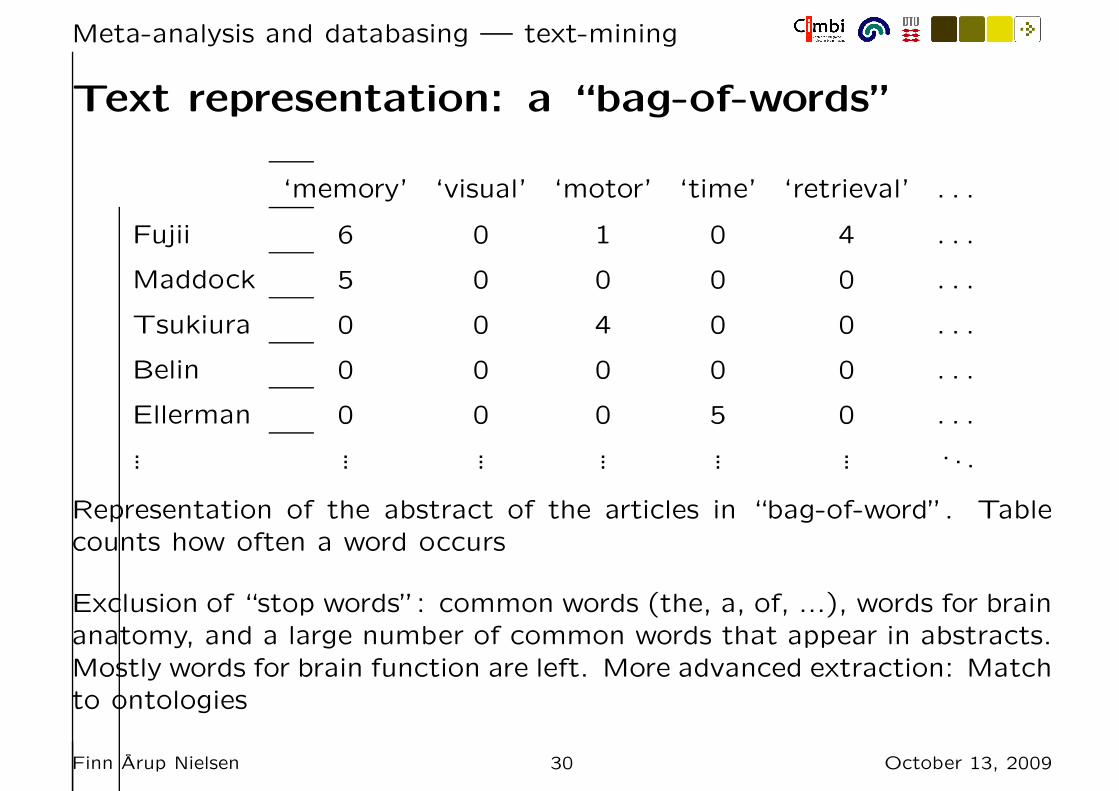
Text representation: a “bag-of-words”
‘memory’ ‘visual’ ‘motor’ ‘time’ ‘retrieval’ . . .
Fujii 6 0 1 0 4 . . .
Maddock 5 0 0 0 0 . . .
Tsukiura 0 0 4 0 0 . . .
Belin 0 0 0 0 0 . . .
Ellerman 0 0 0 5 0 . . .
... ... ... ... ... ... . . .
Representation of the abstract of the articles in “bag-of-word”. Table
counts how often a word occurs
Exclusion of “stop words”: common words (the, a, of, ...), words for brain
anatomy, and a large number of common words that appear in abstracts.
Mostly words for brain function are left. More advanced extraction: Match
to ontologies
Finn Arup Nielsen 30 October 13, 2009
Meta-analysis and databasing — text-mining
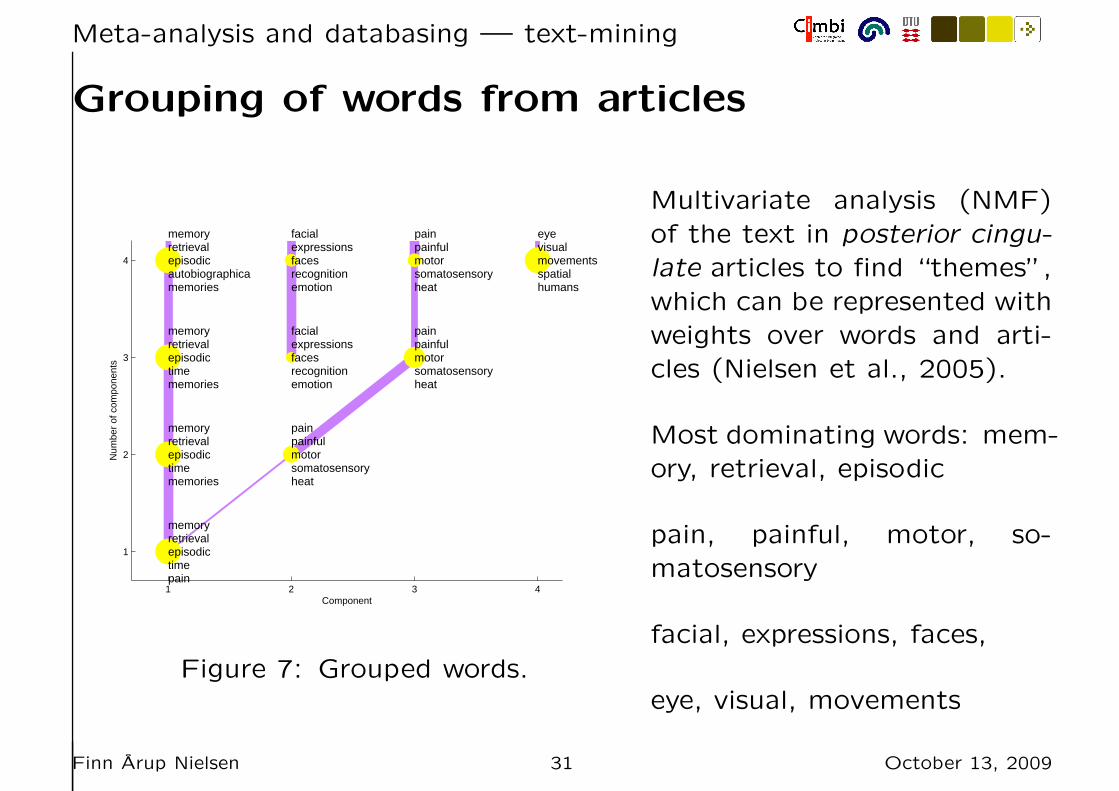
Grouping of words from articles
1 2 3 4
1
2
3
4
Component
Num
ber
of c
ompo
nent
s
memoryretrievalepisodictimepain
memoryretrievalepisodictimememories
painpainfulmotorsomatosensoryheat
memoryretrievalepisodictimememories
facialexpressionsfacesrecognitionemotion
painpainfulmotorsomatosensoryheat
memoryretrievalepisodicautobiographicamemories
facialexpressionsfacesrecognitionemotion
painpainfulmotorsomatosensoryheat
eyevisualmovementsspatialhumans
Figure 7: Grouped words.
Multivariate analysis (NMF)
of the text in posterior cingu-
late articles to find “themes”,
which can be represented with
weights over words and arti-
cles (Nielsen et al., 2005).
Most dominating words: mem-
ory, retrieval, episodic
pain, painful, motor, so-
matosensory
facial, expressions, faces,
eye, visual, movements
Finn Arup Nielsen 31 October 13, 2009
Meta-analysis and databasing — text & coordinates
Text and volume: Functional atlas
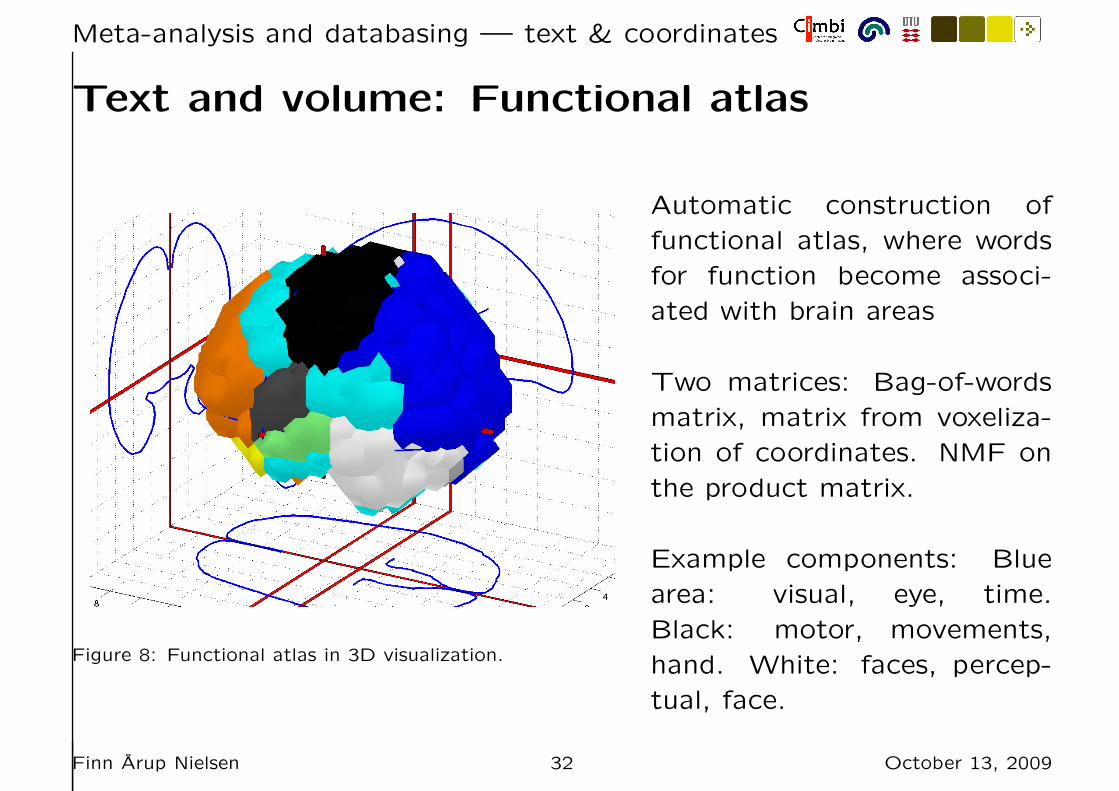
Figure 8: Functional atlas in 3D visualization.
Automatic construction of
functional atlas, where words
for function become associ-
ated with brain areas
Two matrices: Bag-of-words
matrix, matrix from voxeliza-
tion of coordinates. NMF on
the product matrix.
Example components: Blue
area: visual, eye, time.
Black: motor, movements,
hand. White: faces, percep-
tual, face.
Finn Arup Nielsen 32 October 13, 2009
Meta-analysis and databasing — text & coordinates
Functional atlas — medial view
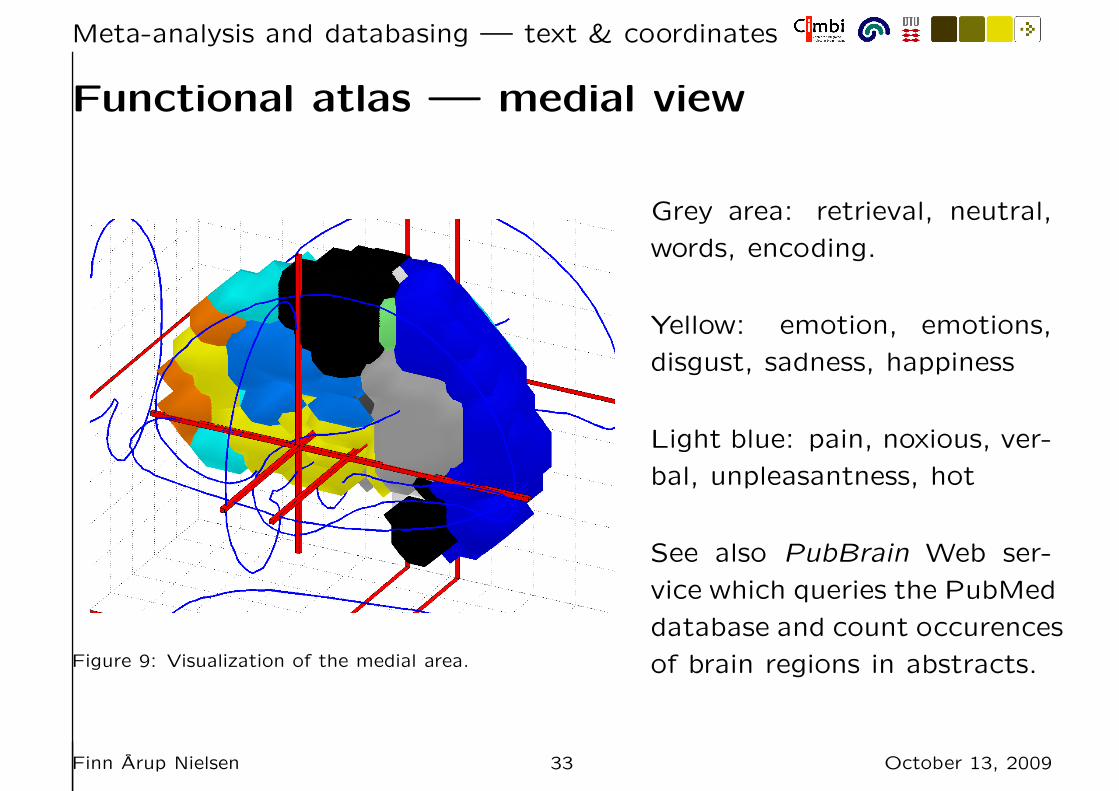
Figure 9: Visualization of the medial area.
Grey area: retrieval, neutral,
words, encoding.
Yellow: emotion, emotions,
disgust, sadness, happiness
Light blue: pain, noxious, ver-
bal, unpleasantness, hot
See also PubBrain Web ser-
vice which queries the PubMed
database and count occurences
of brain regions in abstracts.
Finn Arup Nielsen 33 October 13, 2009
Meta-analysis and databasing — text & coordinates
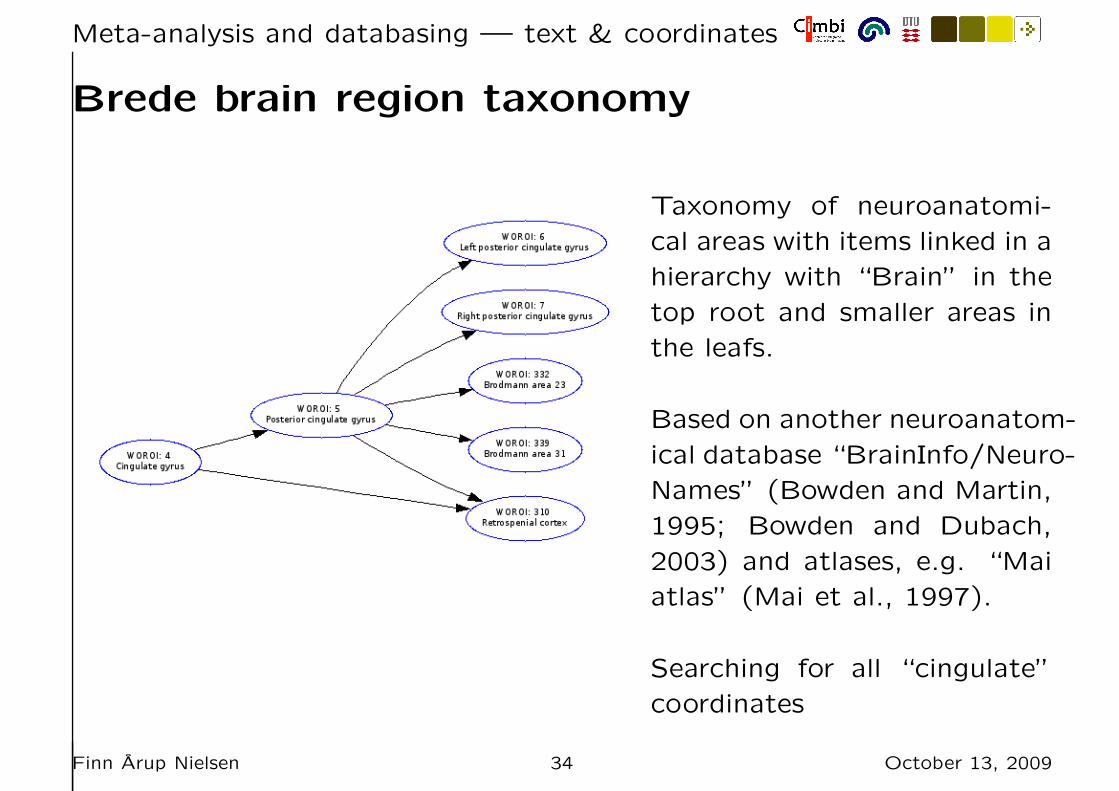
Brede brain region taxonomy
Taxonomy of neuroanatomi-
cal areas with items linked in a
hierarchy with “Brain” in the
top root and smaller areas in
the leafs.
Based on another neuroanatom-
ical database “BrainInfo/Neuro-
Names” (Bowden and Martin,
1995; Bowden and Dubach,
2003) and atlases, e.g. “Mai
atlas” (Mai et al., 1997).
Searching for all “cingulate”
coordinates
Finn Arup Nielsen 34 October 13, 2009
Meta-analysis and databasing — text & coordinates
Combining text analysis and coordinates
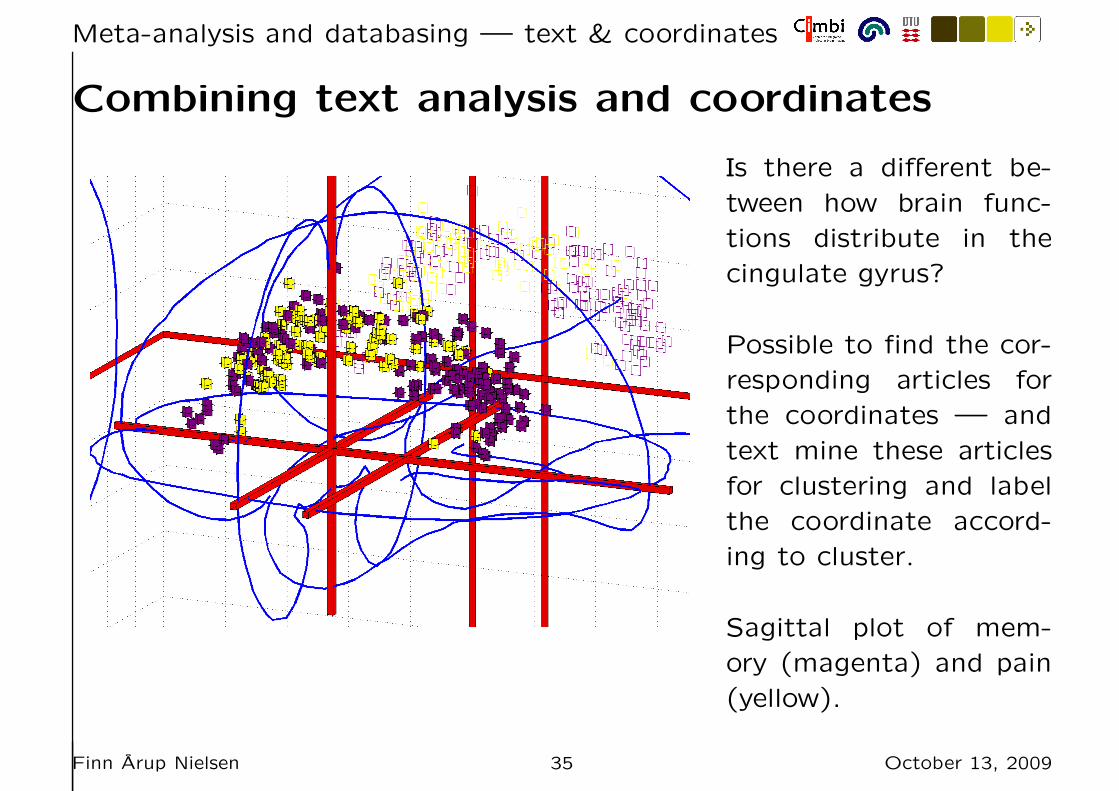
Is there a different be-
tween how brain func-
tions distribute in the
cingulate gyrus?
Possible to find the cor-
responding articles for
the coordinates — and
text mine these articles
for clustering and label
the coordinate accord-
ing to cluster.
Sagittal plot of mem-
ory (magenta) and pain
(yellow).
Finn Arup Nielsen 35 October 13, 2009
Meta-analysis and databasing — text & coordinates
Combining ontologies and coordinates
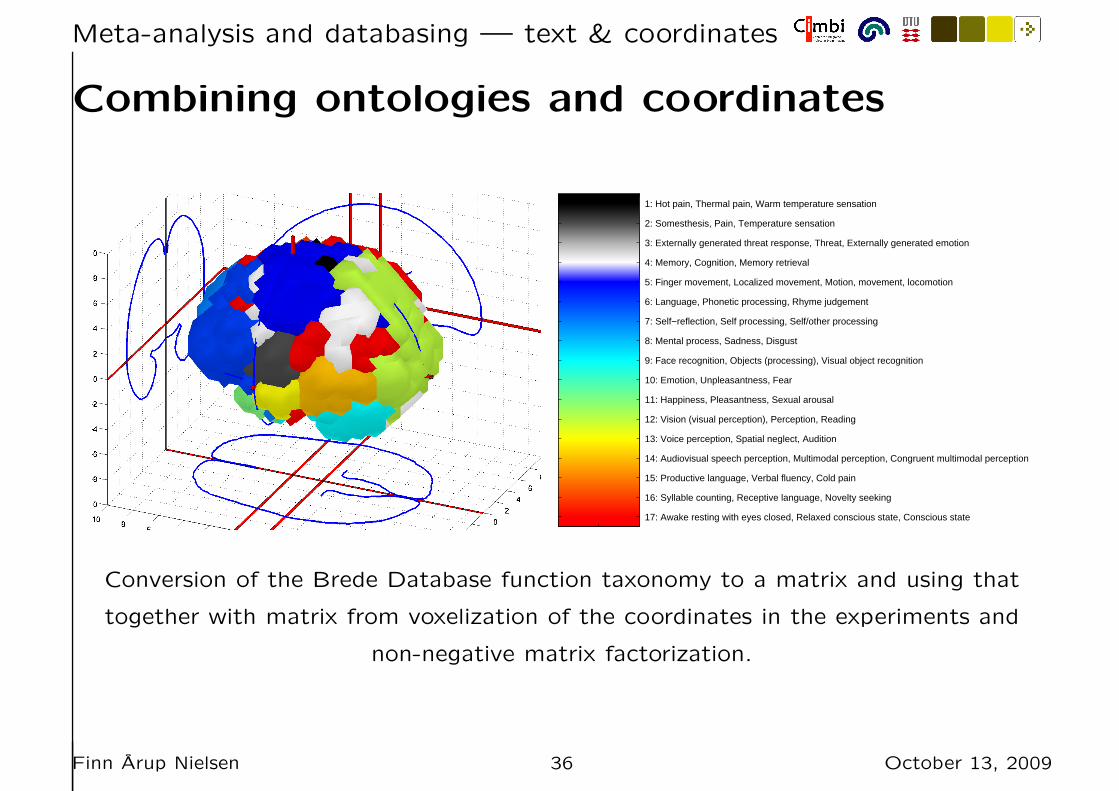
1: Hot pain, Thermal pain, Warm temperature sensation
2: Somesthesis, Pain, Temperature sensation
3: Externally generated threat response, Threat, Externally generated emotion
4: Memory, Cognition, Memory retrieval
5: Finger movement, Localized movement, Motion, movement, locomotion
6: Language, Phonetic processing, Rhyme judgement
7: Self−reflection, Self processing, Self/other processing
8: Mental process, Sadness, Disgust
9: Face recognition, Objects (processing), Visual object recognition
10: Emotion, Unpleasantness, Fear
11: Happiness, Pleasantness, Sexual arousal
12: Vision (visual perception), Perception, Reading
13: Voice perception, Spatial neglect, Audition
14: Audiovisual speech perception, Multimodal perception, Congruent multimodal perception
15: Productive language, Verbal fluency, Cold pain
16: Syllable counting, Receptive language, Novelty seeking
17: Awake resting with eyes closed, Relaxed conscious state, Conscious state
Conversion of the Brede Database function taxonomy to a matrix and using that
together with matrix from voxelization of the coordinates in the experiments and
non-negative matrix factorization.
Finn Arup Nielsen 36 October 13, 2009
Meta-analysis and databasing
More information
Articles about neuroinformatics (Nielsen et al., 2006; Nielsen, 2009)
Brede Database Brede Wiki Brede Toolbox
Bibliography on Neuroinformatics:
http://www.imm.dtu.dk/˜fn/bib/Nielsen2001Bib/
Finn Arup Nielsen 37 October 13, 2009

Meta-analysis and databasing
You should submit you data to a neuroinformatics database to get
published.
Finn Arup Nielsen 38 October 13, 2009
Meta-analysis and databasing
The End
Finn Arup Nielsen 39 October 13, 2009
References
References
Blinkenberg, M., Bonde, C., Holm, S., Svarer, C., Andersen, J., Paulson, O. B., and Law, I. (1996).Rate dependence of regional cerebral activation during performance of a repetitive motor task: a PETstudy. Journal of Cerebral Blood Flow and Metabolism, 16(5):794–803. PMID: 878424. WOBIB: 166.
Bowden, D. M. and Dubach, M. F. (2003). NeuroNames 2002. Neuroinformatics, 1(1):43–59.ISSN 1539-2791.
Bowden, D. M. and Martin, R. F. (1995). NeuroNames brain hierarchy. NeuroImage, 2(1):63–84.PMID: 9410576. ISSN 1053-8119.
Fox, P. T. and Lancaster, J. L. (2002). Mapping context and content: the BrainMap model. Nature
Reviews Neuroscience, 3(4):319–321. http://www.brainmapdbj.org/Fox01context.pdf. Describes thephilosophy behind the (new) BrainMap functional brain imaging database with “BrainMap ExperimentCoding Scheme” and tables of activation foci. Furthermore discusses financial issues and quality controlof data.
Fox, P. T., Lancaster, J. L., Parsons, L. M., Xiong, J.-H., and Zamarripa, F. (1997). Func-tional volumes modeling: Theory and preliminary assessment. Human Brain Mapping, 5(4):306–311.http://www3.interscience.wiley.com/cgi-bin/abstract/56435/START.
Fox, P. T., Mikiten, S., Davis, G., and Lancaster, J. L. (1994). BrainMap: A database of humanfunction brain mapping. In Thatcher, R. W., Hallett, M., Zeffiro, T., John, E. R., and Huerta, M.,editors, Functional Neuroimaging: Technical Foundations, chapter 9, pages 95–105. Academic Press,San Diego, California. ISBN 0126858454.
Ingvar, M. (1999). Pain and functional imaging. Philosophical Transactions of the Royal Society of
London. Series B, Biological Sciences, 354(1387):1347–1358. PMID: 10466155.
Mai, J. K., Assheuer, J., and Paxinos, G. (1997). Atlas of the Human Brain. Academic Press, SanDiego, California. ISBN 0124653618.
Finn Arup Nielsen 40 October 13, 2009
References
Neumann, J., Lohmann, G., Derrfuss, J., and von Cramon, D. Y. (2005). Meta-analysisof functional imaging data using replicator dynamics. Human Brain Mapping, 25(1):165–173.http://www3.interscience.wiley.com/cgi-bin/abstract/110474181/. ISSN 1065-9471.
Nielsen, F. A. (2003). The Brede database: a small database for functional neuroimaging. NeuroImage,19(2). http://208.164.121.55/hbm2003/abstract/abstract906.htm. Presented at the 9th InternationalConference on Functional Mapping of the Human Brain, June 19–22, 2003, New York, NY. Availableon CD-Rom.
Nielsen, F. A. (2005). Mass meta-analysis in Talairach space. In Saul, L. K., Weiss, Y., and Bottou, L.,editors, Advances in Neural Information Processing Systems 17, pages 985–992, Cambridge, MA. MITPress. http://books.nips.cc/papers/files/nips17/NIPS2004 0511.pdf.
Nielsen, F. A. (2009). Visualizing data mining results with the Brede tools. Frontiers in Neuroinformatics,3:26. DOI: 10.3389/neuro.11.026.2009.
Nielsen, F. A., Balslev, D., and Hansen, L. K. (2005). Mining the posterior cin-gulate: Segregation between memory and pain component. NeuroImage, 27(3):520–532.DOI: 10.1016/j.neuroimage.2005.04.034. Text mining of PubMed abstracts for detection of topics inneuroimaging studies mentioning posterior cingulate. Subsequent analysis of the spatial distribution ofthe Talairach coordinates in the clustered papers.
Nielsen, F. A., Chen, A. C. N., and Hansen, L. K. (2004a). Testing for difference between two groups offunctional neuroimaging experiments. In Olsen, S. I., editor, Proceedings fra den 13. Danske Konference
i Mønstergenkendelse og Billedanalyse, number 2004/10 in DIKU Technical Reports, pages 121–129,Copenhagen, Denmark. Dansk Selskab for Automatisk Genkendelse af Mønstre, Datalogisk Institut,University of Copenhagen. http://www.diku.dk/dsagm04/proceedings.dsagm04.pdf. ISSN 0107-8283.
Nielsen, F. A., Christensen, M. S., Madsen, K. H., Lund, T. E., and Hansen, L. K. (2006). fMRI neu-roinformatics. IEEE Engineering in Medicine and Biology Magazine, 25(2):112–119. PMID: 16568943.http://www2.imm.dtu.dk/pubdb/views/publication details.php?id=3516. An overview of some of thetools for and issues in fMRI neuroinformatics with description of, e.g., the SPM, AFNI and FSL pro-grams and the BrainMap, fMRIDC and Brede databases.
Finn Arup Nielsen 41 October 13, 2009
References
Nielsen, F. A. and Hansen, L. K. (2002). Modeling of activation data in theBrainMapTM database: Detection of outliers. Human Brain Mapping, 15(3):146–156.DOI: 10.1002/hbm.10012. http://www3.interscience.wiley.com/cgi-bin/abstract/89013001/. Cite-Seer: http://citeseer.ist.psu.edu/nielsen02modeling.html.
Nielsen, F. A. and Hansen, L. K. (2004). Finding related functional neuroimag-ing volumes. Artificial Intelligence in Medicine, 30(2):141–151. PMID: 14992762.http://www.imm.dtu.dk/˜fn/Nielsen2002Finding/.
Nielsen, F. A., Hansen, L. K., and Balslev, D. (2004b). Mining for associations between textand brain activation in a functional neuroimaging database. Neuroinformatics, 2(4):369–380.http://www2.imm.dtu.dk/˜fn/ps/Nielsen2004Mining submitted.pdf.
Salimi-Khorshidi, G., Smith, S. M., Keltner, J. R., Wager, T. D., and Nichols, T. E. (2009a). Meta-analysis of neuroimaging data: A comparison of image-based and coordinate-based pooling of studies.NeuroImage, 45:810–823. DOI: 10.1016/j.neuroimage.2008.12.039.
Salimi-Khorshidi, G., Smith, S. M., and Nichols, T. E. (2009b). Biasand heterogeneity in neuroimaging meta-analysis. 15th Annual Meeting ofthe Organization for Human Brain Mapping Abstracts Online. 406 SA-PM.http://www.meetingassistant3.com/OHBM2009/planner/abstract popup.php?abstractno=507.
Smith, S. M., Fox, P. T., Miller, K. L., Glahn, D. C., Fox, P. M., Mackey, C. E., Filippini, N., Watkins,K. E., Toro, R., and Beckmann, A. R. L. C. F. (2009). Correspondence of the brain’s functionalarchitecture during activation and rest. Proceedings of the National Academy of Sciences of the United
States of America, 106(31):13040–13045.
Szewczyk, M. M. (2008). Databases for neuroscience. Master’s the-sis, Technical University of Denmark, Kongens Lyngby, Denmark.http://orbit.dtu.dk/getResource?recordId=223565&objectId=1&versionId=1. IMM-MSC-2008-92.
Turkeltaub, P. E., Eden, G. F., Jones, K. M., and Zeffiro, T. A. (2002). Meta-analysis of the functionalneuroanatomy of single-word reading: method and validation. NeuroImage, 16(3 part 1):765–780.
Finn Arup Nielsen 42 October 13, 2009
References
PMID: 12169260. DOI: 10.1006/nimg.2002.1131. http://www.sciencedirect.com/science/article/-B6WNP-46HDMPV-N/2/xb87ce95b60732a8f0c917e288efe59004.
Van Essen, D. C. (2009). Lost in localization—but found with foci?! NeuroImage, 48(1):14–17.DOI: 10.1016/j.neuroimage.2009.05.050.
Wilkowski, B., Szewczyk, M., Rasmussen, P. M., Hansen, L. K., and Nielsen, F. A. (2009). Coordinate-based meta-analytic search for the SPM neuroimaging pipeline. In Proceedings of the Second Interna-
tional Conference on Health Informatics, pages 11–17. INSTICC Press.
Finn Arup Nielsen 43 October 13, 2009


![arXiv:1701.02643v2 [stat.AP] 19 Dec 2019Bayesian log-Gaussian Cox process regression: with applications to meta-analysis of neuroimaging working memory studies Pantelis Samartsidis1,](https://img.pdfslide.us/doc/110x75/5eb50ae837f2c776f809847d/arxiv170102643v2-statap-19-dec-2019-bayesian-log-gaussian-cox-process-regression.jpg)