Embed Size (px)
Citation preview
Missing ET Resolution in Minimum Bias data at 7 TeV
K.Wang & R. Keeler University of Victoria
*http://www.phys.ufl.edu/~matchev/LHCJC/cern-lhc.jpg
s
Outline
1.1 Introductions - LHC1.2 Introduction - ATLAS
2. Missing Energy
3. Minimum Bias3.1 Data3.2 Run 1535653.3 Rates3.4 1 Vertex MET Resolution
4. Pile up4.1 Definitions4.2 Rates
4.3 In Data
5. MET Resolution
6. Comparing Datasets
7. Further Work
8. Conclusions

1.1 Introduction - LHC
CERN – European Organization for Nuclear Research, formed in 1954
Important source of Particle physics research ever since
Constructed in the tunnel originally used for LEP the LHC is the most powerful particle accelerator built to date. Center of mass energies in hadron collisions to reach 14 TeV center of mass energy, with peak luminosity 1034 cm-2s-1
The success of many hypothetical extensions to the Standard Model rests on the success of the LHC
As of March 2010 7 TeV collisions have occurred
3.5 pb-1 of real data is now available for analysis
Parameter Performance Goals Run Analyzed Current August
CM energy 14 TeV 7 TeV 7 TeV
Peak Luminosity 1034 cm-2s-1 0.014*1030 cm-2s-1 6.7*1030cm-2s-1
Bunch Pairs 2808 2 48
Bunch Spacing 25 ns 45 μs Trains
Beam Current 584 mA ~0.05 mA ~8.5 mA

1.2 Introduction - ATLAS
General purpose spectrometer of proton-proton collisions
The detector is designed to fulfill many objectives – it is a high precision test of qcd, flavor physics and electroweak theory. In addition it is of course, searching for evidence of new physics, Higgs, SUSY, Heavy gauge bosons...
The parameters of the LHC puts stringent requirements on its detectors
Fast electronics, high granularity
High hermiticity (angular coverage)
Good particle momentum resolution and reconstruction efficiency
Efficient triggering on low momentum objects while rejecting background
Good particle identification
*http://www.slipperybrick.com/wp-content/uploads/2006/12/atlas-detector.jpg

*http://brock.physik.uni-bonn.de/atlas.php?lang=en

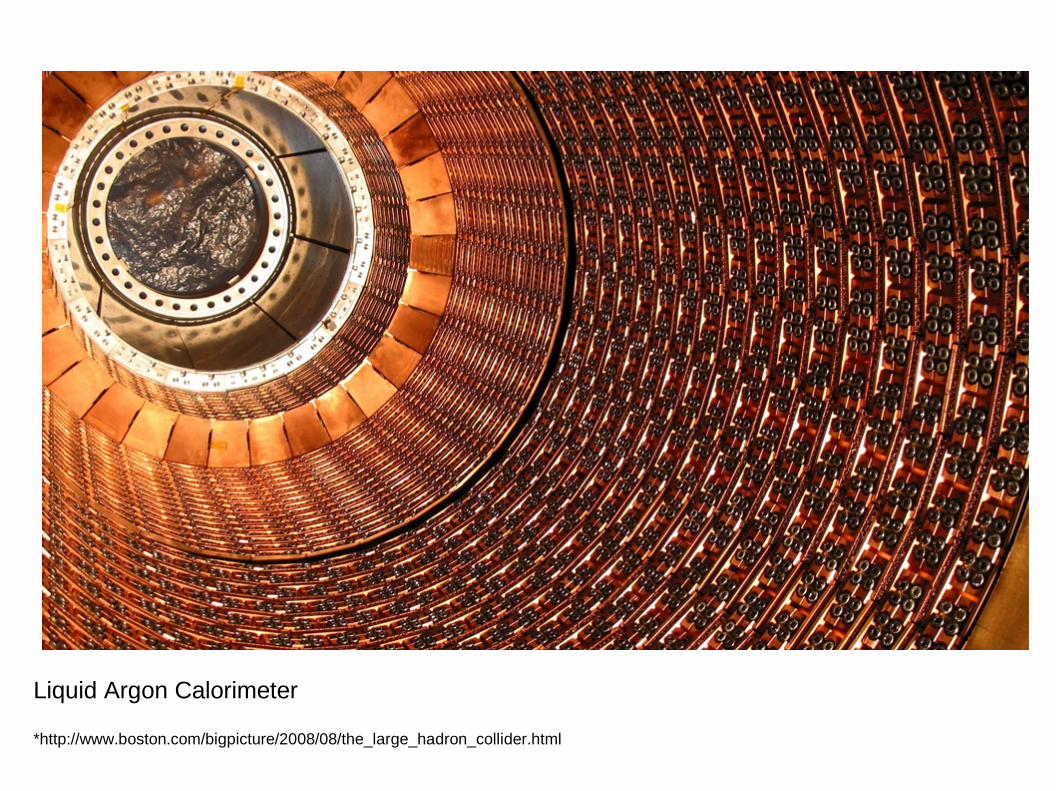
Liquid Argon Calorimeter
*http://www.boston.com/bigpicture/2008/08/the_large_hadron_collider.html

2 Missing Energy
An interaction occurs in the ATLAS detector, the final state particles diverge outwards from the interaction point
The particles are seen by the calorimetry and the triggering system records it – this is now an event
Sum of final state vector momenta from an interaction
Given that for highly energetic events
The resultant vector tells you about what your detector missed and about its orientation
If our detector was 100% efficient and had perfect resolution MET should be 0.
A good measurement of missing transverse energy is crucial to many studies. In particular searches for new physics (SUSY, extra dimensions) all depend a great deal on very good MET measurements for a given interaction.
True missing energy is of course the smoking gun of new physics
E2=p2c2
m2c 4≈p2c2

2 Missing Energy
In minimum bias data MET is reconstructed using the calorimeters with corrections for muons
E xmiss
=− i=1N cell Ei sinicosi
E ymiss
=− i=1N cell Ei sinicosi
Emiss=Ex
miss2E y
miss
2
Due to granularity (calorimeter has ~187 000 cells), it is vital to suppress noise contributions.
The sum over Ncell
is restricted to topological clusters which have received hits, there is an algorithm that determines what goes into N
cell based on noise levels
Cells flagged by ATLAS as noisy are also not included.

2 Missing Energy
The ntuple variables we used to analyze MET are “refined final” - i.e. MET_RefFinal_et
These are the recommended analysis variables
The MET variables in ATLAS are reconstructed in a step by step process.
First the muon contribution is obtained from the muon spectrometer reconstruction
Then there is a correction for energy losses in the cryostat
Finally the contributions from each reconstructed particle in the collision are added on to create the final term
The contributions of MET_RefFinal, which we used are shown on the right
MET_Ex(y)MissRefEle Contribution from cells in electrons
MET_Ex(y)MissRefGamma Contribution from cells in gamma
MET_Ex(y)MissRefTau Contribution from cells in tau-jets
MET_Ex(y)MissRefJet Contribution from cells inside jets
MET_Ex(y)MissRefMuon Contribution from cells in calorimeters crossed by
muons
MET_Ex(y)MissCellOut Contribution from cells in Topo outside objects
MET_Ex(y)MissMuonBoy Contribution from the Staco muon collection
MET_Ex(y)MissCryo Cryostat correction from ConeTopoJets
= =
MET_RefFinal Linear sum of above
*Atlas TWiki

We can parametrize the MET resolution in terms of the total energy deposited in the detector.
This is the sum of the scalars of the energy.
The d3pd variable is MET_RefFinal_sumet
Its construction is similar to that for MET_RefFinal_et.
Following the same procedure used forMET_RefFinal components above
Specifically then in terms of the physical accelerator the scalar sum of the missing transverse energy is
ET= i=1Ncell Ei sini
2 Missing Energy

3 Minimum Bias Data
Minimum bias data is data taken with an inclusive trigger
It is called minimum bias data because the goal is to trigger on and record any kind of p-p interaction with no bias
In ATLAS the minimum bias events can be triggered by the dedicated Minimum Bias Trigger Scintillators (MBTS) in coincidence with the Beam Pickup Timing Device (BPTX).
The BPTX are mounted 175 m away from the bunch crossing point in both directions in the ATLAS detector.
The BPTX allows the observer to see the bunches as they pass towards the collision point, and thereby allows monitoring of the beam.
More importantly for us, the BPTX provides the L1 trigger with accurate timing references whenever a bunch passes it. This is used as a triggering condition for minimum bias events.
The MBTS are mounted on the Liquid Argon Endcap cryostats, with a coverage of 2.1<|η|<3.8
This consists of two sets of 16 scintillator counters
The MBTS will only be functional for a short time at low luminosity as it is expected radiation damage will render them useless within several months of beam collisions

*https://twiki.cern.ch/twiki/pub/Atlas/MinimumBiasTriggerScintillatorInfo/photo.jpg

TOT=E SDDDNDCD
3 Minimum Bias Data
MB=NDDD SD
The usual experiment definition of minimum bias cross section is Non-Single diffractive events (that is Non-diffractive inelastic and double diffractive events) but ATLAS is sensitive also to single diffractive events.
The expected cross section for NSD is ~65 mb if we include single diffractive events this is ~90 mb.
The number of events as seen by the minimum triggers for the run we looked at is 21,282,442 and for the operating time this gives a rate of 148.417 Hz.
We should note there is always some bias in the data taking. In practice the detector will probably not see glancing blows, or particles that just go down the beam pipe.
Cross Section (mb) – (Pythia 6.205)
Elastic 22
Single Diffractive 28
Double Diffractive 10
Non-Diffractive Inelastic 55
Central Diffractive ~

3.1 DataRun 153565 with ~21 million events
The original raw data is reconstructed, 21 282 442 events this is the number seen by the minimum bias trigger, into
group10.perf-jets.data10_7TeV.00153565.physics_MinBias.recon.ESD.f251_JetEtMissDPDModifier000016.v4_EXT0
A skim was made on the RAW for pileup events, and then reconstructed with 89334 events -
group10.perf-jets.data10_7TeV.00153565.physics_MinBias_extractedBS.merge.ESD.o5_r1297_p161_JetEtMissDPDModifier000025.v1_EXT0
Monte carlo of minbias+pileup events do not yet exist, but has been requested
The unskimmed raw data was processed according to the following criteria for events with multiple p-p interactions – primary vertices >1* -
- a primary vertex (PV) must be compatible with the beam spot
- each PV must have more than 7 tracks with pT > 150 MeV;
- a PV must not have more than 25% of outlier tracks (to reject overlapping vertices).
This skimmed data consists almost exclusively of pileup events, in practice there are 65 1 vertex events that appear in the skimmed data
*https://twiki.cern.ch/twiki/bin/view/Atlas/InterestingSkims

3.2 Run 153565
*ATLAS Run Query

3.3 Minimum Bias – Rates
In a vacuum, the rate at the LHC is
The rate seen by the minimum bias trigger is
Also we know the number of bunches in the detector. The bunch crossing rate is
We can then calculate the events/bunch crossing rate from the minbiasrate
This is now properly – the rate of minimum bias events per bunch crossing as seen by the minbias trigger.
If we take the predicted minimum bias cross section as ~90 mb then the total number of minimum bias events predicted with a total run luminosity of 0.78 nb-1 is
Why the discrepancy with what the trigger sees? We know the total luminosity 0.78 nb-1 from machine monitors, so if we worked backwards to obtain the cross section we find
A question of efficiency?
R= pp LEventsTime
=148.417 Hz
N=∫ Ldt=9∗10−26×7.8∗1032=7.02∗107
Circumferencevelocity of bunches
×bunch pairs≈27 km2
c=22.22 kHz
minbias ratebunchrate
=0.0067eventsBC
minbias≈29mb

3.4 Minimum Bias Data
With the minimum bias data we can plot the MET Resolution plotted against the absolute value of the sum of the transverse energy deposited into the detector (~essentially the strength of the interaction)


4 Pileup - Definitions
We distinguish between in-time pileup and out-of-time pileup
We imagine as proton bunches circle around in the accelerator in any given collision we may have more then one pair of protons colliding, this is in time pileup
Alternatively if multiple proton bunches are traveling in the accelerator and the bunch spacing is small, the first collision will occur within the detection chamber. As the product particles stream outwards the next collision (proton bunches trailing behind) occurs before the initial post-collision particles can fully evacuate the chamber. This is out-of-time pileup.
In this analysis we are strictly concerned with in time pile up. There should be no out-of-time pileup due to the spacing between the bunches.
What constitutes a pileup event is determined by the number of vertices. We consider any two events with more then two vertices as being pileup (excluding decay)
To distinguish between vertices due to additional collisions and vertices due to decay, there is a D3PD variable called vxp_type. Pileup vertices have vxp_type=3.
In addition there is a dummy vertex in every event, these we ignore.


4.1 Pileup
We expect the number of vertices in a collision to go as a poisson distribution
Examining the skimmed data, which contains all pile up events that passed the appropriate cuts we can fit the number of 2, 3, 4 vertices events to a Poisson distribution
If we extrapolate back to 1 vertex events, there would presumably be (2.78±0.03)*106 - that passed those same cuts
P=A
n e−
n !
A=4.71±0.05×107
=6.29±0.03×10⁻²
Vertices Events
2 87399
3 1841
4 29


P=A e−
x−
2
A=3.98±0.02×103
=3.8±0.3
=33.0±0.2


5 MET Resolution
We can quantitatively analyze the difference between the MET resolutions with respect to the number of vertices by approximating the statistics with an acceptable function.
This does become problematic if one does not have enough statistics
MET _ RefFinal _ et=A[MET _ RefFinal _ sumet ]
Vertex A α (10-1)
1 18.00±0.04 5.030±0.004
2 17.1±0.8 5.06±0.04
3 6±3 5.9±0.4
4 (2.8±0.1)*103 1±2


6 Comparing the Datasets
In order to understand the effects of multi-interaction events with respect to single interaction events we have to make sure the skimmed and unskimmed data sets are actually consistent with one another
Any comparison that we make then to the original data set (unskimmed) wouldn't make sense unless we applied the same cuts.
For example – if we use the Poisson distribution to extrapolate back to however many 1 vertex events are expected – that number would only correspond to the number of 1 vertex events that passed the cuts above and not the complete number of 1 events in the unskimmed data.
We have to make sure the two data sets (skimmed and unskimmed) are consistent.

6 Comparing the Datasets
How do we do this?
The skimmed data should be completely contained within the original unskimmed data
Let's work with a few variables (in principle any number of variables present in both d3pds should do)
1. Number of Tracks per Vertex (vxp_nTracks)2. Sum of transverse momentum per Vertex (vxp_sumPt)3. Sum of energy per vertex (vxp_E)
We want to know if the vertices we find in the skimmed data are consistent with what is in the unskimmed data.
For the skimmed data create 3 plots which consist of 1, 2 and 3 of the above but per event rather then per vertex (sum up the vertices for every event).
For the unskimmed data create plots of 1, 2 and 3 as they are.
Generate random numbers according to the unskimmed distributions above in accordance to the vertex information in the skimmed data ,creating generated plots of 1, 2 and 3 per event
If everything was ideal the generated distributions of 1 2 and 3 per event should match the real distributions created from the skimmed data


6.1 Problems
Obviously this doesn't work perfectly well...yet
What is wrong? This tells us our cuts are not correct.
Also the above consistency test was not made on the full unskimmed data set but only a portion of them (so the first thing to try is to run over all the data!)
The easiest way to solve this is to find the person who did the reconstruction and ask him/her!
So far no luck in that department, but also have not tried very hard
But since the data was skimmed from the RAW it's possible the reconstructed d3pds lack the necessary tools for skimming
The stupid way of doing this would be to skim the original ~21 million d3pd dataset for pileup events, then try to match variables in the JetETMiss skim to our skim, presumably one would see signs of cuts
For example in the JetETMiss d3pd one may find there are no vertices with less 7 tracks, indicating that such a cut has to be made the unskimmed data.
Rinse and repeat this until our skim is reduced to ~89k pileup events. Then reskim the ~21 million events, this time apply the pileup cuts to 1 vertex events
In this manner we could then obtain all 1 vertex events cut according to the pileup criteria

7 Life is a work in progress
Obtain all 1 vertex events that pass the skimmed dataset cuts (Make correct cleaning and selection cuts as prescribed by JetEtMiss Group)
Monte Carlo of minbias+pileup does not yet exist. Once these are made we can compare real data results to simulations
If we can correctly apply the cuts to the original data, a Kolomogorov-Smirnov test is the quantitative description of the probability that two distributions originate from the one and same underlying distribution. This applies to the consistency tests in the previous couple of slides.
Look at more data?

8 Conclusions
We have looked at the MET resolution in 7 TeV minimum bias data coming from ATLAS with respect to the effects of pileup
We validated the consistency of the data by examining various physical parameters and checking they made sense
The form of the MET resolution as parametrized by total transverse energy output into the detector does not seem to change with increasing pileup -
Although at greater then 3 vertices we do not have enough statistics to say for certain
As a function of total energy deposited in the calorimeter, the MET resolution for 1, 2 and 3 vertex seem to go roughly as the square root of the former.
We predicted the average number of interactions from the skimmed minimum bias data to be-
Predictions of minimum bias cross section from MC do not seem to match the cross section seen by the trigger system. There is probably a question of efficiency here, this needs to be looked at more carefully.
Monte Carlo data has yet to be examined but would prove a useful check on these results
For 1 vertex events our data analysis methodology is not yet fully formulate and needs more corrections for selection and cleaning.
6.29±0.03×10⁻²

Acknowledgments
Technical Assistance
Vikas Bansal, Ashok Agarwal, Frank Berghaus.

References
ATLAS Collaboration. "Data-Quality Requirements and Event Cleaning for Jets and Missing Transverse Energy Reconstruction with the ATLAS Detector in Proton-Proton Collisions at a Center-of-Mass Energy of Sqrt(s)=7 TeV." ATLAS NOTES (2010). Print.
ATLAS Collaboration. "Measurement of Missing Transverse Energy." ATLAS NOTES (2009). Print.
ATLAS Collaboration. "Performance of the Missing Transverse Energy Reconstruction in Minimum Bias Collision at Center-of-mass Energy of Sqrt(s) 7 TeV with the ATLAS Detector." ATLAS NOTES (2010). Print.
Dawson, I., and K. Prokofiev. "Determining the Inelastic Proton-proton Cross Section at the Large Hadron Collider Using Minimum Bias Events." Print.
Moraes, A., C. Butter, and I. Dawson. "Prediction for Minimum Bias and the Underlying Event at LHC Energies." The European Journal of Physics C 50 (2007): 435-66. Print.


![HE-LHC baseline parameters - indico.cern.ch · parameter FCC-hh HE-LHC (HL) LHC collision energy cms [TeV] 100 27 14 dipole field [T] 16 16 8.33 circumference [km] 100 27 straight](https://img.pdfslide.us/doc/110x75/5e1700e3bdc6c67b972d125a/he-lhc-baseline-parameters-parameter-fcc-hh-he-lhc-hl-lhc-collision-energy-cms.jpg)