Embed Size (px)
Citation preview

U.S. Air Force Office of Scientific Research - Grant No: AFOSR-89-0365
AD-A260 195
MESOMECHANICAL MODEL FORFIBRE COMPOSITES:
THE ROLE OF THE INTERFACE
FINAL REPORT
By M.R. PIGGOTT
Department of Chemical Engineeringand Applied Chemistry
University of Toronto, Toronto, Ontario, M5S IA4, Canada
July 31, 1992
93-01975S• il~lIIllII~11J[Ill11111111I w v ll

SECURITY C SIFI iATON OF THIS PAGE
Form ApprovedREPORT DOCUMENTATION PAGE OMB No. 0704-0188
la. REPORT SECURITY CLASSIFICATION lb. RESTRICTIVE MARKINGS
UNCLASSIFIED2a. SECURITY CLASSIFICATION AUTHORITY 3. DISTRIBUTION/AVAILABILITY OF REPORT
2b. DECLASSIFICATION/DOWNGRADING SCHEDULE Approved for public release;distribution is unlimited
4. PERFORMING ORGANIZATION REPORT NUMBER(S) 5. MONITORING ORGANIZATION REPORT NUMBER(S)
________A 7W 9R -6a. NAME OF PERFORMING ORGANIZATION 6b. OFFICE SYMBOL 7a. NAME OF MONITORING ORGANIZATION
University of Toronto (if applicable) AFOSR/NA
6c. ADDRESS (City, State, and ZIP Code) 7b. ADDRESS (City, State, and ZIP Code)
200 College St. Building 410, Bolling AFB DCToronto, Ontario M5S IA4 Canada 20332-6448
8a. NAME OF FUNDING/SPONSORING 8b. OFFICE SYMBOL 9 PROCUREMENT INSTRUMENT IDENTIFICATION NUMBERORGANIZATION (If applicable)
AFOSR NA AFOSR-89-03659c. ADDRESS(City, State, and ZIP Code) 10. SOURCE OF FUNDING NUMBERS
Building 410, Bolling AFB DC PROGRAM PROJECT TASK WORK UNITBuilding41 ELEMENT NO. NO. NO ACCESSION NO-20332-6448 61102F 2302 Bl
11. TITLE (Include Security Classification)
MESOMECHANICAL MODEL FOR FIBRE COMPOSITES (U)
12. PERSONAL AUTHOR(S)Michael R. Piggott
13a. TYPE OF REPORT 13b. TIME COVERED T14. DATE OF REPORT (Year, Month, 4a1) 15. PAGE COUNTFinal Report. FROM. 9/4Q TOj 5,L31 92/07/31 5a
16. SUPPLEMENTARY NOTATION
17. COSATI CODES 18. SUBJECT TERMS (Continue on reverse if necessary and identify by block number)FIELD GROUP SUB-GROUP
I )_11 4Fibre Reinforced Polymers, Mechanics of Composites
19. ABSTRACT (Continue on reverse if necessary and identify by block number)
See Exectuve Summary (next page)
I20. DISTRIBUTION/AVAILABILITY OF ABSTRACT / 21. ABSTRACT SECURITY CLASSIFICATION
S UNCLASSIFIED/UNLIMITED g] SAME AS RPT. DTIC USERS UNCLASSIFIED22a. NAME OF RESPONSIBLE INDIVIDUAL 22b. TELEPHONE (Include Area Code) 22c. OFFICE SYMBOL
Dr. Walter Jones (9n917A7_AL7Q AFOSR/NADO Form 1473, JUN 86 Previous editions are obsolete. SECURITY CLASSIFICATION OF THIS PAGE
UNCLASSIFIED

2
EXECUTIVE SUMMARY
This work was initially conceived as providing a theoretical framework linking
microphenomena and macroscale properties in fibre composites. In addition, experimental data
were to be obtained to lend substance to the theoretical constructs. Experiments were therefore
carried out on the interface, and on composites which were particularly sensitive to interfacial
effects, i.e. those containing short aligned fibres.
Pull out tests were used for interface studies. These showed that most fibre-polymer
interphases were strong (usually stronger than the polymer) and brittle. This brittleness was an
important observation which goes a long way towards explaining the properties of fibre
L composites containing many fibre ends.
Short aligned fibre composites were manufactured, with carbon fibres having lengths of
0.5, 1.0, 2.0 and 4.0 mm. Alignment was not perfect, nor were fibre lengths all equal to the
nominal lengths, so both alignments and lengths were checked in the actual composites.
Composite strengths and Young's moduli were measured and compared with predictions based on
slip and shear lag theory. The agreement for moduli was moderately good, but for strengths it was
very poor. Since, in addition, the stress strain plots were straight, the slip theory is notsupported
at all by this work. Instead, it appears highly likely that a mesomechanical theory involving crack
initiation and development would work much better.
Theoretical development led to the concept of the mesostructure as a basis for
mesomechanical analysis. The mesostructure was defined as adventitious small-scale structures
which are present in fibre composites, but normally neglected, such as fibre waviness and uneven
packing. It is shown that mesostructures can be classified, and the mechanics of them, i.e.
mesomechanics, can be used to explain hitherto difficult or impossible to explain properties, such
as the shear and compressive strengths of fibre composites. 0
j By
Avalin" Ity coot~e
L DiQLriTYtuttan/SE 3SDTIC QUALITY INSPECTED 3 a~tt S P~OOtO

3
1. INTRODUCTION
1.1 Mesostructures and Mesomechanics
Mesomechanics is concerned with the mechanics of materials at intermediate levels of
physical dimensions [1]. At one end of the scale is micromechanics which is used to describe
phenomena at the level of the grain size of metals (or ceramics) down to the level of individual
atoms, and so deals with both regular and random lumpiness in materials. At the other end of the
scale is continuum mechanics, in which these inhomogeneities are assumed to be smoothed out.
Mesomechanics occupies the middle ground and incidentally includes the development of damage
during use, and the kinematics of microstructural evolution.
Not everyone agrees that there is a need for a special term to describe micromechanics for
a particular size range of lumpiness. However, in the case of fibre composites it seems particularly
apt. Most workers in the field reserve micromechanics to describe the mechanical properties of the
interface or interphase, and to relate these to the mechanical properties of the individual laminae that
are cor_--ined to produce a high performance composite. Moreover, in the case of short fibre
composites, micromechanics has been used to describe overall properties of macroscopic samples.
[2]. Composite macro mechanics deals with the next scale up: the combination of laminae in a
number of directions, together with honeycomb structures, etc. to make a useful piece of hardware
[3].
What is assumed in all this is some perfect fibre packing (square or hexagonal) and
perfectly straight fibres. This is unjustified and can have quite serious consequences. For
example, there now seems little doubt that the compressive strength of carbon fibre composites is
controlled by fibre waviness [4], while toughness across the grain can be enhanced by fibre
bundling [5] although this, again, reduces compressive strength [6].
We will therefore use mesomechanics to describe the properties of composites containing
lumpiness on a scale bigger than the fibre diameter, but excluding effects between laminae such as
interlaminar shears, tensile stresses etc. The lumpiness will be referred to as the mesostructure.

1 4
1.2 The Role of the Interface
1 The central role played by the interface in the development of mesomechanics is apparent
when we look at the compressive strength of a unidirectional fibre composite. Wavy fibres will
I tend to buckle much more easily than straight fibres. They are restrained by the matrix, but clearly
this restraint is much reduced if the adhesion between the fibres and the matrix is weak [6] leading
to a loss in compression strength [7]. Undoubtedly other properties will be similarly affected. It is
I therefore important that interface properties are well defined and understood. In particular we need
to know how strong the interphase is, how tough it is, and whether it will fall gradually by
I yielding or suddenly by brittle fracture.
1 1.3 The Need For Exneriments and Theoretical Development
The work described here falls naturally into three parts.
1. Interface Studies. These involved experiments designed to measure interface
properties, and required the development of special techniques.
2. Short Aligned Fibre Composites Manufacture and Testing. Earlier work on
short aligned fibre composites have not supported existing micromechanical theories very well.
For example, with carbon reinforced epoxies, Young's moduli were too low and strengths were
sometimes too high [8]. With glass-epoxies on the other hand strengths were usually much too
low [9]. This could have been due to damage development, perhaps associated with debonding
and so would have mesomechanical implications.
3. Mesostructures Identification of mesostructures, analysis of their effects on final
properties, and consideration of manufacturing and processing implications.
These will be discussed separately.
2. EXPERIMENTS ON THE FIBRE-MATRIX INTERFACE
The single fibre pull out experiment has been adopted for this, since it permits the
measurement of debonding force as a function of embedded length. This enables some

5
conclusions to be drawn about the nature of the interface failure mechanism, as well as giving
values for debonding stress and in some cases interfacial pressure and friction as well.
1 2.1 Experimental Method
2.1.1. Fibre Embedment in Thermosets and low T Thermoplastics
A special set up has been designed and developed for the embedding of fibres, fig. 1. This
is a carousel arrangement, which is used for embedding 39 fibres in one operation. Good geometry
of embedment is assured by holding the fibres vertically in glass capillaries fixed inside brass tubes
which can slide up and down in the upper section of the carousel. The embedment length is
controlled by using a micrometer mechanism to lower the tube containing the fibre, meanwhile
I observing the fibre end and the resin container through a microscope.
I When 39 fibres have been placed to the correct depths in the liquid resin, the whole
carousel assembly is put in the oven for cure.
The process has been adapted for use with low melting temperature (low Tm)
thermoplastics, by mounting the carousel on a heater. The polymer was melted, and the fibres
were then lowered into small depressions made in the polymer surface.
2.1.2. Fibre Embedment in High Tm Thermoplastics
The carousel method could not be used for high melting temperature thermoplastics because
of the risk of heat degradation at the melting temperature (nearly 4000 C) and of oxidation. Instead,
a very fast heating method was devised under a program funded by Du Pont. This involved a
specially designed MicroInduction Heater, fig. 2, which would heat the specimen at up to 18oCs- I
and could reach temperatures well above the melting temperature. Heating rate, hold temperature,
time at temperature, and cooling rates could be controlled very precisely, and over a wide range.
16
This equipment is currently being commercialized.
The same method was used as in the carousel for fibre embedment. The resin was held in a
small stainless steel container, and was heated up and melted in about 60s by the Microlnduction
Heater. The temperature was then held at just above Tm while the fibre, held in a capilliary, was
lowered partially into the resin, to give an embedded length of about 1 mm or less. This process
took about 200s. Thereupon the MicroInduction Heater went into the controlled cool down mode.
Different cooling rates were chosen to control the degree of crystallinity of the resin.
2.1.3 Fibre Pull Out
After embedment, and cure where necessary, the fibres were removed from the carousel
I and tested in an Instron machine. Here, special precautions were taken to ensure that the fibre
stress was axial. A plate was held in the upper grip of the machine, and the fibre brought into
contact with it, and then bonded to it with cyanoacrylate adhesive, see fig. 3. Pull out was carried
out at 0.5 mm min.-1 .
For some experiments pull out was effected at elevated temperatures. For this the Instron
Environmental Chamber was used. The fibres were allowed to equilibrate at the testing
temperature for at least 30 min before pull out was started.
2.2. Exnerimental Results
2.2.1 Thermosets
Tests have been carried out with Hercules carbon fibres AS 1 (unsized), AS2 (sized), AS4
(sized) and HMU in Shell epoxy resins EPON 815 and 828. For the EPON 815 the curing agent
was Anchor 1170, and the curing was at temperatures in the range 60-180oC. For the EPON 828,
Anchor 1115 was used, and the resin was cured at 135 0 C for 22 hr.
MERP Enhanced Composites, Inc., 35 Addington Avenue, Willowdale, Ontario,M2N 2LI Canada

1 7
IFig. 4 shows two typical room temperature pull out curves. Here the force is plotted as a
function of distance pulled out. With a well adhering fibre, labelled AS4, the force increases
linearly until debonding occurs. At this instant the force falls precipitately, and the remainder of
the pull out is governed by friction. With a poorly adhering fibre, labelled HMU, debonding, and
friction immediately thereafter, involve almost the same force, and the force is much smaller than in
I the well bonded case.
Fig. 5 shows the variation of debonding force with embedded length for AS4 fibres in
EPON 828 cured for 22 h at 135 0C. From the slope of this line and other lines from similar plots
for other fibres and epoxies the mean interfacial shear strengths were estimated, and are given in
Table 1. The results were frequently quite scattered, with coefficients of variation in the range 12-
25%, see table 1.
HMU hardly bonds at all to epoxy resin; the frictional part of the pull out curve, see Fig. 4,
gives about the same shear stress as the debonding part. This should be contrasted with the pull
out curve for AS4 in the same resin (EPON 828), with the same cure, i.e. 22 h at 1350C, where
the debonding force greatly exceeds the frictional force. Fig. 6 shows that FA is not truly
I proportional to L: there is a small intercept, Fo. The slope corresponds to a shear stress of about
1.9 MPa. A similar conclusion emerges from results where the debonding force is less than the
frictional force.
AS 1, AS2, and AS4 all give about the same results when embedded in EPON 828 cured at
1350 C for 22 h. Table 1. The mean and maximum debonding stresses are extremely high, i.e. up
to nearly 150 MPa for the maximum and 100 MPa for the mean.
2.2.2 Thermoplastics
With nylon and polyethylene, the pull out curve shows some evidence of plastic yielding,
I see fig. 7. With AS4 fibres the debonding stress for polyethylene (fig. 8) is much less than for
epoxy (fig. 5). There is some indication of a plateau for L > 0.8 mm. The average debonding
stress is about 12 MPa.
II
8
With glass fibres, figs. 9 and 10, the results are very similar. All the results with
thermoplastics are highly scattered, and with nylon the debonding force appears to be almost
independent of embedded length (the line shown in fig. 10 indicates the debonding force vs
embedded estimated for the mean shear strength from all the results shown.)
The high temperature thermoplastics developed much stronger interphases with carbon.
The force-distance curves had a sudden drop when debonding occurred, indicating either ductility
exhaustion or brittleness. Debonding force vs embedded length had a linear region, then a plateau,
fig. 11. The effect of the sizing was not significant, fig. 12, and slow cooling the PEEK also had
no significant effect.
2.2.3 Pull Out at Elevated Temperatures.
The force-distance pulled out plots, showed decreasing amounts of friction as well as some
decrease in the maximum force; see fig. 13 which shows pull outs at 200C, 500C, 800C and
1 0oC for AS4 carbon in epoxy embedded to a depth of about 100 gam. The corresponding
debonding forces vs embedded length plots, fig. 14, had similar slopes, but intercepts which
varied with temperature. At 1 100C the intercept was anomalous, corresponding to a negative force
for zero embedded length. The pulled out fibres often had quite large pieces of polymer adhering
to them which had been plucked out from the surface. Their shapes were consistent with a
shearing type of failure in the polymer, fig. 15. This should be contrasted with the ductile necking
type of failure typical of glass pulled out of LDPE; see fig. 16. which shows four stages of the pull
out process.
The shear strength of the polymer, measured at 20, 50, 80 and 1 10°C, using the Iosipescu
shear test, did not correlate with the shear strength of the interphase, see fig. 17.
2.3 Interpretation of the Results
The interface or interphase, in the case of the epoxy, appears to be extremely strong. Tests
on short cylinders of the EPON 815 indicate a compressive yield stress in the range 45-60 MPa,

9
with an ultimate compressive strength of 80-90 MPa. Curing at 600 C for 4 h gives much the same
result as 180 0C for 4 h. Thus the polymer adjacent to the interphase is expected to yield in shear at
26-35 MPa (Von Mises yield criterion). The mean interface stresses observed with EPON 815
(table 1) are 56-73 MPa with maxima as high as 100 MPa. Thus ductile failure at the interface is
highly improbable with surface treated ASI in EPON 815. This is also the case with AS1, AS2
and AS4 in EPON 828, where the interphase strength is even greater.
The lack of correlation between the interphase shear strength iu and that of the polymer,
"tmu, is even more strikingly apparent when the pull out tests at elevated temperatures are
considered. Fig. 17 shows that while tmu decreases rapidly with increasing temperature, riu varies
relatively little.
The debonding stress, 'td is associated with an equivalent work of fracture in the interphase,
Gi, [101, where
Gi = dc 21 +v)ln(D/d)/2Em
Here d is the fibre diameter, and D is the diameter of the cylinder of resin in which it had been
embedded. Vm and Em are the Poisson's ratio and Youngs modulus of the polymer. Values of Gi
associated with the debonding stresses are given in Table 1. The values for thermosets are all less
than 300 Jm-2, indicating that the interphase could possibly fail quite easily by brittle fracture.
The effect of fibre type is not apparently very great, at least as between AS 1, AS2 and
AS4, and the sizing appears to make very little difference. This needs to be confirmed however, as
a comparison between sized and unsized fibres with the same type of polymer has not yet been
made in the case of thermosets. The beneficial effects of surface treatment are very evident,
however, when the low result from the HMU is considered.
With low temperature thermoplastics the interphase is evidently much weaker. Again,
however, it is stronger than the shear strength of the polymer, tmu. For the polyethylene, this was

10
about 3 MPa, so the mean debonding stresses were about 400% greater in this case. Again, there
are very low equivalent works of fracture (Table 1) which indicate easy failure by brittle fracture.
The high temperature thermoplastic PEEK gave a stronger interphase, but again the failure
was sudden and probably brittle, with apparently quite small works of fracture, Table 1. The fibre
sizing had no significant effect on the bond strength.
3. SHORT FIBRE COMPOSITES
A major emphasis of this work has been to determine whether curved stress-strain plots are
produced by short aligned fibre composites, since this is a critical test of the established
micromechanical theory for the failure process.
3.1. Experimental Method
A specially constructed machine [8] was used to produce aligned fibre mats. This involved
dispersing the fibres in glycerine, and spreading them on the inside of a rotating cylindrical screen,
fig. 18. (The rotation removed the glycerine.) Nozzle size and distance between the nozzle and the
mesh had to be adjusted to suit the different fibre lengths. The drum rotated at 400 rpm and the
nozzle traversed the drum at 17 mm s-1.
Hercules AS2-W-12k fibres were used. They were cut to nominal lengths of 0.5, 1.0, 2.0
and 5.0 mm by Cape Composites.
Composites were made using EPON 828 with 7.0% Anchor 1115. For this, several layers
of cleaned and dried mat were placed in a mold, infiltrated with the resin mixture, and then hot
pressed at a pressure of no more than 3 MPa and 1350C. The final thickness of the composite
was 1.5 mm for tensile and flexure tests and 3 mm for Izod tests.
Fibre lengths were checked using the microscope. At least 200 fibre lengths were
measured for each nominal length. The lengths were measured both before use, and after making
composites.

1i 11
Fibre alignment was monitored using the method of Yurgartis [11]. This involved the
I cutting and polishing of sections at 50 and 100 to the main fibre direction and measuring the
ellipticity of the fibre intersections. About 1200 and 500 ellipse lengths were measured for in-
I plane and out-of-plane distributions respectively.
For tensile testing, 20 mm x 50 mm end tabs were bonded to the specimen using epoxy.
They were tested in an MTS machine at 0.5 mm min-1. Flexure tests were carried out at the same
I rate, using 4 point bending with a gauge length of 25.4 mm and a lever arm length of 12.7 mm.
Rollers were used at the loading points. For the Izod tests a Tinius Olsen Impact Tester was used.
i Fibre strengths were measured by the standard method, and the interphasial shear strength
was estimated from fibre fragmentation tests, as previously [8].
3.2 Exoerimental Results
3.2.1 Composite Ouality
In-plane alignment was less good in the composites than out-of-plane; see fig. 19 which
shows the results for nominally 2 mm long fibres. Fig. 20, showing the in-plane angle
distributions for all the fibres used, indicates that the 2 mm fibres were the most well aligned.
Fibre lengths were not as well controlled as in the previous work [8]; significant fractions
of fibres were too short, and in case of the 2 mm long fibres some were too long, see fig. 21. The
nominally 5 mm fibres were nearly all 4 mm long or less, and will henceforth be designated 4 mm
fibres.
The fibre strength was 2.8 ± 0.5 GPa, and the critical fibre length was 0.43, giving a
critical aspect ratio of about 54.
3.2.2 Tensile and Flexural Properties
The Young's moduli of the composites made with sized fibres were somewhat less than the
Rule of Mixtures values, ElL

12
EIL = VfEf + VmEm (2)
see fig. 22, the difference increasing with decreasing fibre length. Flexural moduli were slightly
higher, see fig. 23.
The tensile strengths of the composites made with the sized fibres, fig. 24, were
approximately linear functions of Vf. As expected for short fibre composites, strengths alu were
somewhat less than the theoretical strength for continuous unidirectional composites, (;IuL
0IUL= EIL'fu (3)
with the 2 mm fibres giving the strongest composites and the 0.5 mm fibres giving the weakest
composites. Flexural strengths were higher, fig. 25, with the 4 mm long fibres giving the strongest
composites and 0.5 mm giving the weakest.
The stress-strain plots for all the composites were straight lines, while for the resin the
stress-strain plot was slightly curved, fig. 26. The breaking strains showed no clear trends, but all
were significantly below the fibre breaking strain, and were less than one third of the matrix
breaking strain, see fig. 27. The fibre strength was 2.8 ± 0.5 GPa. The critical fibre length was
about 0.43 mm, giving a critical aspect ratio of about 54.
Finally when the composites were strained to 0.8% in tension (i.e. about 70% of the tensile
breaking strain) before being tested in flexure, there was no apparent loss in strength, but there
was some evidence of loss in flexural modulus. This loss was greatest for the shortest fibres; see
fig. 28. However these results are only an indication of possible trend since the scatter of results
was about equal to the differences shown on the graph.
3.3 Interpretation of the Results
The results fit in with the general trends observed previously. Thus the Young's moduli
and strengths (both tensile and flexure) were roughly linear functions of Vf. The moduli, fig. 22 &

13
23 extrapolated to Em at Vf = 0 reasonably well. The tensile strengths extrapolated to EmFfu (- 30
MPa) fairly well also, fig. 24, as did the flexural strengths, fig. 25. However, some anomalies are
apparent. The 4 mm fibres gave the highest Young's moduli and flexural strengths, but the second
highest tensile strengths at most fibre volume fractions. This could only partly be explained by
their less good alignment, fig. 20, since misalignments would affect flexural strengths and tensile
strengths equally, while it should have a different effect on the modulus.
The imperfect alignment is allowed for in the theoretical equations as discussed previously
[8]. For modulus we write
E1 -=X1 (1-tanh(ns)/ns)VfEf+VmEm (4)
where
2 ln =2Ea/Ef(1+Vm)ln(2l/tb Vf) (5)
for fibres uniformly hexagonally packed, and with Vm denoting the Poisson's ratio for the matrix.
Xl (<1) represents the contributions to the modulus from the misaligned as well as the well aligned
fibres. For strength we write
alu = X3 (I 1-sc2s)Vffu+fVm~ym (6)
with X3 (<1) representing the contribution to the strength, am* the mean matrix tensile stress at the
fibre breaking strain, s is the aspect ratio, and Sc is the critical aspect ratio given by
sc = (yfui/2'Tiu (7)

14
Table 2 gives the values for X1 and X3. Also given are the fibre length factors X2 and X4U
compensated for the inaccuracies in the fibre cutting process
u
X2 = Psk { 1-tanh(nsk)/nsk} (8)k=l1s
where Psk is the fraction of fibres having aspect ratios Sk ± As, estimated from the data shown in
fig. 23, with As equal to one half of the intervals between the points. Also
V W
X4 =1 slAt 1-~s 1+1 Psk sk /2 sc(9
where Pslk and Ps._ being the fractions as above for longer (S>Sc) and shorter (s5sc) fibres.
It can be seen that XI and X3 differ somewhat, and the better alignment of the 2 mm fibres
shows up as higher values of XI and X3 (Table 2.).
However, our trends, as indicated in figs 22 and 24, when used to check the theoretical
expressions, show poor agreement. For the experimental results we write, for modulus
E1 = AEVfEf+VmEm (10)
and for strength
Ylu = (AsVfFf + VmEm)'fu (11)
We use the lines shown on figures 23, 24 and 25 to estimate AE and As
Comparing equations 4 and 6 with 10 and 11, agreement between theory and experiment
requires AE = X1X2 and As = X3X4. It is apparent from Table 2 that agreement is not very good.
The comparisons are shown graphically in figs. 29 and 30.

15
The modulus results are a little above theoretical estimates, whilst the earlier Sanadi [8]
results, which are also shown in the figures are about right, see fig. 29. The glass fibre results of
Chuang [9] fall into two groups; the 3 mm and 6 mm fibres give high results, while the 1.6 and
0.8 mm fibres give low results. These low results may have been because the fibres were milled.
This severely damaged the fibres, which may have affected the effective length distributions, since
badly cracked fibres could well have broken during processing.
The strength results were all somewhat higher than the theoretical estimates, fig. 30, with
some of the flexural results being extremely high (especially those for the 4 mm fibres, which had
As = 0.83 for flexure). The earlier Sanadi results [8] are about as far above the theoretical line as
the tensile results reported here. These composites had £fu = Emu/ 3 (Ko) and Efu _= emu/4 (Sanadi).
The glass fibre composites (Chuang) [9], which had Efu = 2.4 e mu, gave very low results,
especially when the milled fibres were used (As = 0.3 and 0.4).
A major problem with this type of experiment is the difficulty of producing high quality
specimens with fibres all the same lengths and aligned consistently, with fibre volume fractions
well controlled and with the fibres uniformly distributed. Large resin rich areas are a particular
problem at low fibre volume fractions. Inevitably the results tend to be scattered and interpretation
is therefore somewhat difficult.
The most important clues to the behaviour of these short fibre reinforced polymers are the
straightness of the stress strain curve, and the breaking strains.
1. Straight stress-strain curves indicate that progressive slip does not take place. Hence,
equation 6 cannot explain the behaviour of these short fibre composites, and consequently the
theory on which it is based is not supported by these experiments.
2. The breaking strains of the composites investigated here were always less than the fibre
breaking strains. Thus, again, equation 6 is not supported.
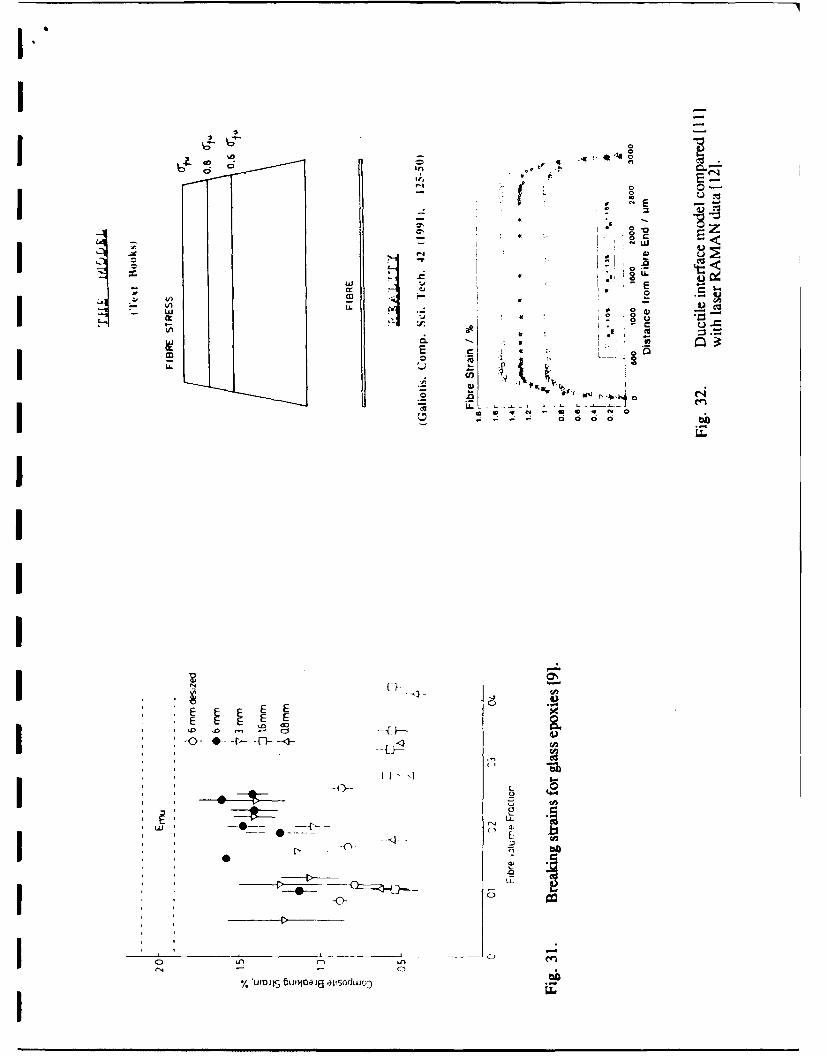
The breaking strains for the glass-epoxies mentioned earlier [9] are even lower. They are
shown in fig. 31, and, as expected since emu < Efu, are much less than the fibre breaking strain.
They are also, more surprisingly, much less than the breaking strain of the polymer for the low

16
volume fraction results with the 3 nm and 6 mm long fibres (aspect ratios about 170 and 330).
The shorter fibres (0.8 and 1.6 mm long) have very low breaking strains at all fibre volume
fractions.
In view of these striking divergencies from the theoretical predictions, we may need to
abandon the concept of the critical fibre aspect ratio for reinforced plastics and re-think the basic
theory. This was founded on ideas borrowed from metals which yield and then flow at a stress
which is often assumed to be approximately constant. Polymers are different. Fig. 32 compares
the model [12] and recent work using Laser Raman Scattering [13]. Further evidence comes from
the study of the ceramic-polymer interface using the single fibre pull out method. The model was
based on ductile metal behaviour involving very short embedded lengths (< 10 diameters) [14].
However, the actual behaviour of the carbon-epoxy interface is brittle as shown in figs. 4 and 13.
There is now a body of evidence not only that this interface is brittle but also that it has properties
which are totally unrelated to the shear strength of the polymer, see fig. 17, and note that these
results are supported by the studies of Netralvali et al [15] using a different test and different
polymers. In addition, evidence has recently appeared which suggests that a high modulus (and
presumably high strength) form of polymer may possibly be present at the ceramic-polymer
interface [16, 17].
At this time it is only possible to speculate on the failure processes which trigger composite
failure. Any theory will have to be consistent with the following.
1) For well bonded systems with efu << Emu the failure strain is not a function of fibre
length (except possibly with very short fibres, i.e. s < 100). Since the Young's modulus is
approximately given by the shear lag theory (after due allowance has been made for misaligned
fibres), the strength is given by alu = E1efu with
E=X (I-tans)VfEf + VmEm (12)

17
at the lower fibre volume fractions (<5 0.2) and somewhat less than this at higher Vis.
It seem highly probable that some debonding of misaligned fibres occurs either at very low
applied stresses, or even before any stress is applied, as a consequence of cure shrinkage stresses.
This would reduce X1 and account for the reduced modulus indicated by the Sanadi results with the
shortest fibres (2 mm & 1 mm) [8]. Hence we use a modified X1, which we have written as Xl*.
2) For well bonded systems with efu- Emu/ 3 (the case examined here) the composite
breaking strains are in the range 0.6 efu to 0.9 efu for the longer fibres (s > 100) with very little
effect due to volume fraction. For very short fibres (s < 100) the breaking strains are - Efu/2.
Equation 4 gives the approximate modulus, E1 while for strength we write
=EIE (13)
lu Illu
In this case £lu must be measured. Its low value is probably due to cracks developing from
fibre debonds near the fibre ends. We would expect a fibre volume fraction effect, since the
number of fibre ends in an aligned fibre composite lying within one fibre diameter of any given
cross section normal to the fibres is
Ne = 4Vt/itd 2s (14)
per unit area. If each fibre end produces a cracked area Ac which is proportional to the fibre cross
section, i.e. Ac = Aond2/4, where Ao is a constant then
Ac = 4AoV/s (15)
So we would expect also to have a fibre aspect ratio effect. These effects must be quite small in the
case examined here because there were no clear trends in the breaking strains, fig. 16. However,
the Vf effect is apparent in the Sanadi results [8].
3) For well bonded systems with Efu > emu (i.e. glass fibre reinforced epoxies and
polyesters) £-lu is probably a monotonically increasing function of fibre volume fraction, fig. 31,

18
and is affected by the fibre aspect ratio. Thus we do not have agreement with equation 15 since the
equation suggests an increase in possible cracks with increasing fibre volume fraction. Instead,
crack size might be important. Thus, at low fibre volume fractions, large matrix cracks can
I develop in resin rich regions. These might perhaps develop significant stress concentrations, and
be able to continue across adjacent fibres, leaving these fibres bridging the cracks, and thus able to
debond and pull out without fracturing.
More work is clearly needed on the actual failure process, with careful experiments to
determine at what stage matrix cracking starts. These experiments should perhaps include acoustic
emission studies to detect debonds and cracks. That polymer cracks can form near fibre ends is
well known [8].
Further theoretical work on the effect of fibre ends and breaks, such as that carried out by
Curtis [181 should also be pursued; however closed form expressions are preferable to numerical
analysis. In particular a mesomechanical theory of crack development is needed.
4. THEORETICAL DEVELOPMENTS
The key to the development of mesomechanics may well lie in a better understanding of the
substructures involved. Heretofor it has been almost universally assumed that a two step approach
could be used: i.e. 1) from micromechanics directly to lamina and then 2) from lamina to laminate
properties. That this is probably erroneous is apparent when we look at the prediction of
compressive strength. Efforts to do this on the basis of the simple micromechanical approach [19]
have been unsuccessful [6]. Instead, a major contribution to compressive failure comes from lack
of perfect fibre alignment, and there is a direct correlation between fibre alignment and strength and
modulus in compression [4]. However, prediction of compressive strength may also require
inclusion of fibre bundle effects [6].
Fibre waviness and fibre bundles constitute substructures which are not normally intended
to be present in a composite. We will call such substructures mesostructures.

1 19
4.1 Mesostructures
Mesostructures will be defined here as structures which are coarser than the fibre-interface-
polymer microstructure, but on a finer scale than the lay-up, core-skin structure and outer form of
the material. They are generally a fortuitous structure, i.e. not part of the original design.
At least two classes of mesostructure can be identified, since we can have disorder in what
is intended to be a rigidly ordered structure, and conversely, order in what is intended to be a
disordered structure. Within each class there are at least two types of order/disorder: orientation
effects and packing effects. We will discuss the two classes separately.
4.2 Adventitious Disorder
4.2.1 Orientation Errors
Even in the best laid up laminates it is impossible to ensure that the fibres are perfectly
straight, yet perfect straightness is assumed in practically all theoretical treatments of fibre
composites. This lack of straightness shows up as imperfect alignment or a fibre waviness. This
will directly affect the compressive strength (and modulus), shear strength, delamination
I resistance, and fatigue endurance (including tension-tension fatigue). There may also be secondary
effects on tensile modulus and strength, and fracture toughness. Local misorientations can be
quantified using the method of Yurgartis [11] but fibre waviness is more difficult to measure [20].
4.2.2 Packing Faults
I Normally, theoretical treatments assume hexagonal packing of fibres in three dimensional
aligned fibre structures, although square packing is sometimes assumed. Laminates are treated
theoretically as though, in each lamina, there is a single layer of fibres, equispaced, and with axes
I located on the centre plane of the lamina. Real composites, on the other hand, contain resin rich
areas which are relatively weak, and resin poor areas where contacts can occur. The most serious
I example of packing faults, moreover, is the lack of either fibre or resin in some regions, i.e. voids
in the structure. All composites appear to contain voids.

20
The main effect of these faults will be to reduce the various strengths of a composite:
tensile, compressive, shear etc. However, if the composite contains excessive voids (a good
composite has roughly one volume per cent of them) the moduli could also be affected.I4.3 Adventitious Order
4.3.1 Orientation Effects
In a random mat or a sheet molding compound, the orientation of the fibres is seldom
completely random, although normally complete randomness is usually intended. The process of
molding these materials can also develop preferred orientations. These will give the composite
unexpectedly high properties in some directions, and correspondingly low properties in others.
Similar effects are observed when short fibre reinforced thermoplastics (e.g. nylon) are molded.
The orientation of the fibres inside the molding is complex, and reflects the flow pattern. For
example, in thin sections the fibres are usually preferentially oriented parallel to the plane of the
mold surfaces. Design data for such moldings must take these mesostructures into account.
4.3.2 Packing Effects
In short fibre composites, the fibre ends are expected to be positioned at random.
However, imperfect dispersion can result in some end synchronization, i.e. fibre ends may be
concentrated in (or close to) particular planes. This will weaken the composite. In continuous and
in long fibre composites fibre bundling can occur. In this case fibre bundles (perhaps from the
original roving or tow; especially if it sustains a little twist) retain their presence in the composite,
and act in harmony. This can increase the across-the-grain toughness of a composite, and reduces
the compressive strength.
4.4 Prediction of Pronerties Using Mesomechanics
This already appears to be possible in the case of compressive strength, and some progress
has been made in fatigue of carbon fibre composites [21]. Further developments will require a

21
much greater attention to details of the mesostructure.
The concept of mesostructures has been applied to shear strength. The "classical" theory
for shear strength assumes straight and uniformly arranged fibres, separated by polymer. The
I theoretical shear strength is, therefore, expected to be equal to the shear strength of the weakest
component, i.e. the polymer. Experimental values for shear strength are somewhat greater than
this [22].
The reason for this discrepancy is apparent when the actual structure of fibre composites is
examined. The fibres are never entirely straight, and this requires the crack plane to deviate, or
else fibres cross the crack plane, and must be broken in order for shear failure to occur. If the
volume fraction of fibres crossing the cracks plane is Vfb, then the shear strength of the composite
I 1T3u is given by Itl 3u Vfbafu/ 2+(l'Vfb)Tmu (16)
Fibre bridging appears to be the most likely contributor to the extra shear strength (over and
above that of the polymer) but one other mesostructure that may be important is fibre bunching.
This causes deviations of the failure plane, increasing its surface area.
In the case of the short fibre composites studied here we need to examine orientation errors,
packing faults (especially voids) and fibre end synchronization. The first step here will be an
attempt to quantify them.
5. CONCLUSION
5.1 The Fibre Matrix Interface
Pull out tests suggest that interphases between fibres and polymers are almost universally
strong, and often stronger than the polymer. The only exception observed in these experiments
was the high modulus carbon, Hercules HMU, which appeared not be adhere to epoxies at all.
The interphase properties appeared to be unrelated to those of the polymer and in particular, when
the testing temperature was raised the interphase strength changed very little while the polymer

1 22
shear strength dropped sharply. Furthermore, most interphases appeared to be very brittle, with
works of fracture much less than those of the polymer.
5.2 Short Aligned Fibre Composites
These obey mixture rule type expression quite well for Youngs modulus, but less well for
strength. Flexural strengths were greater than tensile. The strengths could not be reconciled with
the interface yielding and slip theory, and since the stress strain plots were straight until composite
failure, the work provided no support for the theory.
I It is possible that cracks, starting at the fibre-matrix interface near fibre ends, initiates a
multiple fracture type of failure process. Such a mechanism could involve only very small inelastic
strains, and help explain the straightness of the stress-strain plots. However, the evidence for a
critical damage strain was not very great. Further work is therefore needed on the strains needed to
initiate damage, especially fibre debonding and matrix cracking near fibre ends. Experiments with
single short length fibres embedded in polymers should provide the necessary data. In addition,
further work on crack development should be carried out, and a mesomechanical analysis would be
appropriate..
5.3 Advances in Mesomechanical Theory
The concept of the mesostructure, and mesomechanics as the mechanics thereof, seems
particularly apt for fibre composites. This is because composites have a range of hitherto neglected
structures. Furthermore these mesostructures can be used to help explain properties, such as
compressive and shear strength, which have been difficult or impossible to predict from
constitutent material properties. The mesostructure also provides a link between processing in the
manufacture of fibre composites and their final properties.

* 23
* 6. REFERENCES
1. G.K. Haritos, J.W. Hager, A.K. Amos and M.J. Salkind, Int. J. Solids Structures 24,(1988), 1081.
2. M.R. Piggott, "Load Bearing Fibre Composites", (Pergamon, Oxford, 1980), Chpt. 4.3. J.E. Ashton, J.C. Halpin and P.H. Petit, "Primer on Composite Materials: Analysis",
(Technomic, Westport, Conn. 1969)
4. A. Mrse and M.R. Piggott, Proc. of 36th Int. SAMPE Symp., (1990), 2236.
5. M. Fila, C. Bredin, and M.R. Piggott, J. Mater Sci. 2, (1972), 983.
6. M.R. Piggott, J. Mater Sci. 16, (1981), 2837.
7. N.L. Hancox, J. Mater Sci IQ, (1975), 234.
8. A.R. Sanadi and M.R. Piggott, J. Mater Sci. 2Q, (1985), 421.
9. H.Y. Chuang and M.R.Piggott, Proc. of Amer. Soc. for Comp., (1990), 984.
10. M.R. Piggott, Comp. Sci. Tech. 42, (1991), 57.
11. S.W. Yurgartis, Comp.Sci. Tech. 3M, (1987), 279.
12. D. Hull, "An Introduction to Composite Materials" (Cambridge Univ. Press, 1981), 201.
13. C. Galiotis, Comp.Sci. Tech. 42, (1991) 125-150.
14 W.R. Tyson, Ph.D. Thesis, Cambridge, University of Cambridge, (1964), p. 80.
15. A.N. Netravali, R.B. Henstenburg, S.L. Phoenix and P. Schwartz, Polymer Comps. 10,(1989), 226.
16. P.H.T. Vollenberg and D. Heikens, Polymer 3D, (1989), 1656-62.
17. P.H.T. Vollenberg, L.J.M. Van deVen and D. Heikens, Polymer 3D, (1989), 1663-8.
18 P.T. Curtis, Comp. Sci. Tech. 22, (1986), 63-86.
19. B.W. Rosen, "Composite Materials", (American Soc. for Metals, Ohio, 1964), Chp.3.
20. A.L. Highsmith, J.J. Davies and K.L.E. Helms, ASTM STP 1120, (1992), 20.
21. M.R. Piggott and P.W.K. Lam, ASTM STP, 1110, (1991), 686.
22. C.A. Dostal (ed), "Composites: Engineered Materials Handbood" (ASM Int. Ohio, 1987),1, 376.

24
7. STUDENTS TRAINED
Four graduate students have been working on this project, and two have written their work
up and have been awarded M.A.Sc.'s.
9. PUBLICATIONS
Four papers have been prepared which come directly from this contract.
1. M.R. Piggott, "Mesostructure in Fibre Composites", CANCOM '91, Montreal, Sept. 4,1991.
2. M.R. Piggott, "Fibre Composites: Mesostructure & Mesomechanics", IUTAM Symp.,Blacksburgh, VA, Oct. 29-30, 1991.
3. M.R. Piggott, "Mesostructures - an Overview", Proc of 37th Int. SAMPE Symposium,Anaheim, CA, Mar. 9-12, 1992.
4. M.R. Piggott, M. Ko and H.Y. Chuang, "Aligned Short Fibre ReinforcedThermosets: Experiments and Analysis Lends Little Support for Established Theory",Paper presented at Microphenomena in Composites Meeting, Herzlia, Israel, June 28 - July1, 1992. Submitted for publication in Comp. Sci. Tech..
Eight papers have been prepared on work partially supported by this contract.
1. Z-N Wang and M.R. Piggott, "Relations Between Polymer & Fiber - PolymerInterfaces Properties, Proc of American Society for Composites, Albany, N.Y, 1991, 725.
2. M.R. Piggott and P.W.K. Lam, "Fatigue Failure Processes in Aligned CarbonEpoxies, ASTM STP 1110, pp 686-95, (1991).
3. M.R. Piggott, "Failure Processes in the Fibre-Polymer Interphase", Comp. Sci. Tech.42, 59-78, (1991).
4. M.R. Piggott, "The Single Fibre Pull Out Method: Its Advantages, Interpretation andExperimental Realization", ICCI-IV Conference, Cleveland, OH, May 26-29, 1992.Submitted to Composites Interface.
5. M.R. Piggott, "Tailored Interphases in Fibre Reinforce Polymers", Materials ResearchSociety, Savannah, GA, Feb. 18, 1990, 22.
6. H.Y. Chuang and M.R. Piggott, "Properties of Short Aligned Glass FibreReinforced Epoxies", Proc. of Amer. Soc. for Comp., Lansing, MI, June 10, 1990, 984.
7. M.R. Piggott, "Micromechanics of Interfaces, IPCM '91, Belgium, Sept. 17, 1991, 3.
8. A. Mrse and M.R. Piggott, "Mechanisms of Compressive Failure in FibreComposites", 1st International Conference on Deformation and Fracture of Composites,Manchester, U.K. March 25, 1991, 1-20.

1 25
In addition, the concepts developed here have influenced the interpretation of the results of
I work which was ongoing in the Advanced Composites Physics & Chemistry Group at the time this
contract started. In particular the concept of rmesostructures appears in the following papers which
have been accepted or are being submitted for publication.
1. A. Mrse and M.R. Piggott, "Compression Properties of Unidirectional Carbon FibreLaminates: I: A Compact Flexure Beam For Compression Testing, Accepted by Comp.Sci. & Tech. 1992.
2. A. Mrse and M.R. Piggott, "Compression Properties of Unidirectional Carbon FibreLaminates: II: The Effects of Unintentional and Intentional Fibre Mislignments, Acceptedby Com. Sci. & Tech. 1992.
3. D. Loken and M.R. Piggott, "Mesostructures and the Tensile Strength of AlignedFibre Composites", to be submitted, J. Comp. Tech. Res., Aug. 1992.
4. D. Loken and M.R. Piggott, "Mesostructures and the Fatigue Endurance of AlignedFibre Composites", to be submitted, J. Comp. Tech. Res.., Aug. 1992.
ACKNOWLEDGEMENTS
The author would like to express his thanks to Lt. Col. G. Haritos for introducing him to
the concept of mesomechanics. This led to the idea of mesostructures, and the initiation of a series
of conferences on Mesostructures and Mesomechanics in Fibre Composites, starting May 17 & 18,
1993.
Ii
Ir
I

I 26
I TABLE I.DEBONDING DATA FROM PULL OUT EXPERIMENTS
Fibre Resin Cure Temp. Time (h) Debonding Stress (MPa) Work of(°C) Maximum Mean** Fracture (Jm"2 )
I ASl* 815 100 0.5 76 56±71 38AS1* 815 180 0.5 83 61± 11 45AS1* 815 60 4 72 59 ± 11 42AS1* 815 180 4 100 73 ± 18 64
S HMU 828 135 22 8 2.9 ± 1.3HMU÷ 828 135 22 2.3 1.7 ± 0.3
S ASI 828 135 22 146 100± 19 120AS2 828 135 22 139 84 ± 24 85AS4 828 135 22 119 88 ± 11 93AS4 LDPE 28 12 ± 5 16Glass LDPE 29 13 ± 4 18Glass* LDPE 13 12 ± 1 16Glass Nylon 12 49 18 ± 10 10AS4* PEEK - 116 90± 30 73AS4 PEEK - 175 85 ± 20 66
* Unsized fibres + Frictional Results ** ± One standard deviation
CONSTANTS FOR THE MODULI AND STRENGTHS OF SHORTIMPERFECTLY ALIGNED FIBRE COMPOSITES
Fibre Modulus Constants Strength ConstantsLength (mm) X1 X2 X1 X2 AE X3 X4 X3 X42 AS
0.5 0.48 0.72 0.36 0.44 0.32 0.49 0.16 0.41
1.0 0.61 0.88 0.54 0.70 0.41 0.72 0.30 0.47
2.0 0.64 0.91 0.58 0.73 0.43 0.84 0.36 0.59
4.0 0.62 0.96 0.60 0.86 0.42 0.91 0.38 0.57
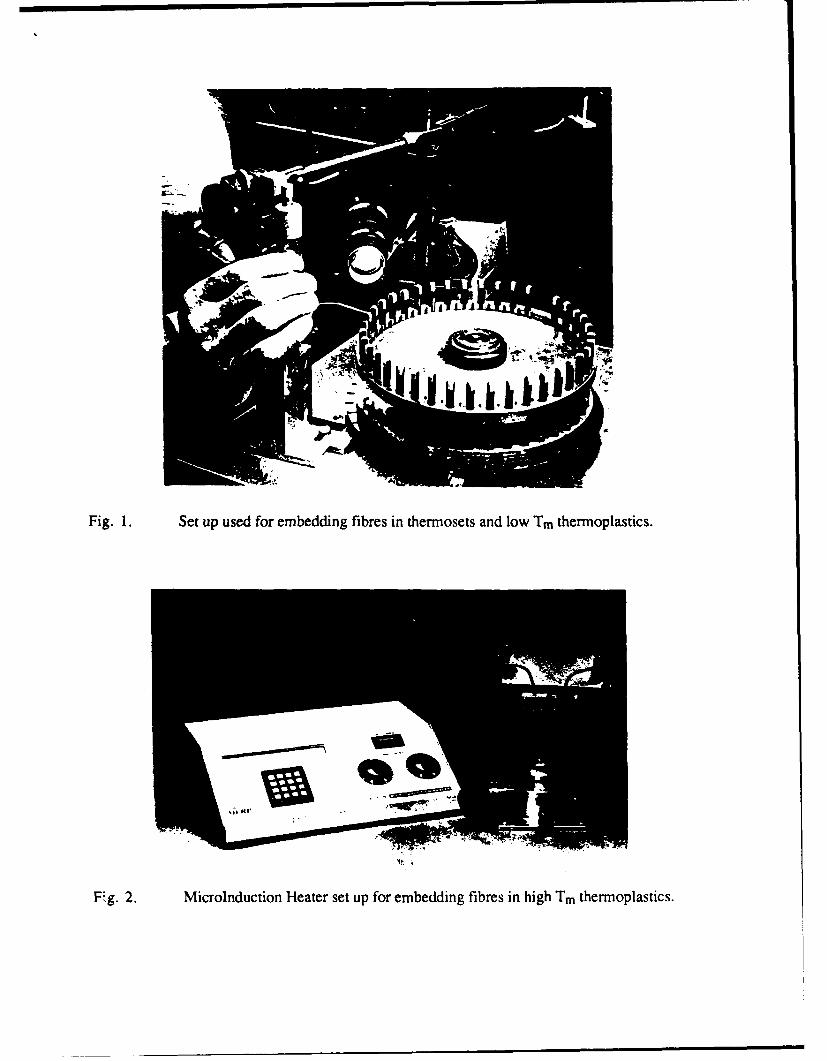
Fig. 1. Set up used for embedding fibres in thermosets and low Tm thermoplastics.
PFg. 2. MicroInduction Heater set up for embedding fibres in high Tm thermoplastics.

load cell •capsule
specimen holder f
copper sheet
grip
stand adjusting knob (front-back)
0_ adjusting knob (up-down)
Fig. 3. PuU out test set up.
0.10
OM%
z
S0.05-0 -AS4LL
0 0.1 0.2 0.3
Distance (mm)
Fig. 4. Force vs distance moved during pull out. HMU and AS4 fibres embedded inEPON 828 epoxy.

AS4/8280.3
00
U. 0
ab 0C
0 0.2
C
.0. 0 0
0
00 0.05 0.1 0.15
Embedded Length (mm)
Fig .5. Debonding force vs embedded length AS4/EPON 828, 1350C cure.
I
HMU/8280.1
0
0 0
C
.C
0 0.5 1.5
Embedded Length (mm)Fig. 6. Debonding and frictional vs embedded length HMU/EPON 828, 135 0C cure.

I0
1.5-
I
IZ
0.5
0° o.5 1 1.5
I Distance (mm)
Fig. 7. Force vs distance moved during pull out: glass in LDPE.
i 0.3
AS-4/ LDPE
zD •0.2 -
LL 30) w A
Co 0.1-
0.0 1 r.
0.0 0.5 1.0
Embedded Length (mm)
Fig. 8. Debonding force vs embedded length AS4 carbon in LDPE.

1.5-
IE-GLASS FIBRE / LDPE
1o 1.0- M"
I20
0d.00 0.5- • ,
0.0 0.5 1.0 1.5
Embedded Length (mm)
Fig. 9. Debonding force vs embedded length glass in LDPE.
1
I E-GLASS FIBRE / NYLON 12
0) 1.0
w A4w). 3K3K3
0 3K
0.0-0.0 0.5 1.0 1.5 2.0
Embedded Length (mm)
Fig. 10. Debonding force vs embedded length glass in nylon 12.

0 .2 5 . ... .. .
I-I
I0101 02 - L2 - 1 0
3.15 (-i i F)E
Z 0
01 0.15 Lo 3.25 l
II
I -- h
0)iI 0 0.010.1.
0 L T
Il r (Tlr]E E
SSIZED 0]o 0.05 UNSIZED 0
0 ' 1'. . . -' + +0 0.1 0.2 0.3
Embedded Length (rMM)Fig. 12. Debonding force vs embedded length AS4 carbon in PEEK comparing sized (AS4)
and unsized fibres.

I "Q2
zI wQLLJLn• 0.Ij••.
100 0 100
* 0.2-, ,,aw0
a 0.1-
0 100 0 100
DISPLACEMENTc fm)
i Fig. 13. Force vs distance moved during pull out: AS4 carbon in epoxy at four temperatures
03 03
E zi0 U~02 0 o002
O C3 0
0 00
00 00C005 010 0 15 0 20 025 005 0 10 0 15 0 20 025
Putted Out Length mm 0 5Pulled Out Length (mm)
003 00 0503 oo 0
- - o
00 0.00ZO01 C, .-
005 0 10 0 15 0 20 025 0 05 0 10 0 15 0 20 C 25
Putted Out Length (mm) Pulled Out Length (Mam)
Fig. 14. Debonding force ve embedded length: AS4 carbon in epoxy at four temperatures

IlI
III
Fig. 15. Typical carbon fibre after being pulled out of epoxy at 50O0.
I!
Fig. 16. Typical glass fibre being pulled out of LDPE.

I80
• 0
I . 60,,
0 20 40 60 80 100 120
I Temperature (oC)
iFig. 17. Shear strength of interphase and polymer vs temperature.
I
0 40
Fg 1gI Fig. 17. Schemarisdrewngh of itrhae machnesd polmr vsbtemperaturet.
I
I

I
1 50iO In-planeI C Out-of-plane
|40I =
030-
|20
I 0S '.10-
1 0-90 -60 -30 0 30 60 90I Angle (degree)
I Fig. 19. Fibre angle distribution for 2 mm fibres.
1 0.3
2mm
1 mmC M
I • 0.2 0 0.5mm
I 4
> ;h 0.1
I0.0
-90 -60 -30 0 30 60 90
I Angle (degree)
I Fig. 20. In plane angular distributions for fibres in composites.

I
IU
I 00 100
75 " 75
S50 50C3 0.5m M I 2mm
2. 0 . .. .d 0 -m-dfr~ ~ ~d~ o~ p2 5 , 0 in rr oc tumr d %sm p l"
0 oi.0 0.2 0.4 0.6 0.8 1.0 0 1 2
Length tram) Length (mram
I
0 n fr.turvd 0m0-
nim 5 mmS75- 75 /
05
o C
S "" '- 25 •
Sl2 2 3 0 3 2 3 4Length (nim) Length (111111)
I
Fig. 21 Fibre lengths measured as received and after extraction from composites, forI- nominal fibre lengths of 0.5, 1.0, 2.0 and 5.0 mm.
I
:1

80o- 0.5MM
3., 1.0.mmU 2.0 mm
60
M
o 40 "N,
I 20
Em
00 20 40
Fibre Volume Fraction (%)
Fig. 22. Young's moduli of carbon fibre reinforced epoxy. Nominal fibre lengths 0.5, 1.0,2.0 and 4.0 mm as indicated.
I
808 0.5 mm31.0 mmU 2.0 mm
~. 60 - 4-6 mm
Iz"o 40
I 20
0 0
0 20 40Fibre Volume Fraction (%)
Fig. 23. Flexural moduli of carbon fibre reinforced epoxy. Nominal fibre lengths 0.5, 1.0,2.0 and 4.0 mm as indicated.

I
I 8 * 0.5 mm3
6 1.0 mm8 2.0 mm
•,• 600 .-.m
3 400 L /
200
00 20 40
3 Fibre Volume Fraction (%)
Fig. 24. Tensile strengths of carbon fibre reinforced epoxy. Nominal fibre lengths 0.5, 1.0,2.0 and 4.0 mm as indicated.
I1000
* 0.5 mm
- 1.0 mmS42.0mm
C 600
400/
200 7 -L , ... - -
0 20 40Fibre Volume Fraction (%)
Fig. 25. Flexural strengths of carbon fibre reinforced epoxy. Nominal fibre lengths 0.5,1.0, 2.0 and 4.0 mm as indicated.
I'

80
60
S40
6*-C 20
0 .. ... .0 1 2 3 4
Strain (%)
Fig. 26. Stress strain curve for epoxy resin matrix.
E fu
1.5S• 0.5 MM
S• 2.0 MM
A 4.11 MM0.0 ,i
0 20 40Fibre Volume Fraction
Fig. 27. Breaking strains of fibre composites
.1

NII
i~ci
JcjjS2 1 .
: - ,
Li -it
00mc-

1.0U (Shangid
0.8 0 Ku
0.6
0.4
0.2
0.0t.0 0.2 0.4 0.6 0.8 1.0
xlX 2
Fig. 29. Modulus reduction factor for short fibre composites, comparing previous work[8,91 and this work [Ko].
1.0
0.8-
0.6
AsA0.4
0.2- A
A0 K
A A-0.0 ,,
1J.0 0.2 0.4 0.6 0.8 1.0
X3 Y-4
Fig. 30. Strength reduction factor for short fibre composites, comparing previous work[8,9] and this work [Ko].
Ir E
0
LA.L
IJJk
N
EEE EFEE C E
L 0-0--- 2
I I
%,' uoir, 6ui1oaj8 altsodwoD


![A Review on Natural Fibre Reinforced Polymer Composites · natural fibre reinforced polymer composites increase with increasing fibre loading. Khoathane et al. [1] found that the](https://img.pdfslide.us/doc/110x75/5e21837fc2d50e18910e61ca/a-review-on-natural-fibre-reinforced-polymer-composites-natural-fibre-reinforced.jpg)