Embed Size (px)
Citation preview
Mesa College High School to College Pipeline Summary Report
Mesa College
High School to College Pipeline
Summary Report 2014/15 - 2018/19
Prepared by: SDCCD Office of Institutional Research and Planning
December 2019

Mesa College High School to College Pipeline Summary Report
Table of Contents
Introduction .................................................................................................................................................................................. 4 Population of Interest .................................................................................................................................................................... 4 Definitions .................................................................................................................................................................................... 5 Placement: Transition to Multiple Measures .................................................................................................................................. 6 Overall Highlight of the Findings .................................................................................................................................................... 7 Focus of Analysis I: Entering the Community College Pipeline from High School Feeders ......................................................................10
Mesa College Participation Rates of High School Graduates .......................................................................................................... 10 14/15-18/19 Top 10 Capture Rates for Mesa College Feeders ....................................................................................................... 11 Participation Rates of Concurrent Students.................................................................................................................................... 12
Focus of Analysis II: College Preparedness and Placement ......................................................................................................................14 High School GPA .............................................................................................................................................................................. 15 Reading Placement .......................................................................................................................................................................... 16 Writing Placement ........................................................................................................................................................................... 17 ELAC(ESOL/ESL) Placement ..............................................................................................................................................................18 Math Placement .............................................................................................................................................................................. 19
Focus of Analysis III: Student Characteristics and Enrollments Patterns ................................................................................................20 Student Characteristics ................................................................................................................................................................... 21 Headcount ....................................................................................................................................................................................... 21 Gender ............................................................................................................................................................................................. 21 Ethnicity ........................................................................................................................................................................................... 22 First Generation ............................................................................................................................................................................... 22 Educational Goal ............................................................................................................................................................................. 23 DSPS ................................................................................................................................................................................................. 23 Units Attempted/Earned ................................................................................................................................................................. 24 Persistence ...................................................................................................................................................................................... 25
SDCCD Office of Institutional Research and Planning 2
Mesa College High School to College Pipeline Summary Report
Focus of Analysis IV: Student Outcomes ..................................................................................................................................................26 English Retention and Success Rates .............................................................................................................................................. 27 Math Retention and Success Rates ................................................................................................................................................. 28 Completion of transfer-level Math and English in first year by students who attended high school in Mesa service area .......... 30
Appendices ................................................................................................................................................................................................ 31
SDCCD Office of Institutional Research and Planning 3
Mesa College High School to College Pipeline Summary Report
Introduction The annual High School to College Pipeline Report provides a longitudinal overview of incoming first-time to college high school graduates. The report is part of a larger initiative to provide the colleges and the District with information for integrating plans and strategies that support student completion and enrollment management. The report is intended to inform college and District decision-making, instructional and services planning, outreach, and marketing.
The High School to College Pipeline Report series comprises four reports: 1) All Colleges, 2) City College/ECC, 3) Mesa College, and 4) Miramar College. Each report contains four sections that focus on enrollment patterns and placement as high school graduates enter college for the first-time. The first section (Focus of Analysis I) focuses on students' entry into an SDCCD college, and is reported as high school-to-college graduate participation and concurrent student participation rates. Student high school GPA, reading, writing, ELAC (ESOL/ESL), and Math placements are detailed in the second section (Focus of Analysis II); student characteristics and college enrollment patterns are detailed in the third section (Focus of Analysis III); and finally, English and Math success rates are detailed in the fourth section (Focus of Analysis IV). In most instances, benchmark information is provided as a point of comparison, such as three-year or five-year averages and/or percentage change.
Population of Interest First-time to college high school graduates are students who reported completion from a high school prior to enrolling at an SDCCD college for the first-time. Specifically, unless otherwise noted, this population comprises the following parameters:
First-time to college students are defined as any first-time student who enrolled at an SDCCD college.Excluded from this definition are students concurrently enrolled in a four-year university, degree holders, andstudents currently enrolled in high school. Additionally, for this study, students attending adult school areexcluded.
High school graduates are defined in this study as having received a certification of California high schoolproficiency, a G.E.D./high school certificate, or a high school diploma (including a foreign high school diploma).
Students enrolled at an SDCCD college either in the year following high school completion or within four yearsof high school completion.
SDCCD Office of Institutional Research and Planning 4
Mesa College High School to College Pipeline Summary Report
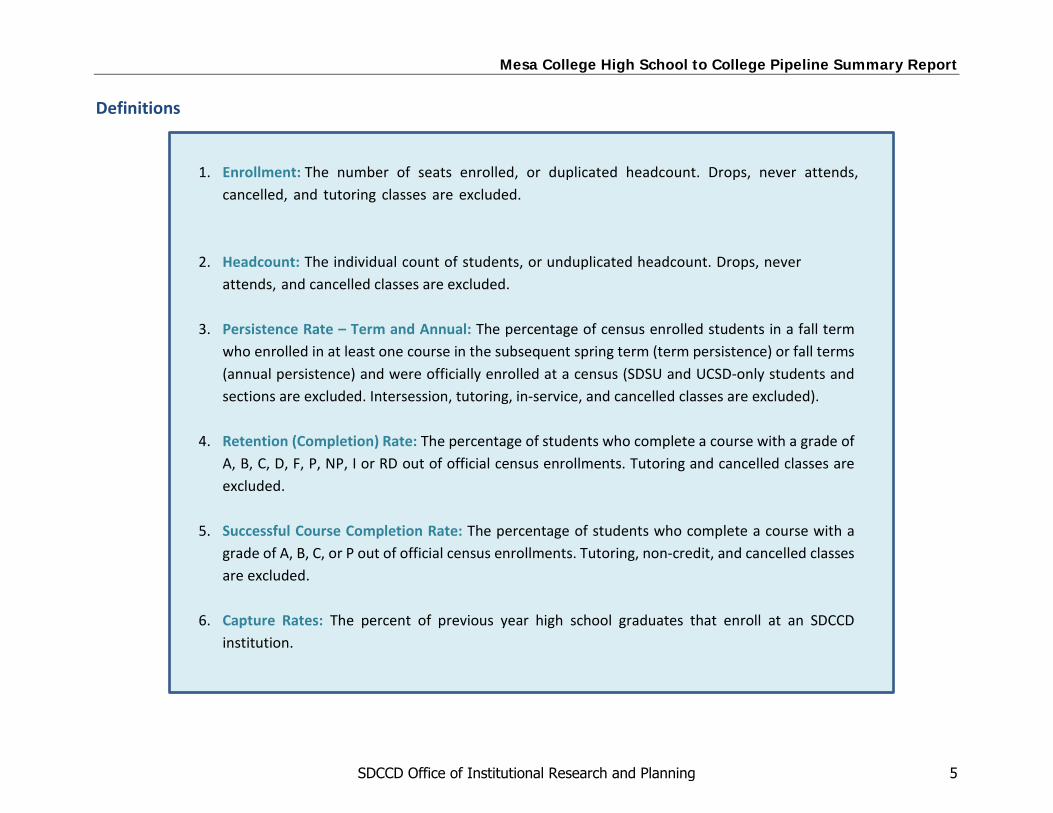
Definitions
1. Enrollment: The number of seats enrolled, or duplicated headcount. Drops, never attends, cancelled, and tutoring classes are excluded.
2. Headcount: The individual count of students, or unduplicated headcount. Drops, never attends, and cancelled classes are excluded.
3. Persistence Rate – Term and Annual: The percentage of census enrolled students in a fall termwho enrolled in at least one course in the subsequent spring term (term persistence) or fall terms(annual persistence) and were officially enrolled at a census (SDSU and UCSD-only students andsections are excluded. Intersession, tutoring, in-service, and cancelled classes are excluded).
4. Retention (Completion) Rate: The percentage of students who complete a course with a grade ofA, B, C, D, F, P, NP, I or RD out of official census enrollments. Tutoring and cancelled classes areexcluded.
5. Successful Course Completion Rate: The percentage of students who complete a course with agrade of A, B, C, or P out of official census enrollments. Tutoring, non-credit, and cancelled classesare excluded.
6. Capture Rates: The percent of previous year high school graduates that enroll at an SDCCDinstitution.
SDCCD Office of Institutional Research and Planning 5
Mesa College High School to College Pipeline Summary Report
Placement: Transition to Multiple Measures
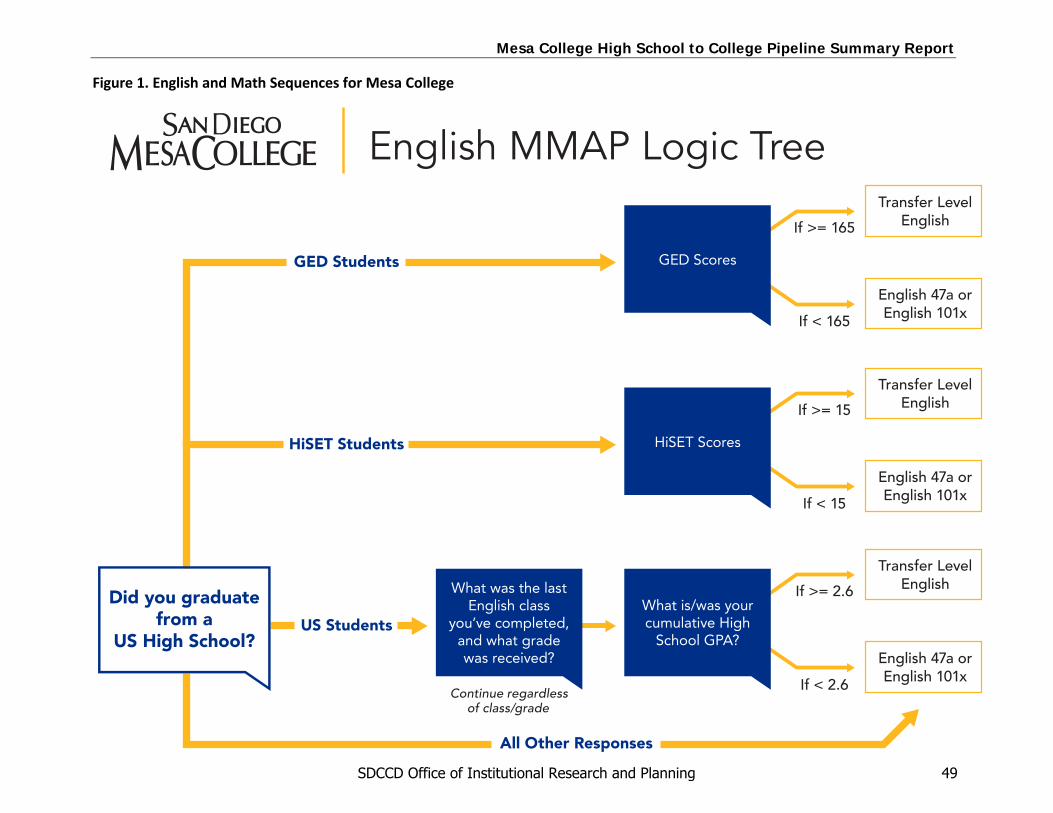
In October 2017, Assembly Bill (AB) 705 was signed to take effect on January 1, 2018. AB 705 requires California Community Colleges to maximize the probability that students will enter and complete transfer-level coursework in Mathematics and English within one year of beginning their program of study. English as a second language students have a three-year period to complete transfer-level Mathematics and English in their programs of study. Although colleges are prohibited from compelling a student to take a pre-requisite course unless they are highly unlikely to succeed, AB 705 enhances the use of multiple measures assessment for course placement. This puts an emphasis on using prior history, such as high school GPA, as a placement measure. The intent of the law, along with the foundational research behind the legislation, puts a focus on improving throughput of students through transfer-level Mathematics and English sequences, which tend to work as gatekeepers to program and transfer completion. Colleges were given until Fall 2019 to implement their new placement measures and to become AB 705 compliant. Each SDCCD college developed placement rules based on high school GPA for students with GPAs within 10 years, with Placement Assistant options for all students. Curricula were developed to offer support for students with cumulative high school GPAs lower than 2.6. Mesa College fully implemented Multiple Measures placement in Fall of 2018. Outcomes for these students will be presented as part of an upcoming AB705 report. Figure 1 in the Appendix illustrates the placement sequence for English and Math.
SDCCD Office of Institutional Research and Planning 6
Mesa College High School to College Pipeline Summary Report
Overall Highlight of the Findings
Participation Rates In 2018/19, 20% of the 2017/18 SDCCD high school
feeder graduates and 4% of the 2017/18 non-SDCCD high school feeder graduates entered Mesa College in the year following high school completion. These are in line with the five-year averages of 19% and 5%, respectively.
Concurrent high school seniors, who were both enrolled at Mesa college and attended a District feeder high school in 2017/18, continued their SDCCD enrollment at Mesa College the following year as college-only students at a rate of 20%, higher than the five-year average of 16% for all first-time to SDCCD high school graduates. Students have been re-enrolling at Mesa over the past two years at nearly double the rate they were prior to 2017/18.
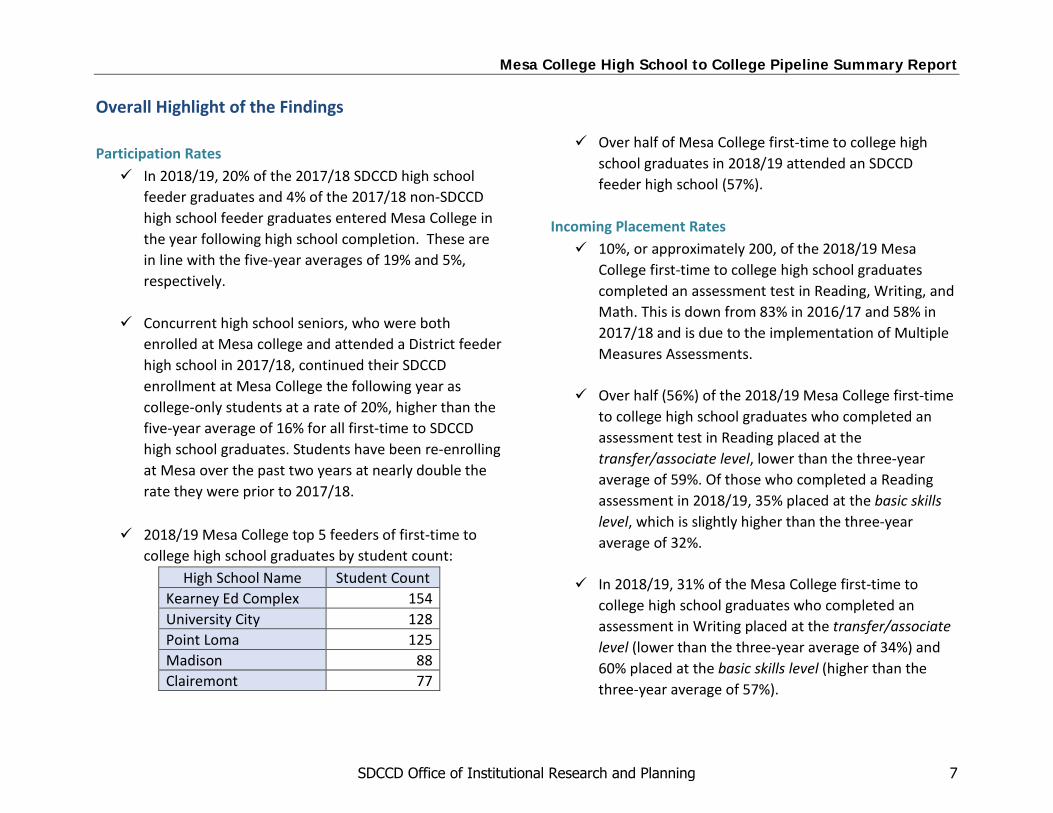
2018/19 Mesa College top 5 feeders of first-time to college high school graduates by student count:
High School Name Student Count Kearney Ed Complex 154 University City 128 Point Loma 125 Madison 88 Clairemont 77
Over half of Mesa College first-time to college high school graduates in 2018/19 attended an SDCCD feeder high school (57%).
Incoming Placement Rates 10%, or approximately 200, of the 2018/19 Mesa
College first-time to college high school graduates completed an assessment test in Reading, Writing, and Math. This is down from 83% in 2016/17 and 58% in 2017/18 and is due to the implementation of Multiple Measures Assessments.
Over half (56%) of the 2018/19 Mesa College first-time to college high school graduates who completed an assessment test in Reading placed at the transfer/associate level, lower than the three-year average of 59%. Of those who completed a Reading assessment in 2018/19, 35% placed at the basic skills level, which is slightly higher than the three-year average of 32%.
In 2018/19, 31% of the Mesa College first-time to
college high school graduates who completed an assessment in Writing placed at the transfer/associate level (lower than the three-year average of 34%) and 60% placed at the basic skills level (higher than the three-year average of 57%).
SDCCD Office of Institutional Research and Planning 7
Mesa College High School to College Pipeline Summary Report
37% percent of the 2018/19 Mesa College first-time to college high school graduates who completed an assessment test in Math placed at the transfer/associate level (lower than the three-year average of 46%) and 62% placed at the basic skills level (higher than the three-year average of 54%).
Access/Profiles Demographics of 2018/19 Mesa College first-time to
college high school graduates as compared to the five-year average: 51% Male (51%, five-year average) 48% Latinx and 25% White (45% and 26%, five-
year averages, respectively) 28% first generation (27%, five-year average) 6% DSPS (5%, five-year average)
There was an increase in self-reported incoming high
school GPA as compared to previous years. 50% of students in 2018/19 reported a GPA
over 3.0 as compared to a 46% average over the past five years, while 49% of students reported an incoming high school GPA of between 2.0 and 3.0 as compared to the 53% for the five-year average.
Outcomes 51% of Mesa College first-time to college high school
graduates who were enrolled in school full time (12+ units) in 2018/19 successfully completed 12 or more of those units, lower than the five-year Mesa College average of 56%.
74% of Fall 2017 Mesa College first-time to college high school graduates persisted to the next spring and 58% persisted to fall of the next academic year (term persistence was 2% lower than the five-year average of 76%, while annual persistence was equal to the average).
In 2018-19, Mesa College first-time to college high the school graduates completed English and Math courses in their first year at higher rates than the comparison group of all other students enrolled in those courses. 84% of Mesa College first-time to college high
school graduates completed their transfer-level Math courses, compared to 83% of the comparison group. In basic skills Math courses, these students completed at an 86%% rate, compared to 83% for the comparison group.
87% of Mesa College first-time to college high school graduates completed their transfer-level English courses, compared to 86% for the comparison group. In basic skills English courses, first-time to college high school graduates completed at a 90% rate, compared to 76% for the comparison group.
SDCCD Office of Institutional Research and Planning 8
Mesa College High School to College Pipeline Summary Report
In 2018-19, Mesa College first-time to college high school graduates succeeded in their English courses and basic skills Math courses in their first year at higher rates than the comparison group of all other students enrolled in those courses. The reverse was true for transfer-level Math success. o 58% of Mesa College first-time to college high
school graduates succeeded in their transfer-level Math courses, compared to 62% for the comparison group. In basic skills Math courses, first-time to college high school graduates succeeded at a 60% rate, compared to 50% for the comparison group.
o 69% of Mesa College first-time to college high
school graduates succeeded in their transfer-level English courses, compared to 67% for the comparison group. In basic skills English courses, first-time to college high school graduates succeeded at a 68% rate, compared to 52% for the comparison group.
In 2018/19, 15% of first-time to college high school graduates from Mesa College feeder high schools passed both transfer-level Math and transfer-level English in their first year, lower than the five-year average of 25% from Mesa College feeder high schools. This may be the result of the large increase in transfer-level Math and English courses being offered to students during their dually enrolled high school years.
41% of first-time college high school graduates from Mesa College feeder high schools who attempted both transfer-level Math and English in their first year succeeded at both.
SDCCD Office of Institutional Research and Planning 9
Mesa College High School to College Pipeline Summary Report
Focus of Analysis I: Entering the Community College Pipeline from High School Feeders
Mesa College Participation Rates of High School Graduates
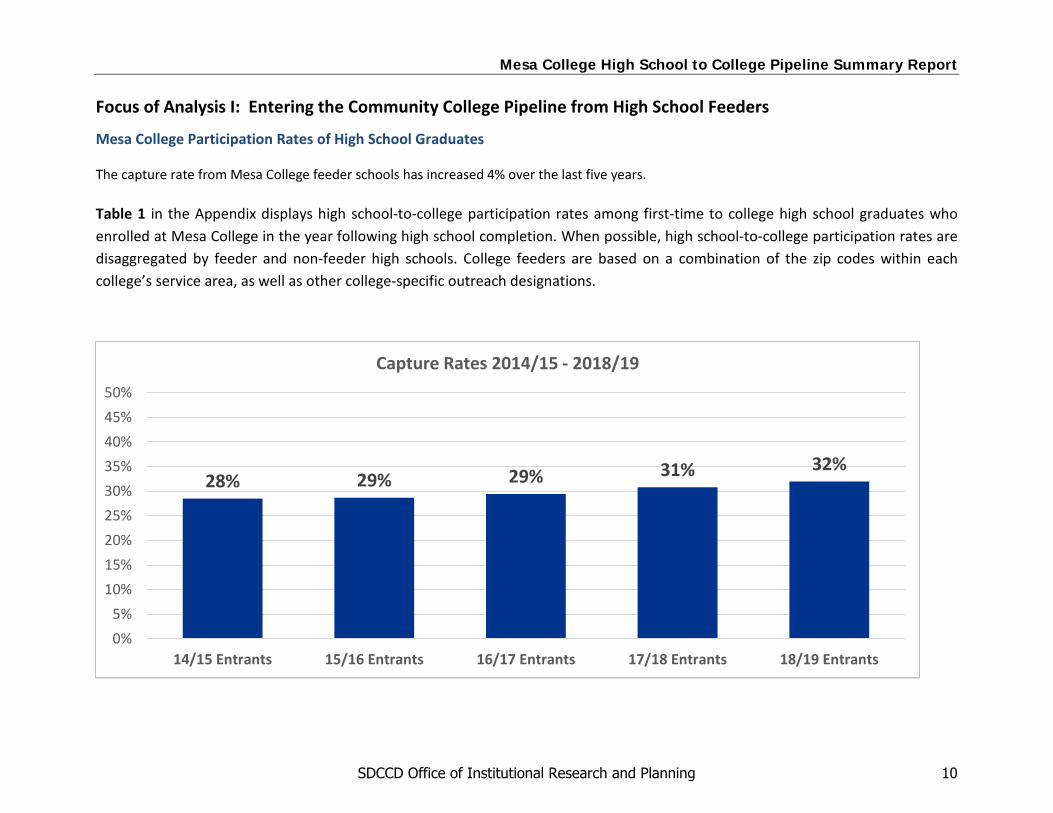
The capture rate from Mesa College feeder schools has increased 4% over the last five years.
Table 1 in the Appendix displays high school-to-college participation rates among first-time to college high school graduates who enrolled at Mesa College in the year following high school completion. When possible, high school-to-college participation rates are disaggregated by feeder and non-feeder high schools. College feeders are based on a combination of the zip codes within each college’s service area, as well as other college-specific outreach designations.
28% 29% 29% 31% 32%
0%5%
10%15%20%25%30%35%40%45%50%
14/15 Entrants 15/16 Entrants 16/17 Entrants 17/18 Entrants 18/19 Entrants
Capture Rates 2014/15 - 2018/19
SDCCD Office of Institutional Research and Planning 10
Mesa College High School to College Pipeline Summary Report
14/15-18/19 Top 10 Capture Rates for Mesa College Feeders
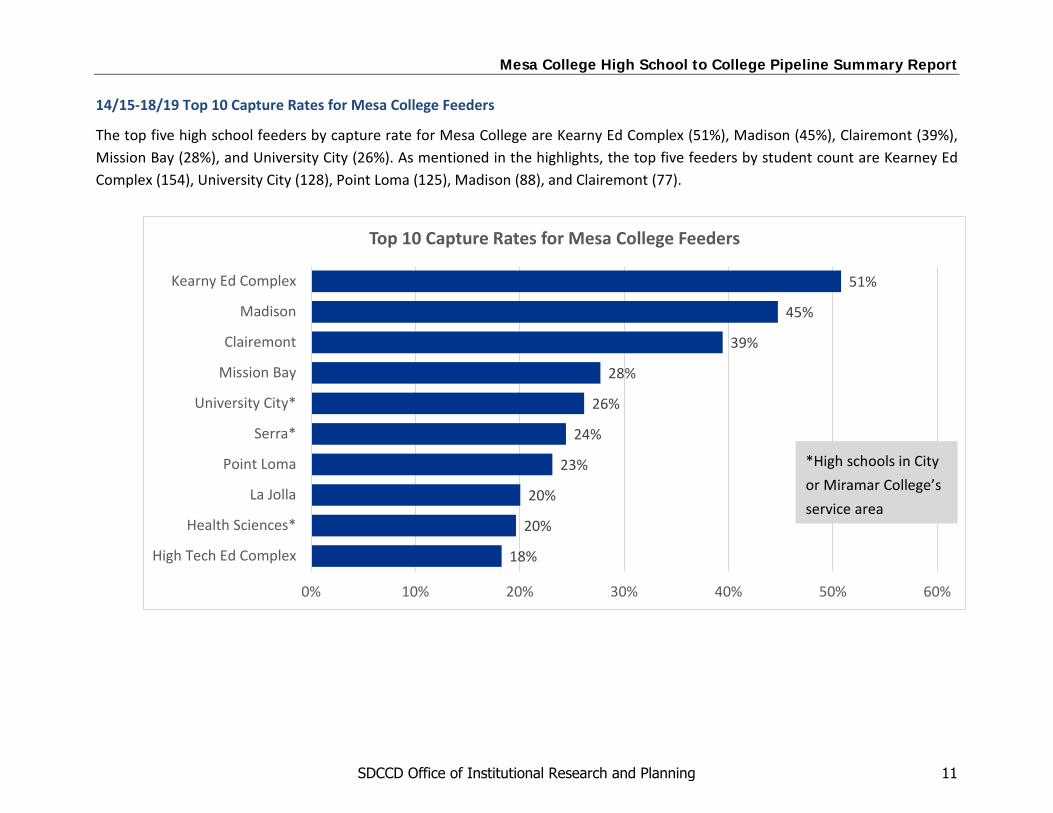
The top five high school feeders by capture rate for Mesa College are Kearny Ed Complex (51%), Madison (45%), Clairemont (39%), Mission Bay (28%), and University City (26%). As mentioned in the highlights, the top five feeders by student count are Kearney Ed Complex (154), University City (128), Point Loma (125), Madison (88), and Clairemont (77).
18%
20%
20%
23%
24%
26%
28%
39%
45%
51%
0% 10% 20% 30% 40% 50% 60%
High Tech Ed Complex
Health Sciences*
La Jolla
Point Loma
Serra*
University City*
Mission Bay
Clairemont
Madison
Kearny Ed Complex
Top 10 Capture Rates for Mesa College Feeders
*High schools in Cityor Miramar College’s service area
SDCCD Office of Institutional Research and Planning 11
Mesa College High School to College Pipeline Summary Report
Participation Rates of Concurrent Students
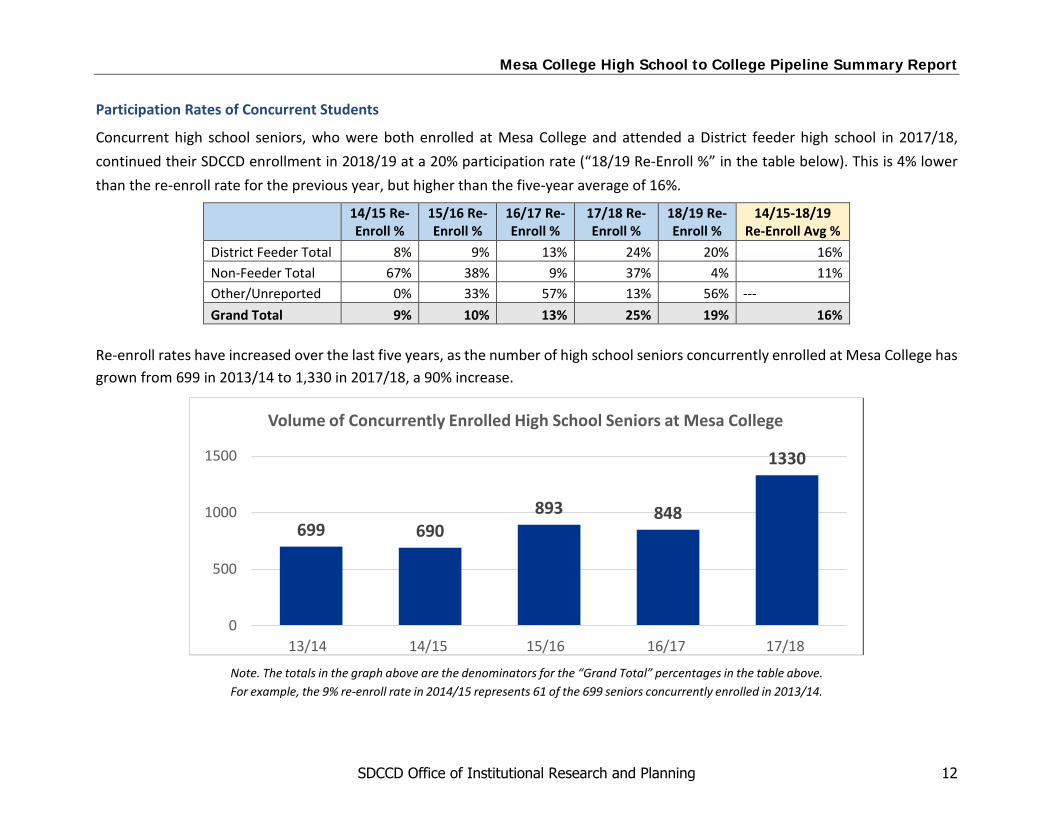
Concurrent high school seniors, who were both enrolled at Mesa College and attended a District feeder high school in 2017/18, continued their SDCCD enrollment in 2018/19 at a 20% participation rate (“18/19 Re-Enroll %” in the table below). This is 4% lower than the re-enroll rate for the previous year, but higher than the five-year average of 16%.
14/15 Re-Enroll %
15/16 Re-Enroll %
16/17 Re-Enroll %
17/18 Re-Enroll %
18/19 Re-Enroll %
14/15-18/19 Re-Enroll Avg %
District Feeder Total 8% 9% 13% 24% 20% 16% Non-Feeder Total 67% 38% 9% 37% 4% 11% Other/Unreported 0% 33% 57% 13% 56% --- Grand Total 9% 10% 13% 25% 19% 16%
Re-enroll rates have increased over the last five years, as the number of high school seniors concurrently enrolled at Mesa College has grown from 699 in 2013/14 to 1,330 in 2017/18, a 90% increase.
699 690893 848
1330
0
500
1000
1500
13/14 14/15 15/16 16/17 17/18
Volume of Concurrently Enrolled High School Seniors at Mesa College
Note. The totals in the graph above are the denominators for the “Grand Total” percentages in the table above. For example, the 9% re-enroll rate in 2014/15 represents 61 of the 699 seniors concurrently enrolled in 2013/14.
SDCCD Office of Institutional Research and Planning 12
Mesa College High School to College Pipeline Summary Report
Table 2 in the Appendix displays the percentage of Mesa College concurrently enrolled high school seniors who enrolled at an SDCCD college in the year following graduation from high school. Results are disaggregated by feeder high schools and provide aggregate totals/averages for non-feeder high school students as a point of comparison.
SDCCD Office of Institutional Research and Planning 13
Mesa College High School to College Pipeline Summary Report
Focus of Analysis II: College Preparedness and Placement
This section of the report looks at high school GPA and the placement levels of first-time to college high school graduates who applied to an SDCCD college within four years of high school completion. It is possible that a student can apply and take the placement test, but not register for classes. The placement information, therefore, may differ from enrollment information. Note that the English and Math placement sequences may change from year to year; therefore, data are represented by current placement level categories (see Figure 1 in the Course Sequences section). Additionally, students are categorized as ‘tested’ or ‘not tested’ based on the following parameters:
Total Tested – This group includes students who completed an assessment test or submitted their scores froma standardized test (e.g., SAT, ACT, EAP, EPT, and ELM).
Not Tested – This group includes students who did not complete an assessment test or were placed throughthe MMAP placement assistant. Additionally, this group includes students who received a placement levelfrom degree completion, transfer work, or course completion.
SDCCD Office of Institutional Research and Planning 14
Mesa College High School to College Pipeline Summary Report
High School GPA
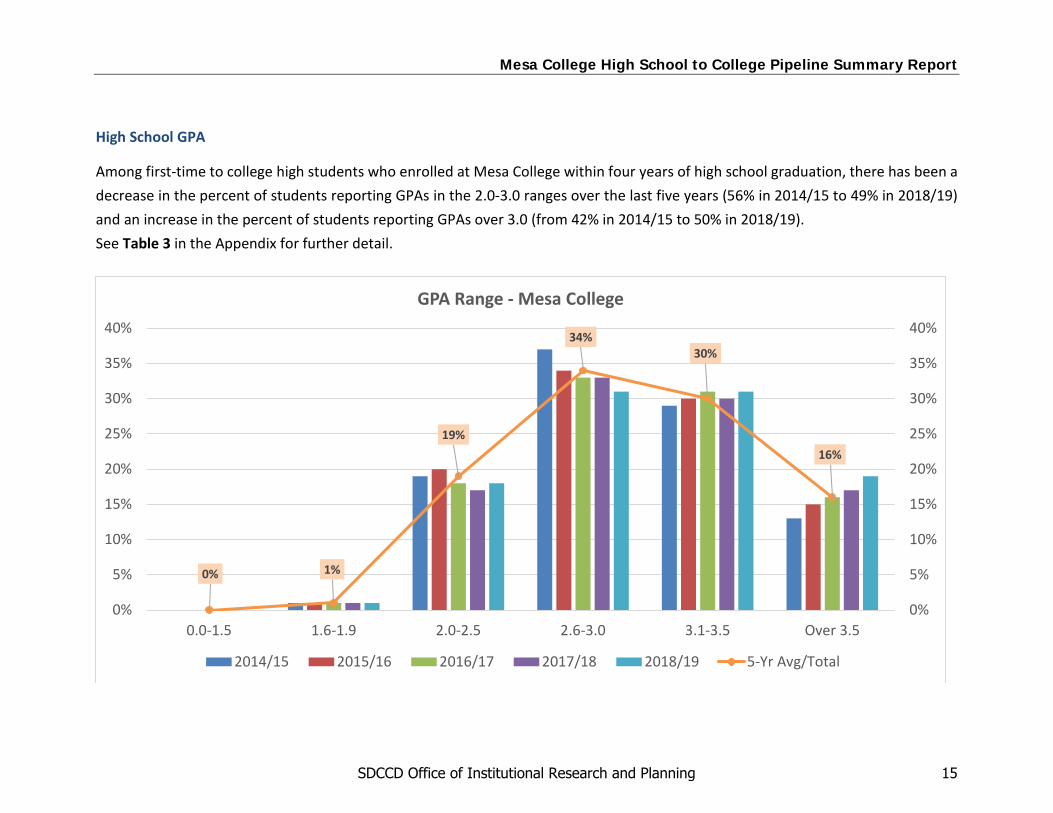
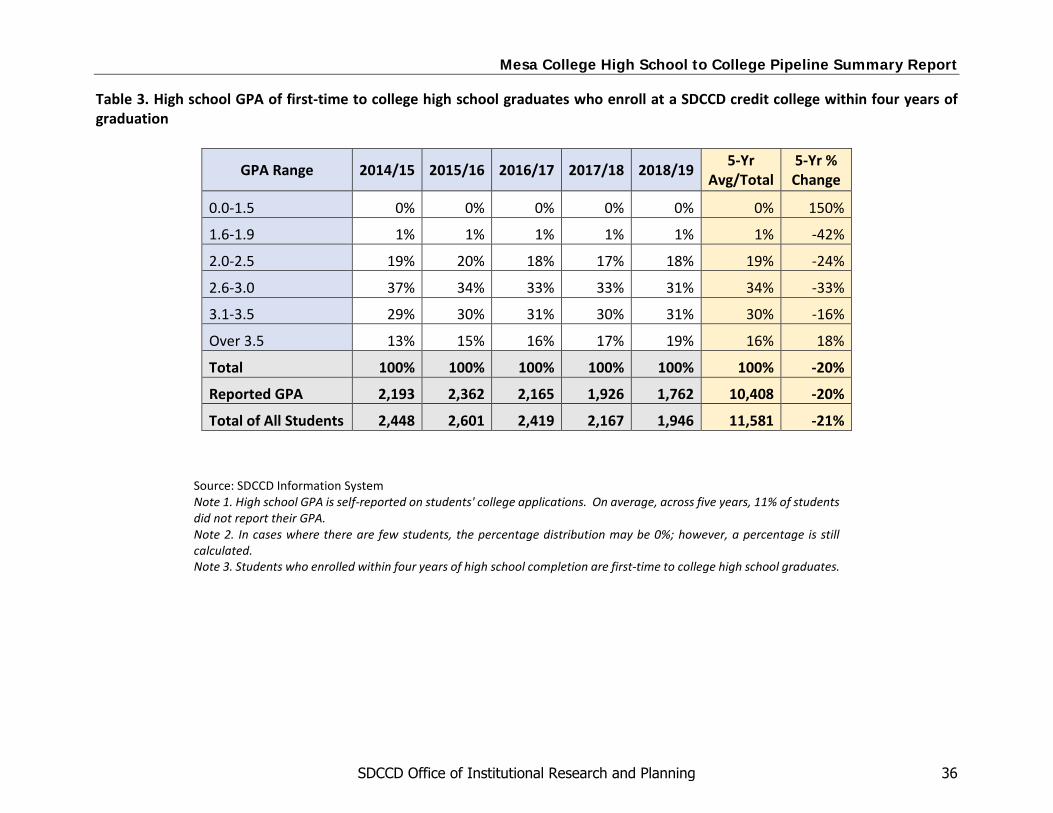
Among first-time to college high students who enrolled at Mesa College within four years of high school graduation, there has been a decrease in the percent of students reporting GPAs in the 2.0-3.0 ranges over the last five years (56% in 2014/15 to 49% in 2018/19) and an increase in the percent of students reporting GPAs over 3.0 (from 42% in 2014/15 to 50% in 2018/19). See Table 3 in the Appendix for further detail.
0% 1%
19%
34%30%
16%
0%
5%
10%
15%
20%
25%
30%
35%
40%
0%
5%
10%
15%
20%
25%
30%
35%
40%
0.0-1.5 1.6-1.9 2.0-2.5 2.6-3.0 3.1-3.5 Over 3.5
GPA Range - Mesa College
2014/15 2015/16 2016/17 2017/18 2018/19 5-Yr Avg/Total
SDCCD Office of Institutional Research and Planning 15
Mesa College High School to College Pipeline Summary Report
Reading Placement
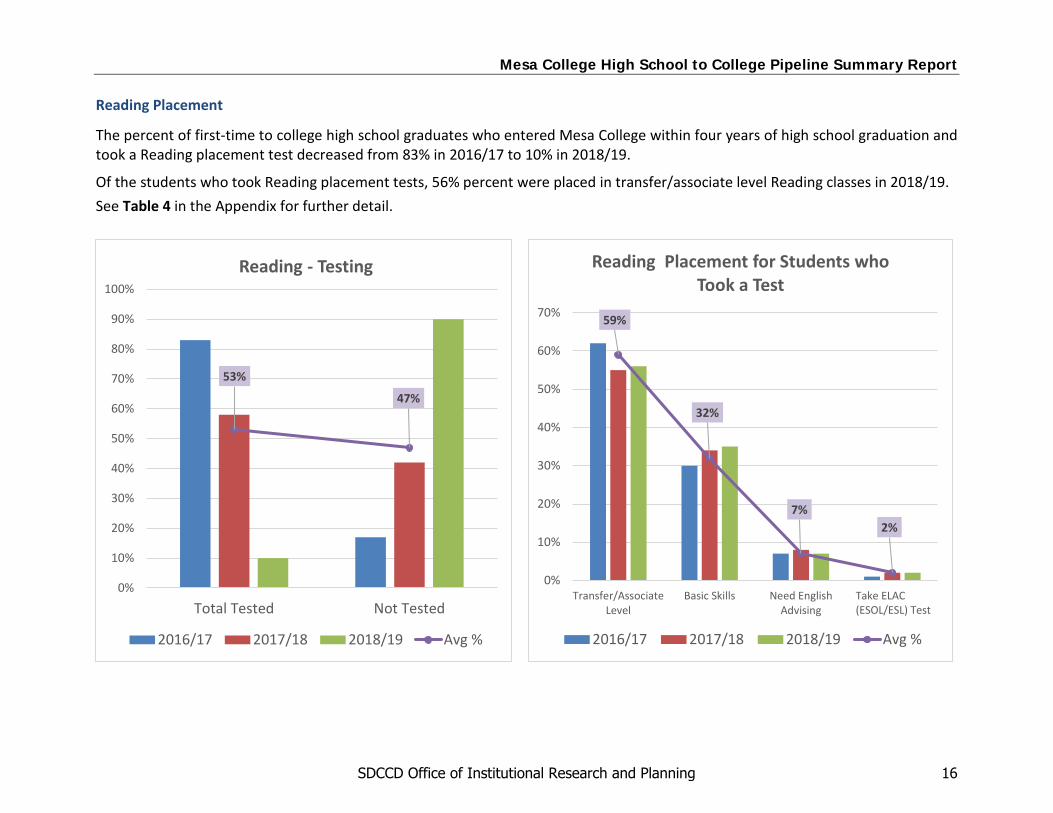
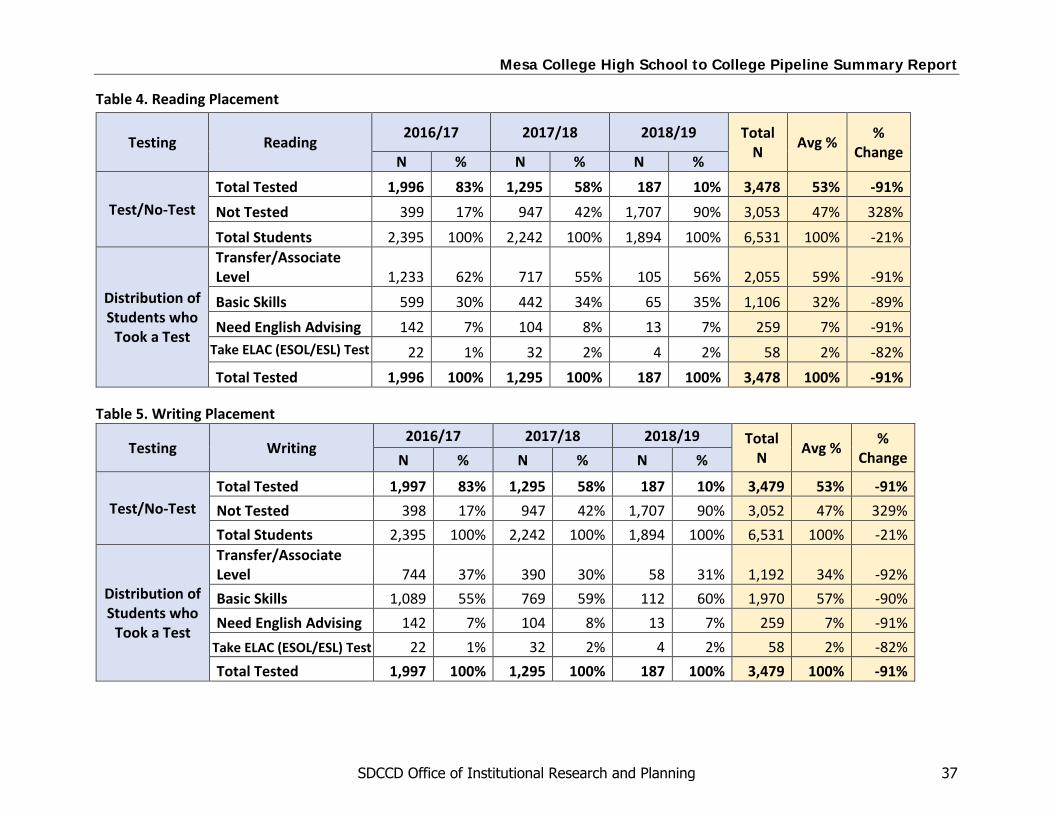
The percent of first-time to college high school graduates who entered Mesa College within four years of high school graduation and took a Reading placement test decreased from 83% in 2016/17 to 10% in 2018/19.
Of the students who took Reading placement tests, 56% percent were placed in transfer/associate level Reading classes in 2018/19. See Table 4 in the Appendix for further detail.
53%
47%
0%
10%
20%
30%
40%
50%
60%
70%
80%
90%
100%
Total Tested Not Tested
Reading - Testing
2016/17 2017/18 2018/19 Avg %
59%
32%
7%2%
0%
10%
20%
30%
40%
50%
60%
70%
Transfer/AssociateLevel
Basic Skills Need EnglishAdvising
Take ELAC (ESOL/ESL) Test
Reading Placement for Students who Took a Test
2016/17 2017/18 2018/19 Avg %
SDCCD Office of Institutional Research and Planning 16
Mesa College High School to College Pipeline Summary Report
Writing Placement
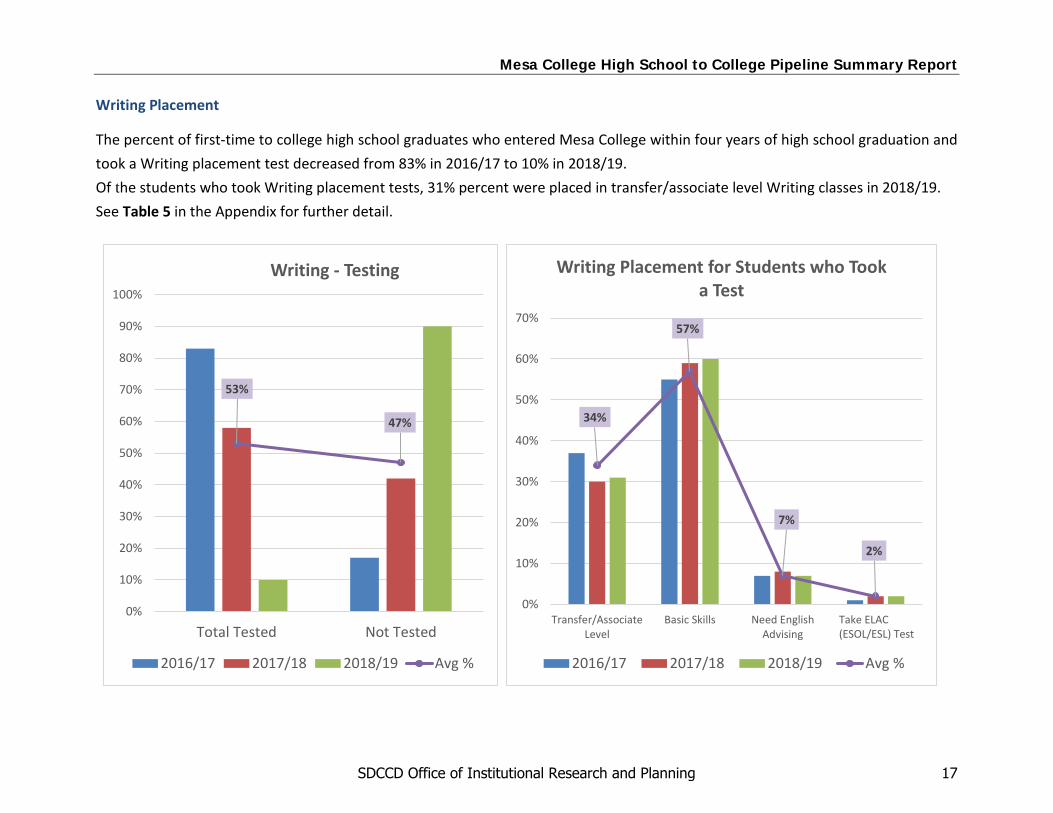
The percent of first-time to college high school graduates who entered Mesa College within four years of high school graduation and took a Writing placement test decreased from 83% in 2016/17 to 10% in 2018/19. Of the students who took Writing placement tests, 31% percent were placed in transfer/associate level Writing classes in 2018/19. See Table 5 in the Appendix for further detail.
53%
47%
0%
10%
20%
30%
40%
50%
60%
70%
80%
90%
100%
Total Tested Not Tested
Writing - Testing
2016/17 2017/18 2018/19 Avg %
34%
57%
7%
2%
0%
10%
20%
30%
40%
50%
60%
70%
Transfer/AssociateLevel
Basic Skills Need EnglishAdvising
Take ELAC (ESOL/ESL) Test
Writing Placement for Students who Took a Test
2016/17 2017/18 2018/19 Avg %
SDCCD Office of Institutional Research and Planning 17
Mesa College High School to College Pipeline Summary Report
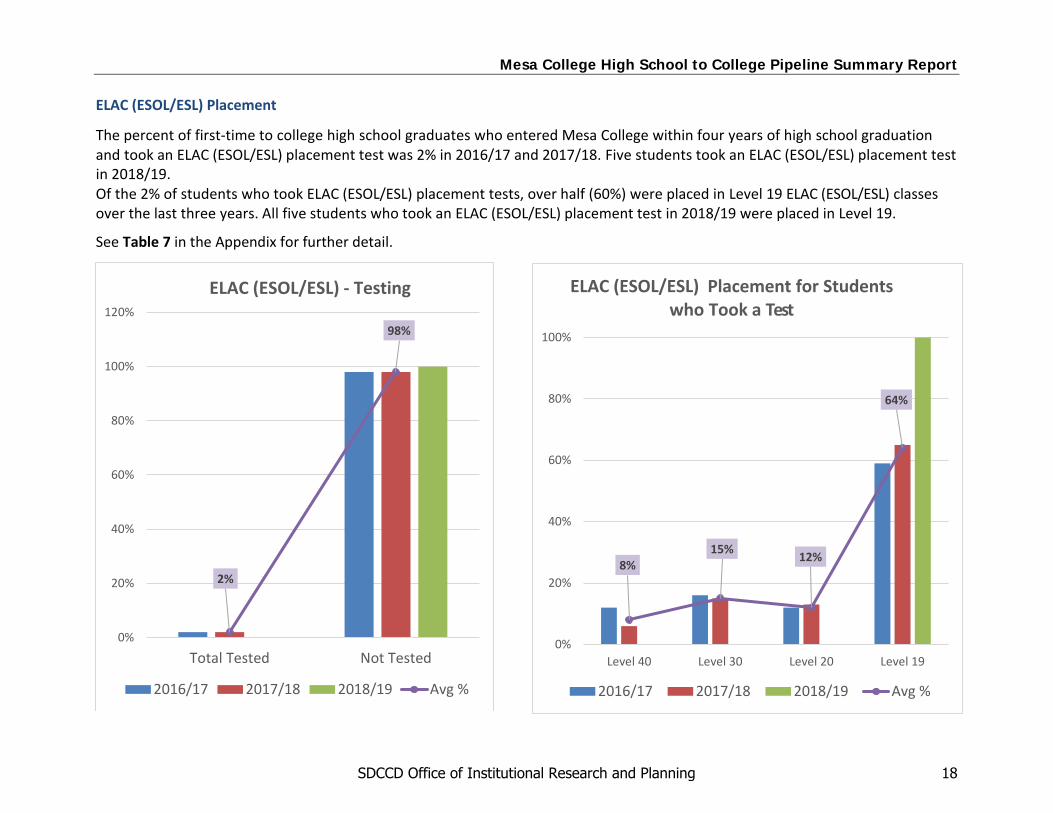
ELAC (ESOL/ESL) Placement
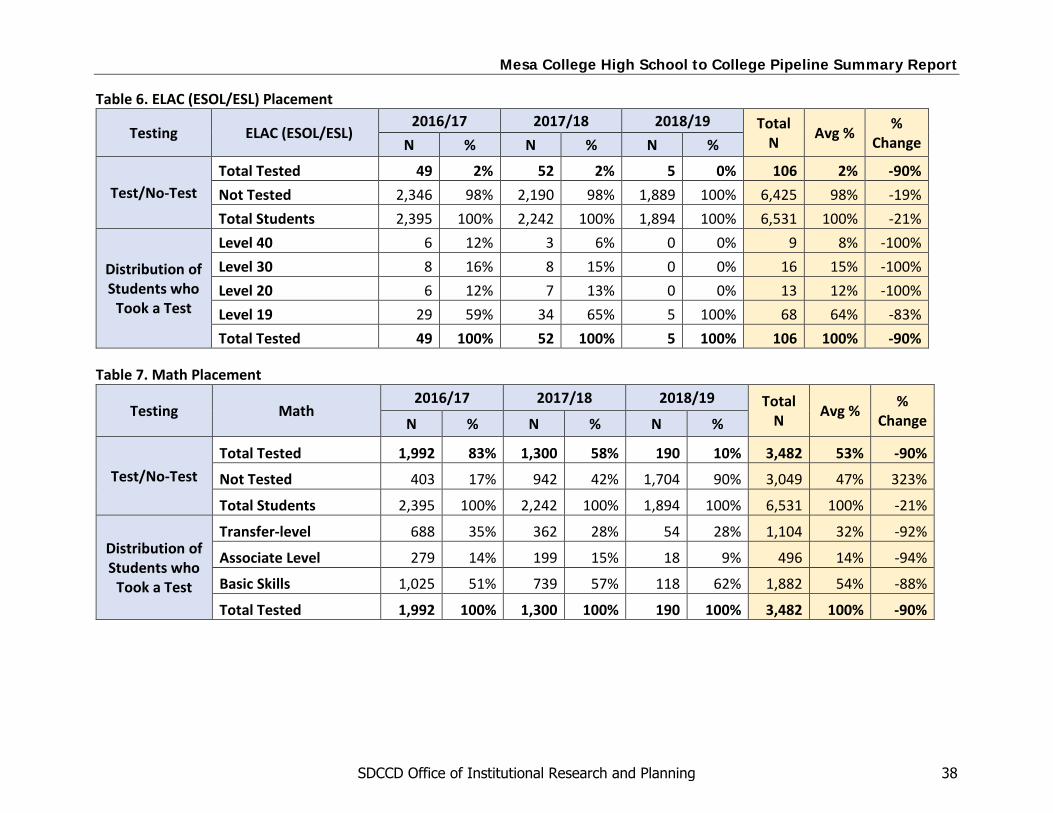
The percent of first-time to college high school graduates who entered Mesa College within four years of high school graduation and took an ELAC (ESOL/ESL) placement test was 2% in 2016/17 and 2017/18. Five students took an ELAC (ESOL/ESL) placement test in 2018/19. Of the 2% of students who took ELAC (ESOL/ESL) placement tests, over half (60%) were placed in Level 19 ELAC (ESOL/ESL) classes over the last three years. All five students who took an ELAC (ESOL/ESL) placement test in 2018/19 were placed in Level 19.
See Table 7 in the Appendix for further detail.
2%
98%
0%
20%
40%
60%
80%
100%
120%
Total Tested Not Tested
ELAC (ESOL/ESL) - Testing
2016/17 2017/18 2018/19 Avg %
8%15% 12%
64%
0%
20%
40%
60%
80%
100%
Level 40 Level 30 Level 20 Level 19
ELAC (ESOL/ESL) Placement for Students who Took a Test
2016/17 2017/18 2018/19 Avg %
SDCCD Office of Institutional Research and Planning 18
Mesa College High School to College Pipeline Summary Report
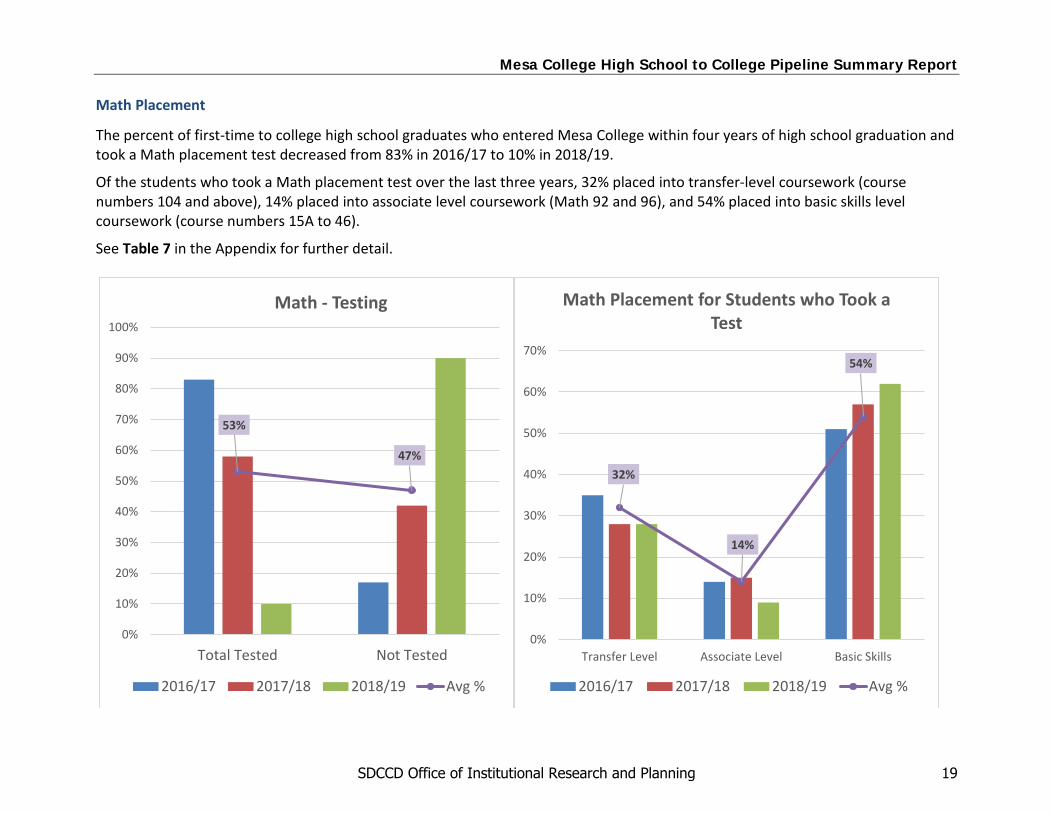
Math Placement
The percent of first-time to college high school graduates who entered Mesa College within four years of high school graduation and took a Math placement test decreased from 83% in 2016/17 to 10% in 2018/19.
Of the students who took a Math placement test over the last three years, 32% placed into transfer-level coursework (course numbers 104 and above), 14% placed into associate level coursework (Math 92 and 96), and 54% placed into basic skills level coursework (course numbers 15A to 46).
See Table 7 in the Appendix for further detail.
53%
47%
0%
10%
20%
30%
40%
50%
60%
70%
80%
90%
100%
Total Tested Not Tested
Math - Testing
2016/17 2017/18 2018/19 Avg %
32%
14%
54%
0%
10%
20%
30%
40%
50%
60%
70%
Transfer Level Associate Level Basic Skills
Math Placement for Students who Took a Test
2016/17 2017/18 2018/19 Avg %
SDCCD Office of Institutional Research and Planning 19
Mesa College High School to College Pipeline Summary Report
Focus of Analysis III: Student Characteristics and Enrollments Patterns This section describes different student characteristics and enrollment patterns among first-time to college high school graduates who enrolled at an SDCCD college within four years of high school completion. Headcount, gender, ethnicity, first generation to college, and student educational goals of the first-time to college high school graduates are measured between 2014/15 and 2018/19 (see Table 8). Note that the count of students is an unduplicated headcount. The number of units attempted (in rows) by the number of units earned (in columns) across the same five years are displayed among first-time to college high school graduates in Table 9. The longitudinal term and annual persistence of the Fall 2013 to Fall 2017 cohorts of first-time to college high school graduates are displayed in Table 10 of the Appendix.
SDCCD Office of Institutional Research and Planning 20
Mesa College High School to College Pipeline Summary Report
Student Characteristics
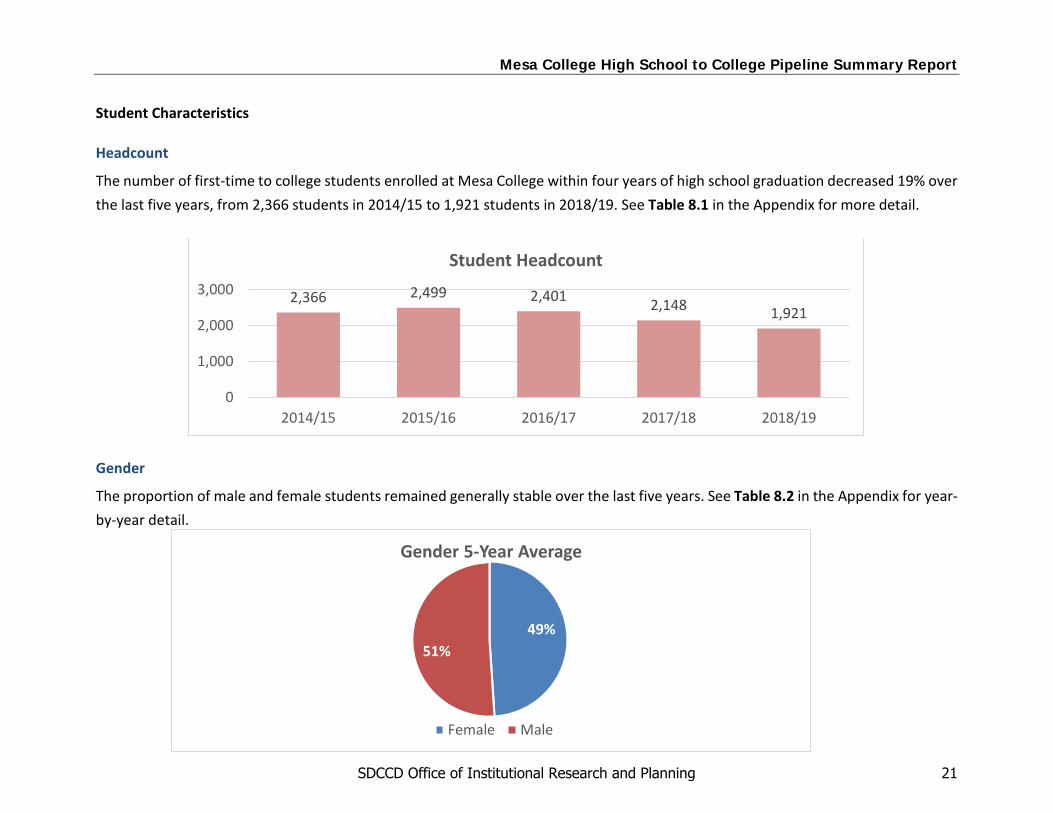
Headcount
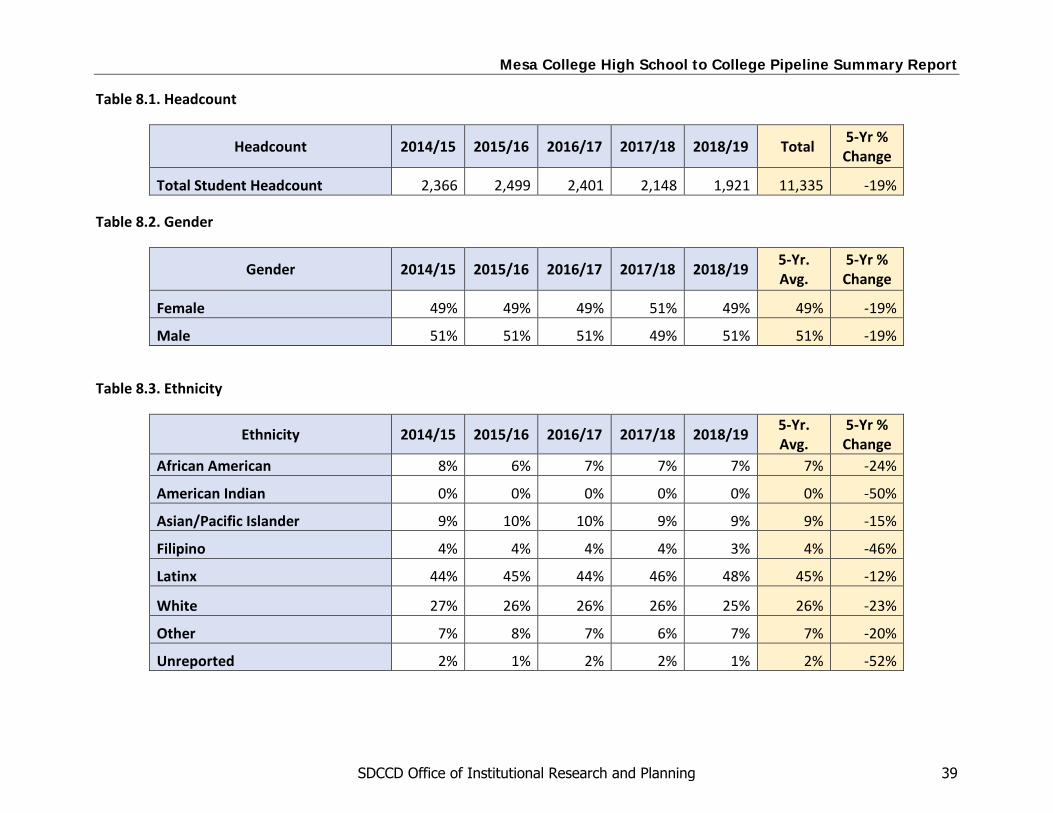
The number of first-time to college students enrolled at Mesa College within four years of high school graduation decreased 19% over the last five years, from 2,366 students in 2014/15 to 1,921 students in 2018/19. See Table 8.1 in the Appendix for more detail.
Gender
The proportion of male and female students remained generally stable over the last five years. See Table 8.2 in the Appendix for year-by-year detail.
2,366 2,499 2,401 2,148 1,921
0
1,000
2,000
3,000
2014/15 2015/16 2016/17 2017/18 2018/19
Student Headcount
49%51%
Gender 5-Year Average
Female Male
SDCCD Office of Institutional Research and Planning 21
Mesa College High School to College Pipeline Summary Report
Ethnicity
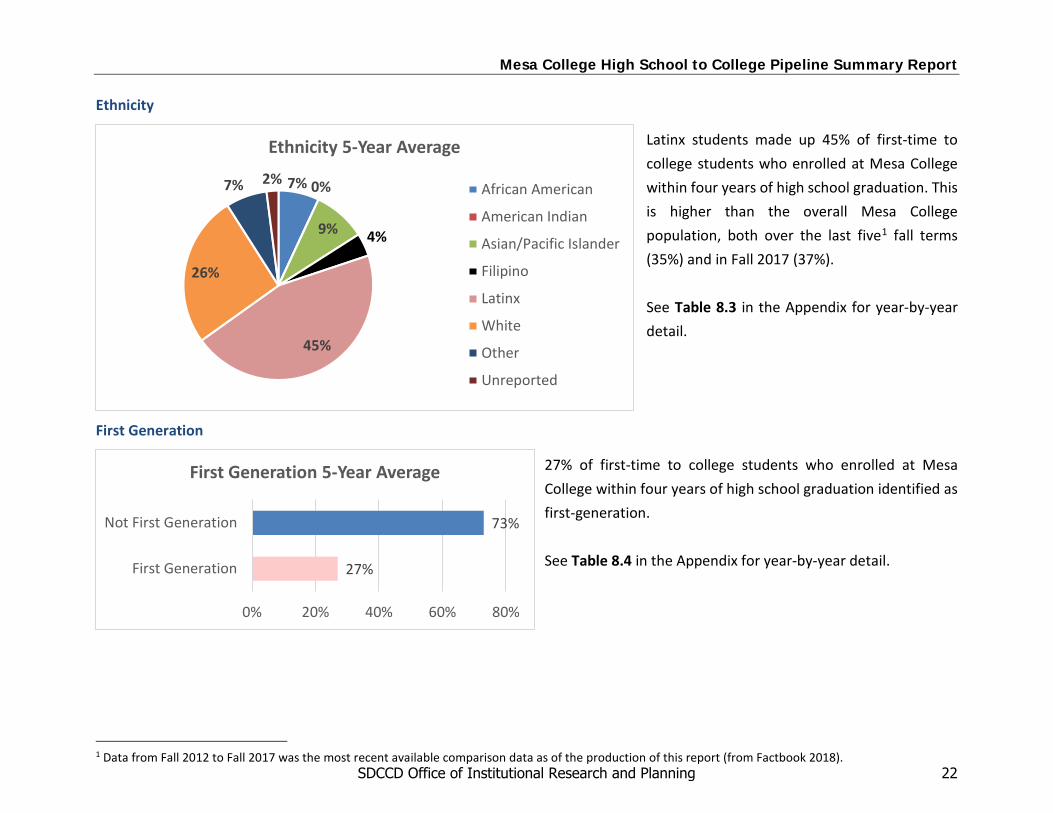
Latinx students made up 45% of first-time to college students who enrolled at Mesa College within four years of high school graduation. This is higher than the overall Mesa College population, both over the last five1 fall terms (35%) and in Fall 2017 (37%). See Table 8.3 in the Appendix for year-by-year detail.
First Generation
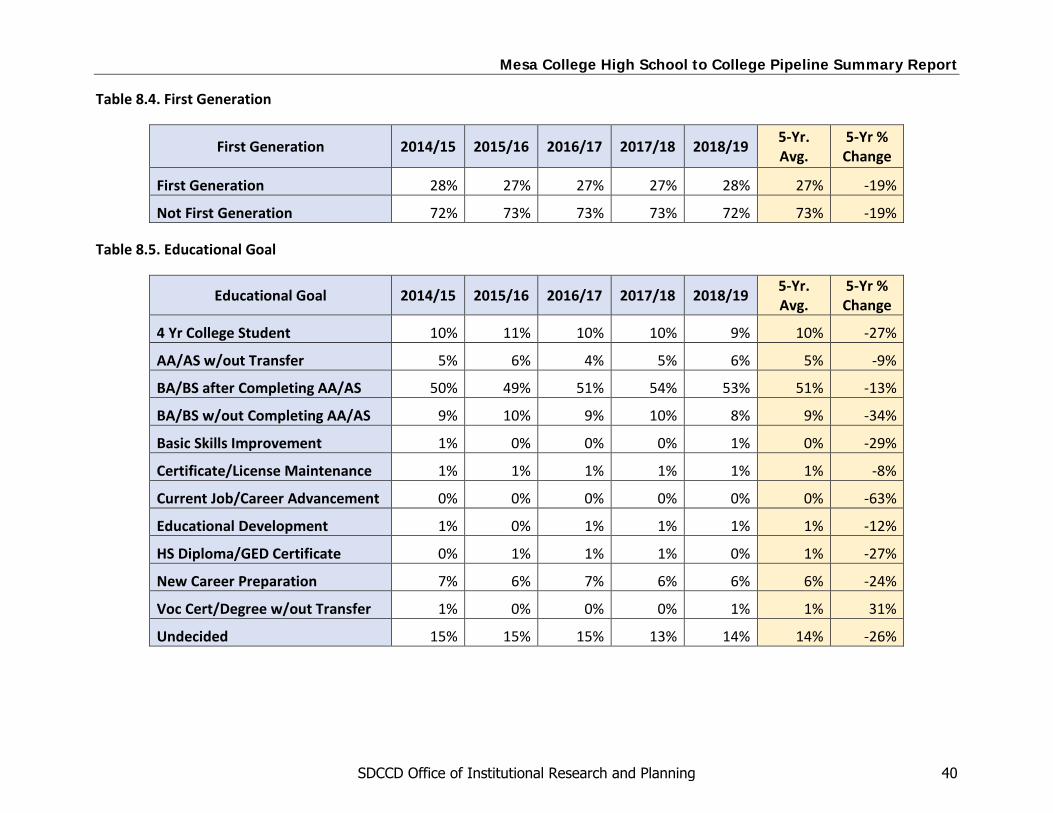
27% of first-time to college students who enrolled at Mesa College within four years of high school graduation identified as first-generation. See Table 8.4 in the Appendix for year-by-year detail.
1 Data from Fall 2012 to Fall 2017 was the most recent available comparison data as of the production of this report (from Factbook 2018).
7% 0%
9% 4%
45%
26%
7% 2%
Ethnicity 5-Year Average
African American
American Indian
Asian/Pacific Islander
Filipino
Latinx
White
Other
Unreported
27%
73%
0% 20% 40% 60% 80%
First Generation
Not First Generation
First Generation 5-Year Average
SDCCD Office of Institutional Research and Planning 22
Mesa College High School to College Pipeline Summary Report
Educational Goal
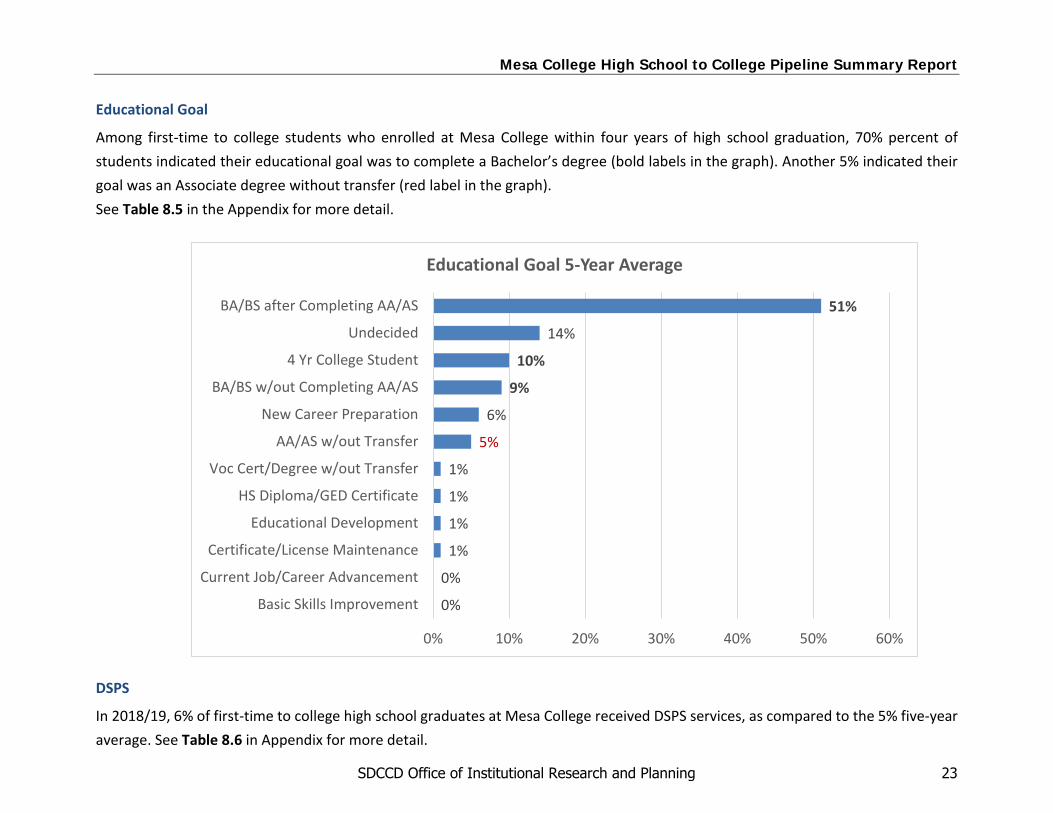
Among first-time to college students who enrolled at Mesa College within four years of high school graduation, 70% percent of students indicated their educational goal was to complete a Bachelor’s degree (bold labels in the graph). Another 5% indicated their goal was an Associate degree without transfer (red label in the graph). See Table 8.5 in the Appendix for more detail.
DSPS
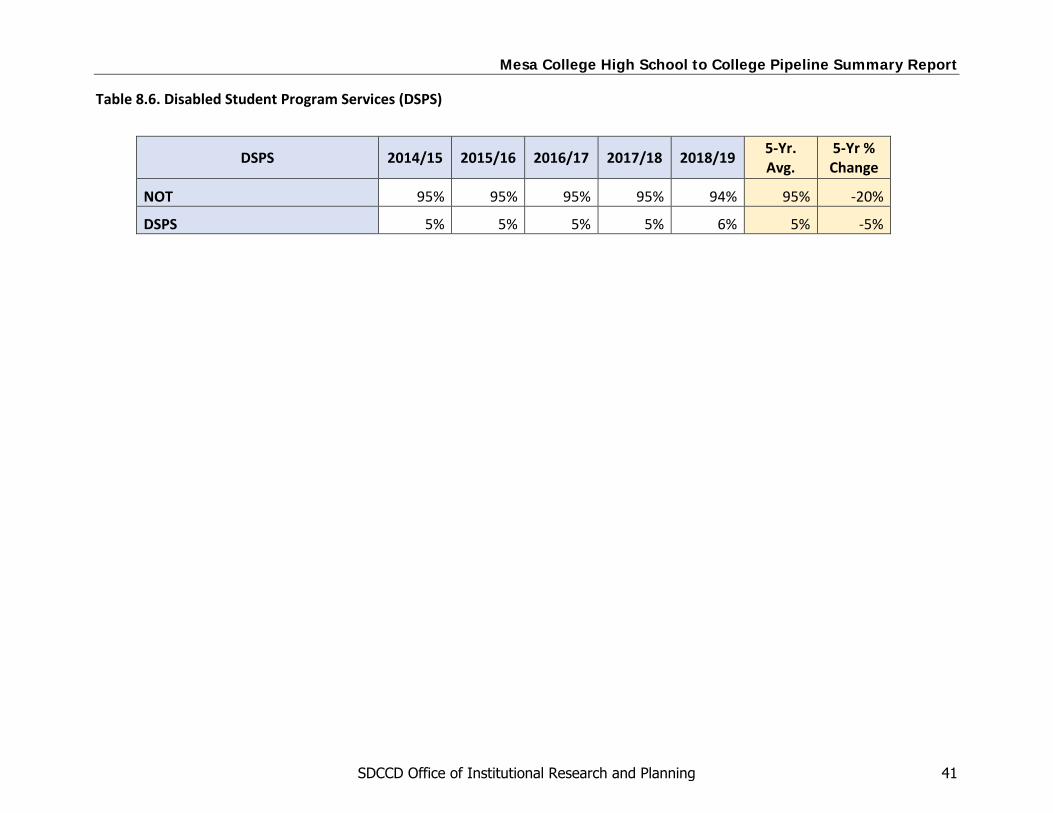
In 2018/19, 6% of first-time to college high school graduates at Mesa College received DSPS services, as compared to the 5% five-year average. See Table 8.6 in Appendix for more detail.
0%
0%
1%
1%
1%
1%
5%
6%
9%
10%
14%
51%
0% 10% 20% 30% 40% 50% 60%
Basic Skills Improvement
Current Job/Career Advancement
Certificate/License Maintenance
Educational Development
HS Diploma/GED Certificate
Voc Cert/Degree w/out Transfer
AA/AS w/out Transfer
New Career Preparation
BA/BS w/out Completing AA/AS
4 Yr College Student
Undecided
BA/BS after Completing AA/AS
Educational Goal 5-Year Average
SDCCD Office of Institutional Research and Planning 23
Mesa College High School to College Pipeline Summary Report
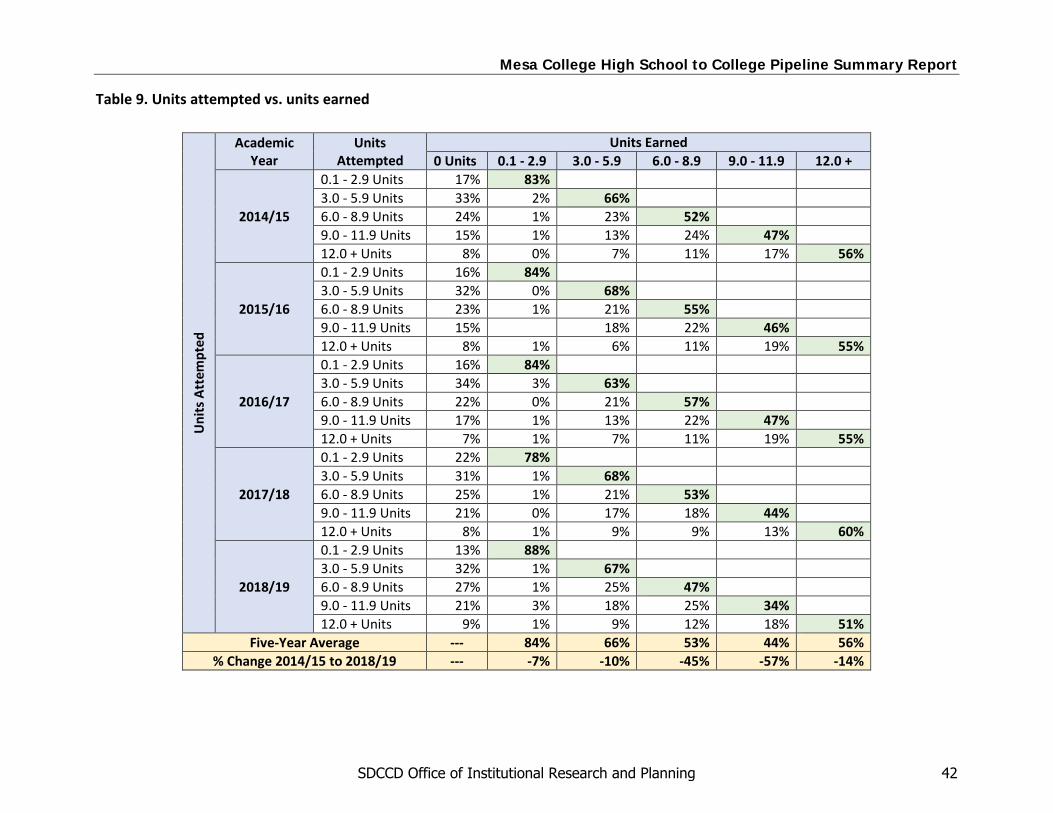
Units Attempted/Earned
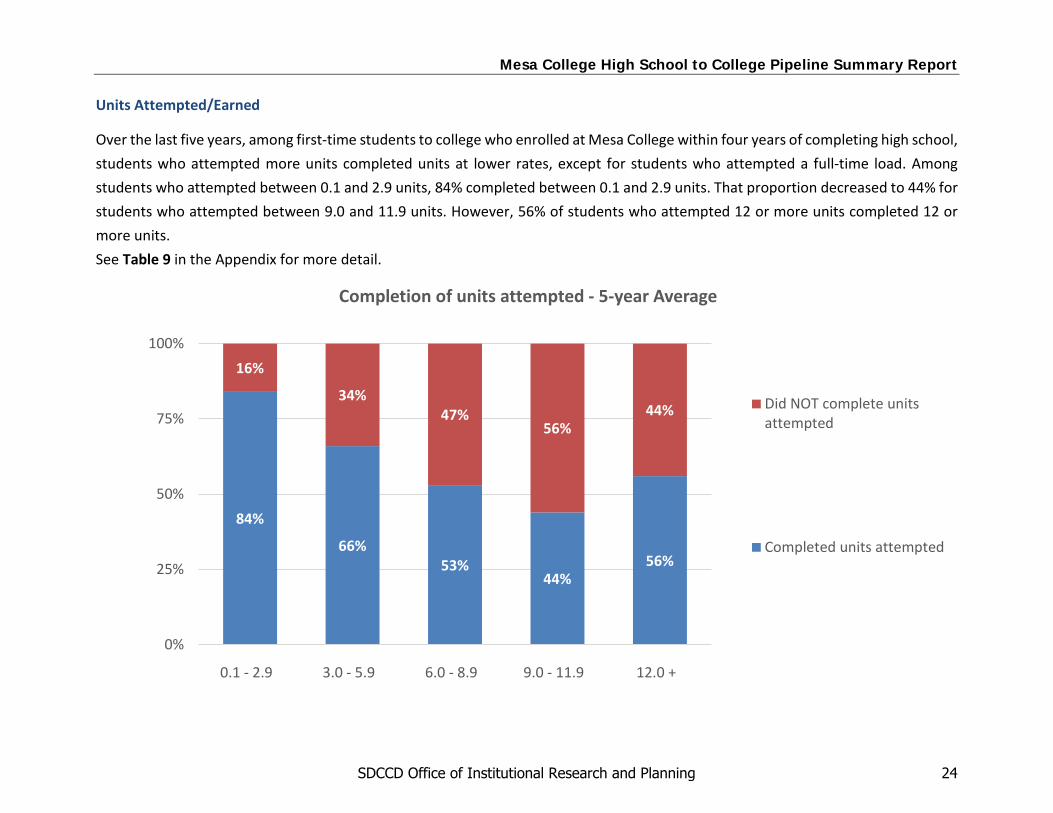
Over the last five years, among first-time students to college who enrolled at Mesa College within four years of completing high school, students who attempted more units completed units at lower rates, except for students who attempted a full-time load. Among students who attempted between 0.1 and 2.9 units, 84% completed between 0.1 and 2.9 units. That proportion decreased to 44% for students who attempted between 9.0 and 11.9 units. However, 56% of students who attempted 12 or more units completed 12 or more units. See Table 9 in the Appendix for more detail.
84%
66%53%
44%56%
16%
34%47%
56%44%
0%
25%
50%
75%
100%
0.1 - 2.9 3.0 - 5.9 6.0 - 8.9 9.0 - 11.9 12.0 +
Completion of units attempted - 5-year Average
Did NOT complete unitsattempted
Completed units attempted
SDCCD Office of Institutional Research and Planning 24
Mesa College High School to College Pipeline Summary Report
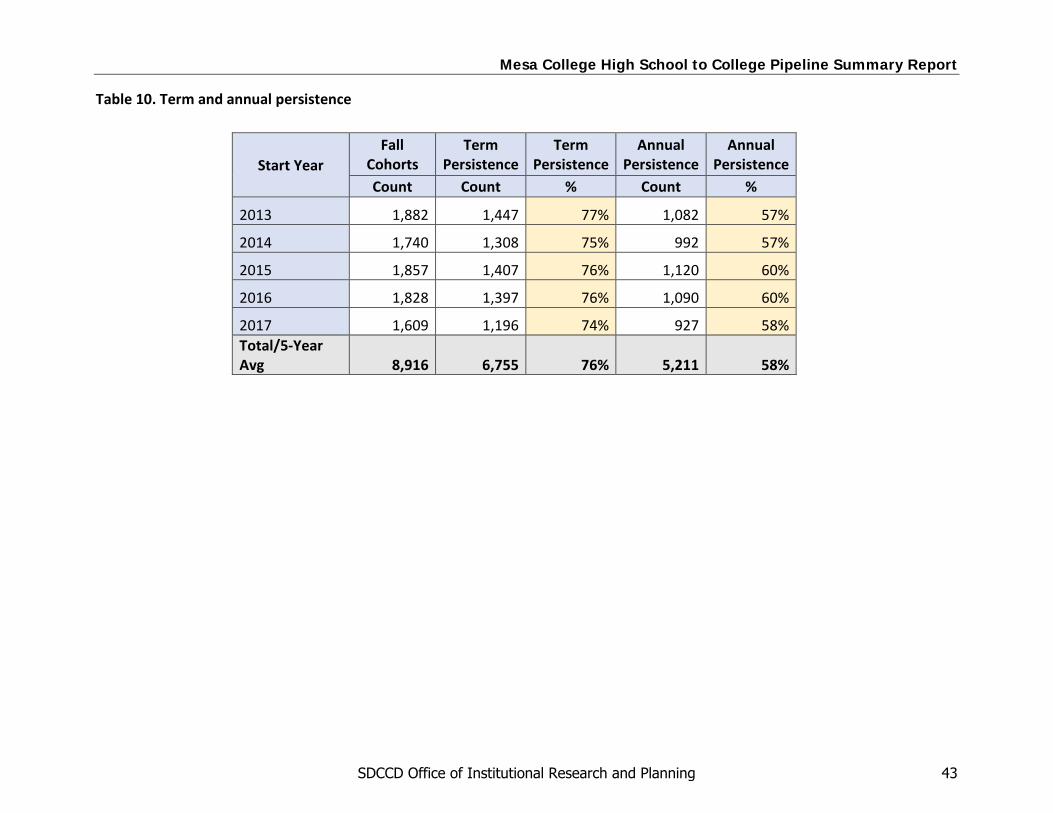
Persistence
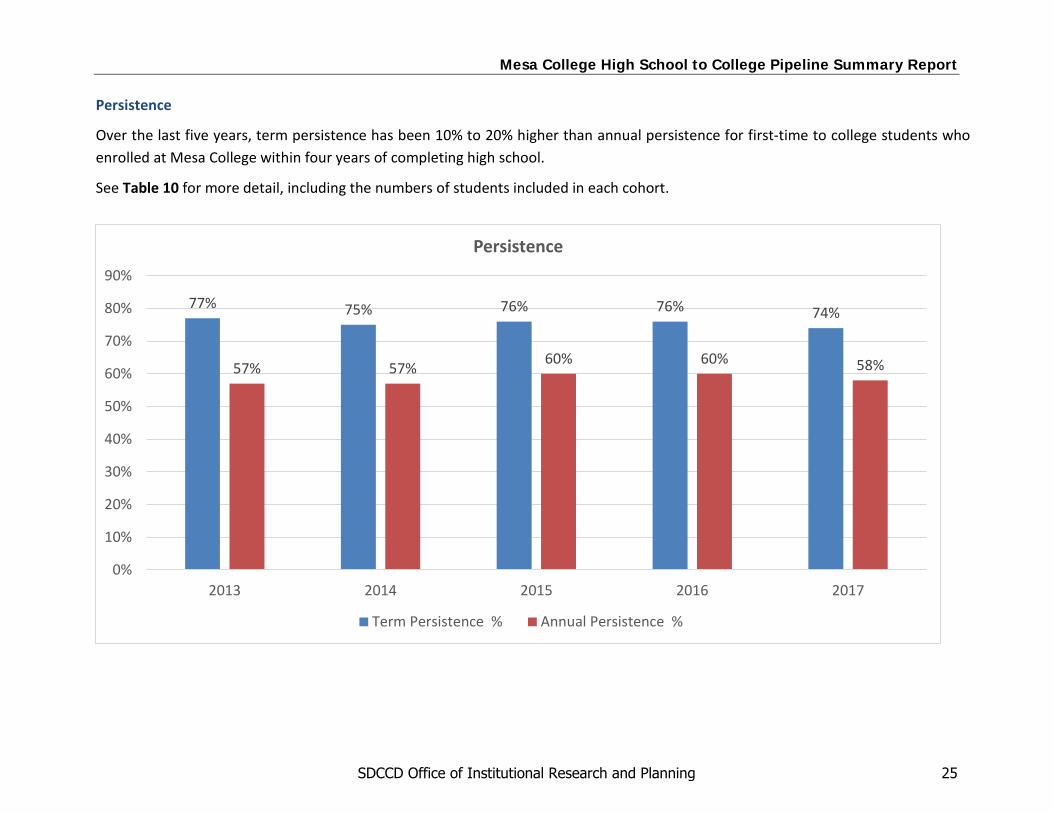
Over the last five years, term persistence has been 10% to 20% higher than annual persistence for first-time to college students who enrolled at Mesa College within four years of completing high school.
See Table 10 for more detail, including the numbers of students included in each cohort.
77% 75% 76% 76% 74%
57% 57% 60% 60% 58%
0%
10%
20%
30%
40%
50%
60%
70%
80%
90%
2013 2014 2015 2016 2017
Persistence
Term Persistence % Annual Persistence %
SDCCD Office of Institutional Research and Planning 25
Mesa College High School to College Pipeline Summary Report
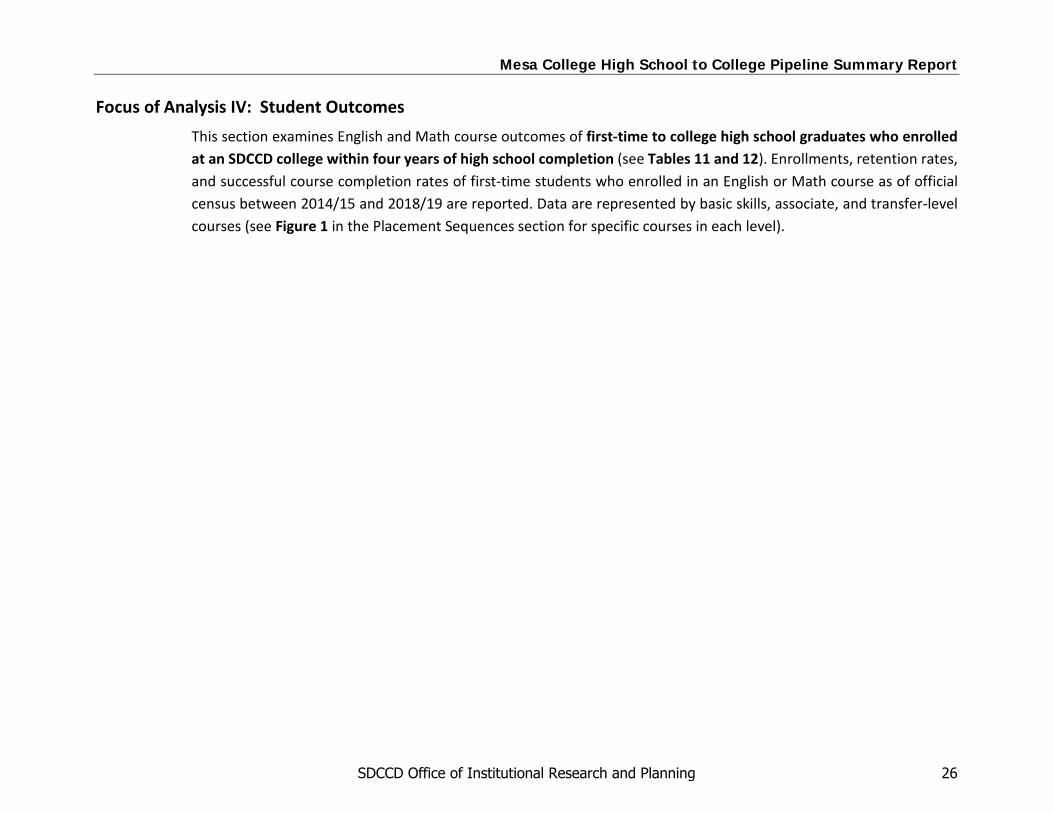
Focus of Analysis IV: Student Outcomes This section examines English and Math course outcomes of first-time to college high school graduates who enrolled at an SDCCD college within four years of high school completion (see Tables 11 and 12). Enrollments, retention rates, and successful course completion rates of first-time students who enrolled in an English or Math course as of official census between 2014/15 and 2018/19 are reported. Data are represented by basic skills, associate, and transfer-level courses (see Figure 1 in the Placement Sequences section for specific courses in each level).
SDCCD Office of Institutional Research and Planning 26
Mesa College High School to College Pipeline Summary Report
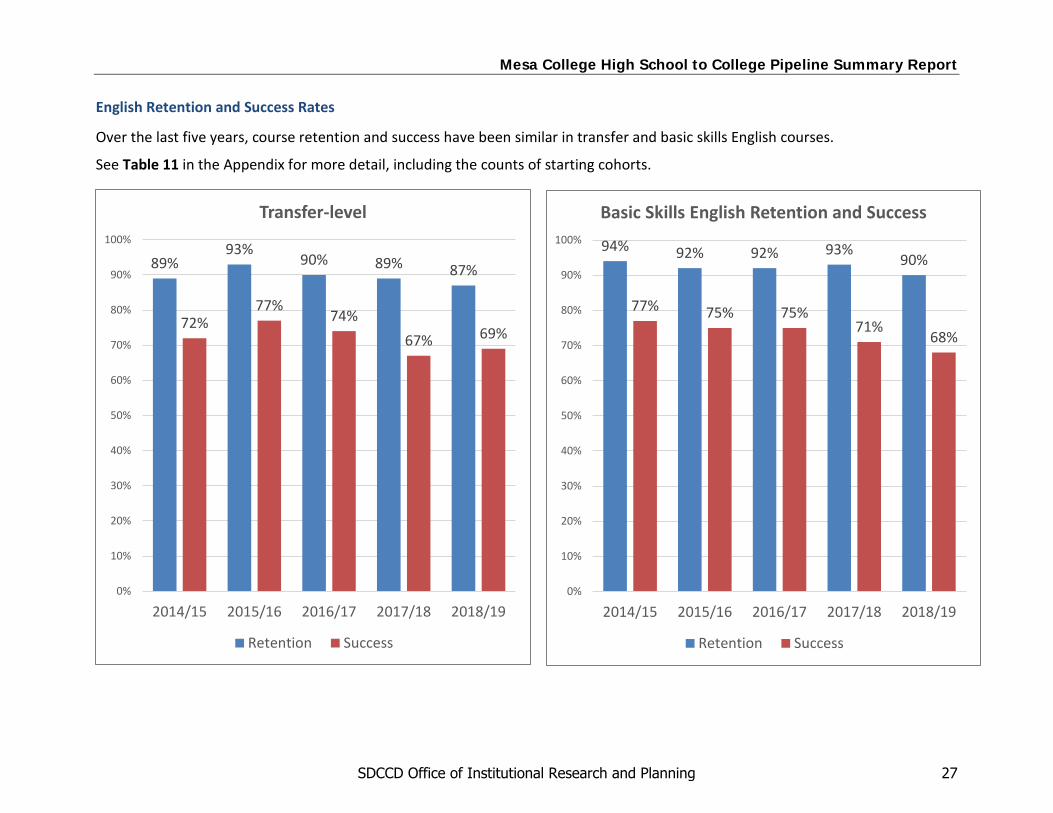
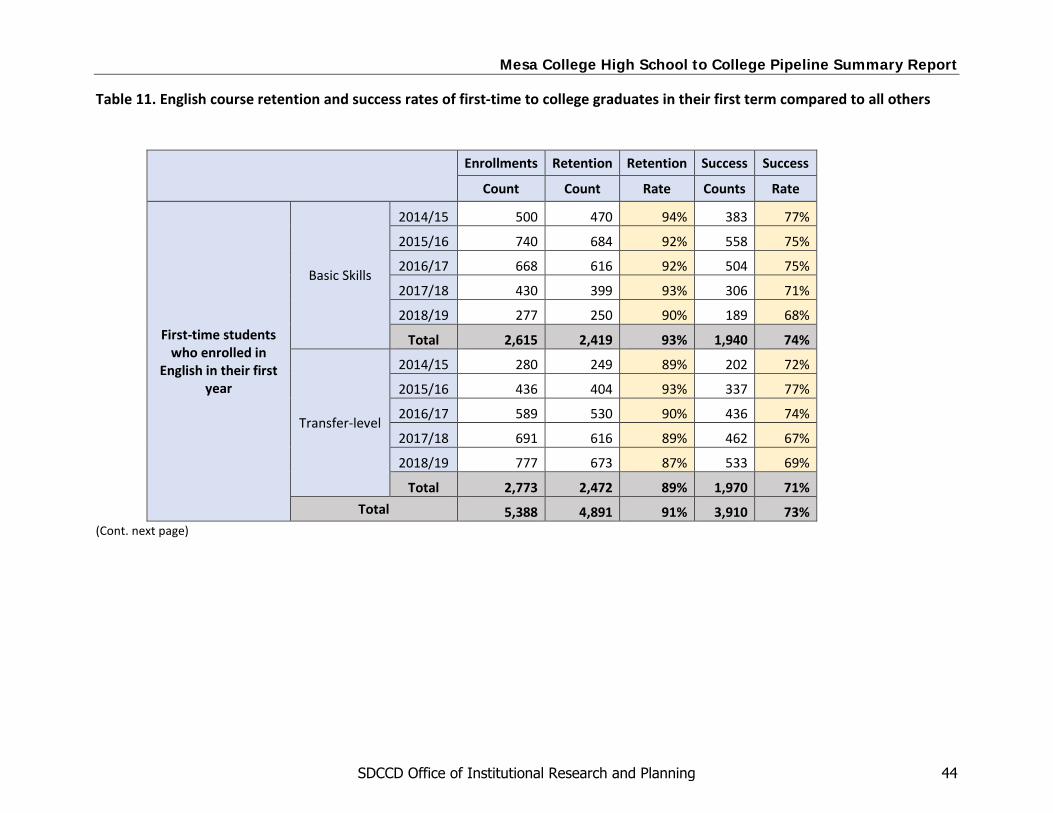
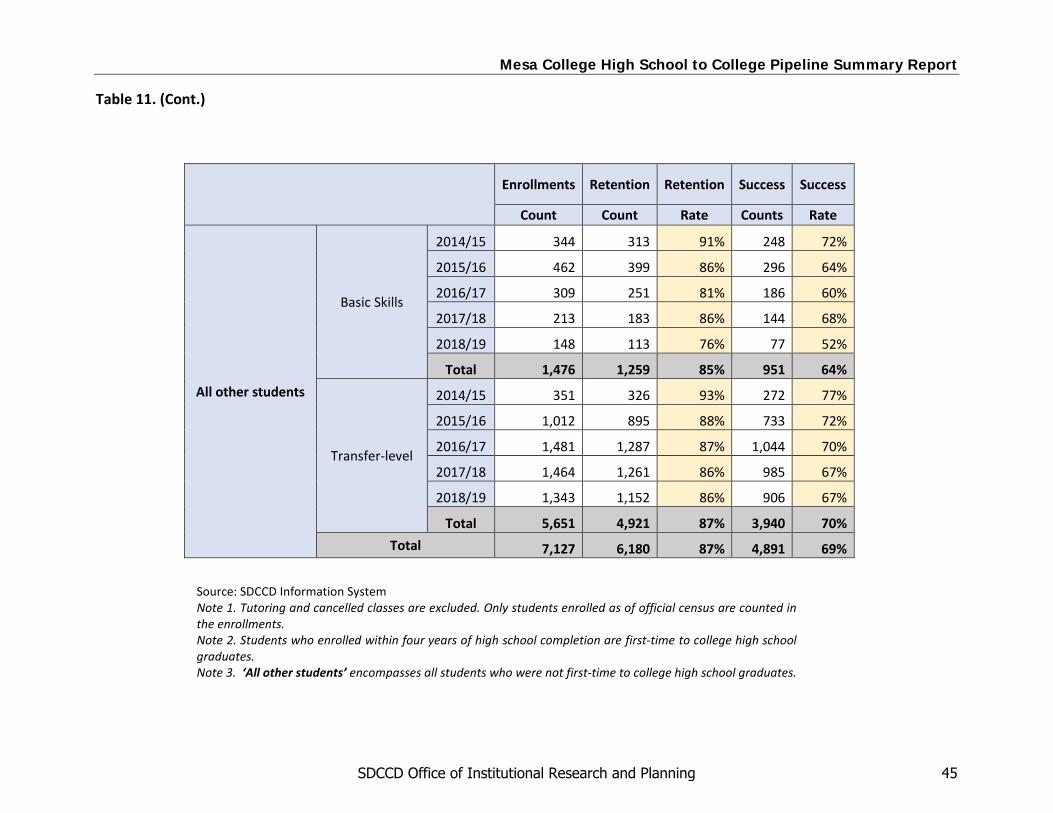
English Retention and Success Rates
Over the last five years, course retention and success have been similar in transfer and basic skills English courses.
See Table 11 in the Appendix for more detail, including the counts of starting cohorts.
89%93%
90% 89% 87%
72%77%
74%67% 69%
0%
10%
20%
30%
40%
50%
60%
70%
80%
90%
100%
2014/15 2015/16 2016/17 2017/18 2018/19
Transfer-level
Retention Success
94% 92% 92% 93%90%
77% 75% 75%71%
68%
0%
10%
20%
30%
40%
50%
60%
70%
80%
90%
100%
2014/15 2015/16 2016/17 2017/18 2018/19
Basic Skills English Retention and Success
Retention Success
SDCCD Office of Institutional Research and Planning 27
Mesa College High School to College Pipeline Summary Report
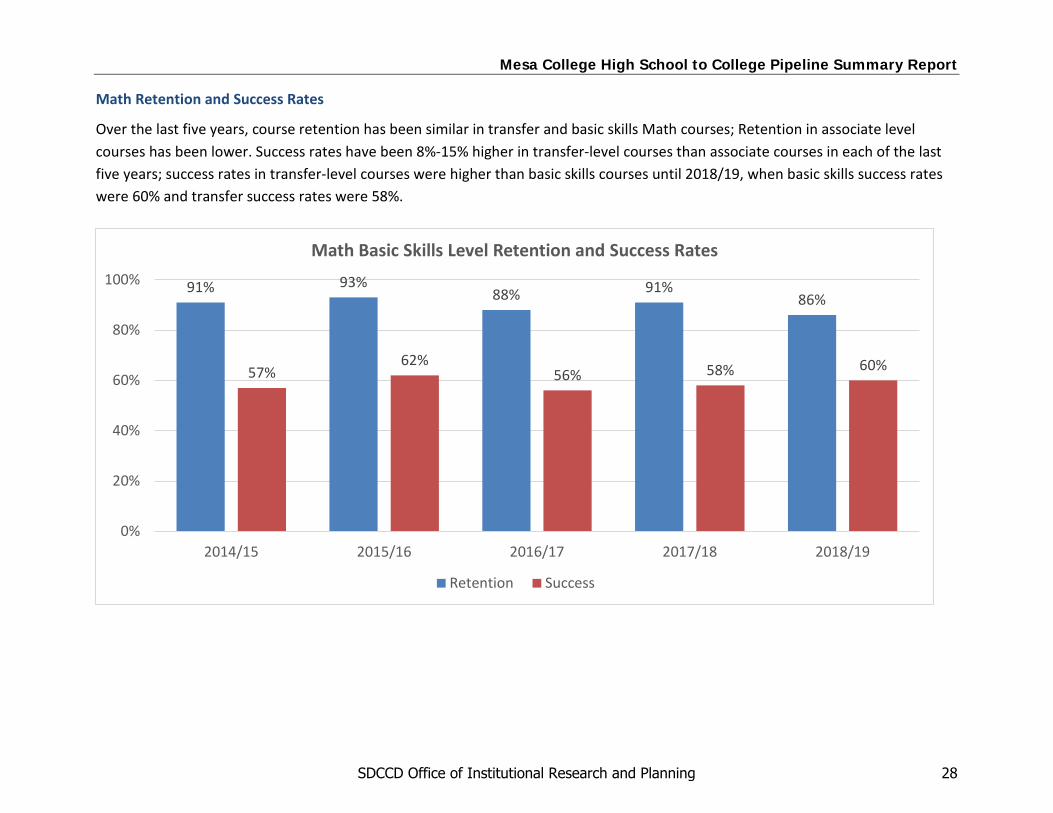
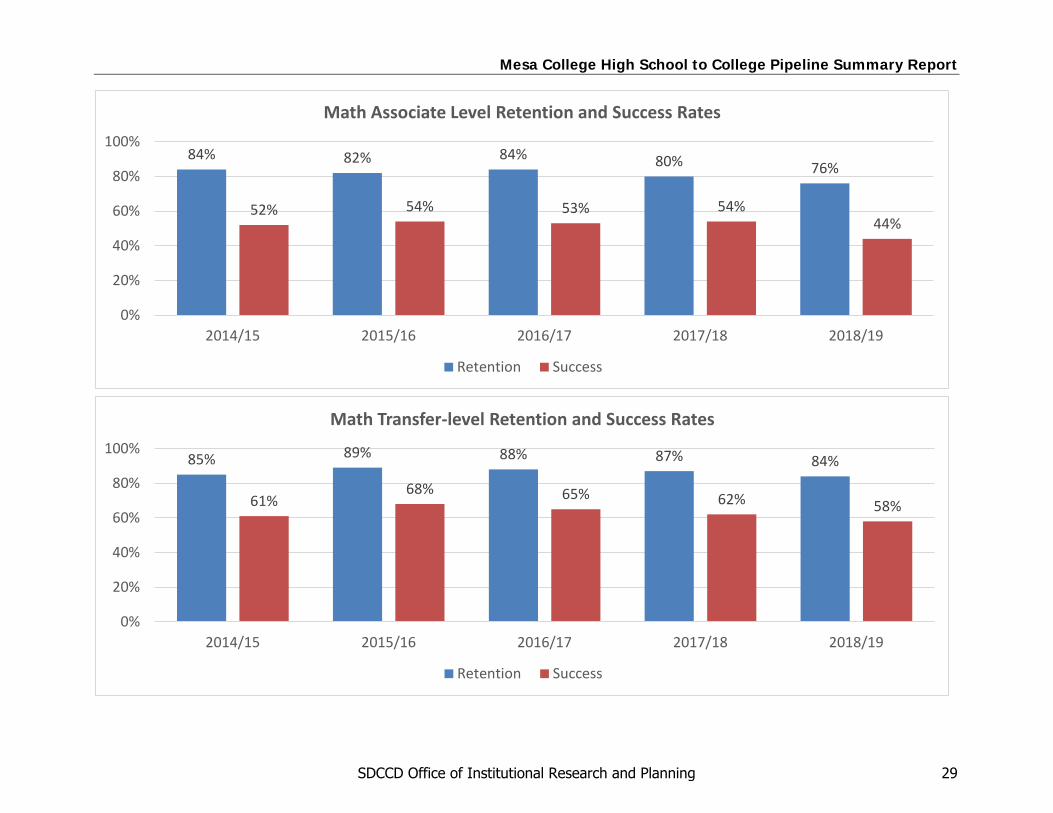
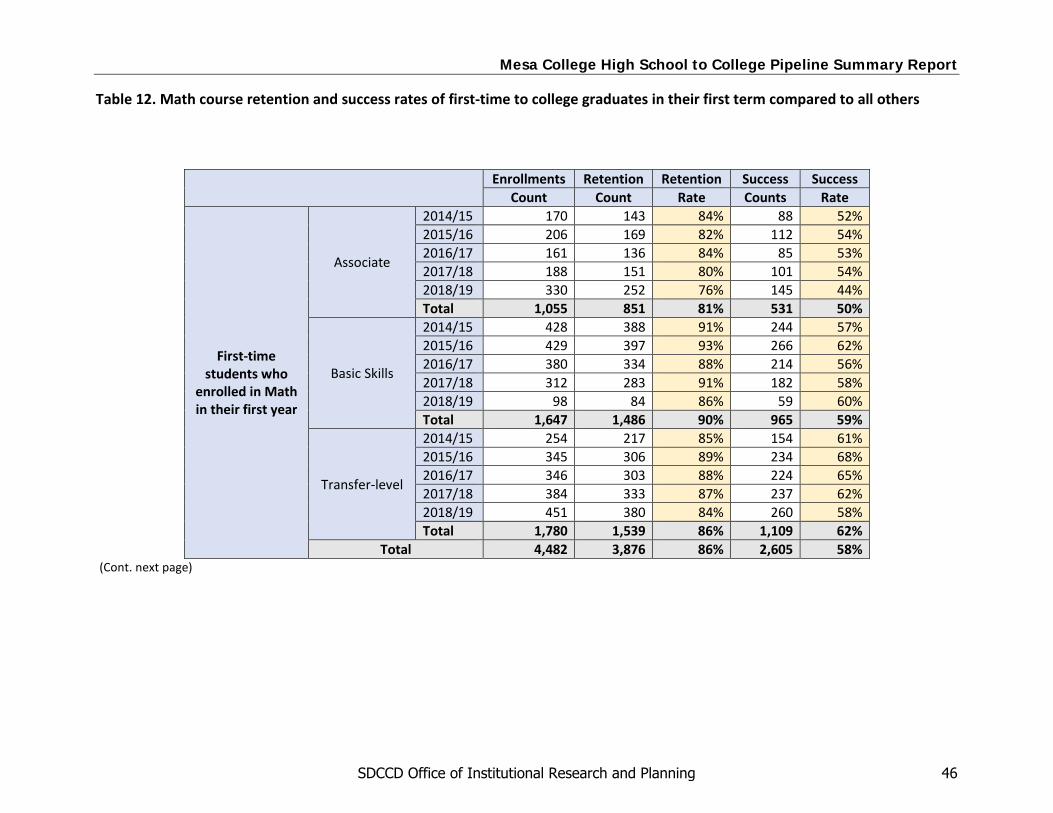
Math Retention and Success Rates
Over the last five years, course retention has been similar in transfer and basic skills Math courses; Retention in associate level courses has been lower. Success rates have been 8%-15% higher in transfer-level courses than associate courses in each of the last five years; success rates in transfer-level courses were higher than basic skills courses until 2018/19, when basic skills success rates were 60% and transfer success rates were 58%.
91% 93%88% 91%
86%
57%62%
56% 58% 60%
0%
20%
40%
60%
80%
100%
2014/15 2015/16 2016/17 2017/18 2018/19
Math Basic Skills Level Retention and Success Rates
Retention Success
SDCCD Office of Institutional Research and Planning 28
Mesa College High School to College Pipeline Summary Report
85% 89% 88% 87% 84%
61%68% 65% 62% 58%
0%
20%
40%
60%
80%
100%
2014/15 2015/16 2016/17 2017/18 2018/19
Math Transfer-level Retention and Success Rates
Retention Success
84% 82% 84% 80% 76%
52% 54% 53% 54%44%
0%
20%
40%
60%
80%
100%
2014/15 2015/16 2016/17 2017/18 2018/19
Math Associate Level Retention and Success Rates
Retention Success
SDCCD Office of Institutional Research and Planning 29
Mesa College High School to College Pipeline Summary Report
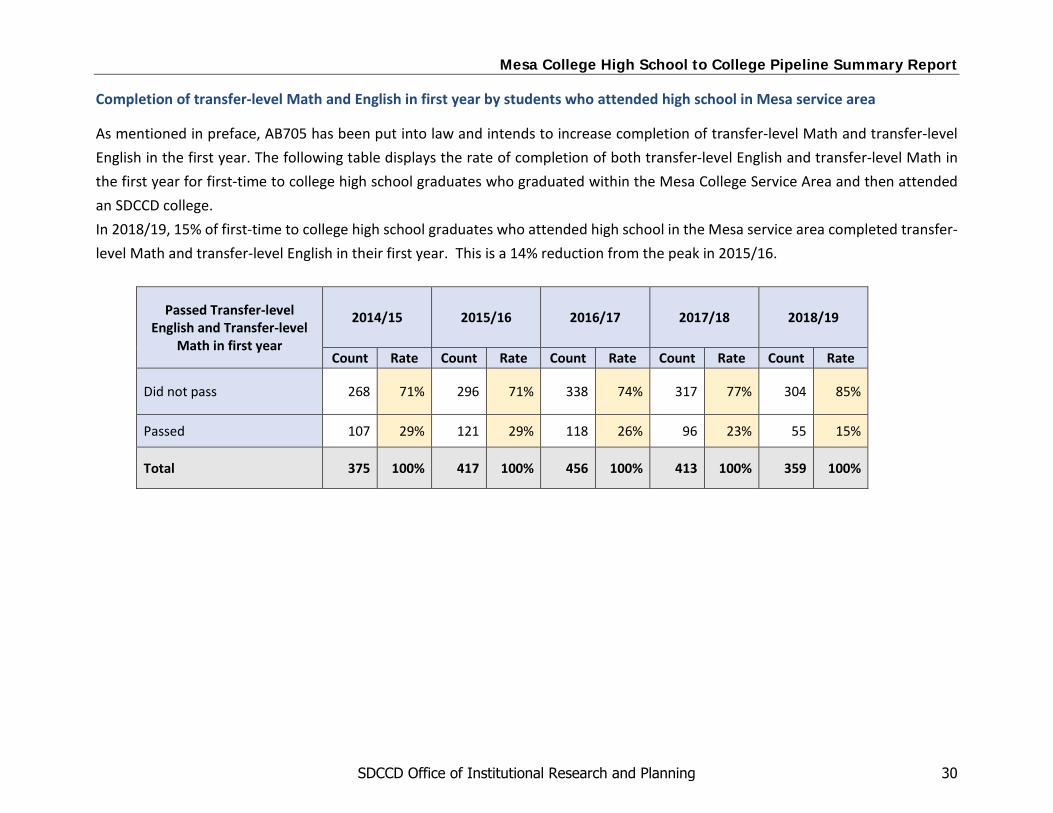
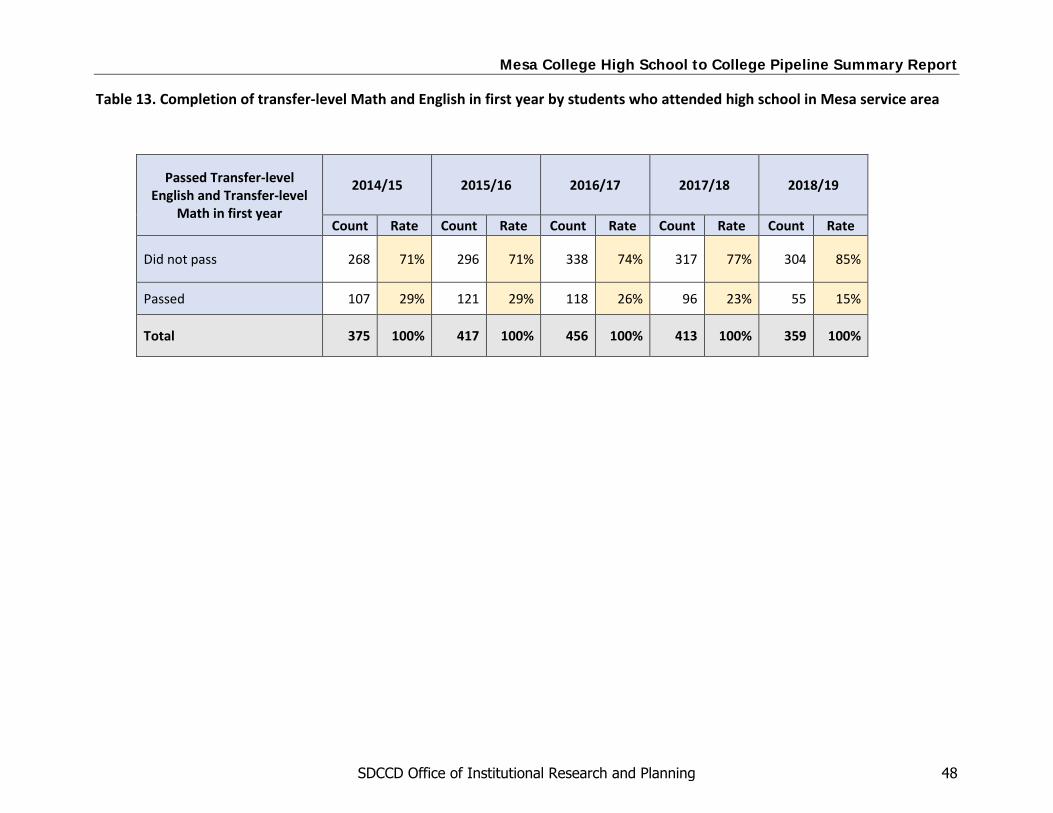
Completion of transfer-level Math and English in first year by students who attended high school in Mesa service area
As mentioned in preface, AB705 has been put into law and intends to increase completion of transfer-level Math and transfer-level English in the first year. The following table displays the rate of completion of both transfer-level English and transfer-level Math in the first year for first-time to college high school graduates who graduated within the Mesa College Service Area and then attended an SDCCD college. In 2018/19, 15% of first-time to college high school graduates who attended high school in the Mesa service area completed transfer-level Math and transfer-level English in their first year. This is a 14% reduction from the peak in 2015/16.
Passed Transfer-level English and Transfer-level
Math in first year
2014/15 2015/16 2016/17 2017/18 2018/19
Count Rate Count Rate Count Rate Count Rate Count Rate
Did not pass 268 71% 296 71% 338 74% 317 77% 304 85%
Passed 107 29% 121 29% 118 26% 96 23% 55 15%
Total 375 100% 417 100% 456 100% 413 100% 359 100%
SDCCD Office of Institutional Research and Planning 30
Mesa College High School to College Pipeline Summary Report
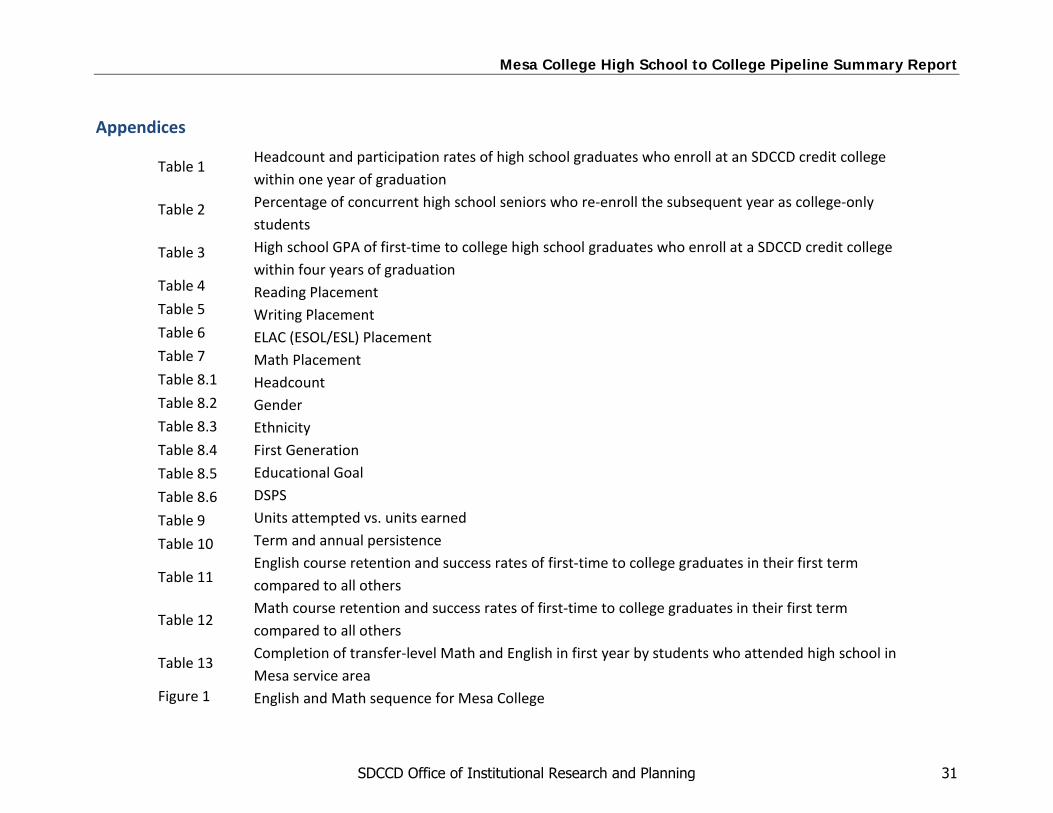
Appendices
Table 1
Table 2
Table 3
Table 4 Table 5 Table 6 Table 7 Table 8.1 Table 8.2 Table 8.3 Table 8.4 Table 8.5 Table 8.6 Table 9 Table 10
Table 11
Table 12
Table 13
Figure 1
Headcount and participation rates of high school graduates who enroll at an SDCCD credit college within one year of graduation Percentage of concurrent high school seniors who re-enroll the subsequent year as college-only students High school GPA of first-time to college high school graduates who enroll at a SDCCD credit college within four years of graduation Reading Placement Writing Placement ELAC (ESOL/ESL) Placement Math Placement Headcount Gender Ethnicity First Generation Educational Goal DSPS Units attempted vs. units earned Term and annual persistence English course retention and success rates of first-time to college graduates in their first term compared to all others Math course retention and success rates of first-time to college graduates in their first term compared to all others Completion of transfer-level Math and English in first year by students who attended high school in Mesa service area English and Math sequence for Mesa College
SDCCD Office of Institutional Research and Planning 31
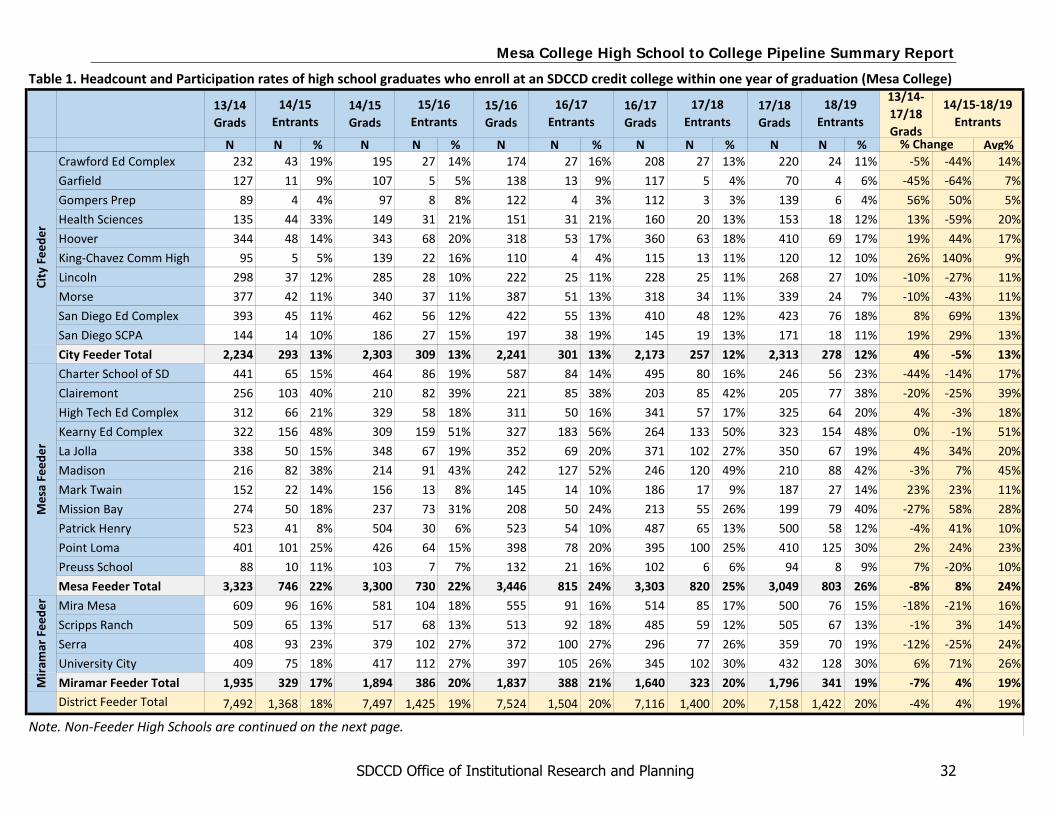
Table 1. Headcount and Participation rates of high school graduates who enroll at an SDCCD credit college within one year of graduation (Mesa College)
13/14 Grads
14/15 Grads
15/16 Grads
16/17 Grads
17/18 Grads
13/14-17/18 Grads
N N % N N % N N % N N % N N % Avg%Crawford Ed Complex 232 43 19% 195 27 14% 174 27 16% 208 27 13% 220 24 11% -5% -44% 14%Garfield 127 11 9% 107 5 5% 138 13 9% 117 5 4% 70 4 6% -45% -64% 7%Gompers Prep 89 4 4% 97 8 8% 122 4 3% 112 3 3% 139 6 4% 56% 50% 5%Health Sciences 135 44 33% 149 31 21% 151 31 21% 160 20 13% 153 18 12% 13% -59% 20%Hoover 344 48 14% 343 68 20% 318 53 17% 360 63 18% 410 69 17% 19% 44% 17%King-Chavez Comm High 95 5 5% 139 22 16% 110 4 4% 115 13 11% 120 12 10% 26% 140% 9%Lincoln 298 37 12% 285 28 10% 222 25 11% 228 25 11% 268 27 10% -10% -27% 11%Morse 377 42 11% 340 37 11% 387 51 13% 318 34 11% 339 24 7% -10% -43% 11%San Diego Ed Complex 393 45 11% 462 56 12% 422 55 13% 410 48 12% 423 76 18% 8% 69% 13%San Diego SCPA 144 14 10% 186 27 15% 197 38 19% 145 19 13% 171 18 11% 19% 29% 13%City Feeder Total 2,234 293 13% 2,303 309 13% 2,241 301 13% 2,173 257 12% 2,313 278 12% 4% -5% 13%Charter School of SD 441 65 15% 464 86 19% 587 84 14% 495 80 16% 246 56 23% -44% -14% 17%Clairemont 256 103 40% 210 82 39% 221 85 38% 203 85 42% 205 77 38% -20% -25% 39%High Tech Ed Complex 312 66 21% 329 58 18% 311 50 16% 341 57 17% 325 64 20% 4% -3% 18%Kearny Ed Complex 322 156 48% 309 159 51% 327 183 56% 264 133 50% 323 154 48% 0% -1% 51%La Jolla 338 50 15% 348 67 19% 352 69 20% 371 102 27% 350 67 19% 4% 34% 20%Madison 216 82 38% 214 91 43% 242 127 52% 246 120 49% 210 88 42% -3% 7% 45%Mark Twain 152 22 14% 156 13 8% 145 14 10% 186 17 9% 187 27 14% 23% 23% 11%Mission Bay 274 50 18% 237 73 31% 208 50 24% 213 55 26% 199 79 40% -27% 58% 28%Patrick Henry 523 41 8% 504 30 6% 523 54 10% 487 65 13% 500 58 12% -4% 41% 10%Point Loma 401 101 25% 426 64 15% 398 78 20% 395 100 25% 410 125 30% 2% 24% 23%Preuss School 88 10 11% 103 7 7% 132 21 16% 102 6 6% 94 8 9% 7% -20% 10%Mesa Feeder Total 3,323 746 22% 3,300 730 22% 3,446 815 24% 3,303 820 25% 3,049 803 26% -8% 8% 24%Mira Mesa 609 96 16% 581 104 18% 555 91 16% 514 85 17% 500 76 15% -18% -21% 16%Scripps Ranch 509 65 13% 517 68 13% 513 92 18% 485 59 12% 505 67 13% -1% 3% 14%Serra 408 93 23% 379 102 27% 372 100 27% 296 77 26% 359 70 19% -12% -25% 24%University City 409 75 18% 417 112 27% 397 105 26% 345 102 30% 432 128 30% 6% 71% 26%Miramar Feeder Total 1,935 329 17% 1,894 386 20% 1,837 388 21% 1,640 323 20% 1,796 341 19% -7% 4% 19%District Feeder Total 7,492 1,368 18% 7,497 1,425 19% 7,524 1,504 20% 7,116 1,400 20% 7,158 1,422 20% -4% 4% 19%
Note. Non-Feeder High Schools are continued on the next page.
18/19 Entrants
% Change
14/15-18/19 Entrants
14/15 Entrants
15/16 Entrants
16/17 Entrants
17/18 Entrants
City
Fee
der
Mes
a Fe
eder
Mira
mar
Fee
der
Mesa College High School to College Pipeline Summary Report
SDCCD Office of Institutional Research and Planning 32
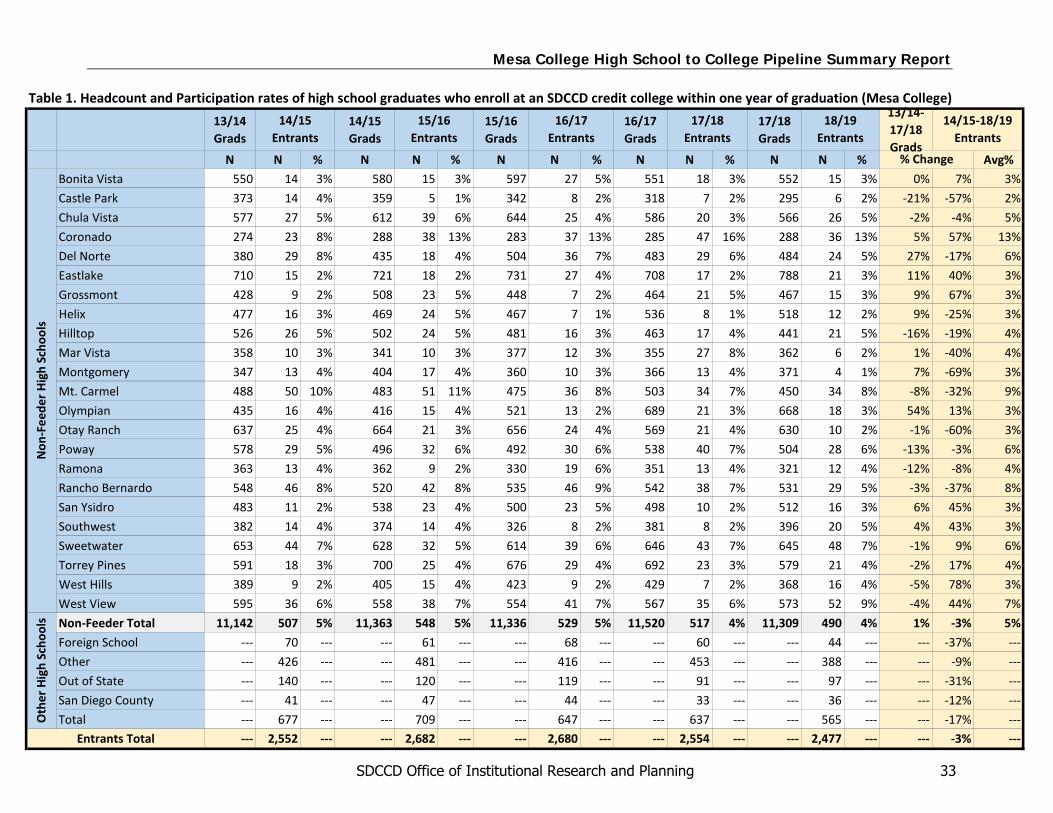
Table 1. Headcount and Participation rates of high school graduates who enroll at an SDCCD credit college within one year of graduation (Mesa College)13/14 Grads
14/15 Grads
15/16 Grads
16/17 Grads
17/18 Grads
13/14-17/18 Grads
N N % N N % N N % N N % N N % Avg%Bonita Vista 550 14 3% 580 15 3% 597 27 5% 551 18 3% 552 15 3% 0% 7% 3%Castle Park 373 14 4% 359 5 1% 342 8 2% 318 7 2% 295 6 2% -21% -57% 2%Chula Vista 577 27 5% 612 39 6% 644 25 4% 586 20 3% 566 26 5% -2% -4% 5%Coronado 274 23 8% 288 38 13% 283 37 13% 285 47 16% 288 36 13% 5% 57% 13%Del Norte 380 29 8% 435 18 4% 504 36 7% 483 29 6% 484 24 5% 27% -17% 6%Eastlake 710 15 2% 721 18 2% 731 27 4% 708 17 2% 788 21 3% 11% 40% 3%Grossmont 428 9 2% 508 23 5% 448 7 2% 464 21 5% 467 15 3% 9% 67% 3%Helix 477 16 3% 469 24 5% 467 7 1% 536 8 1% 518 12 2% 9% -25% 3%Hilltop 526 26 5% 502 24 5% 481 16 3% 463 17 4% 441 21 5% -16% -19% 4%Mar Vista 358 10 3% 341 10 3% 377 12 3% 355 27 8% 362 6 2% 1% -40% 4%Montgomery 347 13 4% 404 17 4% 360 10 3% 366 13 4% 371 4 1% 7% -69% 3%Mt. Carmel 488 50 10% 483 51 11% 475 36 8% 503 34 7% 450 34 8% -8% -32% 9%Olympian 435 16 4% 416 15 4% 521 13 2% 689 21 3% 668 18 3% 54% 13% 3%Otay Ranch 637 25 4% 664 21 3% 656 24 4% 569 21 4% 630 10 2% -1% -60% 3%Poway 578 29 5% 496 32 6% 492 30 6% 538 40 7% 504 28 6% -13% -3% 6%Ramona 363 13 4% 362 9 2% 330 19 6% 351 13 4% 321 12 4% -12% -8% 4%Rancho Bernardo 548 46 8% 520 42 8% 535 46 9% 542 38 7% 531 29 5% -3% -37% 8%San Ysidro 483 11 2% 538 23 4% 500 23 5% 498 10 2% 512 16 3% 6% 45% 3%Southwest 382 14 4% 374 14 4% 326 8 2% 381 8 2% 396 20 5% 4% 43% 3%Sweetwater 653 44 7% 628 32 5% 614 39 6% 646 43 7% 645 48 7% -1% 9% 6%Torrey Pines 591 18 3% 700 25 4% 676 29 4% 692 23 3% 579 21 4% -2% 17% 4%West Hills 389 9 2% 405 15 4% 423 9 2% 429 7 2% 368 16 4% -5% 78% 3%West View 595 36 6% 558 38 7% 554 41 7% 567 35 6% 573 52 9% -4% 44% 7%Non-Feeder Total 11,142 507 5% 11,363 548 5% 11,336 529 5% 11,520 517 4% 11,309 490 4% 1% -3% 5%Foreign School --- 70 --- --- 61 --- --- 68 --- --- 60 --- --- 44 --- --- -37% ---Other --- 426 --- --- 481 --- --- 416 --- --- 453 --- --- 388 --- --- -9% ---Out of State --- 140 --- --- 120 --- --- 119 --- --- 91 --- --- 97 --- --- -31% ---San Diego County --- 41 --- --- 47 --- --- 44 --- --- 33 --- --- 36 --- --- -12% ---Total --- 677 --- --- 709 --- --- 647 --- --- 637 --- --- 565 --- --- -17% ---
--- 2,552 --- --- 2,682 --- --- 2,680 --- --- 2,554 --- --- 2,477 --- --- -3% ---
17/18 Entrants
18/19 Entrants
14/15-18/19 Entrants
% Change
Entrants Total
Non
-Fee
der H
igh
Scho
ols
Oth
er H
igh
Scho
ols
14/15 Entrants
15/16 Entrants
16/17 Entrants
Mesa College High School to College Pipeline Summary Report
SDCCD Office of Institutional Research and Planning 33
Source: High School Data - Education Data Partnership (Ed-Data) - SDCCD Information System
Note 1. Students are unduplicated within each year.Note 2. SDSU, UCSD, tutoring, and cancelled classes are excluded from student enrollments. Students with no/unreported high school are excluded.Note 3. Schools with no SDCCD Entrants are excluded (ALBA, Arroyo Paseo, Audeo, Coleman Tech, e3 Civic, Iftin, iHigh, Laurel Prep, Learning Choice, Riley/New Dawn, San Diego Early/Middle College, The O'Farrell Charter, TRACE, and Whittier).Note 4. Non feeder schools with an average fewer than 17 SDCCD entrants over the five years), private schools, and schools with no reported/incalidad SDCCD or CDE data are indated as "Other".Note 5. "Other High Schools" have no data available on high school graduates; therefore, no participation rates are calculated.
Mesa College High School to College Pipeline Summary Report
SDCCD Office of Institutional Research and Planning 34
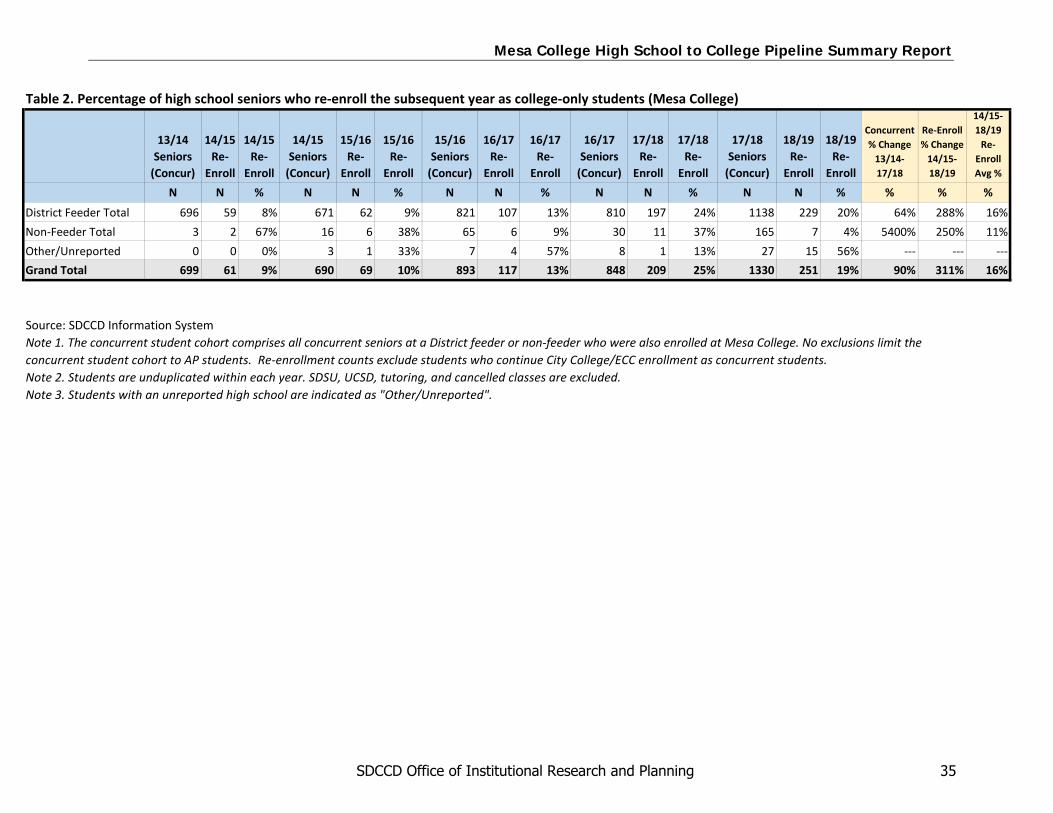
Table 2. Percentage of high school seniors who re-enroll the subsequent year as college-only students (Mesa College)
13/14 Seniors
(Concur)
14/15 Re-
Enroll
14/15 Re-
Enroll
14/15 Seniors
(Concur)
15/16 Re-
Enroll
15/16 Re-
Enroll
15/16 Seniors
(Concur)
16/17 Re-
Enroll
16/17 Re-
Enroll
16/17 Seniors
(Concur)
17/18 Re-
Enroll
17/18 Re-
Enroll
17/18 Seniors
(Concur)
18/19 Re-
Enroll
18/19 Re-
Enroll
Concurrent % Change
13/14-17/18
Re-Enroll % Change
14/15-18/19
14/15-18/19
Re-Enroll Avg %
N N % N N % N N % N N % N N % % % %
District Feeder Total 696 59 8% 671 62 9% 821 107 13% 810 197 24% 1138 229 20% 64% 288% 16%Non-Feeder Total 3 2 67% 16 6 38% 65 6 9% 30 11 37% 165 7 4% 5400% 250% 11%Other/Unreported 0 0 0% 3 1 33% 7 4 57% 8 1 13% 27 15 56% --- --- ---Grand Total 699 61 9% 690 69 10% 893 117 13% 848 209 25% 1330 251 19% 90% 311% 16%
Source: SDCCD Information SystemNote 1. The concurrent student cohort comprises all concurrent seniors at a District feeder or non-feeder who were also enrolled at Mesa College. No exclusions limit the concurrent student cohort to AP students. Re-enrollment counts exclude students who continue City College/ECC enrollment as concurrent students.Note 2. Students are unduplicated within each year. SDSU, UCSD, tutoring, and cancelled classes are excluded.Note 3. Students with an unreported high school are indicated as "Other/Unreported".
Mesa College High School to College Pipeline Summary Report
SDCCD Office of Institutional Research and Planning 35
Mesa College High School to College Pipeline Summary Report
Table 3. High school GPA of first-time to college high school graduates who enroll at a SDCCD credit college within four years of graduation
GPA Range 2014/15 2015/16 2016/17 2017/18 2018/19 5-Yr Avg/Total
5-Yr % Change
0.0-1.5 0% 0% 0% 0% 0% 0% 150%
1.6-1.9 1% 1% 1% 1% 1% 1% -42%
2.0-2.5 19% 20% 18% 17% 18% 19% -24%
2.6-3.0 37% 34% 33% 33% 31% 34% -33%
3.1-3.5 29% 30% 31% 30% 31% 30% -16%
Over 3.5 13% 15% 16% 17% 19% 16% 18%
Total 100% 100% 100% 100% 100% 100% -20%
Reported GPA 2,193 2,362 2,165 1,926 1,762 10,408 -20%
Total of All Students 2,448 2,601 2,419 2,167 1,946 11,581 -21%
Source: SDCCD Information System Note 1. High school GPA is self-reported on students' college applications. On average, across five years, 11% of students did not report their GPA. Note 2. In cases where there are few students, the percentage distribution may be 0%; however, a percentage is still calculated. Note 3. Students who enrolled within four years of high school completion are first-time to college high school graduates.
SDCCD Office of Institutional Research and Planning 36
Mesa College High School to College Pipeline Summary Report
Table 4. Reading Placement
Testing Reading 2016/17 2017/18 2018/19 Total N Avg % %
Change N % N % N %
Test/No-Test Total Tested 1,996 83% 1,295 58% 187 10% 3,478 53% -91% Not Tested 399 17% 947 42% 1,707 90% 3,053 47% 328% Total Students 2,395 100% 2,242 100% 1,894 100% 6,531 100% -21%
Distribution of Students who
Took a Test
Transfer/Associate Level 1,233 62% 717 55% 105 56% 2,055 59% -91% Basic Skills 599 30% 442 34% 65 35% 1,106 32% -89% Need English Advising 142 7% 104 8% 13 7% 259 7% -91%
Take ELAC (ESOL/ESL) Test 22 1% 32 2% 4 2% 58 2% -82% Total Tested 1,996 100% 1,295 100% 187 100% 3,478 100% -91%
Table 5. Writing Placement
Testing Writing 2016/17 2017/18 2018/19 Total
N Avg % % Change N % N % N %
Test/No-Test Total Tested 1,997 83% 1,295 58% 187 10% 3,479 53% -91% Not Tested 398 17% 947 42% 1,707 90% 3,052 47% 329% Total Students 2,395 100% 2,242 100% 1,894 100% 6,531 100% -21%
Distribution of Students who
Took a Test
Transfer/Associate Level 744 37% 390 30% 58 31% 1,192 34% -92% Basic Skills 1,089 55% 769 59% 112 60% 1,970 57% -90% Need English Advising 142 7% 104 8% 13 7% 259 7% -91%
Take ELAC (ESOL/ESL) Test 22 1% 32 2% 4 2% 58 2% -82% Total Tested 1,997 100% 1,295 100% 187 100% 3,479 100% -91%
SDCCD Office of Institutional Research and Planning 37
Mesa College High School to College Pipeline Summary Report
Table 6. ELAC (ESOL/ESL) Placement
Testing ELAC (ESOL/ESL) 2016/17 2017/18 2018/19 Total
N Avg % % Change N % N % N %
Test/No-Test Total Tested 49 2% 52 2% 5 0% 106 2% -90% Not Tested 2,346 98% 2,190 98% 1,889 100% 6,425 98% -19% Total Students 2,395 100% 2,242 100% 1,894 100% 6,531 100% -21%
Distribution of Students who
Took a Test
Level 40 6 12% 3 6% 0 0% 9 8% -100% Level 30 8 16% 8 15% 0 0% 16 15% -100% Level 20 6 12% 7 13% 0 0% 13 12% -100% Level 19 29 59% 34 65% 5 100% 68 64% -83% Total Tested 49 100% 52 100% 5 100% 106 100% -90%
Table 7. Math Placement
Testing Math 2016/17 2017/18 2018/19 Total
N Avg % % Change N % N % N %
Test/No-Test Total Tested 1,992 83% 1,300 58% 190 10% 3,482 53% -90%
Not Tested 403 17% 942 42% 1,704 90% 3,049 47% 323%
Total Students 2,395 100% 2,242 100% 1,894 100% 6,531 100% -21%
Distribution of Students who
Took a Test
Transfer-level 688 35% 362 28% 54 28% 1,104 32% -92%
Associate Level 279 14% 199 15% 18 9% 496 14% -94%
Basic Skills 1,025 51% 739 57% 118 62% 1,882 54% -88%
Total Tested 1,992 100% 1,300 100% 190 100% 3,482 100% -90%
SDCCD Office of Institutional Research and Planning 38
Mesa College High School to College Pipeline Summary Report
Table 8.1. Headcount
Headcount 2014/15 2015/16 2016/17 2017/18 2018/19 Total 5-Yr % Change
Total Student Headcount 2,366 2,499 2,401 2,148 1,921 11,335 -19%
Table 8.2. Gender
Gender 2014/15 2015/16 2016/17 2017/18 2018/19 5-Yr. Avg.
5-Yr % Change
Female 49% 49% 49% 51% 49% 49% -19%
Male 51% 51% 51% 49% 51% 51% -19%
Table 8.3. Ethnicity
Ethnicity 2014/15 2015/16 2016/17 2017/18 2018/19 5-Yr. Avg.
5-Yr % Change
African American 8% 6% 7% 7% 7% 7% -24%
American Indian 0% 0% 0% 0% 0% 0% -50%
Asian/Pacific Islander 9% 10% 10% 9% 9% 9% -15%
Filipino 4% 4% 4% 4% 3% 4% -46%
Latinx 44% 45% 44% 46% 48% 45% -12%
White 27% 26% 26% 26% 25% 26% -23%
Other 7% 8% 7% 6% 7% 7% -20%
Unreported 2% 1% 2% 2% 1% 2% -52%
SDCCD Office of Institutional Research and Planning 39
Mesa College High School to College Pipeline Summary Report
Table 8.4. First Generation
First Generation 2014/15 2015/16 2016/17 2017/18 2018/19 5-Yr. Avg.
5-Yr % Change
First Generation 28% 27% 27% 27% 28% 27% -19%
Not First Generation 72% 73% 73% 73% 72% 73% -19%
Table 8.5. Educational Goal
Educational Goal 2014/15 2015/16 2016/17 2017/18 2018/19 5-Yr. Avg.
5-Yr % Change
4 Yr College Student 10% 11% 10% 10% 9% 10% -27%
AA/AS w/out Transfer 5% 6% 4% 5% 6% 5% -9%
BA/BS after Completing AA/AS 50% 49% 51% 54% 53% 51% -13%
BA/BS w/out Completing AA/AS 9% 10% 9% 10% 8% 9% -34%
Basic Skills Improvement 1% 0% 0% 0% 1% 0% -29%
Certificate/License Maintenance 1% 1% 1% 1% 1% 1% -8%
Current Job/Career Advancement 0% 0% 0% 0% 0% 0% -63%
Educational Development 1% 0% 1% 1% 1% 1% -12%
HS Diploma/GED Certificate 0% 1% 1% 1% 0% 1% -27%
New Career Preparation 7% 6% 7% 6% 6% 6% -24%
Voc Cert/Degree w/out Transfer 1% 0% 0% 0% 1% 1% 31%
Undecided 15% 15% 15% 13% 14% 14% -26%
SDCCD Office of Institutional Research and Planning 40
Mesa College High School to College Pipeline Summary Report
Table 8.6. Disabled Student Program Services (DSPS)
DSPS 2014/15 2015/16 2016/17 2017/18 2018/19 5-Yr. Avg.
5-Yr % Change
NOT 95% 95% 95% 95% 94% 95% -20%
DSPS 5% 5% 5% 5% 6% 5% -5%
SDCCD Office of Institutional Research and Planning 41
Mesa College High School to College Pipeline Summary Report
Table 9. Units attempted vs. units earned
Uni
ts A
ttem
pted
Academic Year
Units Attempted
Units Earned 0 Units 0.1 - 2.9 3.0 - 5.9 6.0 - 8.9 9.0 - 11.9 12.0 +
2014/15
0.1 - 2.9 Units 17% 83% 3.0 - 5.9 Units 33% 2% 66% 6.0 - 8.9 Units 24% 1% 23% 52% 9.0 - 11.9 Units 15% 1% 13% 24% 47% 12.0 + Units 8% 0% 7% 11% 17% 56%
2015/16
0.1 - 2.9 Units 16% 84% 3.0 - 5.9 Units 32% 0% 68% 6.0 - 8.9 Units 23% 1% 21% 55% 9.0 - 11.9 Units 15% 18% 22% 46% 12.0 + Units 8% 1% 6% 11% 19% 55%
2016/17
0.1 - 2.9 Units 16% 84% 3.0 - 5.9 Units 34% 3% 63% 6.0 - 8.9 Units 22% 0% 21% 57% 9.0 - 11.9 Units 17% 1% 13% 22% 47% 12.0 + Units 7% 1% 7% 11% 19% 55%
2017/18
0.1 - 2.9 Units 22% 78% 3.0 - 5.9 Units 31% 1% 68% 6.0 - 8.9 Units 25% 1% 21% 53% 9.0 - 11.9 Units 21% 0% 17% 18% 44% 12.0 + Units 8% 1% 9% 9% 13% 60%
2018/19
0.1 - 2.9 Units 13% 88% 3.0 - 5.9 Units 32% 1% 67% 6.0 - 8.9 Units 27% 1% 25% 47% 9.0 - 11.9 Units 21% 3% 18% 25% 34% 12.0 + Units 9% 1% 9% 12% 18% 51%
Five-Year Average --- 84% 66% 53% 44% 56% % Change 2014/15 to 2018/19 --- -7% -10% -45% -57% -14%
SDCCD Office of Institutional Research and Planning 42
Mesa College High School to College Pipeline Summary Report
Table 10. Term and annual persistence
Start Year Fall
Cohorts Term
Persistence Term
Persistence Annual
Persistence Annual
Persistence Count Count % Count %
2013 1,882 1,447 77% 1,082 57%
2014 1,740 1,308 75% 992 57%
2015 1,857 1,407 76% 1,120 60%
2016 1,828 1,397 76% 1,090 60%
2017 1,609 1,196 74% 927 58% Total/5-Year Avg 8,916 6,755 76% 5,211 58%
SDCCD Office of Institutional Research and Planning 43
Mesa College High School to College Pipeline Summary Report
Table 11. English course retention and success rates of first-time to college graduates in their first term compared to all others (Cont. next page)
Enrollments Retention Retention Success Success
Count Count Rate Counts Rate
First-time students who enrolled in
English in their first year
Basic Skills
2014/15 500 470 94% 383 77%
2015/16 740 684 92% 558 75%
2016/17 668 616 92% 504 75%
2017/18 430 399 93% 306 71%
2018/19 277 250 90% 189 68%
Total 2,615 2,419 93% 1,940 74%
Transfer-level
2014/15 280 249 89% 202 72%
2015/16 436 404 93% 337 77%
2016/17 589 530 90% 436 74%
2017/18 691 616 89% 462 67%
2018/19 777 673 87% 533 69%
Total 2,773 2,472 89% 1,970 71% Total 5,388 4,891 91% 3,910 73%
SDCCD Office of Institutional Research and Planning 44
Mesa College High School to College Pipeline Summary Report
Table 11. (Cont.)
Enrollments Retention Retention Success Success
Count Count Rate Counts Rate
All other students
Basic Skills
2014/15 344 313 91% 248 72%
2015/16 462 399 86% 296 64%
2016/17 309 251 81% 186 60%
2017/18 213 183 86% 144 68%
2018/19 148 113 76% 77 52%
Total 1,476 1,259 85% 951 64%
Transfer-level
2014/15 351 326 93% 272 77%
2015/16 1,012 895 88% 733 72%
2016/17 1,481 1,287 87% 1,044 70%
2017/18 1,464 1,261 86% 985 67%
2018/19 1,343 1,152 86% 906 67%
Total 5,651 4,921 87% 3,940 70% Total 7,127 6,180 87% 4,891 69%
Source: SDCCD Information System Note 1. Tutoring and cancelled classes are excluded. Only students enrolled as of official census are counted in the enrollments. Note 2. Students who enrolled within four years of high school completion are first-time to college high school graduates. Note 3. ‘All other students’ encompasses all students who were not first-time to college high school graduates.
SDCCD Office of Institutional Research and Planning 45
Mesa College High School to College Pipeline Summary Report
Table 12. Math course retention and success rates of first-time to college graduates in their first term compared to all others
Enrollments Retention Retention Success Success
Count Count Rate Counts Rate
First-time students who
enrolled in Math in their first year
Associate
2014/15 170 143 84% 88 52% 2015/16 206 169 82% 112 54% 2016/17 161 136 84% 85 53% 2017/18 188 151 80% 101 54% 2018/19 330 252 76% 145 44% Total 1,055 851 81% 531 50%
Basic Skills
2014/15 428 388 91% 244 57% 2015/16 429 397 93% 266 62% 2016/17 380 334 88% 214 56% 2017/18 312 283 91% 182 58% 2018/19 98 84 86% 59 60% Total 1,647 1,486 90% 965 59%
Transfer-level
2014/15 254 217 85% 154 61% 2015/16 345 306 89% 234 68% 2016/17 346 303 88% 224 65% 2017/18 384 333 87% 237 62% 2018/19 451 380 84% 260 58% Total 1,780 1,539 86% 1,109 62%
Total 4,482 3,876 86% 2,605 58% (Cont. next page)
SDCCD Office of Institutional Research and Planning 46
Mesa College High School to College Pipeline Summary Report
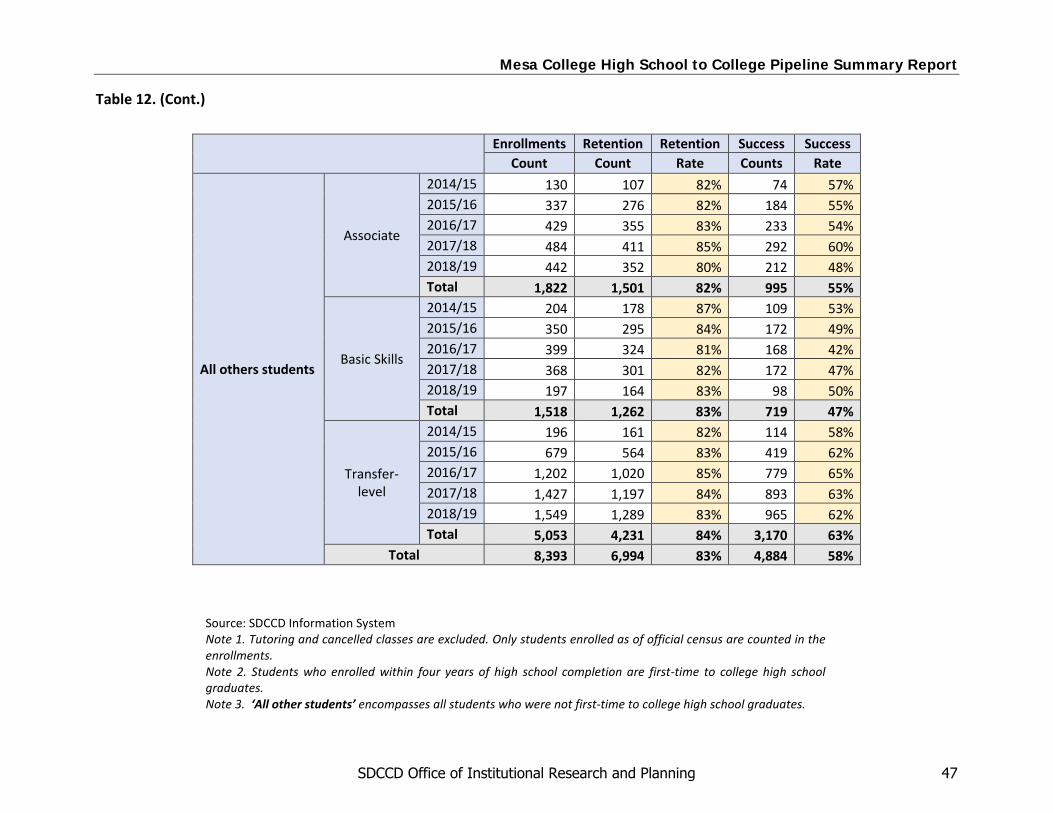
Table 12. (Cont.)
Enrollments Retention Retention Success Success Count Count Rate Counts Rate
All others students
Associate
2014/15 130 107 82% 74 57% 2015/16 337 276 82% 184 55% 2016/17 429 355 83% 233 54% 2017/18 484 411 85% 292 60% 2018/19 442 352 80% 212 48% Total 1,822 1,501 82% 995 55%
Basic Skills
2014/15 204 178 87% 109 53% 2015/16 350 295 84% 172 49% 2016/17 399 324 81% 168 42% 2017/18 368 301 82% 172 47% 2018/19 197 164 83% 98 50% Total 1,518 1,262 83% 719 47%
Transfer-level
2014/15 196 161 82% 114 58% 2015/16 679 564 83% 419 62% 2016/17 1,202 1,020 85% 779 65% 2017/18 1,427 1,197 84% 893 63% 2018/19 1,549 1,289 83% 965 62% Total 5,053 4,231 84% 3,170 63%
Total 8,393 6,994 83% 4,884 58%
Source: SDCCD Information System Note 1. Tutoring and cancelled classes are excluded. Only students enrolled as of official census are counted in the enrollments. Note 2. Students who enrolled within four years of high school completion are first-time to college high school graduates. Note 3. ‘All other students’ encompasses all students who were not first-time to college high school graduates.
SDCCD Office of Institutional Research and Planning 47
Mesa College High School to College Pipeline Summary Report
Table 13. Completion of transfer-level Math and English in first year by students who attended high school in Mesa service area
Passed Transfer-level English and Transfer-level
Math in first year
2014/15 2015/16 2016/17 2017/18 2018/19
Count Rate Count Rate Count Rate Count Rate Count Rate
Did not pass 268 71% 296 71% 338 74% 317 77% 304 85%
Passed 107 29% 121 29% 118 26% 96 23% 55 15%
Total 375 100% 417 100% 456 100% 413 100% 359 100%
SDCCD Office of Institutional Research and Planning 48
English MMAP Logic Tree
Did you graduate from a
US High School?US Students
What was the last English class
you’ve completed, and what grade was received?
What is/was your cumulative High
School GPA?
All Other Responses
Continue regardless of class/grade
Transfer LevelEnglishIf >= 2.6
If < 2.6English 47a or English 101x
HiSET Students HiSET Scores
Transfer LevelEnglishIf >= 15
If < 15English 47a or English 101x
GED Students GED Scores
Transfer LevelEnglishIf >= 165
If < 165English 47a or English 101x
Mesa College High School to College Pipeline Summary Report
Figure 1. English and Math Sequences for Mesa College
SDCCD Office of Institutional Research and Planning 49
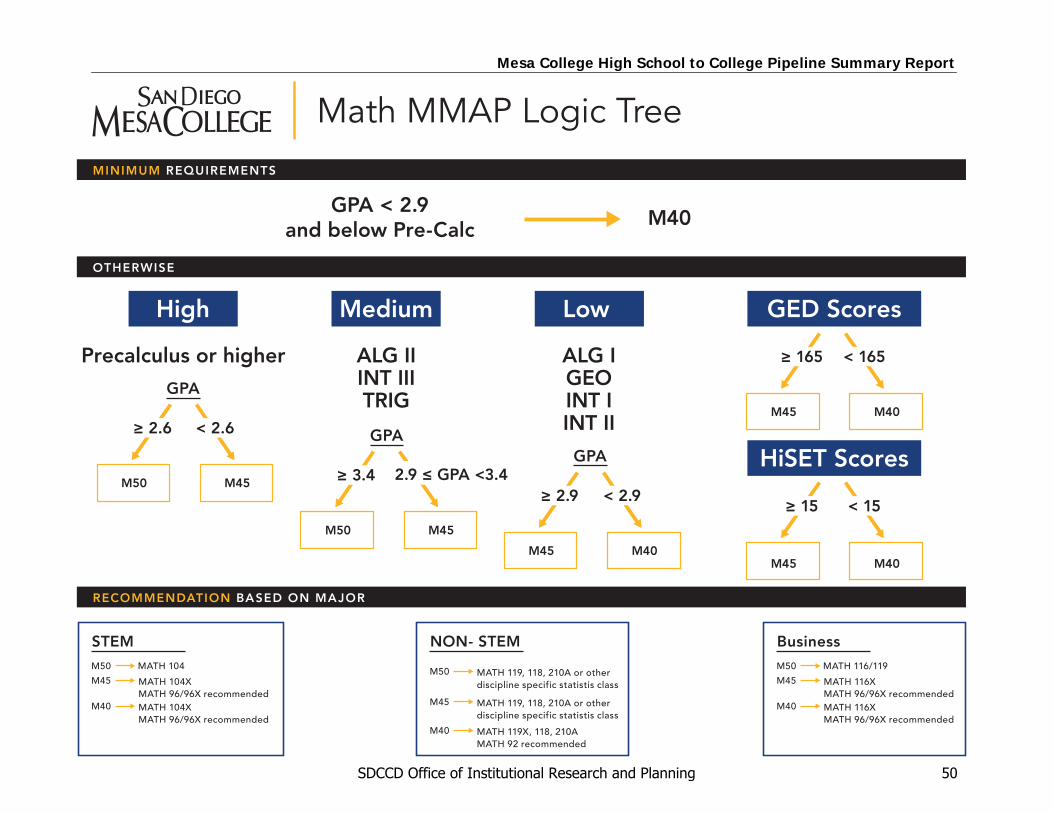
Math MMAP Logic Tree
High
Precalculus or higherGPA
M50
RECOMMENDATION BASED ON MAJOR
OTHERWISE
MINIMUM REQUIREMENTS
Medium
ALG IIINT IIITRIG
Low
ALG IGEOINT IINT II ≥ 2.6 < 2.6
GPA
≥ 2.9 < 2.9
GPA
≥ 3.4 2.9 ≤ GPA <3.4M45
M50 M45
GED Scores
≥ 165 < 165
M45 M40
HiSET Scores
≥ 15 < 15
M45 M40M45 M40
M50 MATH 104
STEM
M45 MATH 104XMATH 96/96X recommended
M40 MATH 104XMATH 96/96X recommended
NON- STEM
M40 MATH 119X, 118, 210AMATH 92 recommended
M50 MATH 119, 118, 210A or otherdiscipline specific statistis class
M45 MATH 119, 118, 210A or otherdiscipline specific statistis class
M50 MATH 116/119
Business
M45 MATH 116XMATH 96/96X recommended
M40 MATH 116XMATH 96/96X recommended
GPA < 2.9and below Pre-Calc M40
Mesa College High School to College Pipeline Summary Report
SDCCD Office of Institutional Research and Planning 50