Embed Size (px)
Citation preview
Merton ALG Residents Survey 2006/07
NOT FOR DISTRIBUTION
LONDON DATA UNDER EMBARGO UNTIL
8th JANUARY 2007
Merton Residents Survey 2006
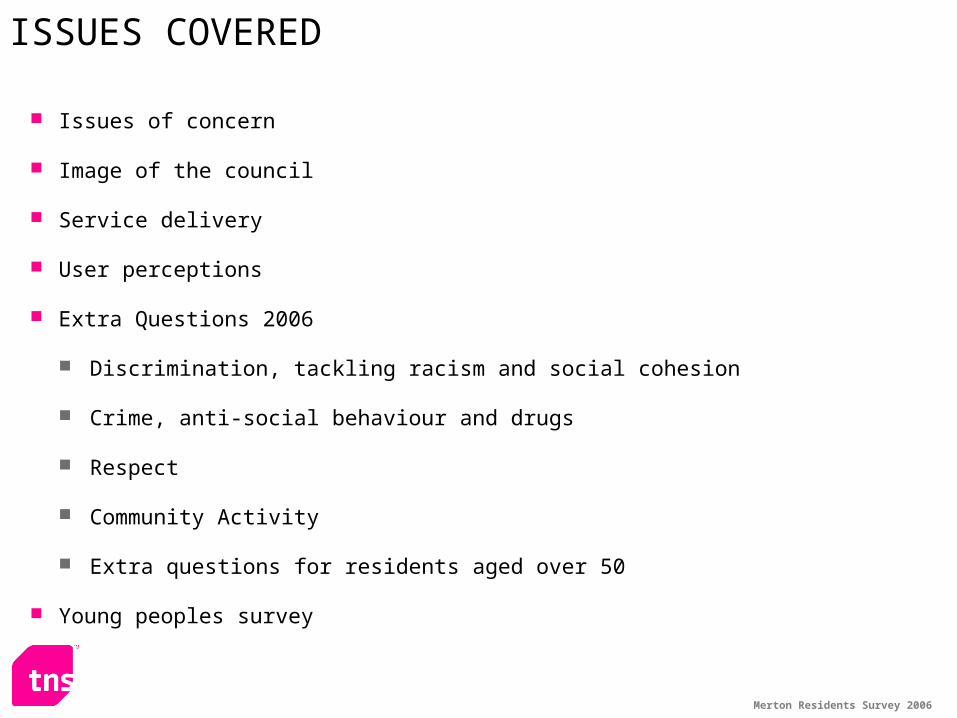
Issues of concern
Image of the council
Service delivery
User perceptions
Extra Questions 2006
Discrimination, tackling racism and social cohesion
Crime, anti-social behaviour and drugs
Respect
Community Activity
Extra questions for residents aged over 50
Young peoples survey
ISSUES COVERED
Merton Residents Survey 2006
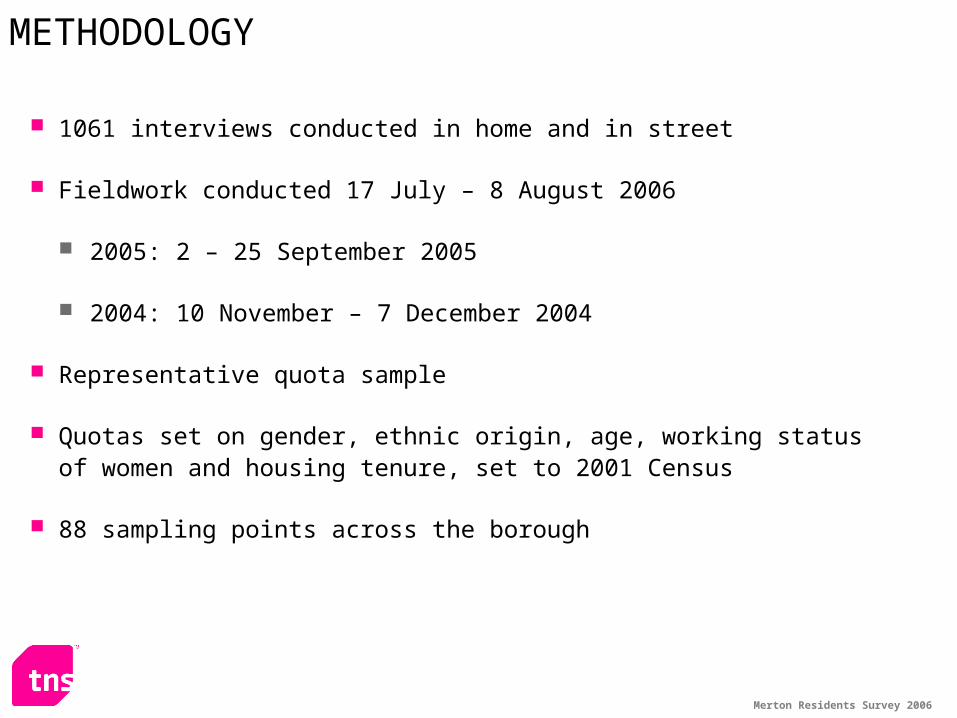
1061 interviews conducted in home and in street
Fieldwork conducted 17 July – 8 August 2006
2005: 2 – 25 September 2005
2004: 10 November – 7 December 2004
Representative quota sample
Quotas set on gender, ethnic origin, age, working status of women and housing tenure, set to 2001 Census
88 sampling points across the borough
METHODOLOGY
Merton Residents Survey 2006
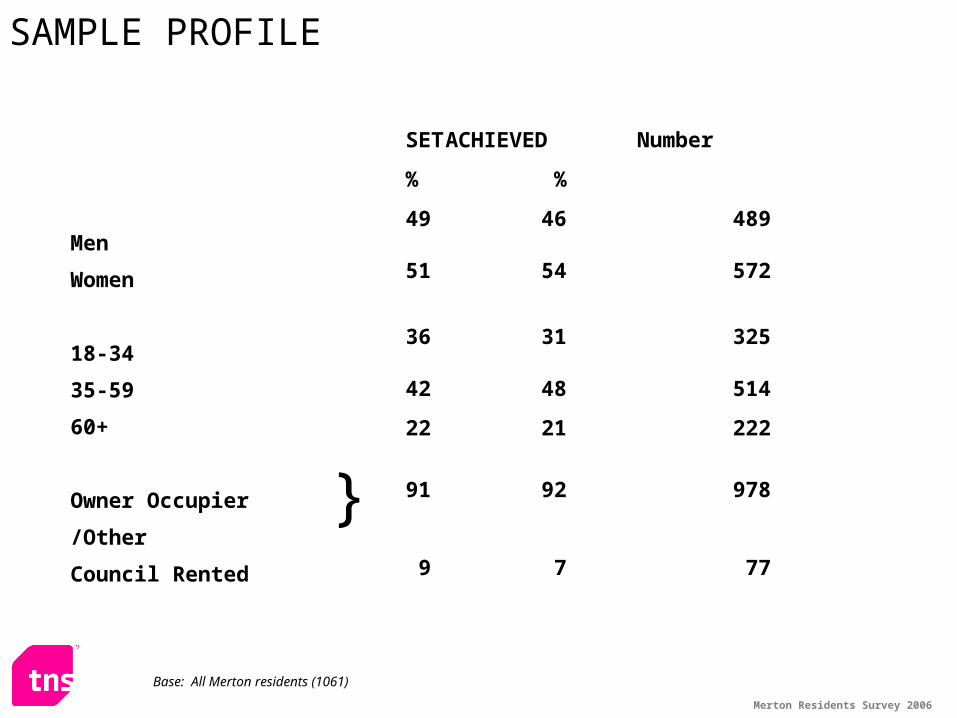
Men
Women
18-34
35-59
60+
Owner Occupier
/Other
Council Rented
SET ACHIEVED Number
% %
49 46 489
51 54 572
36 31 325
42 48 514
22 21 222
91 92 978
9 7 77
}
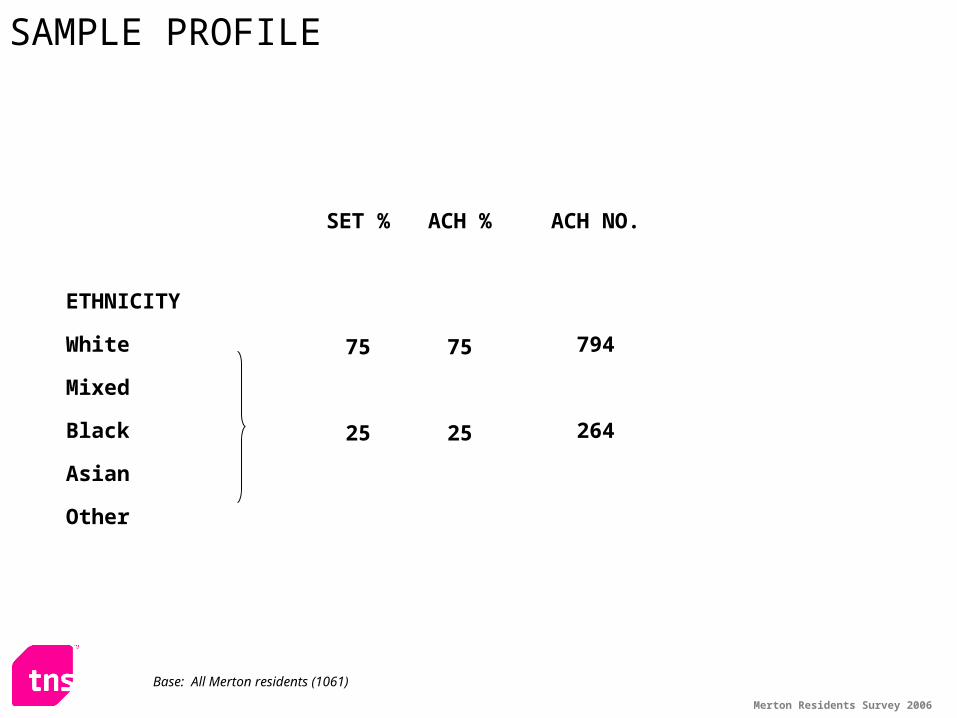
SAMPLE PROFILE
Base: All Merton residents (1061)
Merton Residents Survey 2006
SET % ACH % ACH NO.
ETHNICITY
White 75 75 794
Mixed
Black 25 25 264
Asian
Other
Base: All Merton residents (1061)
SAMPLE PROFILE

Areas of Personal Concern
Merton Residents Survey 2006
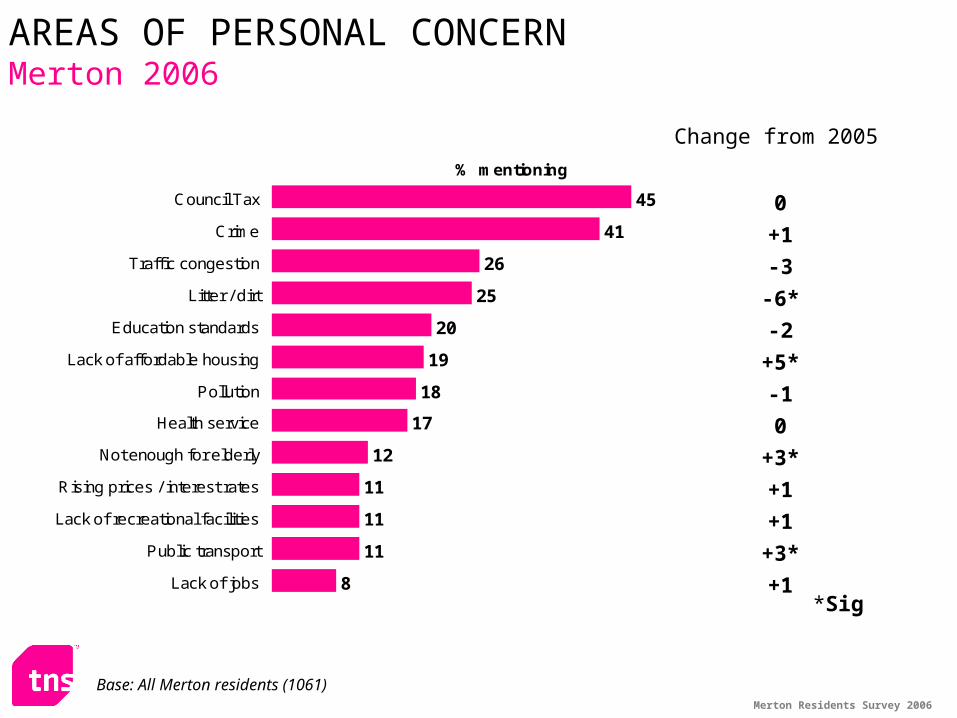
45
41
26
25
20
19
18
17
12
11
11
11
8
Council Tax
Crime
Traffic congestion
Litter / dirt
Education standards
Lack of affordable housing
Pollution
Health service
Not enough for elderly
Rising prices / interest rates
Lack of recreational facilities
Public transport
Lack of jobs
% mentioning
Base: All Merton residents (1061)
Change from 2005
*Sig
0
+1
-3
-6*
-2
+5*
-1
0
+3*
+1
+1
+3*
+1
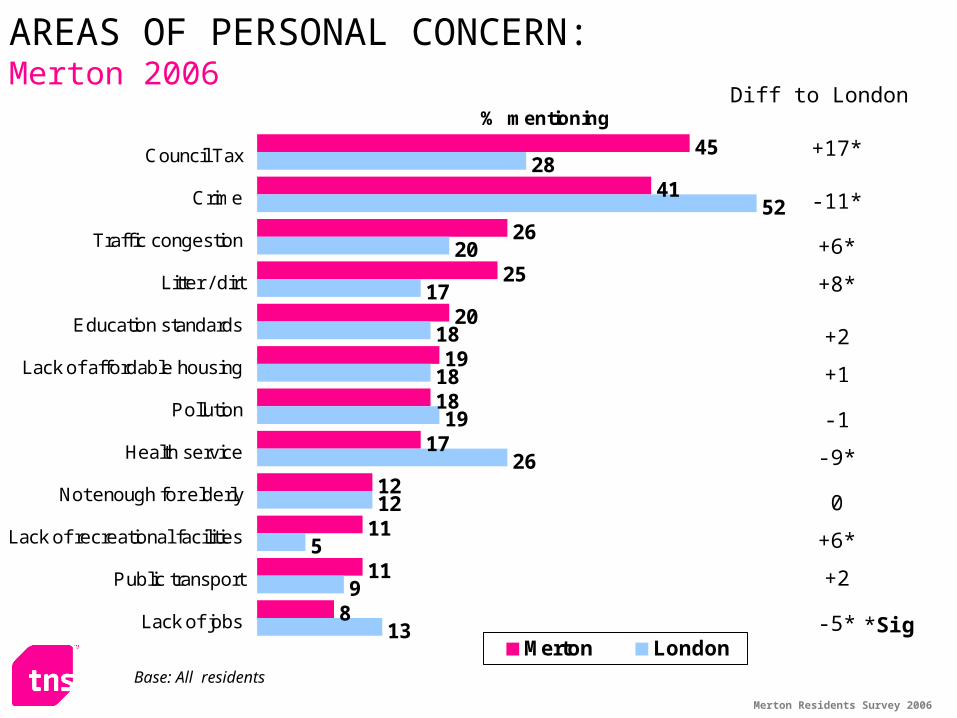
AREAS OF PERSONAL CONCERNMerton 2006

Merton Residents Survey 2006
UP: %Lack of affordable housing +5Not enough for elderly +3Public transport +3
DOWNLitter / dirt - 6
CHANGES IN AREAS OF CONCERN SINCE 2005
Merton Residents Survey 2006
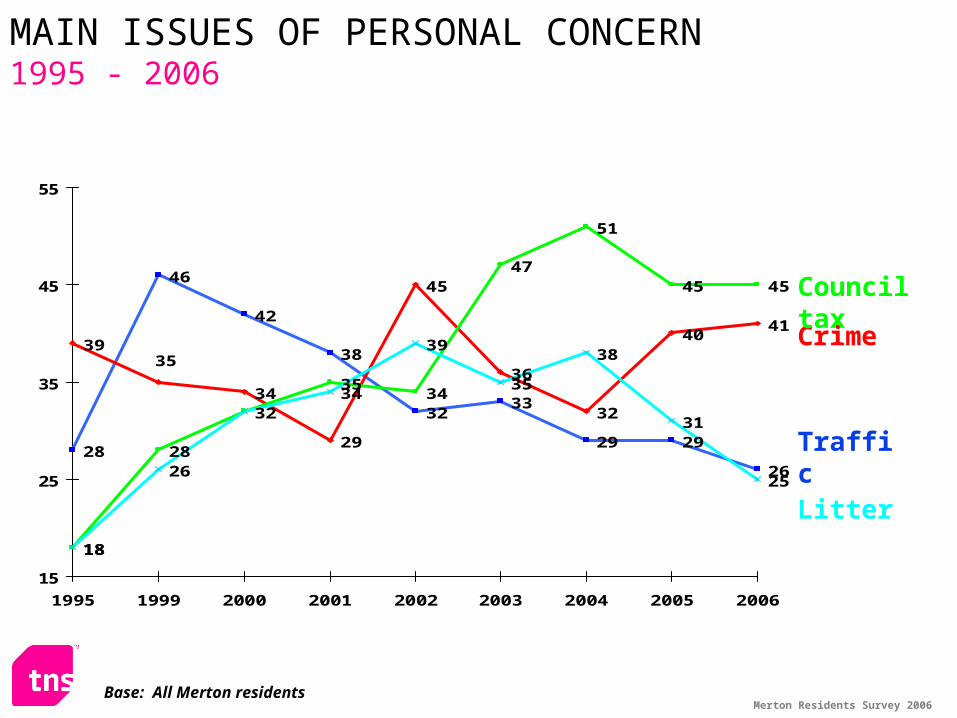
MAIN ISSUES OF PERSONAL CONCERN 1995 - 2006
28
46
42
38
3233
29 29
26
39
34
29
45
36
32
4041
18
28
3534
47
51
45 45
26
35
38
31
25
3539
34
18
32
15
25
35
45
55
1995 1999 2000 2001 2002 2003 2004 2005 2006
Base: All Merton residents
Traffic
Crime
Council tax
Litter
Merton Residents Survey 2006
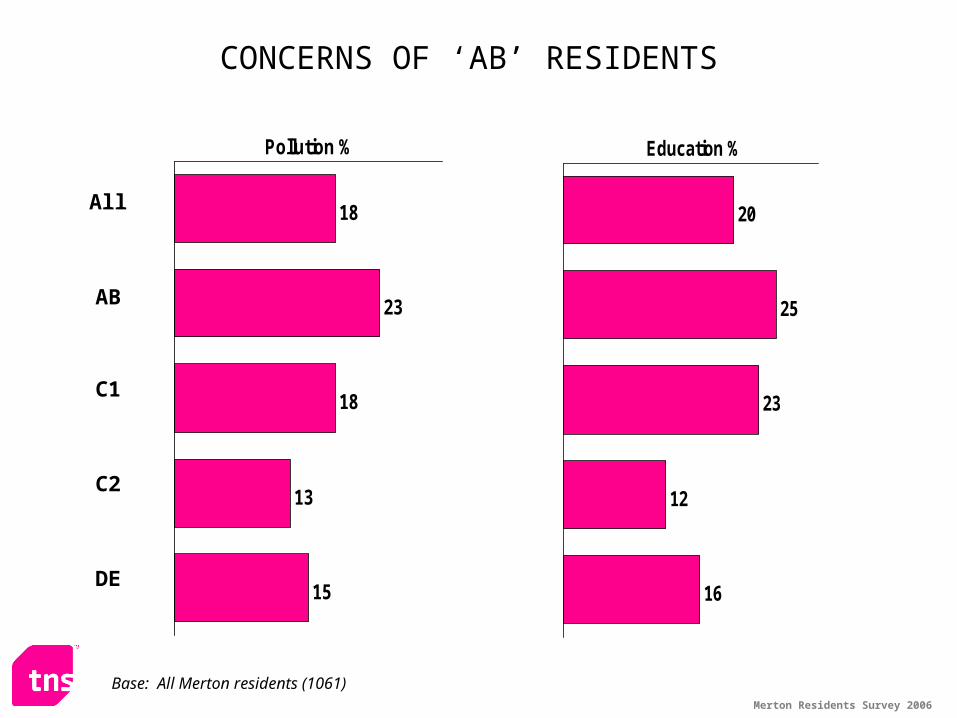
CONCERNS OF ‘AB’ RESIDENTS
18
23
18
13
15
Pollution %
All
AB
C1
C2
DE
20
25
23
12
16
Education %
Base: All Merton residents (1061)
Merton Residents Survey 2006
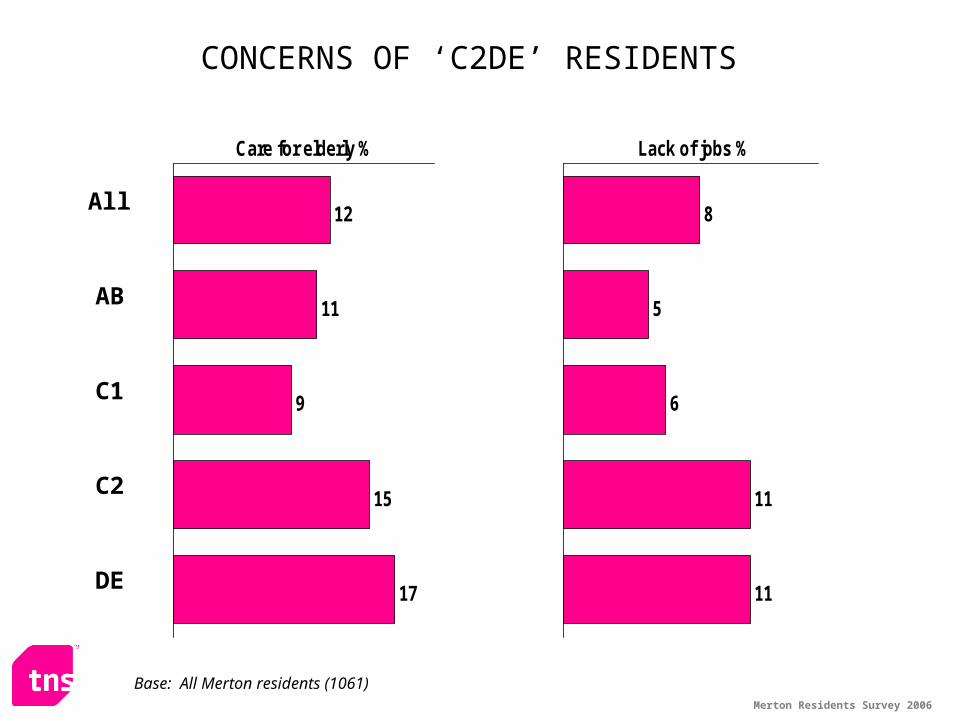
CONCERNS OF ‘C2DE’ RESIDENTS
12
11
9
15
17
Care for elderly %
All
AB
C1
C2
DE
8
5
6
11
11
Lack of jobs %
Base: All Merton residents (1061)
Merton Residents Survey 2006
Base: All residents
Diff to London
*Sig
+17*
-11*
+6*
+8*
+2
+1
-1
-9*
0
+6*
AREAS OF PERSONAL CONCERN: Merton 2006
-5*
+2
45
41
26
25
20
19
18
17
12
11
11
8
28
52
20
17
18
18
19
26
12
5
9
13
Council Tax
Crime
Traffic congestion
Litter / dirt
Education standards
Lack of affordable housing
Pollution
Health service
Not enough for elderly
Lack of recreational facilities
Public transport
Lack of jobs
% mentioning
Merton London
Merton Residents Survey 2006
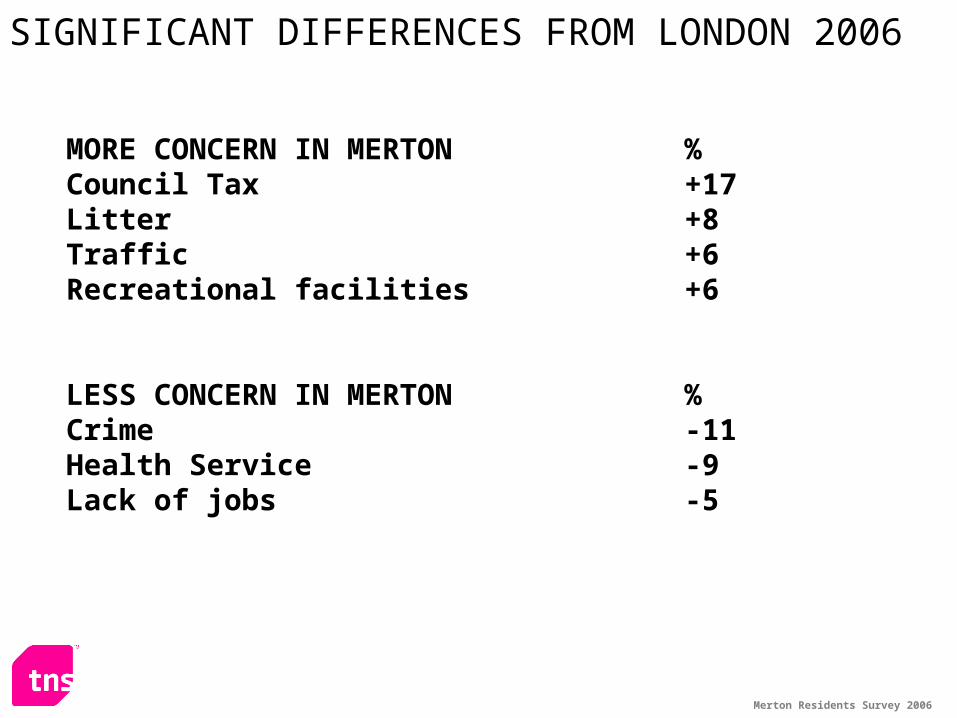
MORE CONCERN IN MERTON %Council Tax +17Litter +8Traffic +6Recreational facilities +6
LESS CONCERN IN MERTON %Crime -11Health Service -9Lack of jobs -5
SIGNIFICANT DIFFERENCES FROM LONDON 2006

Image of the council
Merton Residents Survey 2006
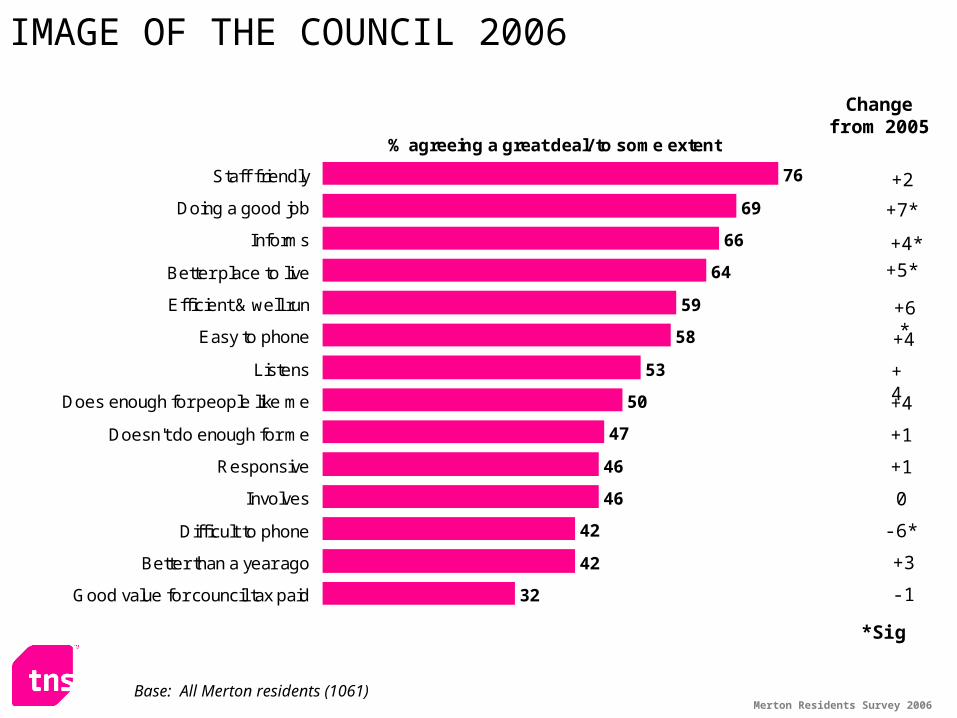
69
66
64
59
58
53
50
47
46
46
42
42
32
76Staff friendly
Doing a good job
Informs
Better place to live
Efficient & well run
Easy to phone
Listens
Does enough for people like me
Doesn't do enough for me
Responsive
Involves
Difficult to phone
Better than a year ago
Good value for council tax paid
% agreeing a great deal/ to some extent
Changefrom 2005
*Sig
+2
+7*
+5*
+6*
+4
+4+4
+1
0
-1
Base: All Merton residents (1061)
+4*
-6*
IMAGE OF THE COUNCIL 2006
+1
+3
Merton Residents Survey 2006
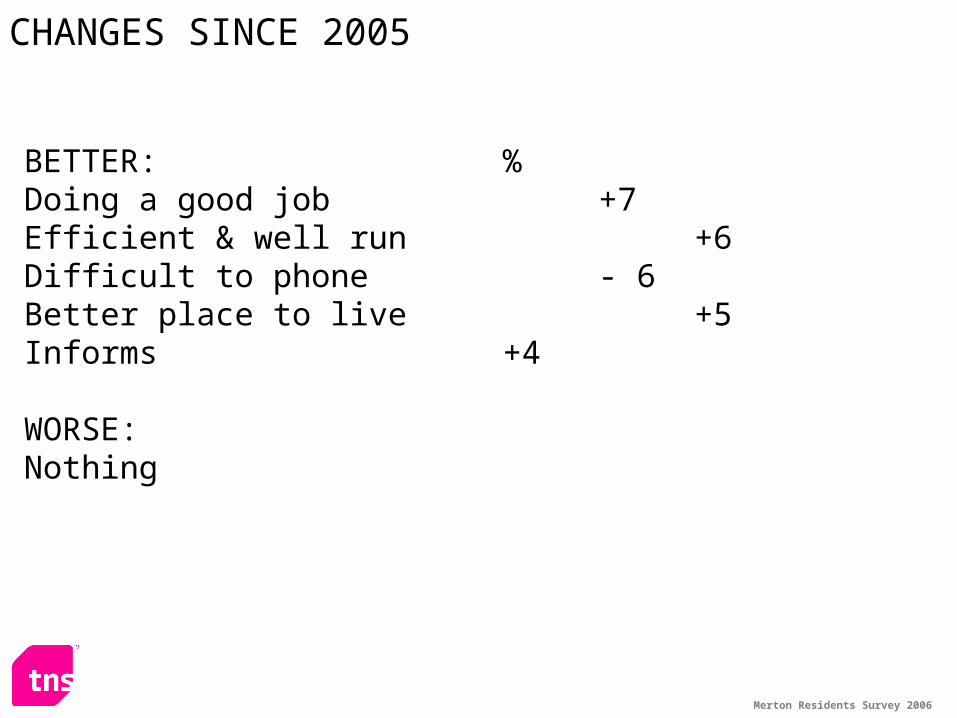
BETTER: %Doing a good job +7Efficient & well run +6Difficult to phone - 6Better place to live +5Informs +4
WORSE:Nothing
CHANGES SINCE 2005
Merton Residents Survey 2006
79
69
64
57 57
68
62 62
6972
59
53
4846
5755
53
59
52
35
3027
32
42
37
33 32
20
30
40
50
60
70
80
1995 1999 2000 2001 2002 2003 2004 2005 2006
Good job
Efficient
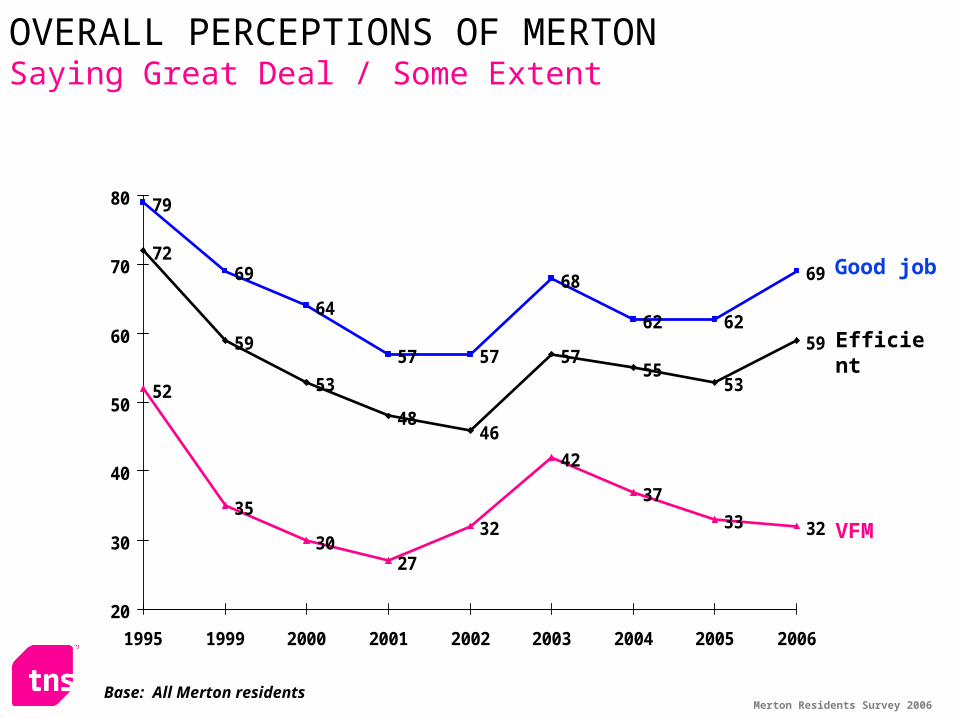
OVERALL PERCEPTIONS OF MERTON Saying Great Deal / Some Extent
Base: All Merton residents
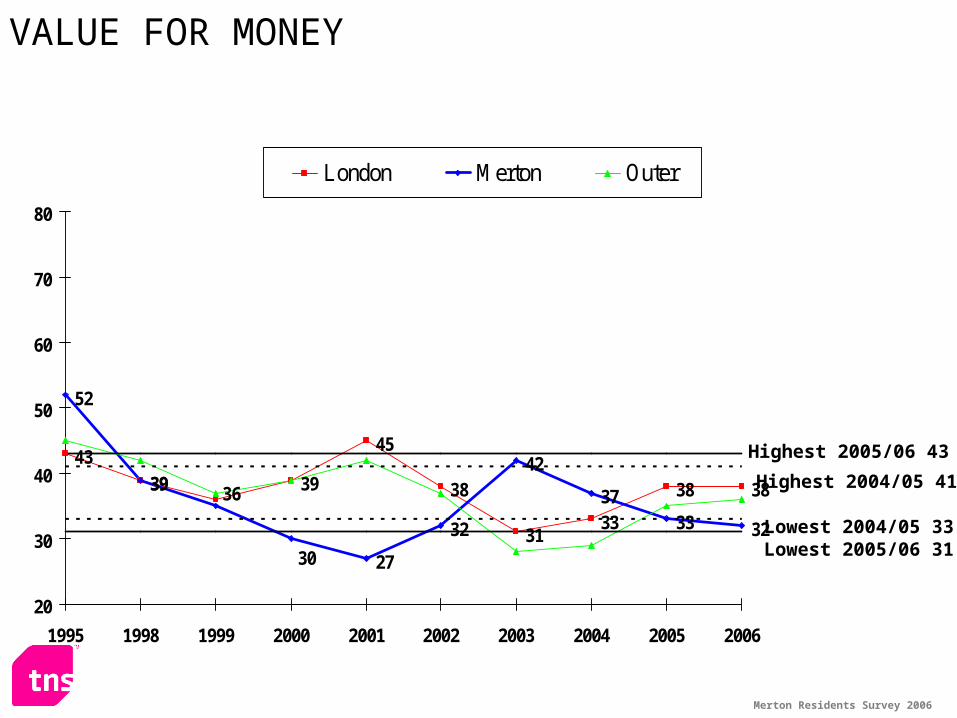
VFM
Merton Residents Survey 2006
6259 58
646766
79
57 57
68
62 62
69
66
6163
58
66
69
64
30
40
50
60
70
80
1991 1995 1999 2000 2001 2002 2003 2004 2005 2006
London Merton Outer
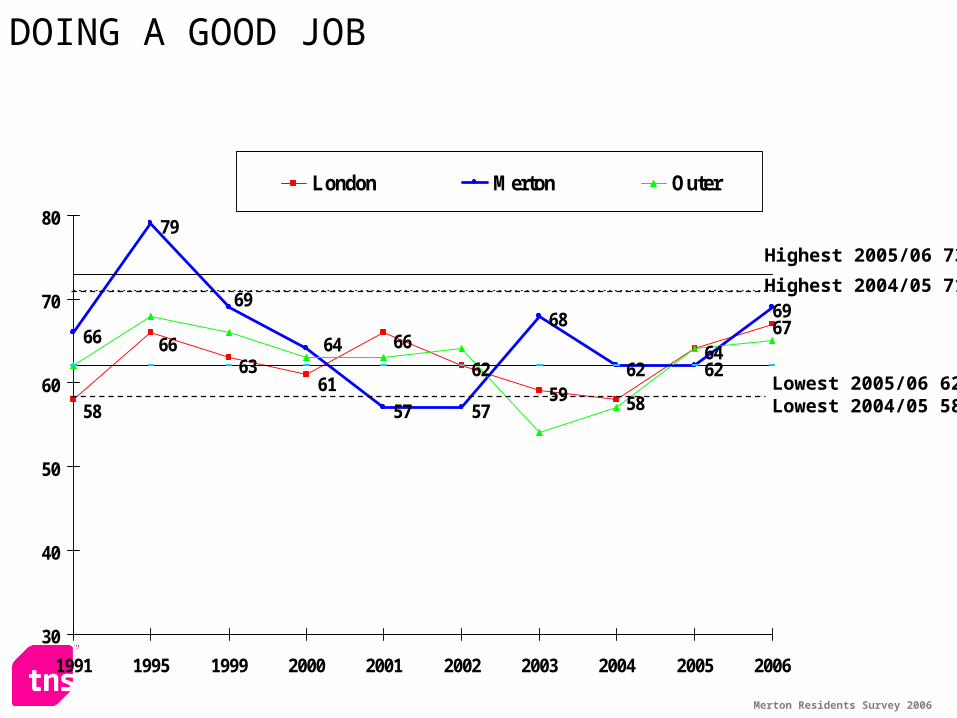
DOING A GOOD JOB
Highest 2004/05 71
Highest 2005/06 73
Lowest 2004/05 58Lowest 2005/06 62
Merton Residents Survey 2006
3236 36
4246
44
3236
40 394241
3434
2826
10
20
30
40
50
60
70
80
1999 2000 2001 2002 2003 2004 2005 2006
London Merton Outer
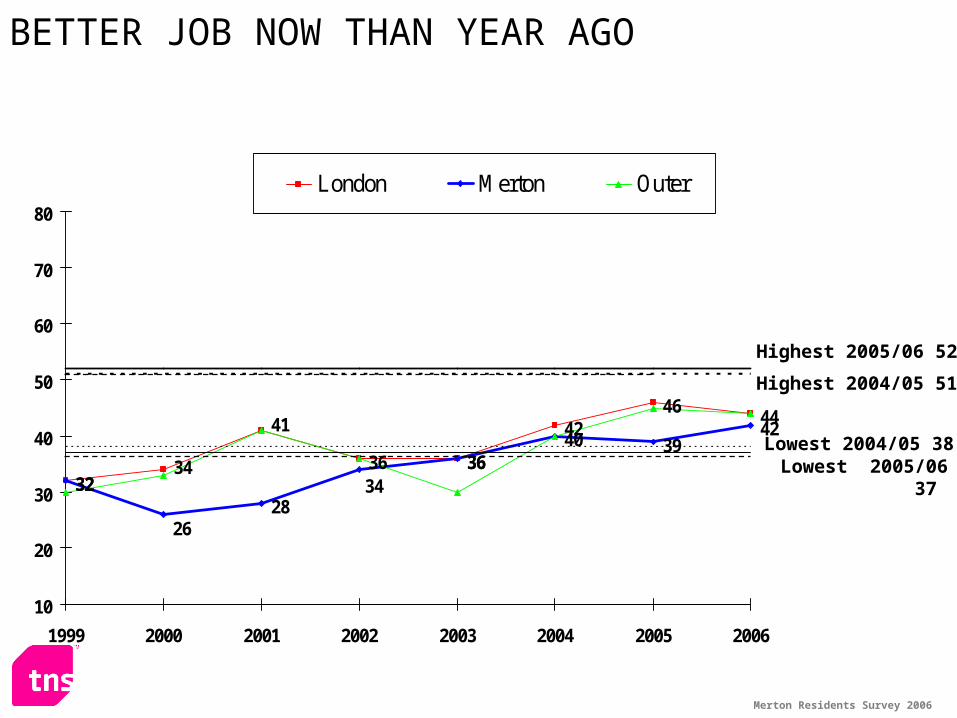
BETTER JOB NOW THAN YEAR AGO
Highest 2005/06 52
Lowest 2004/05 38 Lowest 2005/06 37
Highest 2004/05 51
Merton Residents Survey 2006
43
39 39
45
38
3133
38 38
52
27
32
42
3733 32
36
30
39
20
30
40
50
60
70
80
1995 1998 1999 2000 2001 2002 2003 2004 2005 2006
London Merton Outer
VALUE FOR MONEY
Highest 2004/05 41
Lowest 2004/05 33 Lowest 2005/06 31
Highest 2005/06 43
Merton Residents Survey 2006
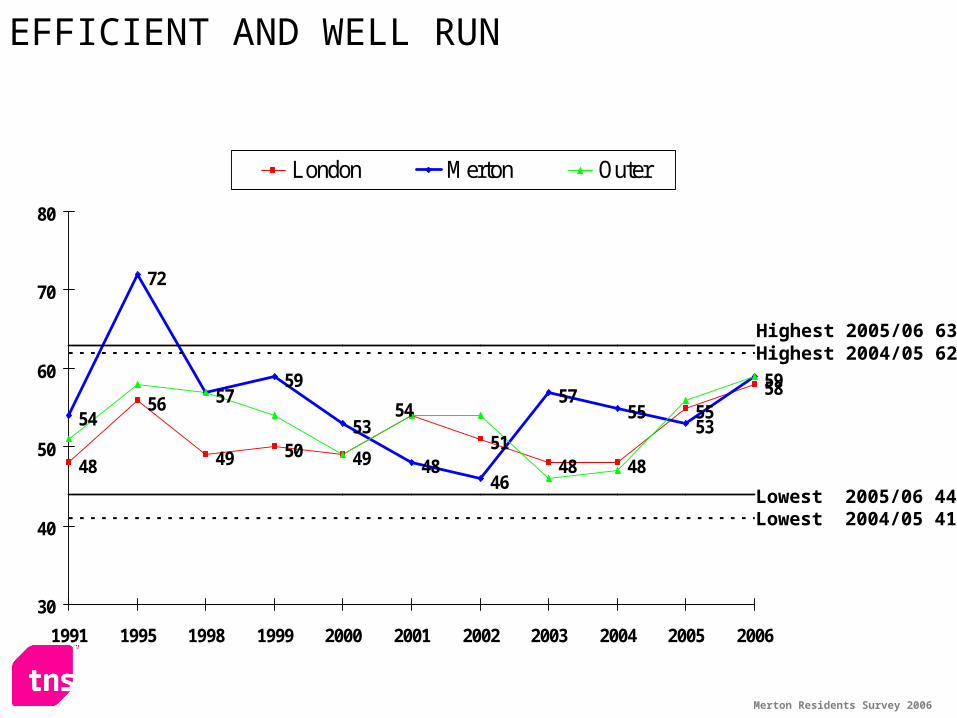
48
56
49 50 4951
48 48
5558
54
72
5759
53
4846
5755
53
59
54
30
40
50
60
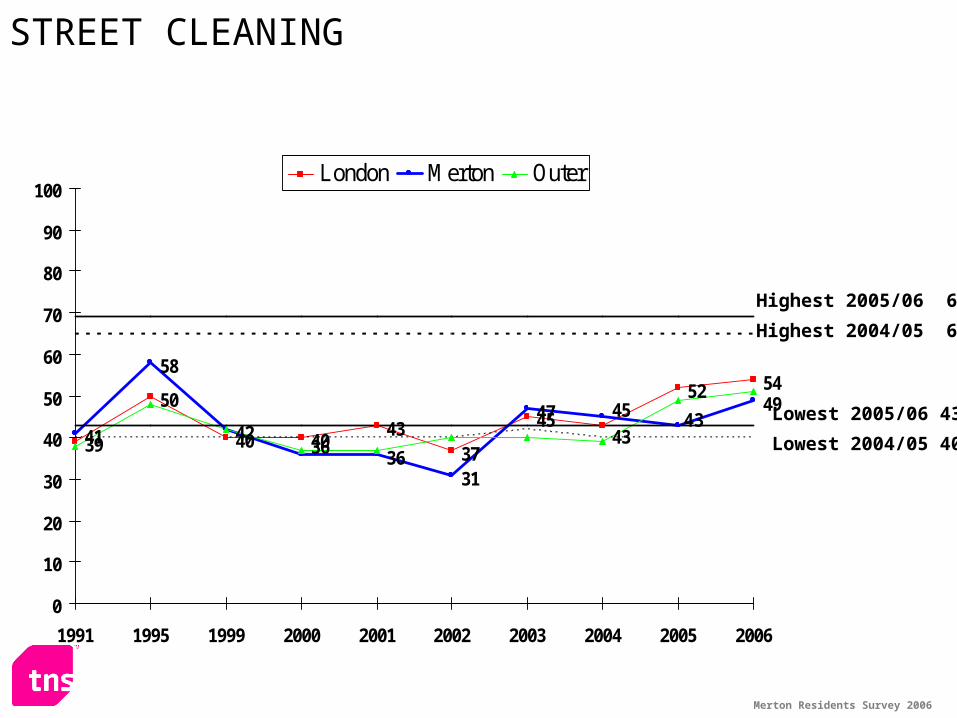
70
80
1991 1995 1998 1999 2000 2001 2002 2003 2004 2005 2006
London Merton Outer
EFFICIENT AND WELL RUN
Highest 2005/06 63
Lowest 2005/06 44Lowest 2004/05 41
Highest 2004/05 62
Merton Residents Survey 2006
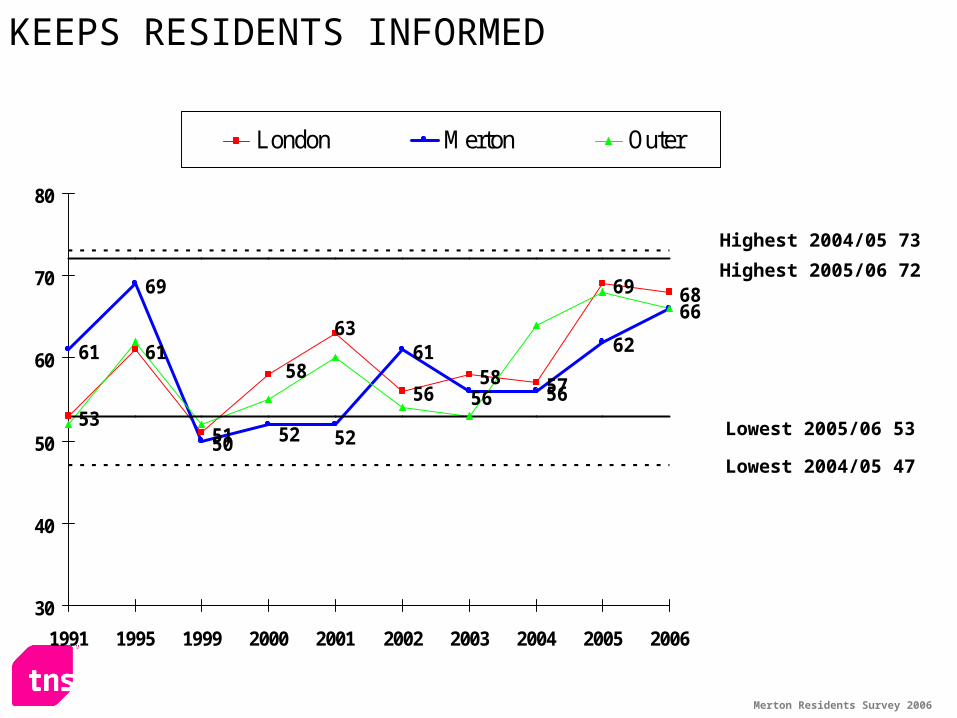
53
61
51
5658 57
69 68
61
50
61
56
62
66
58
63
52
56
69
52
30
40
50
60
70
80
1991 1995 1999 2000 2001 2002 2003 2004 2005 2006
London Merton Outer
KEEPS RESIDENTS INFORMED
Highest 2005/06 72
Highest 2004/05 73
Lowest 2004/05 47
Lowest 2005/06 53
Merton Residents Survey 2006
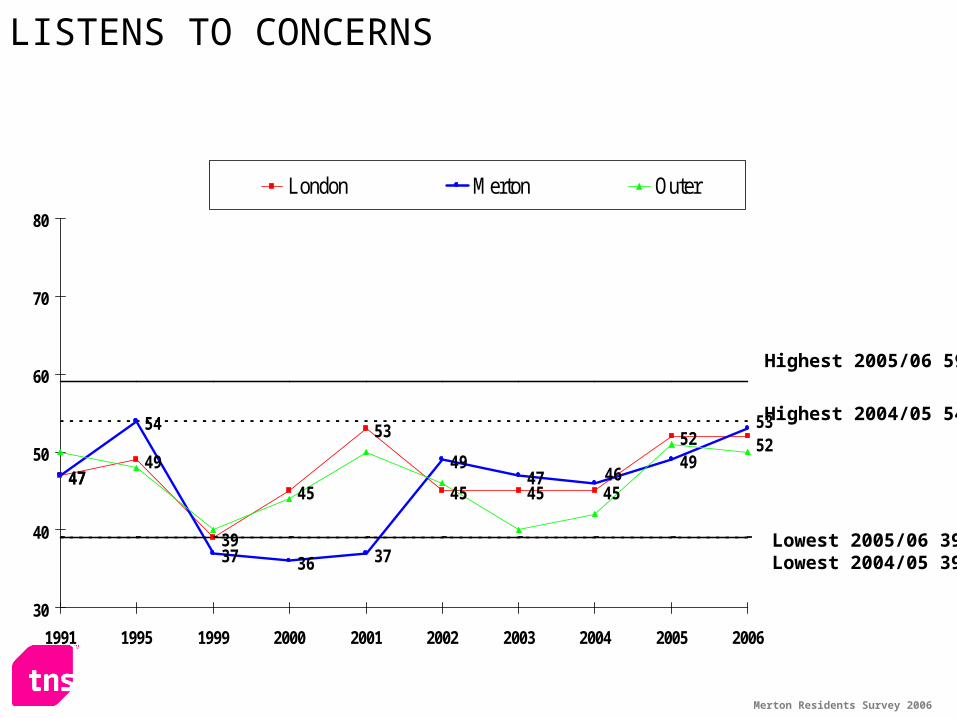
4749
39
45
53
45 45 45
52
47
54
37 36 37
4947
495253
46
30
40
50
60
70
80
1991 1995 1999 2000 2001 2002 2003 2004 2005 2006
London Merton Outer
LISTENS TO CONCERNS
Lowest 2005/06 39Lowest 2004/05 39
Highest 2004/05 54
Highest 2005/06 59
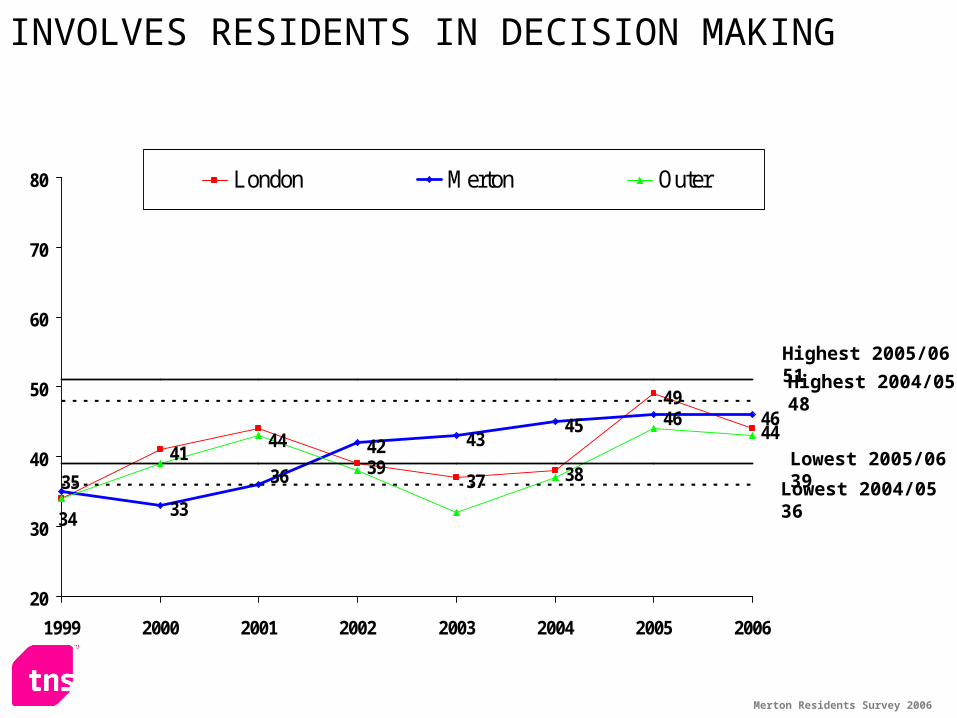
Merton Residents Survey 2006
4139
37 38
49
44
33
42 4345 46 46
34
44
35 36
20
30
40
50
60
70
80
1999 2000 2001 2002 2003 2004 2005 2006
London Merton Outer
INVOLVES RESIDENTS IN DECISION MAKING
Lowest 2005/06 39
Highest 2005/06 51
Highest 2004/05 48
Lowest 2004/05 36
Merton Residents Survey 2006
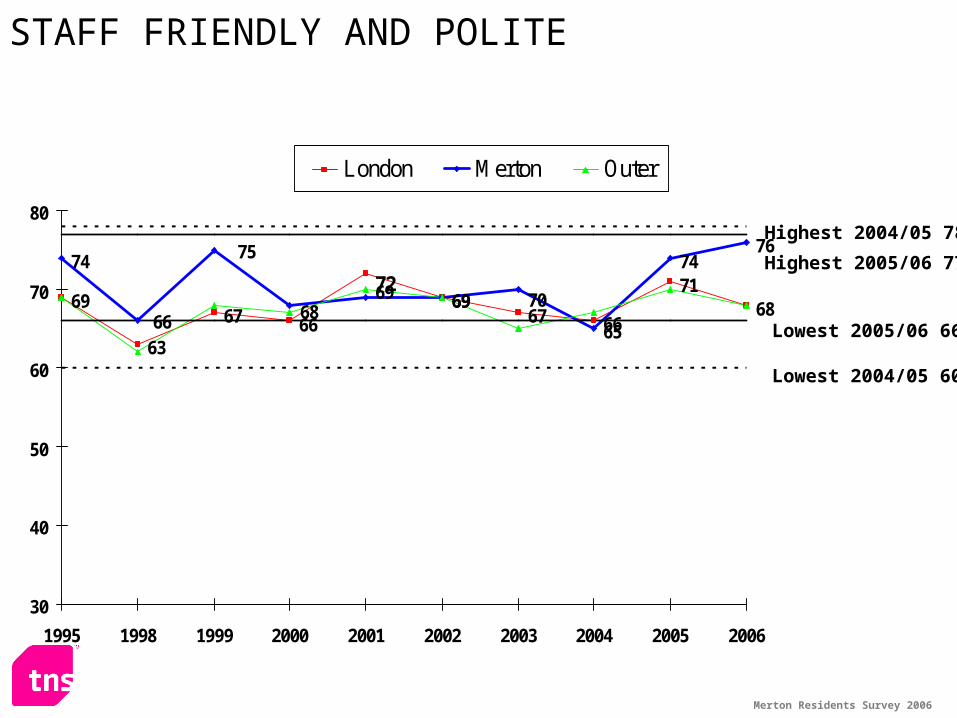
69
63
6769
67 66
7168
74
69
65
7476
66
7270
66 68
75
69
30
40
50
60
70
80
1995 1998 1999 2000 2001 2002 2003 2004 2005 2006
London Merton Outer
STAFF FRIENDLY AND POLITE
Highest 2005/06 77
Lowest 2005/06 66
Lowest 2004/05 60
Highest 2004/05 78
Merton Residents Survey 2006
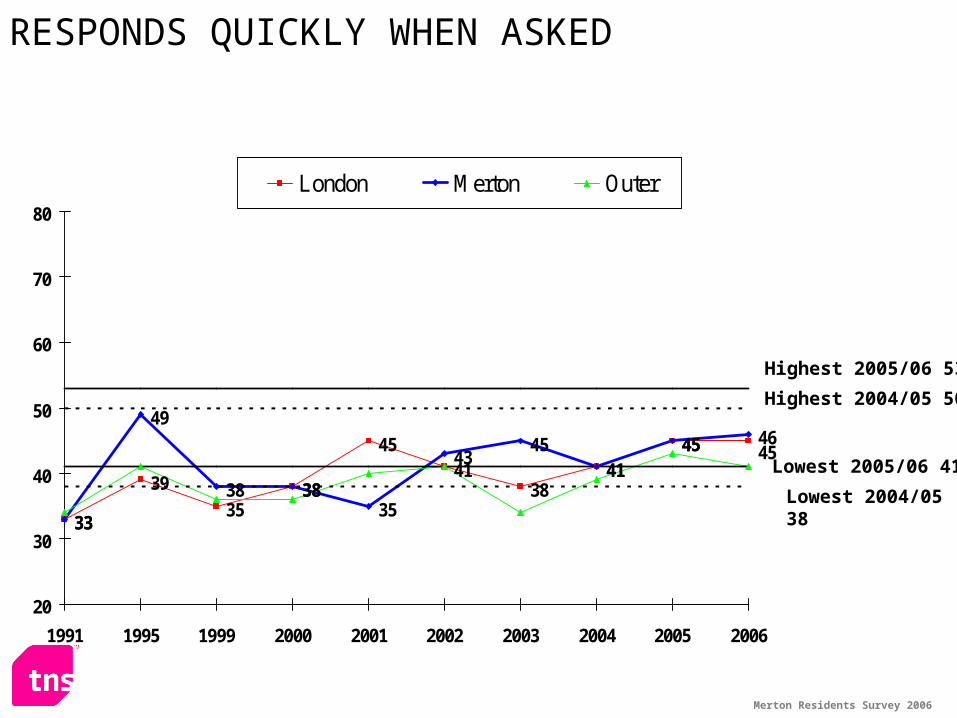
33
38
4541
3841
45
33
49
38 3835
4345
4145 46
45
39
35
20
30
40
50
60
70
80
1991 1995 1999 2000 2001 2002 2003 2004 2005 2006
London Merton Outer
RESPONDS QUICKLY WHEN ASKED
Highest 2005/06 53
Lowest 2005/06 41
Lowest 2004/05 38
Highest 2004/05 50
Merton Residents Survey 2006
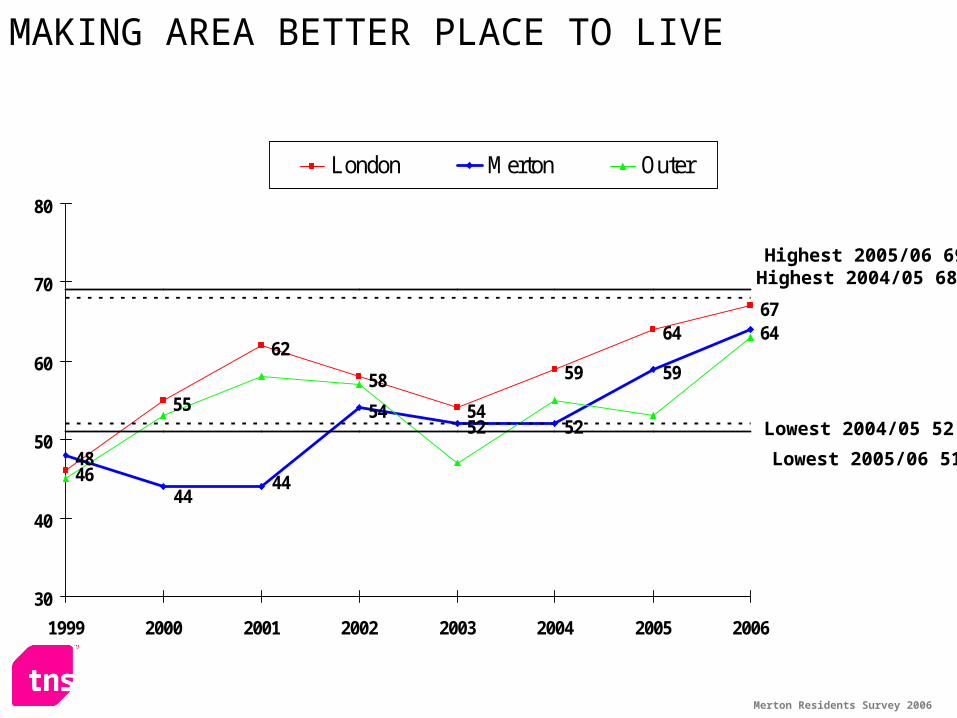
46
55
62
58
54
59
6467
48
5452 52
59
64
4444
30
40
50
60
70
80
1999 2000 2001 2002 2003 2004 2005 2006
London Merton Outer
MAKING AREA BETTER PLACE TO LIVE
Highest 2005/06 69
Lowest 2005/06 51
Lowest 2004/05 52
Highest 2004/05 68
Merton Residents Survey 2006
4240 40
4547 48
4548
46
36
4345
52
48 4851
44
41
47
42
30
40
50
60
70
80
1995 1998 1999 2000 2001 2002 2003 2004 2005 2006
London Merton Outer
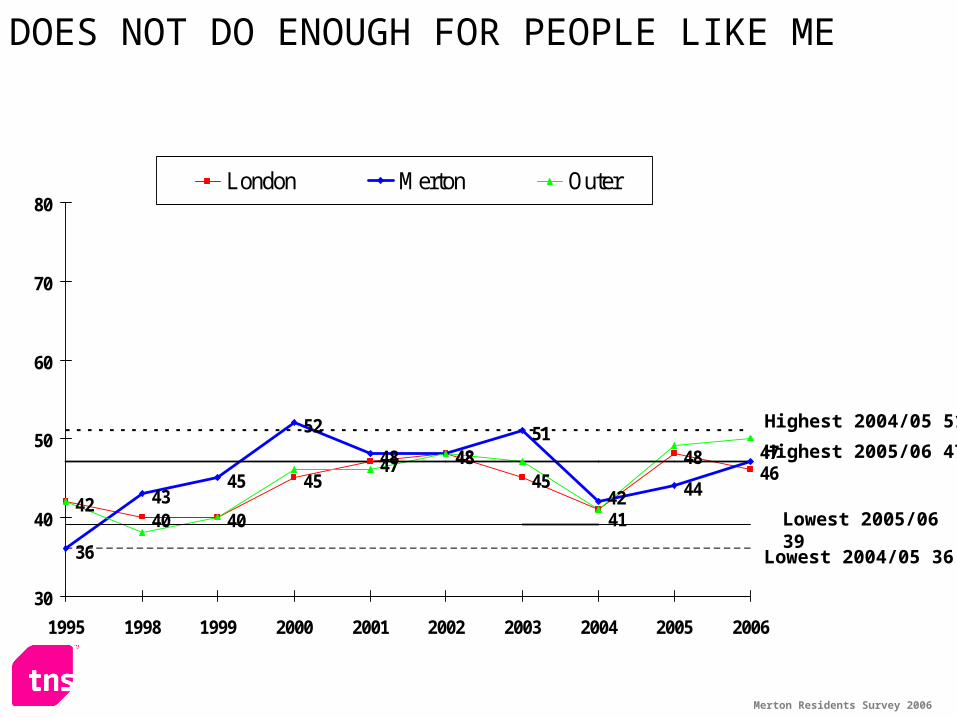
DOES NOT DO ENOUGH FOR PEOPLE LIKE ME
Lowest 2005/06 39
Lowest 2004/05 36
Highest 2004/05 51
Highest 2005/06 47
Merton Residents Survey 2006
46 4745
4745
47
3942
44
51
454241
46
41
48
28
42
20
30
40
50
60
70
80
1991 1995 2000 2001 2002 2003 2004 2005 2006
London Merton Outer
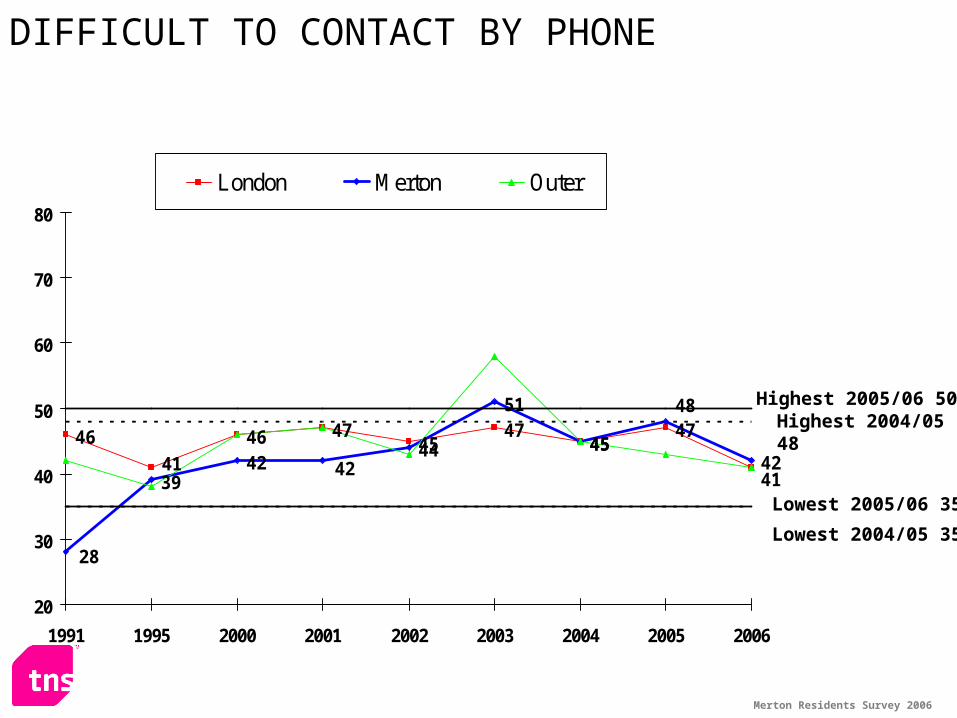
DIFFICULT TO CONTACT BY PHONE
Highest 2005/06 50
Lowest 2004/05 35
Highest 2004/05 48
Lowest 2005/06 35
Merton Residents Survey 2006
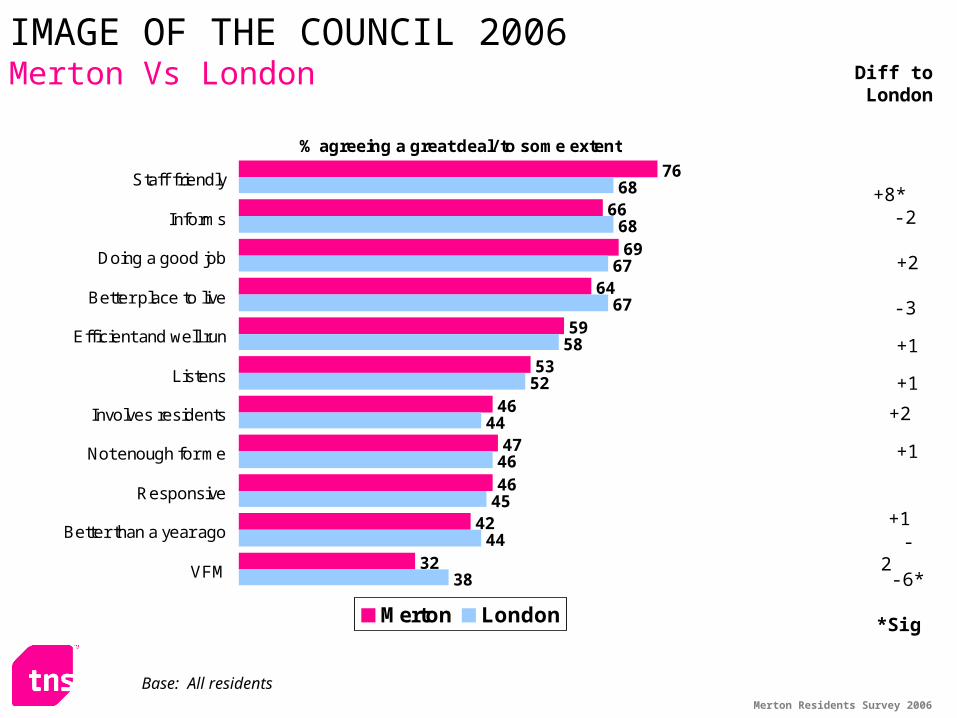
76
66
69
64
59
53
46
47
46
42
32
68
68
67
67
58
52
44
46
45
44
38
Staff friendly
Informs
Doing a good job
Better place to live
Efficient and well run
Listens
Involves residents
Not enough for me
Responsive
Better than a year ago
VFM
% agreeing a great deal/ to some extent
Merton London
Diff to London
*Sig
+8*
-2
Base: All residents
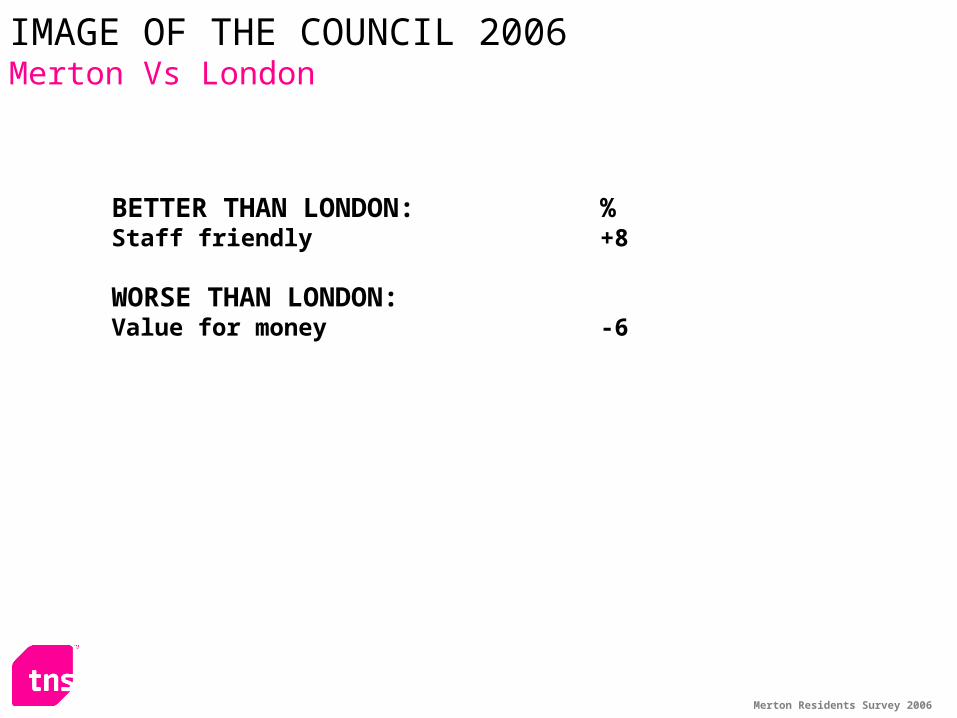
IMAGE OF THE COUNCIL 2006 Merton Vs London
+2
-3
+1
+1
+2
+1
-6*
+1
-2
Merton Residents Survey 2006
BETTER THAN LONDON: %Staff friendly +8
WORSE THAN LONDON:Value for money -6
IMAGE OF THE COUNCIL 2006 Merton Vs London

Service DeliveryService Delivery
Merton Residents Survey 2006Base: All respondents (1061)
108
134
119
1310
211920
718
3086
197
294
10
686866
63606060
5749
4539383737
3330
2421
1914
12
Poor - Extremely Poor Good-Excellent
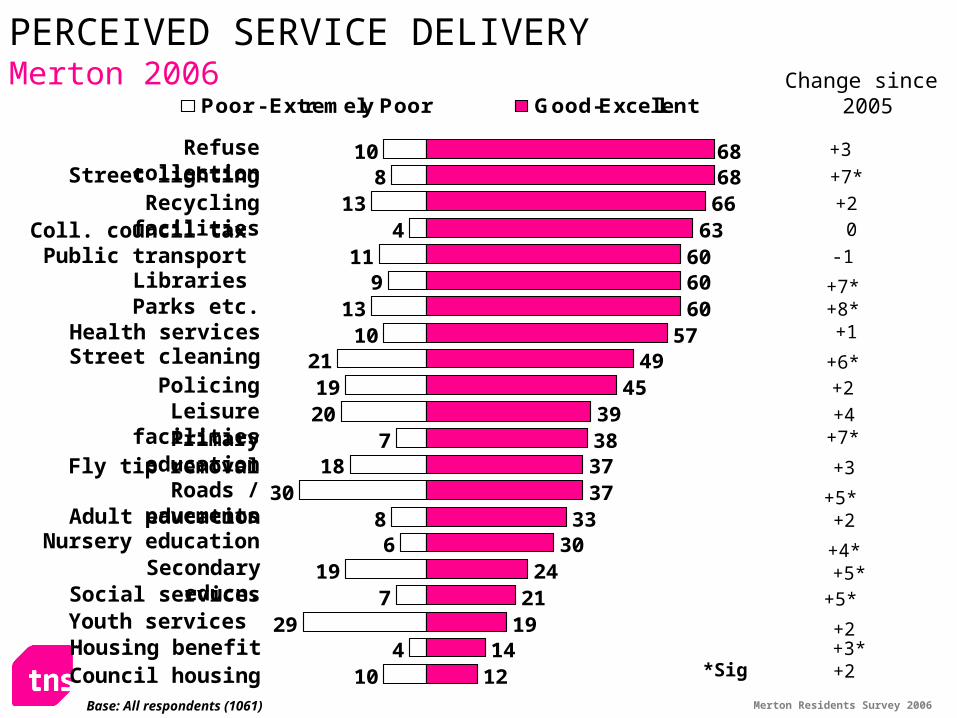
PERCEIVED SERVICE DELIVERY Merton 2006 Change since
2005
+3
+7*
+20
-1
+7*+8*+1
+6*+2
+7*
+3
+5*+2
+4*+5*
+2+3*+2
+5*
+4
Refuse collectionStreet lighting
Recycling facilities
Coll. council tax Public transport
Libraries Parks etc.
Health servicesStreet cleaning
PolicingLeisure facilities
Primary educationFly tip removal
Roads / pavementsAdult education
Nursery educationSecondary educn.
Social servicesYouth services
Housing benefit Council housing *Sig
Merton Residents Survey 2006
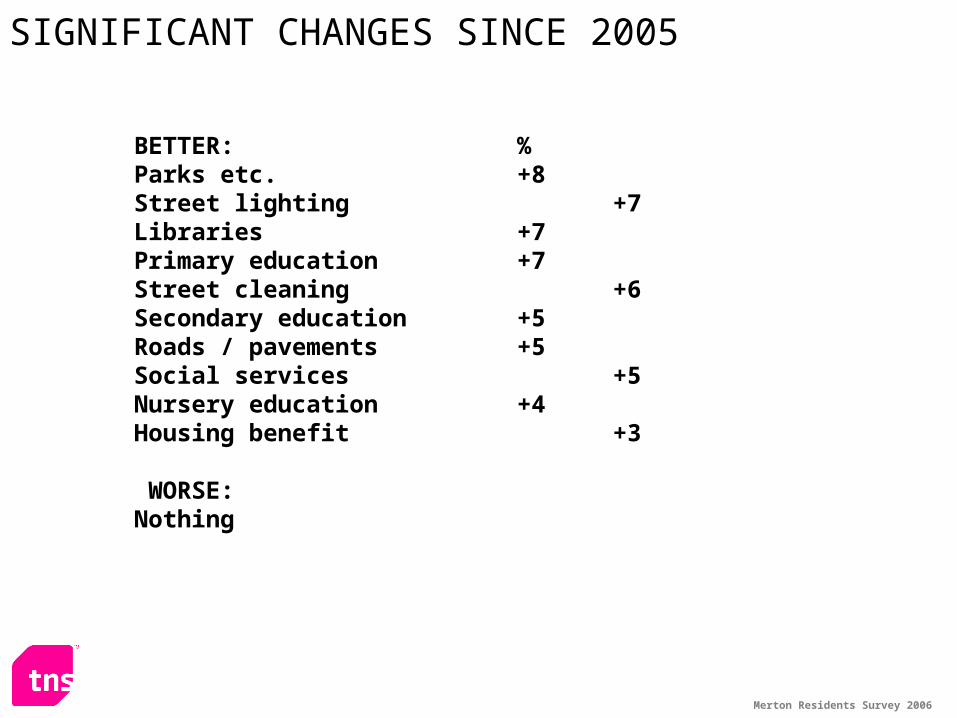
BETTER: %Parks etc. +8Street lighting +7Libraries +7Primary education +7Street cleaning +6Secondary education +5Roads / pavements +5Social services +5Nursery education +4Housing benefit +3 WORSE:Nothing
SIGNIFICANT CHANGES SINCE 2005
Merton Residents Survey 2006
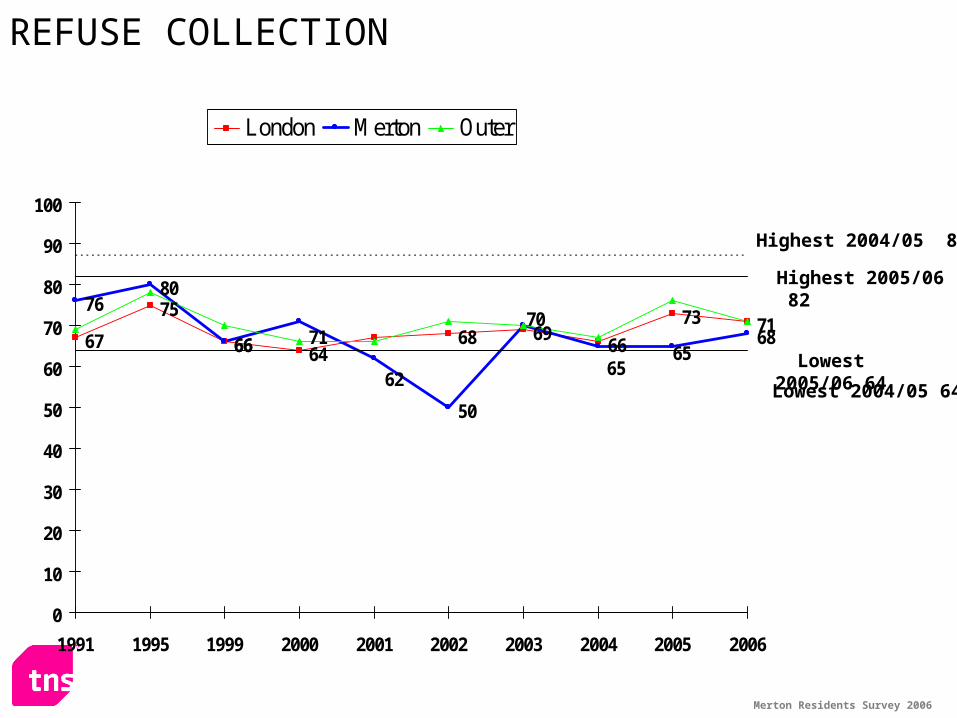
67
75
66 6468 69
73 7176
80
66
50
686670
6565
71
62
0
10
20
30
40
50
60
70
80
90
100
1991 1995 1999 2000 2001 2002 2003 2004 2005 2006
London Merton Outer
REFUSE COLLECTION
Highest 2005/06 82
Lowest 2004/05 64
Lowest 2005/06 64
Highest 2004/05 87
Merton Residents Survey 2006
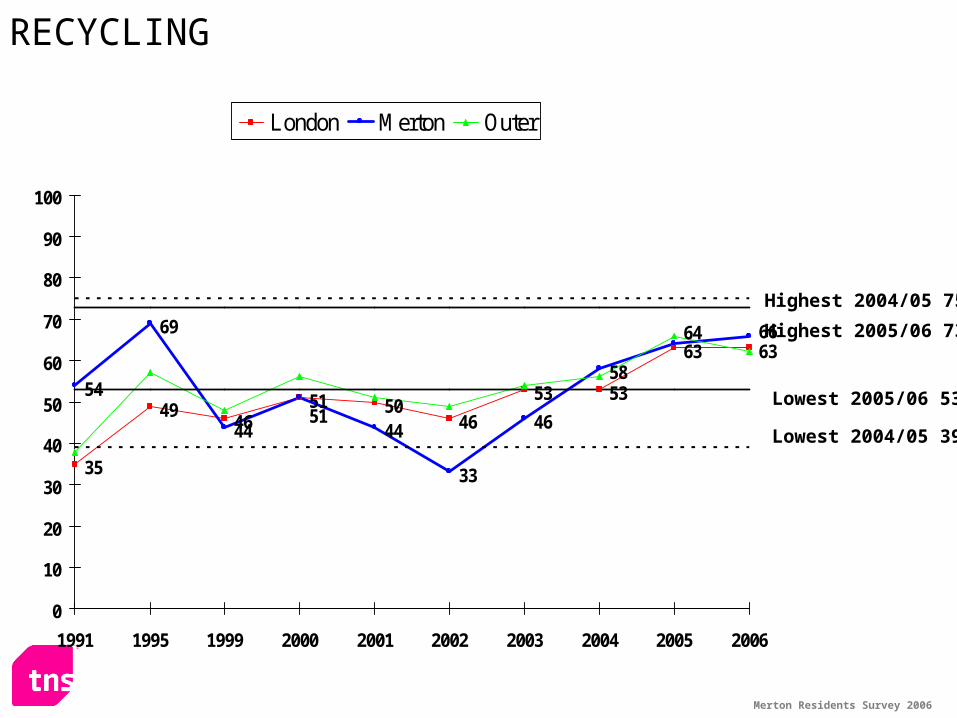
35
4651 50
46
53 53
63 63
54
69
44 44
33
46
58
49
6664
51
0
10
20
30
40
50
60
70
80
90
100
1991 1995 1999 2000 2001 2002 2003 2004 2005 2006
London Merton Outer
RECYCLING
Highest 2004/05 75
Lowest 2004/05 39
Highest 2005/06 73
Lowest 2005/06 53
Merton Residents Survey 2006
39
50
40 4043
37
45
52 54
41
58
4236
31
47 49
43
45
36
43
0
10
20
30
40
50
60
70
80
90
100
1991 1995 1999 2000 2001 2002 2003 2004 2005 2006
London Merton Outer
STREET CLEANING
Highest 2004/05 65
Lowest 2004/05 40
Highest 2005/06 69
Lowest 2005/06 43
Merton Residents Survey 2006
53
60 6056 58 59
6865
56
67
58 5862 61
5756
68
5854
59
0
10
20
30
40
50
60
70
80
90
100
1991 1995 1999 2000 2001 2002 2003 2004 2005 2006
London Merton Outer
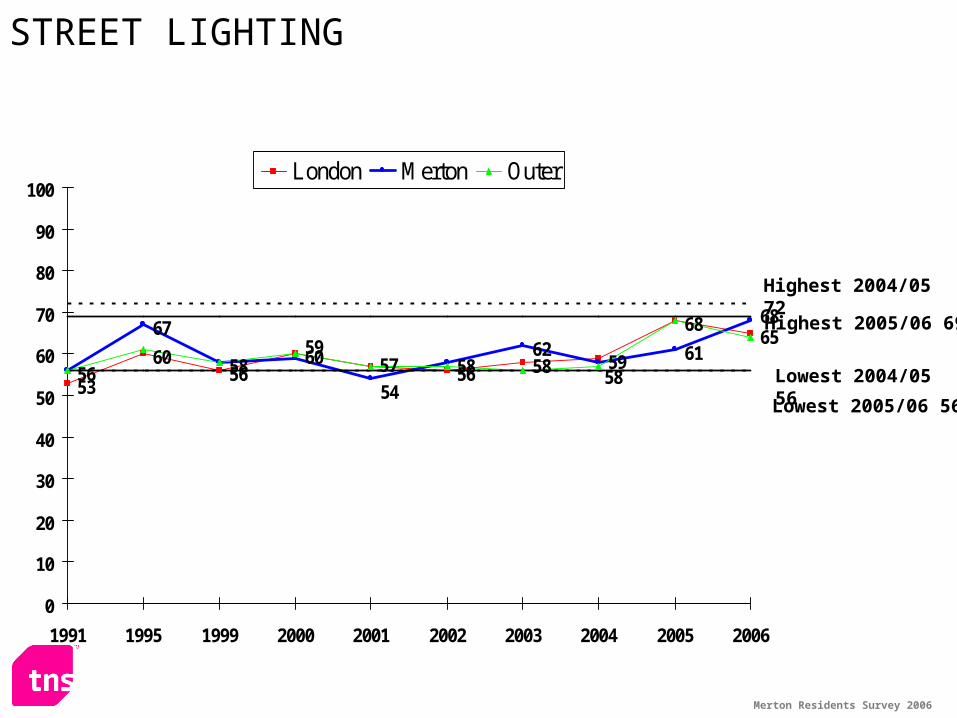
STREET LIGHTING
Highest 2004/05 72
Lowest 2004/05 56
Highest 2005/06 69
Lowest 2005/06 56
Merton Residents Survey 2006
21 23 2125 23 22
26 2724 25
28 28 27
36
2115
30
1924 26
2024 23
38 39
32
38
25
37
1523
24
0
10
20
30
40
50
60
70
80
90
100
1991 1992 1993 1994 1995 1996 1997 1998 1999 2000 2001 2002 2003 2004 2005 2006
London Merton Outer
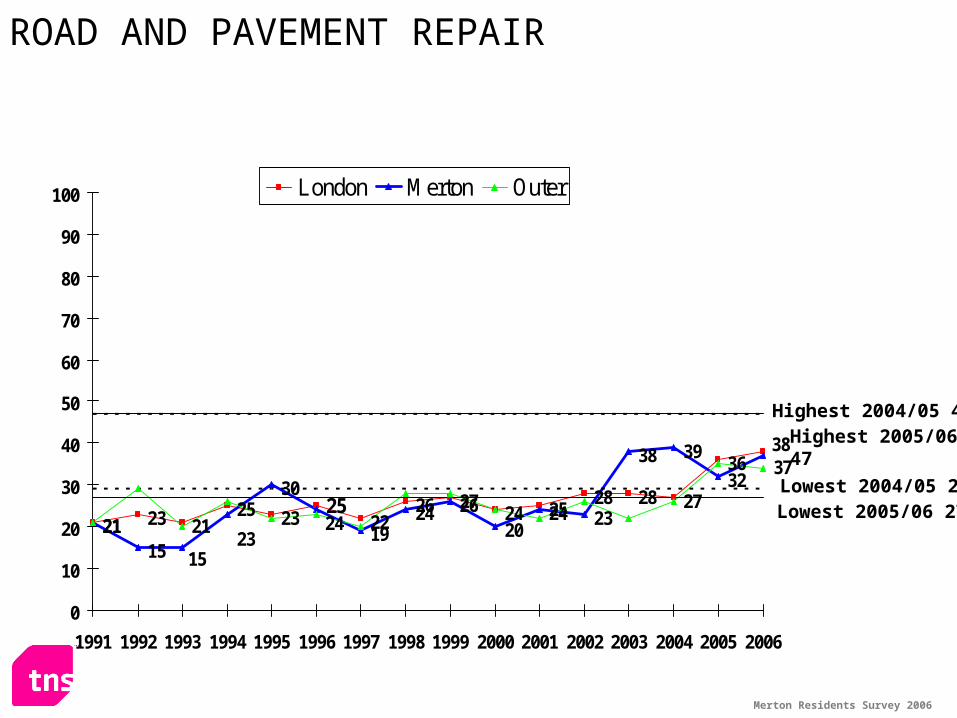
ROAD AND PAVEMENT REPAIR
Highest 2005/06 47
Lowest 2005/06 27
Highest 2004/05 47
Lowest 2004/05 29
Merton Residents Survey 2006
1622 24 24 24 25
32 3026
35 35
2630
2317
25
31
2320
28
0
10
20
30
40
50
60
70
80
90
100
1991 1995 1999 2000 2001 2002 2003 2004 2005 2006
London Merton Outer
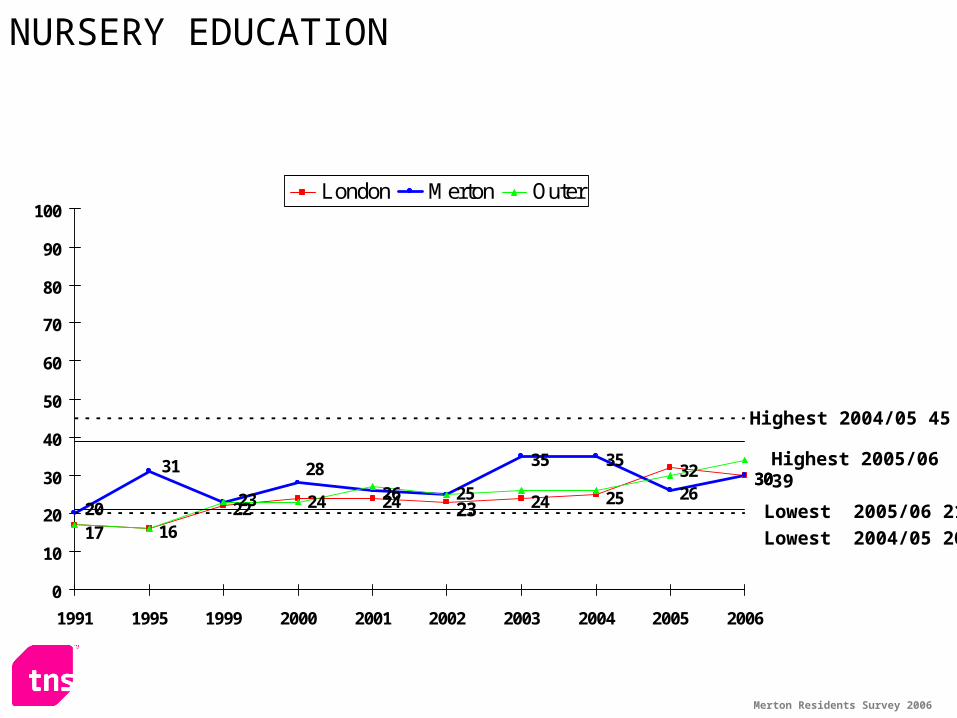
NURSERY EDUCATION
Highest 2005/06 39
Lowest 2005/06 21
Lowest 2004/05 20
Highest 2004/05 45
Merton Residents Survey 2006
23 25
32 3229 30 32
39
28
35 3731 37
25
38
2825 28
36
25
0
10
20
30
40
50
60
70
80
90
100
1991 1995 1999 2000 2001 2002 2003 2004 2005 2006
London Merton Outer
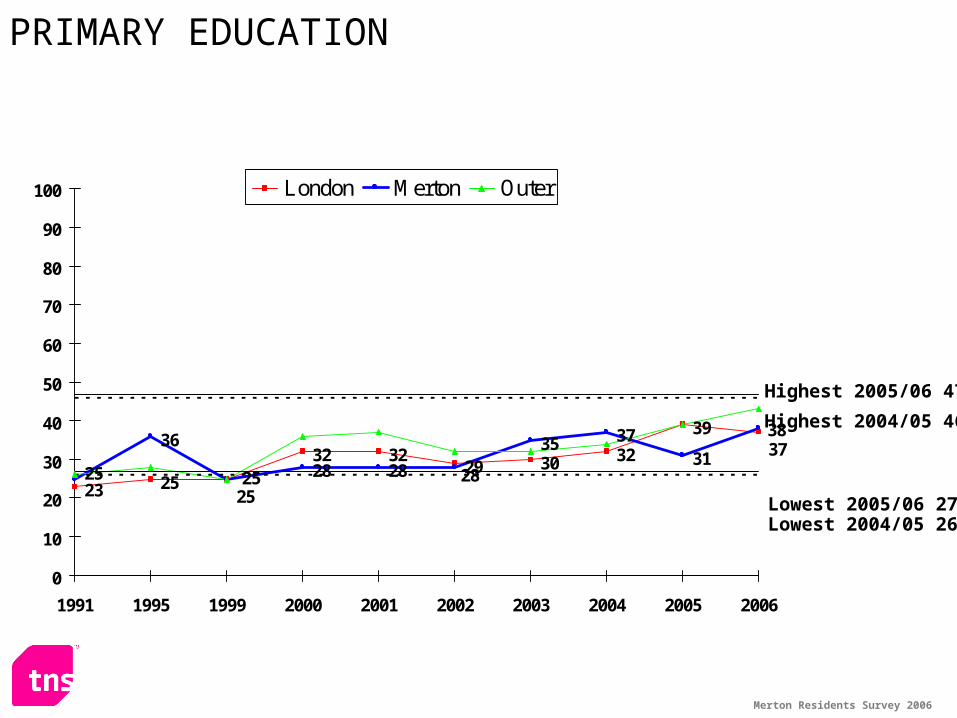
PRIMARY EDUCATION
Highest 2004/05 46
Lowest 2005/06 27Lowest 2004/05 26
Highest 2005/06 47
Merton Residents Survey 2006
22 2024
2721 20
24
33 33
1815 15
2730
242025
1916
19
0
10
20
30
40
50
60
70
80
90
100
1991 1995 1999 2000 2001 2002 2003 2004 2005 2006
London Merton Outer
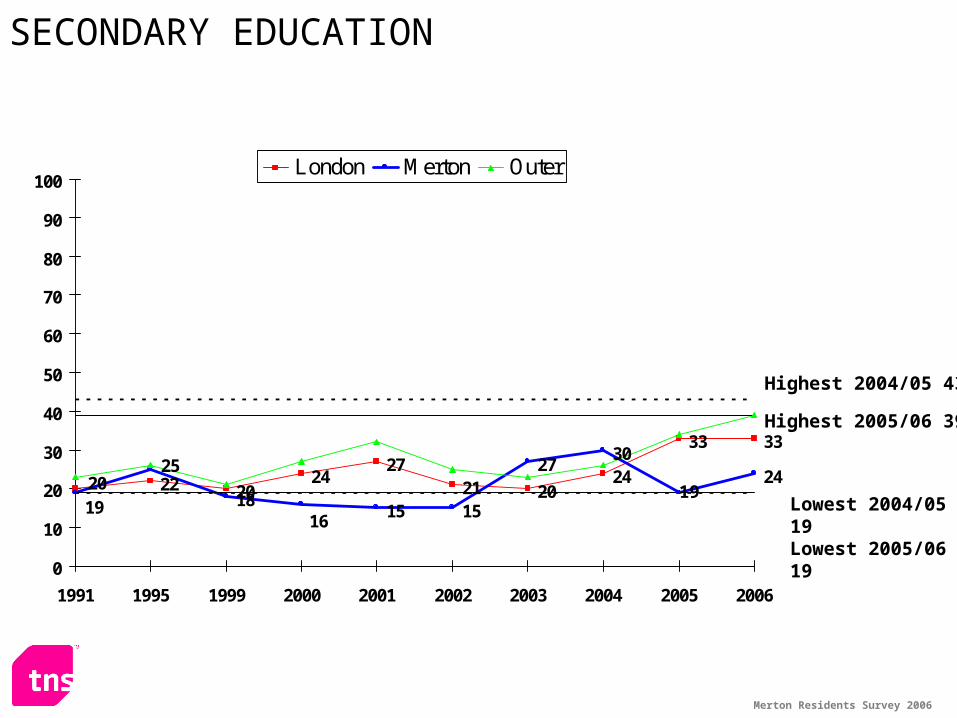
SECONDARY EDUCATION
Highest 2004/05 43
Lowest 2004/05 19 Lowest 2005/06 19
Highest 2005/06 39

Merton Residents Survey 2006
37 3631
3440
35 35 3741
3532
41
2934 32 34
31 33
26
30
0
10
20
30
40
50
60
70
80
90
100
1991 1995 1999 2000 2001 2002 2003 2004 2005 2006
London Merton Outer
ADULT EDUCATION / EVENING CLASSES
Highest 2005/06 42
Highest 2004/05 42
Lowest 2004/05 24 Lowest 2005/06 25
Merton Residents Survey 2006
59 5855
59 5855 56
63
70 71
53 5552 53
6157 60
495657
0
10
20
30
40
50
60
70
80
90
100
1991 1995 1999 2000 2001 2002 2003 2004 2005 2006
London Merton Outer
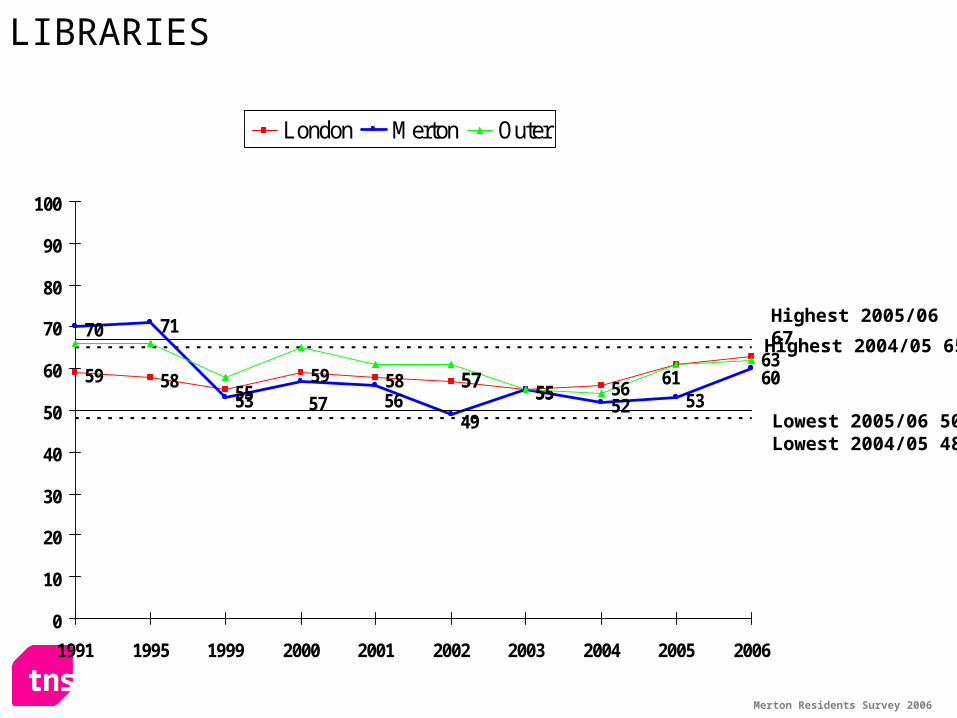
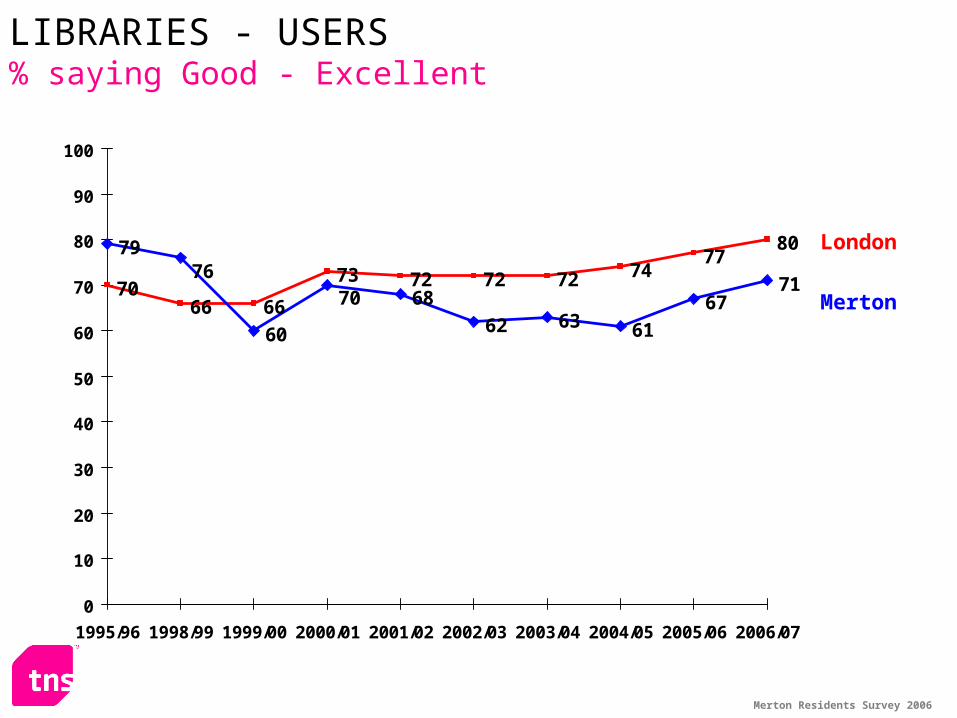
LIBRARIES
Highest 2004/05 65
Lowest 2004/05 48Lowest 2005/06 50
Highest 2005/06 67
Merton Residents Survey 2006
43 4541
48 4946 47
58 60
4954
39
48 50 52
60
484743
44
0
10
20
30
40
50
60
70
80
90
100
1991 1995 1999 2000 2001 2002 2003 2004 2005 2006
London Merton Outer
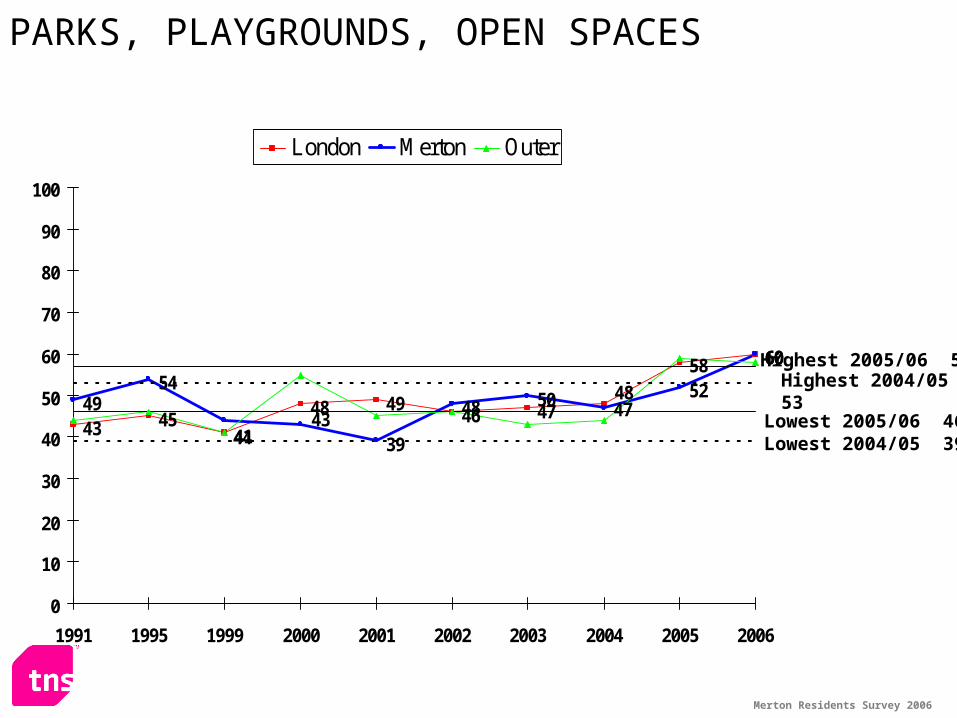
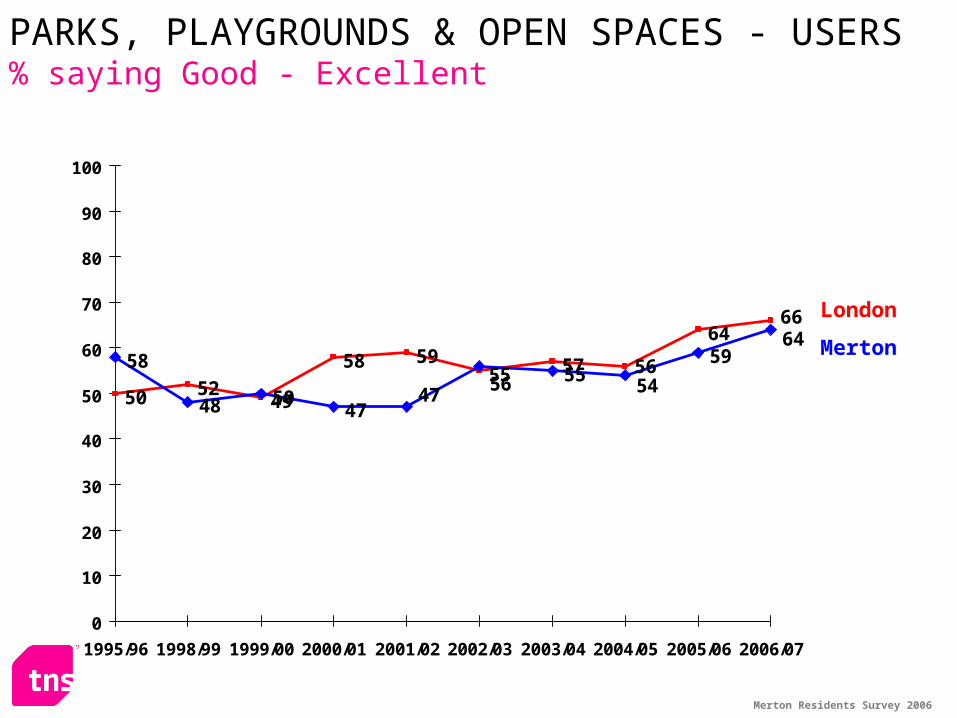
PARKS, PLAYGROUNDS, OPEN SPACES
Highest 2005/06 57
Lowest 2004/05 39
Highest 2004/05 53
Lowest 2005/06 46
Merton Residents Survey 2006
42 41 39 40 39 3734
3742 42
37
48
3336
4135 3934
4140
0
10
20
30
40
50
60
70
80
90
100
1991 1995 1999 2000 2001 2002 2003 2004 2005 2006
London Merton Outer
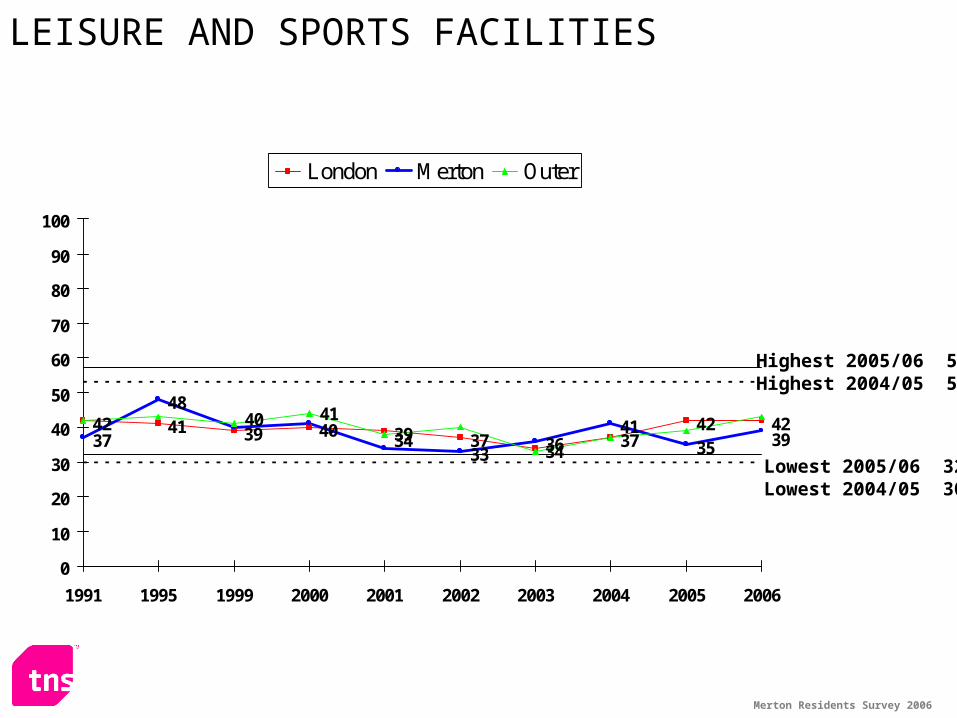
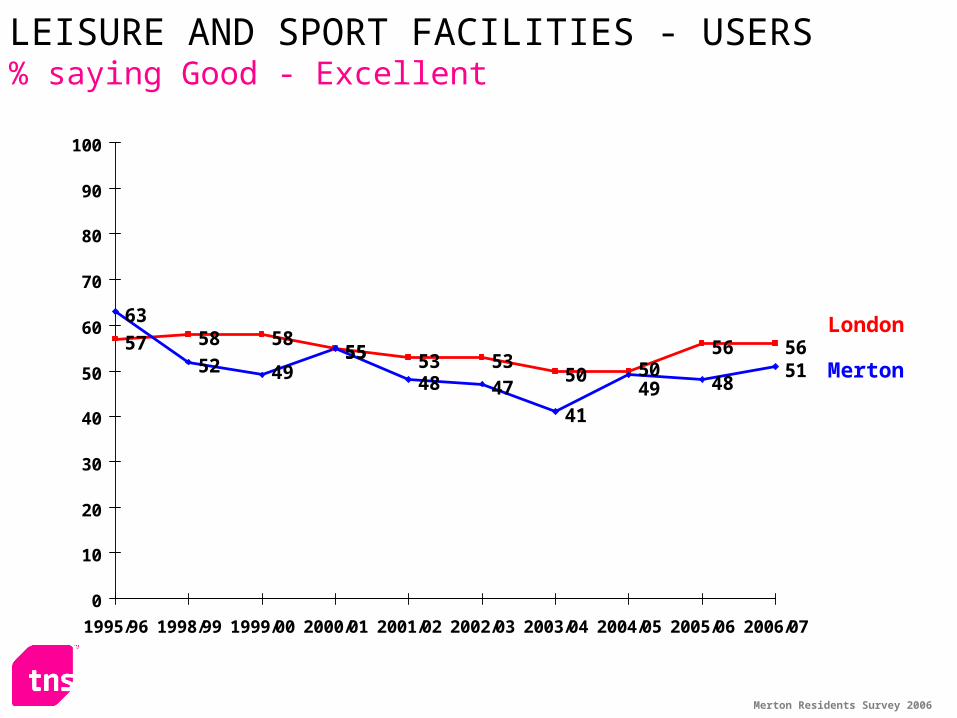
LEISURE AND SPORTS FACILITIES
Highest 2005/06 57
Lowest 2004/05 30Lowest 2005/06 32
Highest 2004/05 53
Merton Residents Survey 2006
45
5356 56 55 53
605954 58
63
47
636060
47
0
10
20
30
40
50
60
70
80
90
100
1999 2000 2001 2002 2003 2004 2005 2006
London Merton Outer
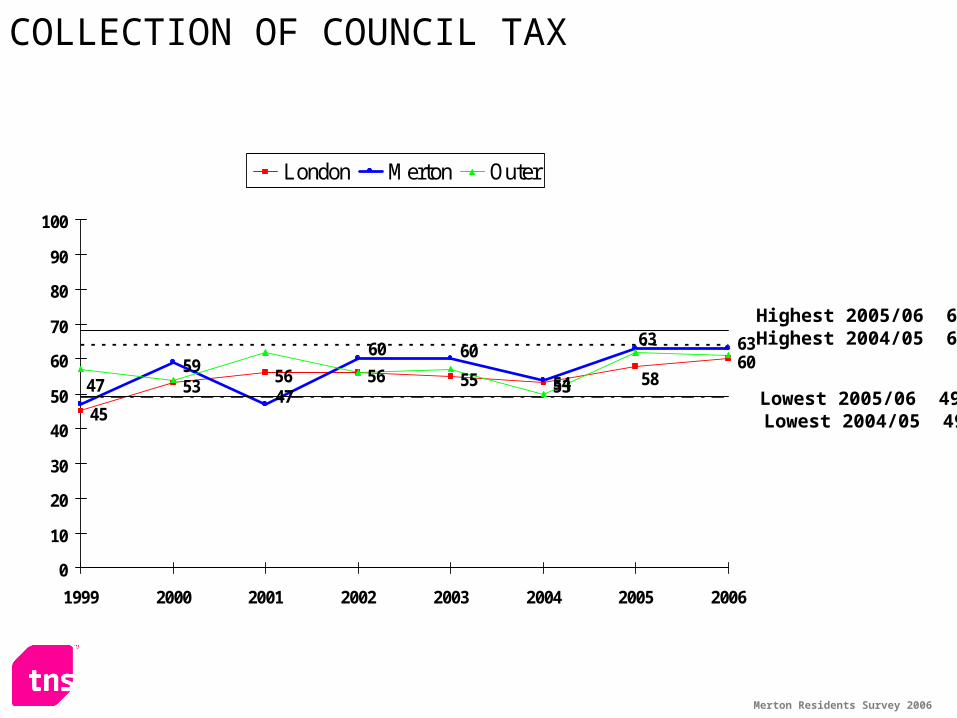
COLLECTION OF COUNCIL TAX
Highest 2005/06 68
Lowest 2004/05 49Lowest 2005/06 49
Highest 2004/05 64
Merton Residents Survey 2006
1316
12 14 14 14 1619 18
9
18 19
10 1217
1215 17 14
13
0
10
20
30
40
50
60
70
80
90
100
1991 1995 1999 2000 2001 2002 2003 2004 2005 2006
London Merton Outer
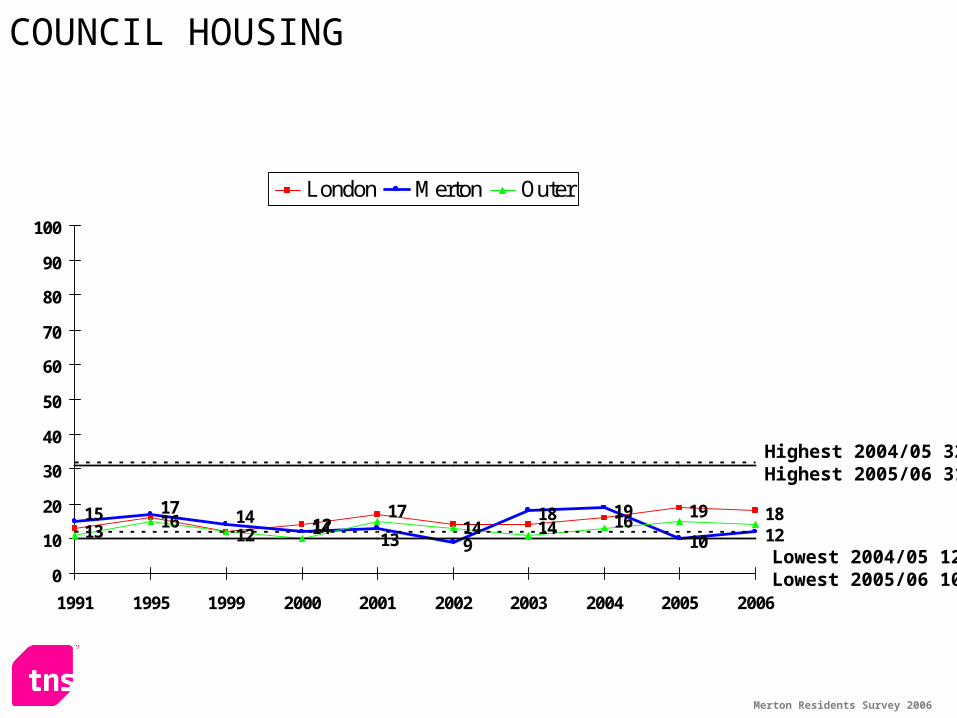
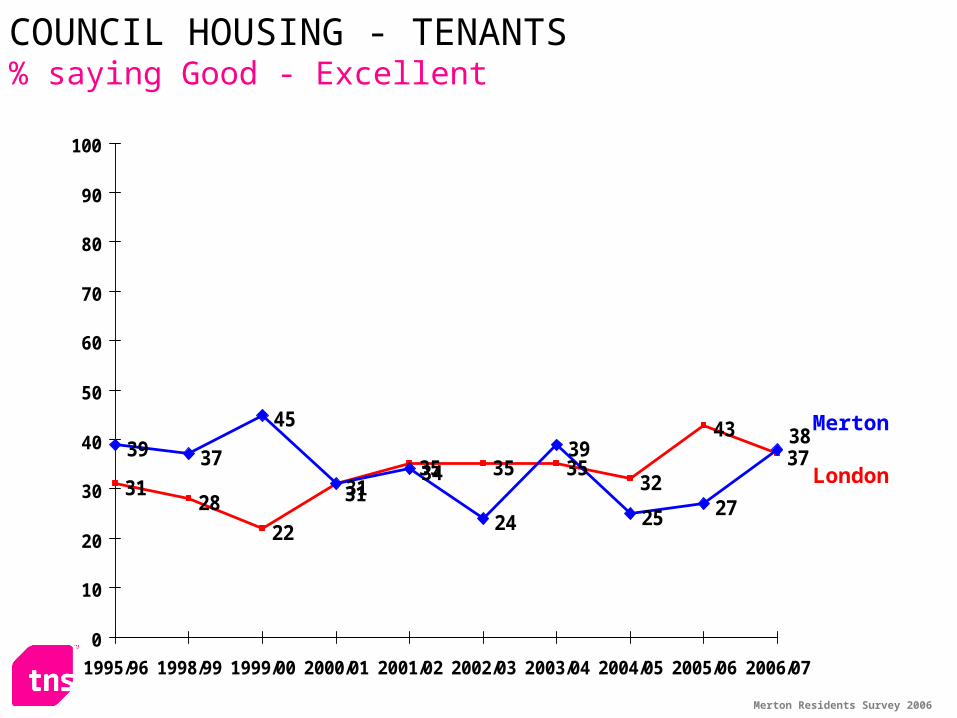
COUNCIL HOUSING
Highest 2004/05 32
Lowest 2005/06 10
Highest 2005/06 31
Lowest 2004/05 12
Merton Residents Survey 2006
17 15 1419 20 20
9
20 21
1114
1817 1313
1317 14
0
10
20
30
40
50
60
70
80
90
100
1995 1999 2000 2001 2002 2003 2004 2005 2006
London Merton Outer
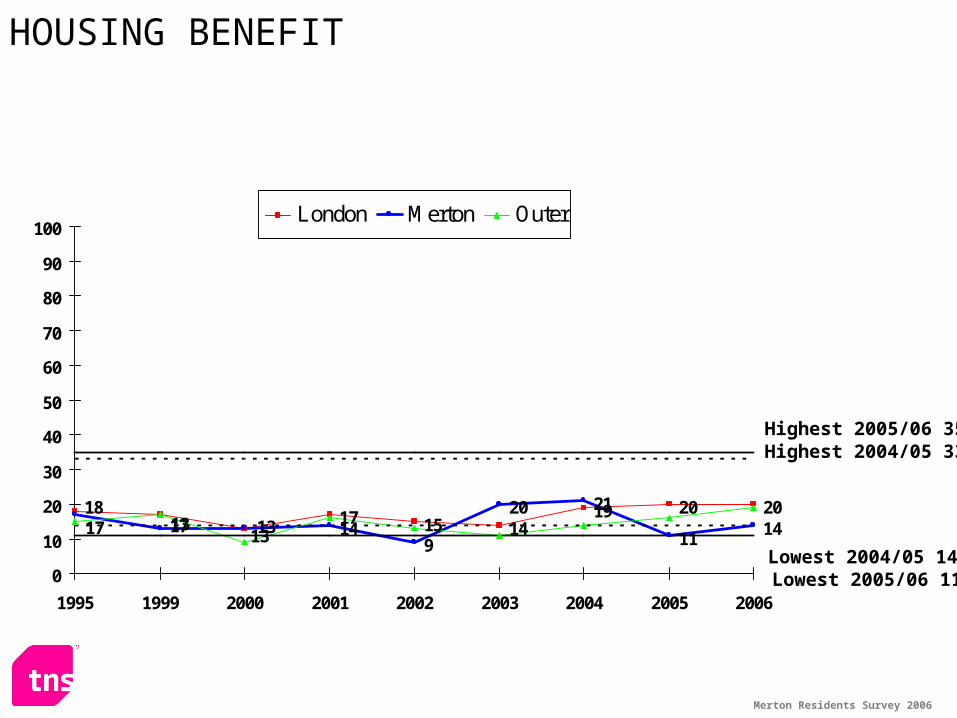
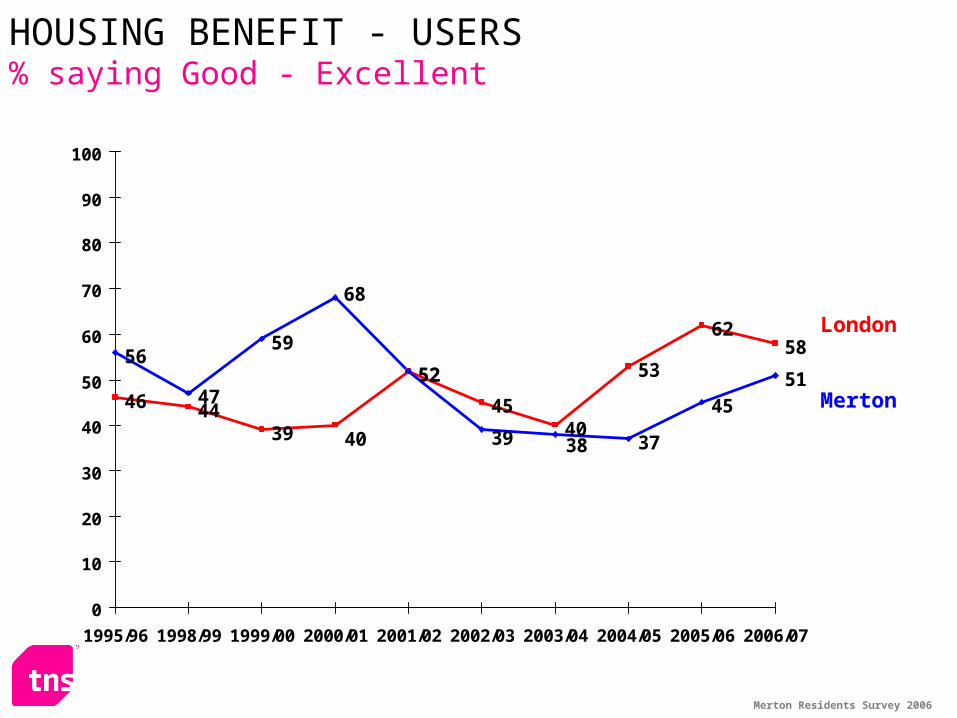
HOUSING BENEFIT
Highest 2004/05 33
Lowest 2004/05 14
Highest 2005/06 35
Lowest 2005/06 11
Merton Residents Survey 2006
44
3431
3531 33
484843
36 34 3539
43 44
28
45
28
0
10
20
30
40
50
60
70
80
90
100
1995 1999 2000 2001 2002 2003 2004 2005 2006
London Merton Outer
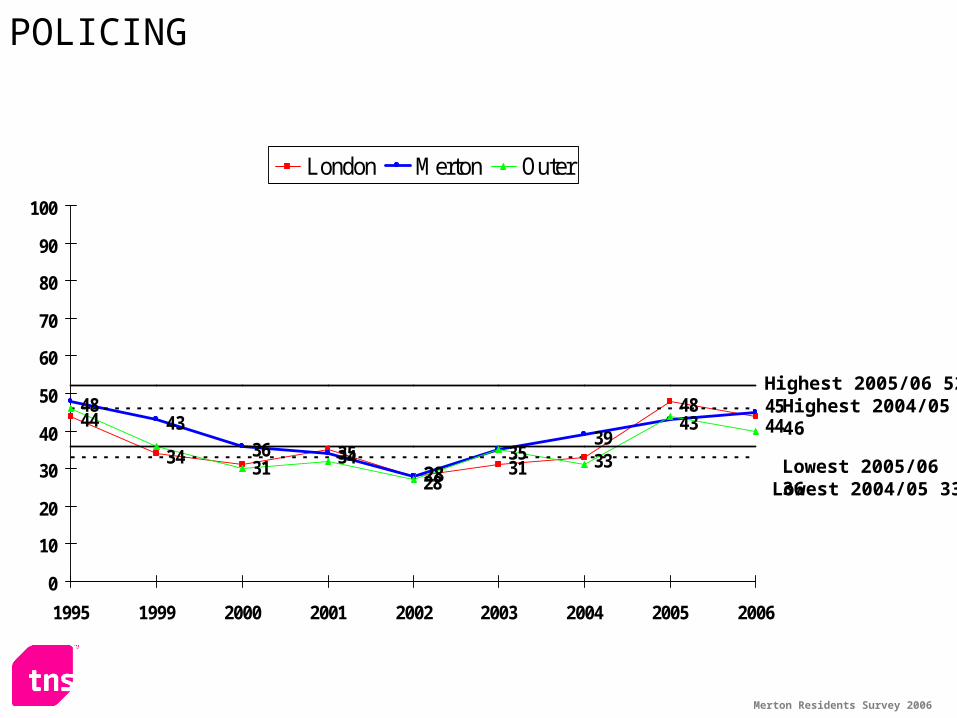
POLICING
Highest 2004/05 46Highest 2005/06 52
Lowest 2004/05 33Lowest 2005/06 36
Merton Residents Survey 2006
48
3741
4952
66
33
43
5450
61 6061
45 4649
4346
0
10
20
30
40
50
60
70
80
90
100
1995 1999 2000 2001 2002 2003 2004 2005 2006
London Merton Outer
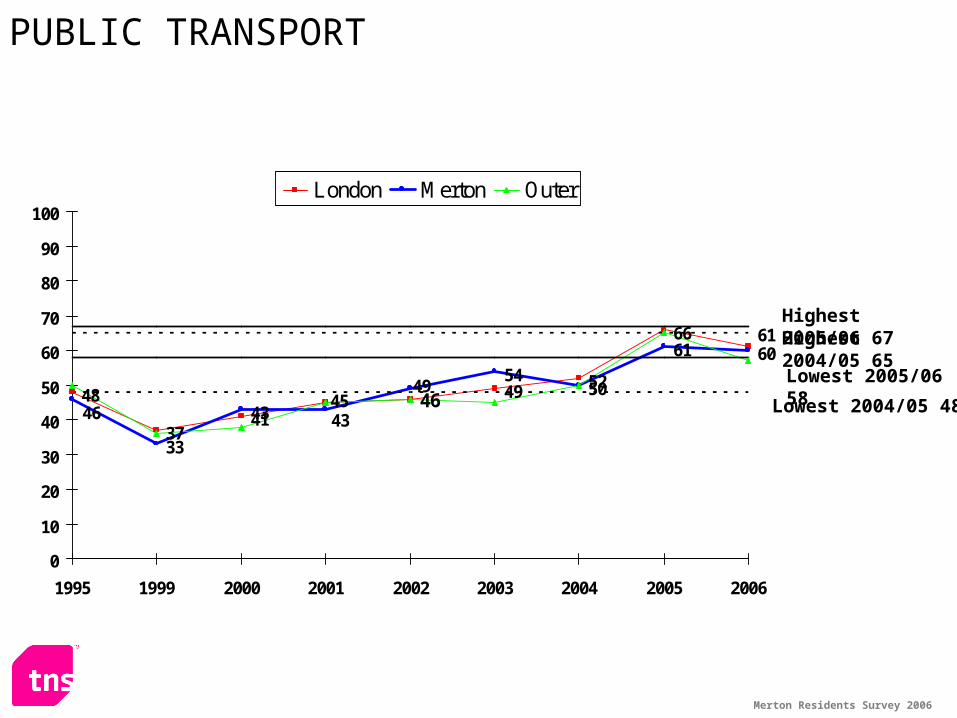
PUBLIC TRANSPORT
Highest 2004/05 65
Highest 2005/06 67
Lowest 2004/05 48
Lowest 2005/06 58

Merton Residents Survey 2006Base: All respondents
108
134
119
1310
211920
718
3086
197
294
10
686866
63606060
5749
4539383737
3330
2421
1914
12
Poor - Extremely Poor Good-Excellent
PERCEIVED SERVICE DELIVERY Merton vs. London 2006
-3
+3
+3+3
-1
-30n/a
-5*+1
+1
n/a
-1-2
0-9*
-6*-6*
n/a
n/a
-3
Refuse collectionStreet lighting
Recycling facilities
Coll. council tax Public transport
Libraries Parks etc.
Health servicesStreet cleaning
PolicingLeisure facilities
Primary educationFly tip removal
Roads / pavementsAdult education
Nursery educationSecondary educn.
Social servicesYouth services
Housing benefit Council housing *Sig
Diff. to London
Merton Residents Survey 2006
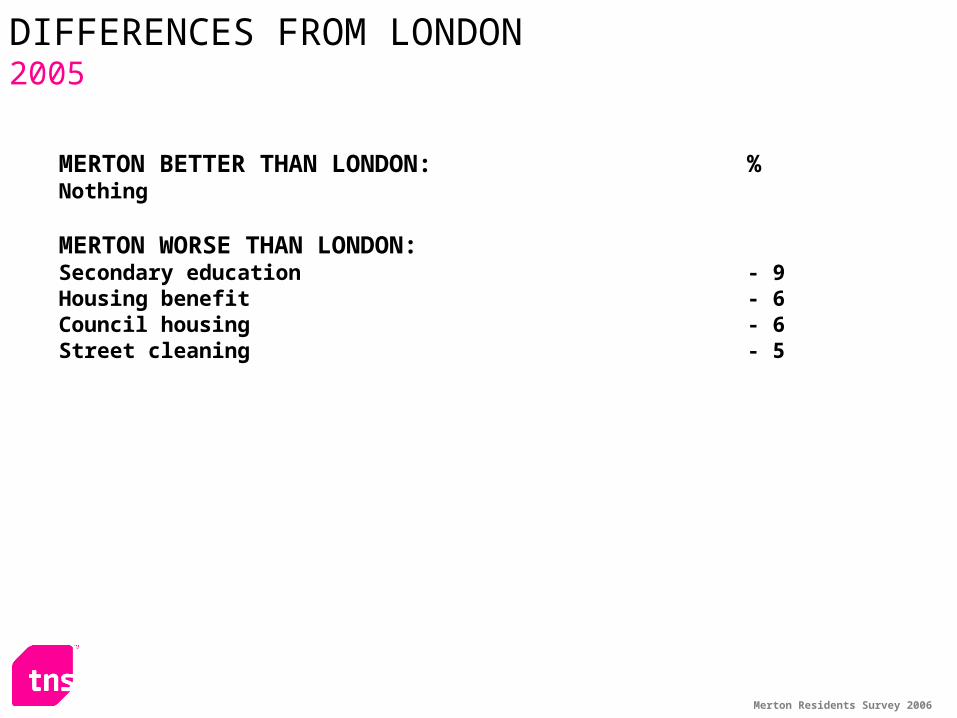
MERTON BETTER THAN LONDON: %Nothing
MERTON WORSE THAN LONDON:Secondary education - 9Housing benefit - 6Council housing - 6Street cleaning - 5
DIFFERENCES FROM LONDON2005

User trendsUser trends
Merton Residents Survey 2006
30
69
12
38
15
19
21
35
6
8
10
23
48
5
57
4
Excellent-Good Average Poor-Extremely Poor Don't know
%
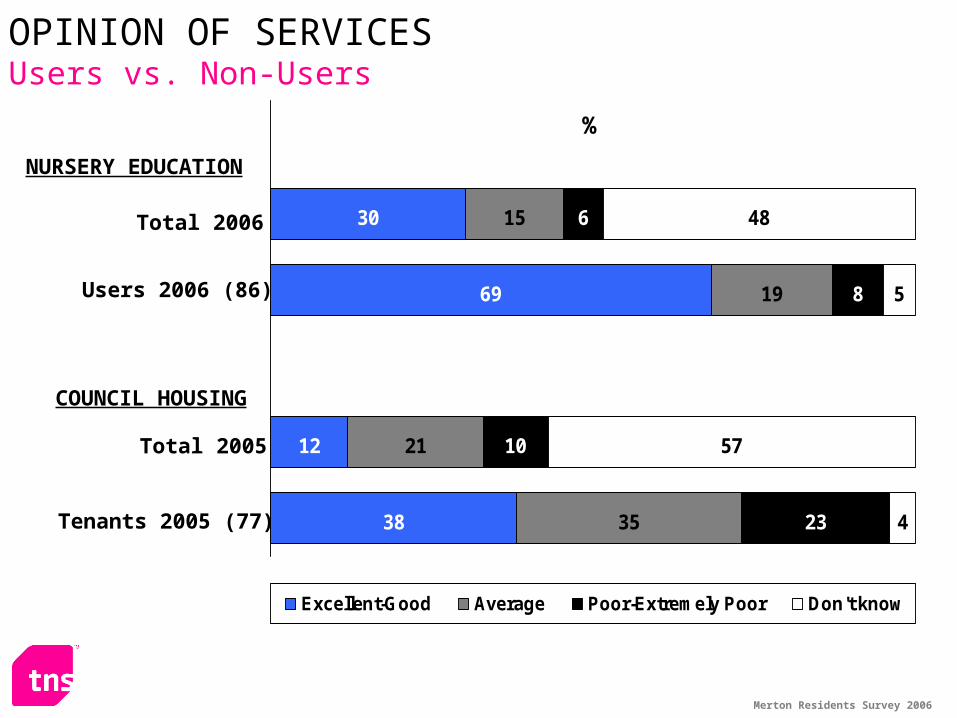
NURSERY EDUCATION
Total 2006
COUNCIL HOUSING
Total 2005
Users 2006 (86)
Tenants 2005 (77)
OPINION OF SERVICESUsers vs. Non-Users
Merton Residents Survey 2006
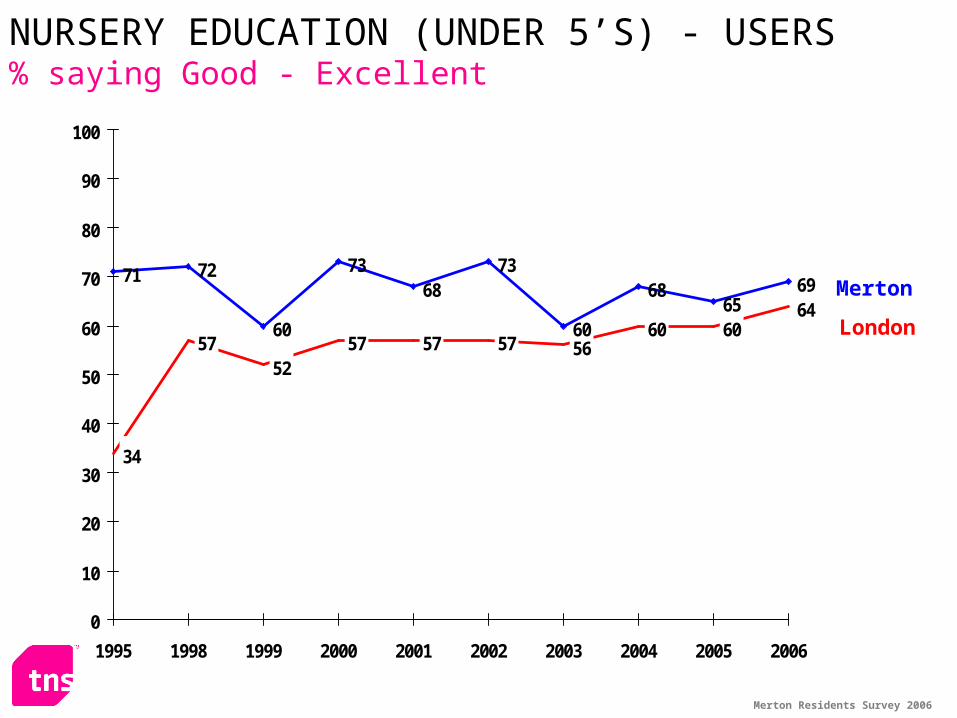
34
5752
57 57 5660 60
64
71 72
60
7368
73
60
6865
69
57
0
10
20
30
40
50
60
70
80
90
100
1995 1998 1999 2000 2001 2002 2003 2004 2005 2006
London
Merton
NURSERY EDUCATION (UNDER 5’S) - USERS% saying Good - Excellent
Merton Residents Survey 2006
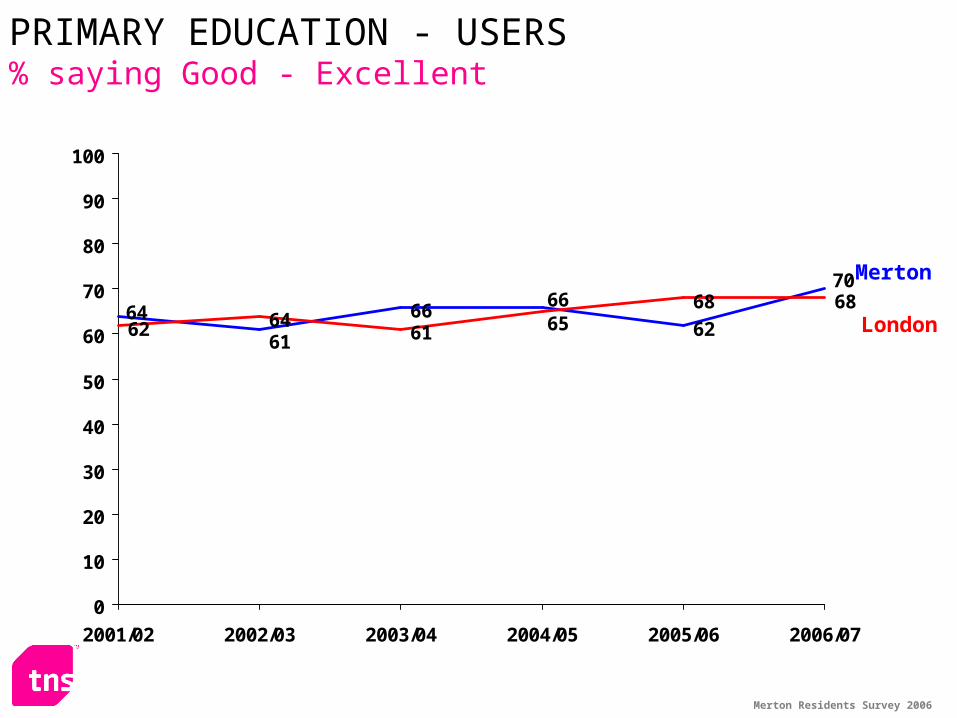
666262 64
61
68 6870
66
61
6465
0
10
20
30
40
50
60
70
80
90
100
2001/02 2002/03 2003/04 2004/05 2005/06 2006/07
London
Merton
PRIMARY EDUCATION - USERS% saying Good - Excellent
Merton Residents Survey 2006
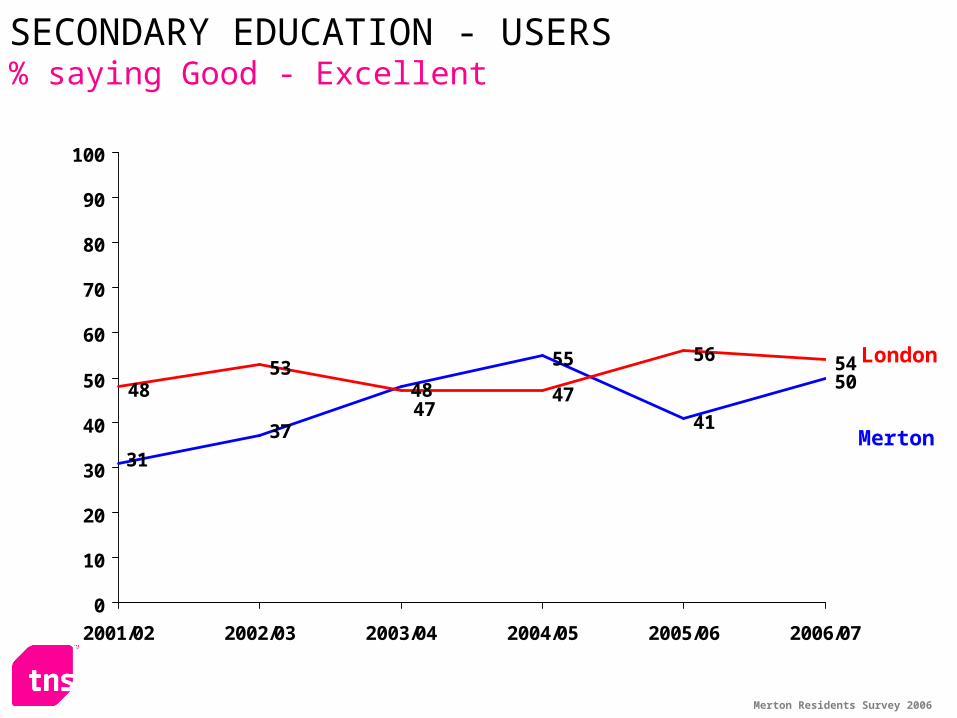
48
55
41
504853
47
56 54
37
31
47
0
10
20
30
40
50
60
70
80
90
100
2001/02 2002/03 2003/04 2004/05 2005/06 2006/07
London
Merton
SECONDARY EDUCATION - USERS% saying Good - Excellent
Merton Residents Survey 2006
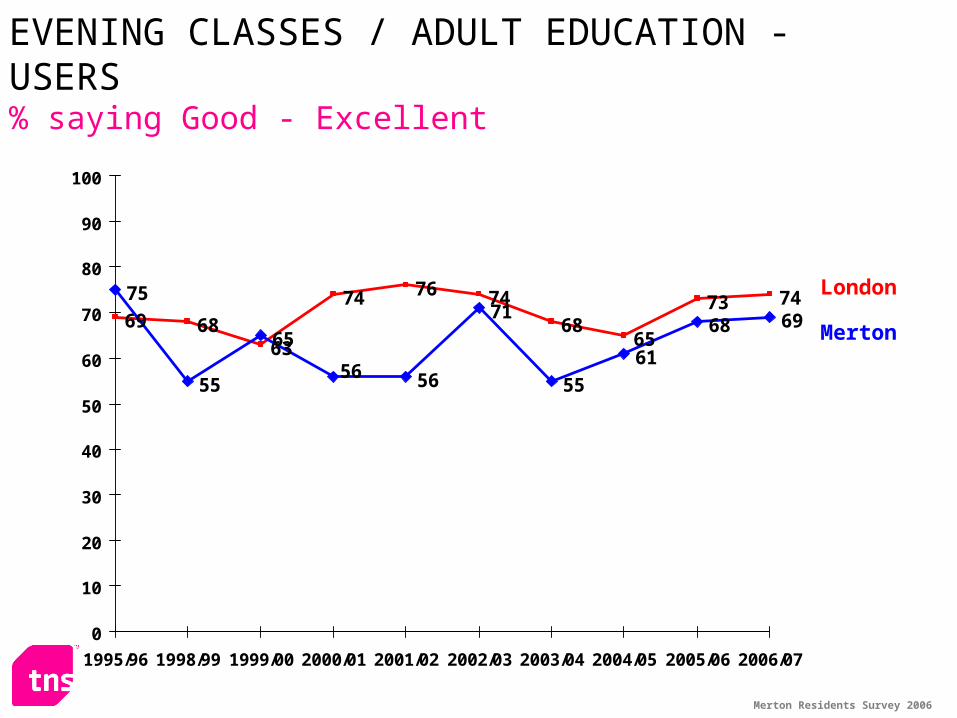
69 6863
74 76 74
6865
73 7475
55
65
56
71
55
61
68 69
56
0
10
20
30
40
50
60
70
80
90
100
1995/96 1998/99 1999/00 2000/01 2001/02 2002/03 2003/04 2004/05 2005/06 2006/07
London
Merton
EVENING CLASSES / ADULT EDUCATION - USERS% saying Good - Excellent
Merton Residents Survey 2006
3128
22
3135 35 35
32
433739 37
45
34
24
39
25 27
38
31
0
10
20
30
40
50
60
70
80
90
100
1995/96 1998/99 1999/00 2000/01 2001/02 2002/03 2003/04 2004/05 2005/06 2006/07
London
Merton
COUNCIL HOUSING - TENANTS% saying Good - Excellent
Merton Residents Survey 2006
46 4439
52
4540
53
625856
47
59
52
37
4551
40 3839
68
0
10
20
30
40
50
60
70
80
90
100
1995/96 1998/99 1999/00 2000/01 2001/02 2002/03 2003/04 2004/05 2005/06 2006/07
London
Merton
HOUSING BENEFIT - USERS% saying Good - Excellent
Merton Residents Survey 2006
50 5249
58 5955 57
64
58
48 5047
5559
66
56
64
544756
0
10
20
30
40
50
60
70
80
90
100
1995/96 1998/99 1999/00 2000/01 2001/02 2002/03 2003/04 2004/05 2005/06 2006/07
London
Merton
PARKS, PLAYGROUNDS & OPEN SPACES - USERS% saying Good - Excellent
Merton Residents Survey 2006
7066 66
73 72 72 72 7477
8079
60
68
62 63 61
6771
7076
0
10
20
30
40
50
60
70
80
90
100
1995/96 1998/99 1999/00 2000/01 2001/02 2002/03 2003/04 2004/05 2005/06 2006/07
London
Merton
LIBRARIES - USERS% saying Good - Excellent
Merton Residents Survey 2006
57 58 5855 53 53
50
56 56
63
5255
48 47
41
485150
4949
0
10
20
30
40
50
60
70
80
90
100
1995/96 1998/99 1999/00 2000/01 2001/02 2002/03 2003/04 2004/05 2005/06 2006/07
London
Merton
LEISURE AND SPORT FACILITIES - USERS% saying Good - Excellent
Merton Residents Survey 2006
72 70 7066
6065
6872
64
5853
40
51
63
7072
62
71
80
49
0
10
20
30
40
50
60
70
80
90
100
1995/96 1998/99 1999/00 2000/01 2001/02 2002/03 2003/04 2004/05 2005/06 2006/07
London
Merton
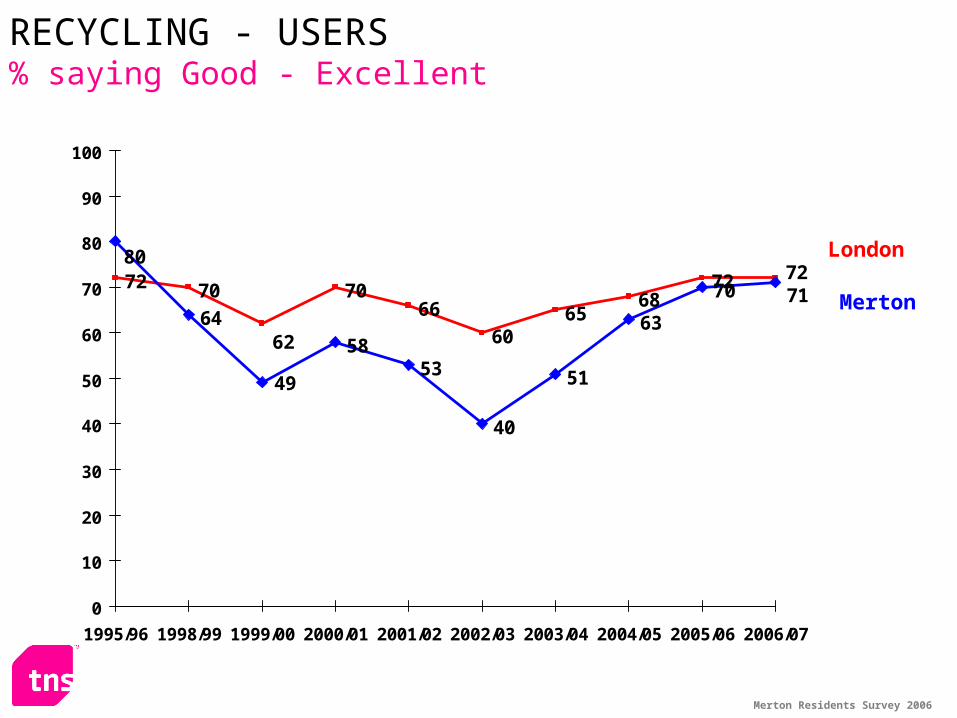
RECYCLING - USERS% saying Good - Excellent
Merton Residents Survey 2006
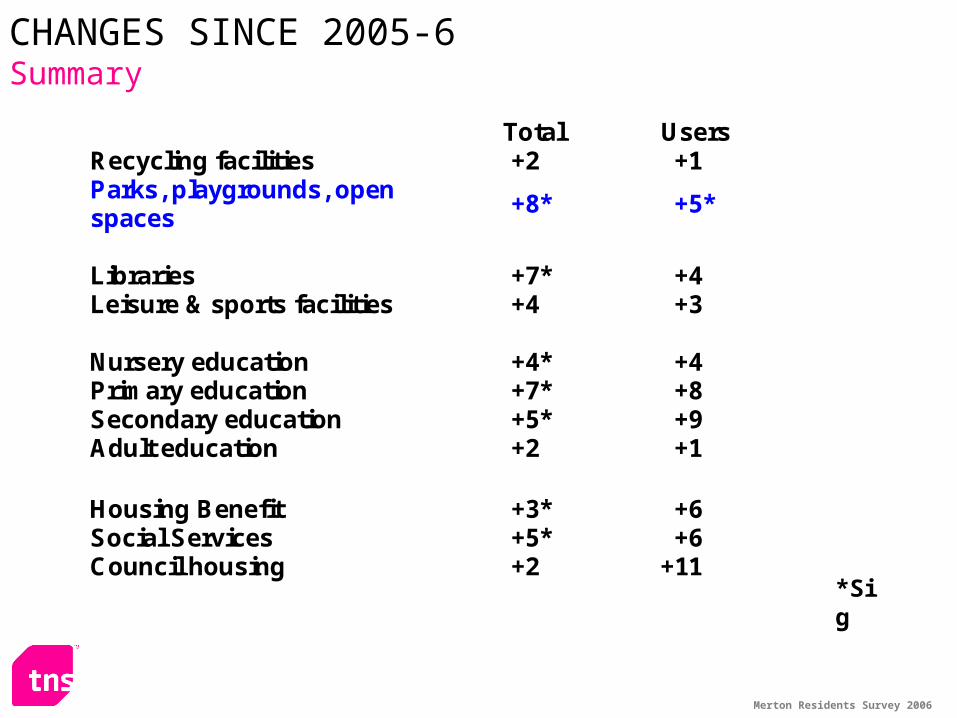
Total Users Recycling facilities +2 +1 Parks, playgrounds, open spaces
+8* +5*
Libraries +7* +4 Leisure & sports facilities +4 +3 Nursery education +4* +4 Primary education +7* +8 Secondary education +5* +9 Adult education +2 +1
Housing Benefit +3* +6 Social Services +5* +6 Council housing +2 +11
*Sig
CHANGES SINCE 2005-6Summary
Merton Residents Survey 2006
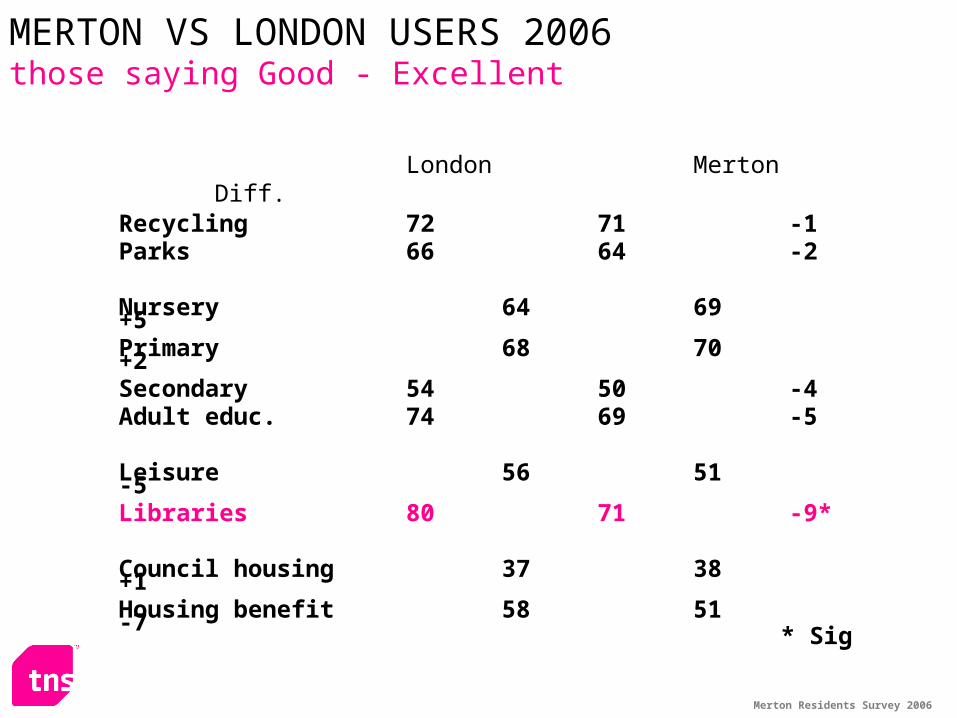
London Merton Diff.Recycling 72 71 -1Parks 66 64 -2
Nursery 64 69 +5Primary 68 70 +2Secondary 54 50 -4Adult educ. 74 69 -5
Leisure 56 51 -5Libraries 80 71 -9*
Council housing 37 38 +1Housing benefit 58 51 -7
* Sig
MERTON VS LONDON USERS 2006those saying Good - Excellent

Merton Extra QuestionsMerton Extra Questions

Discrimination, tackling racism and social cohesion
Merton Residents Survey 2006
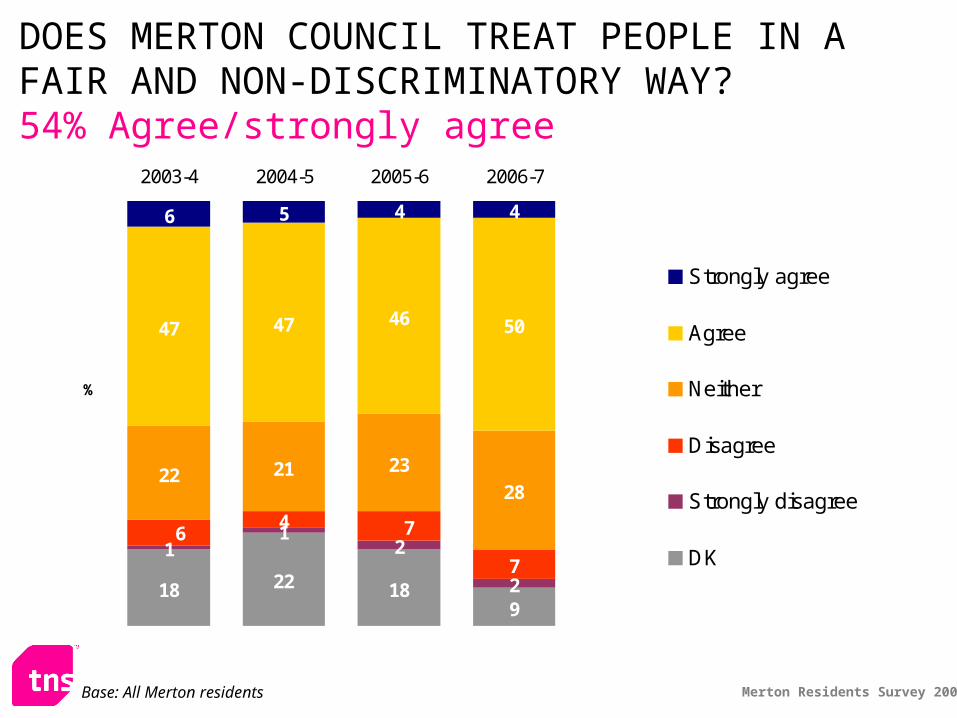
DOES MERTON COUNCIL TREAT PEOPLE IN A FAIR AND NON-DISCRIMINATORY WAY?54% Agree/strongly agree
18 22 189
12
2
4
7
22 21 23
28
47 47 46 50
5 4 4
16 7
6
2003-4 2004-5 2005-6 2006-7
%
Strongly agree
Agree
Neither
Disagree
Strongly disagree
DK
Base: All Merton residents
Merton Residents Survey 2006
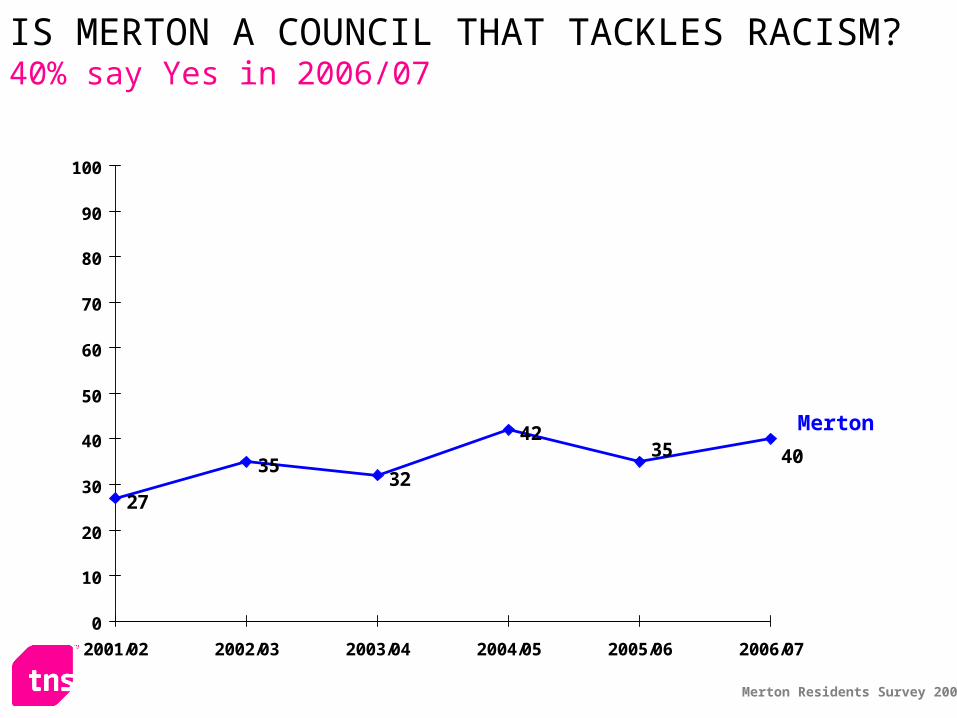
27
3532
4235 40
0
10
20
30
40
50
60
70
80
90
100
2001/02 2002/03 2003/04 2004/05 2005/06 2006/07
Merton
IS MERTON A COUNCIL THAT TACKLES RACISM?40% say Yes in 2006/07
Merton Residents Survey 2006
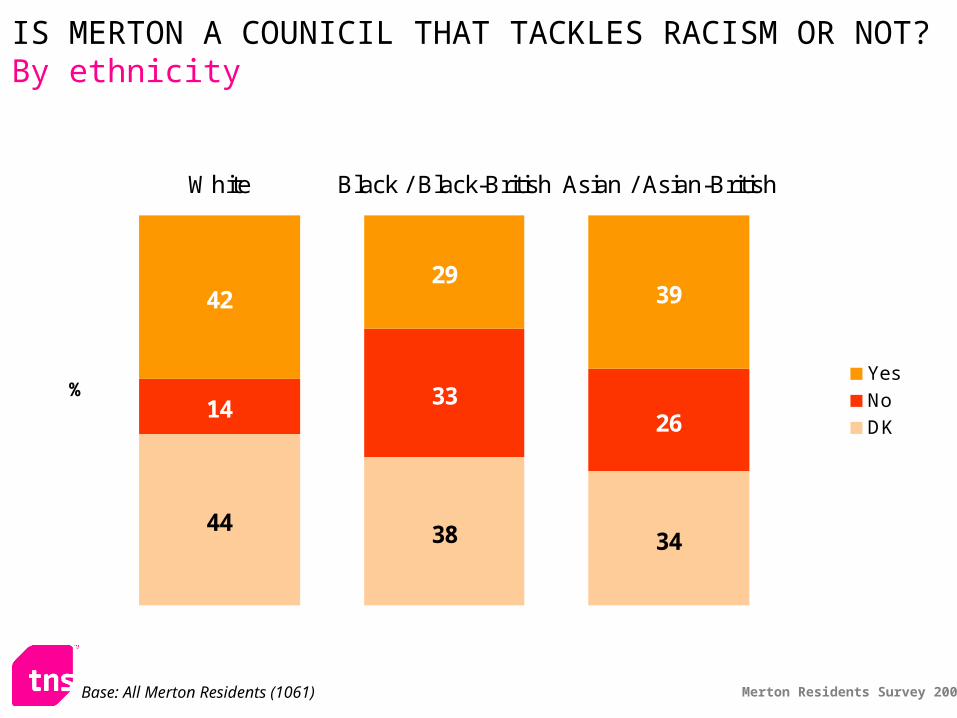
IS MERTON A COUNICIL THAT TACKLES RACISM OR NOT?By ethnicity
44 38 34
14 3326
4229
39
White Black / Black-British Asian / Asian-British
%Yes
No
DK
Base: All Merton Residents (1061)
Merton Residents Survey 2006
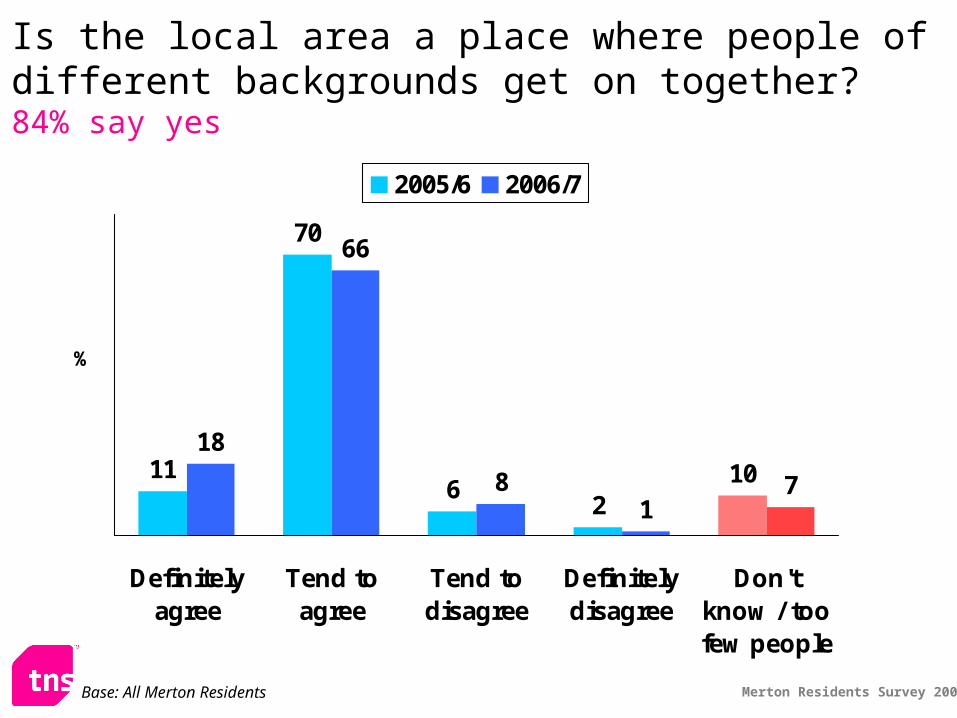
Is the local area a place where people of different backgrounds get on together?84% say yes
11
70
62
1018
66
81
7
Definitelyagree
Tend toagree
Tend todisagree
Definitelydisagree
Don'tknow / toofew people
%
2005/6 2006/7
Base: All Merton Residents
Merton Residents Survey 2006
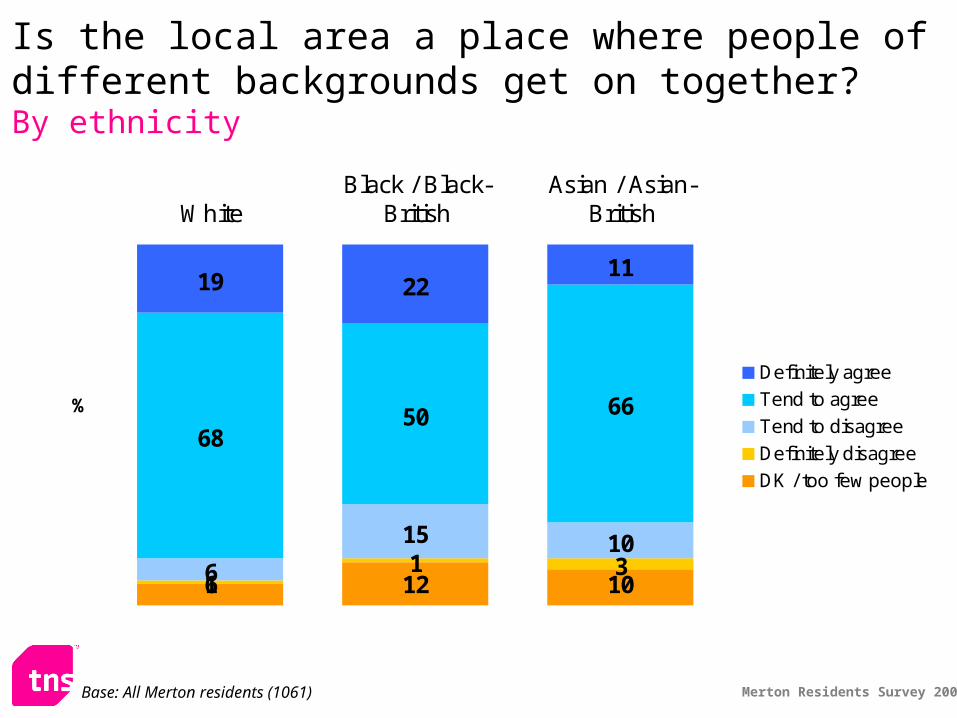
Is the local area a place where people of different backgrounds get on together?By ethnicity
6 12 1011 36
15 10
6850 66
19 2211
WhiteBlack / Black-
BritishAsian / Asian-
British
%
Definitely agree
Tend to agree
Tend to disagree
Definitely disagree
DK / too few people
Base: All Merton residents (1061)

Merton Residents Survey 2006
Crime, Anti-social behavior and Drugs
Merton Residents Survey 2006
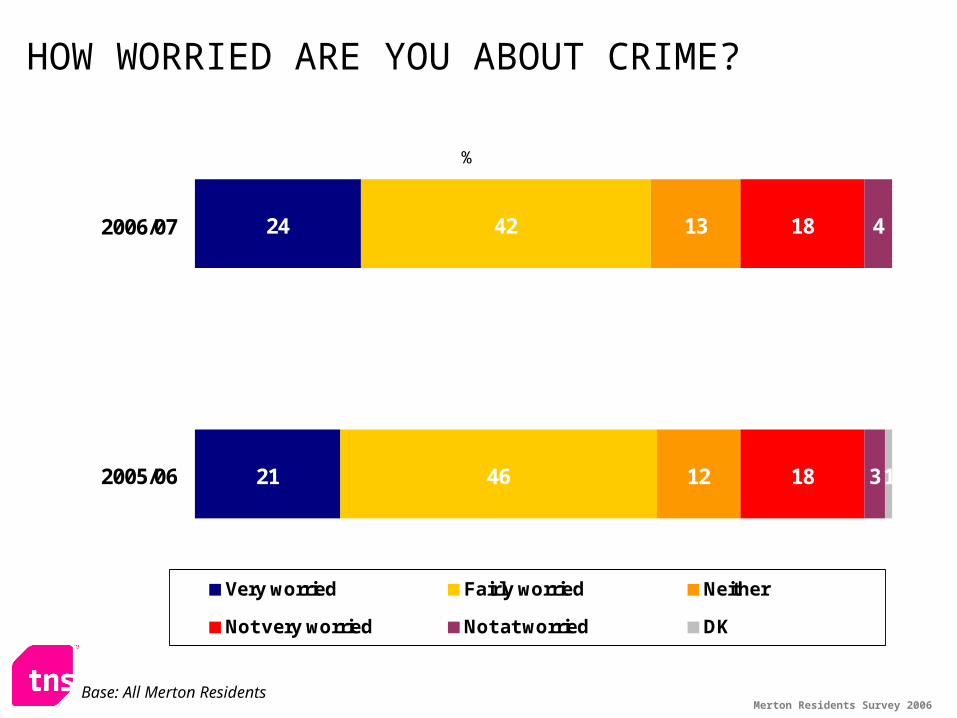
HOW WORRIED ARE YOU ABOUT CRIME?
24
21
42
46
13
12
18
18 31
42006/07
2005/06
%
Very worried Fairly worried Neither
Not very worried Not at worried DK
Base: All Merton Residents
Merton Residents Survey 2006
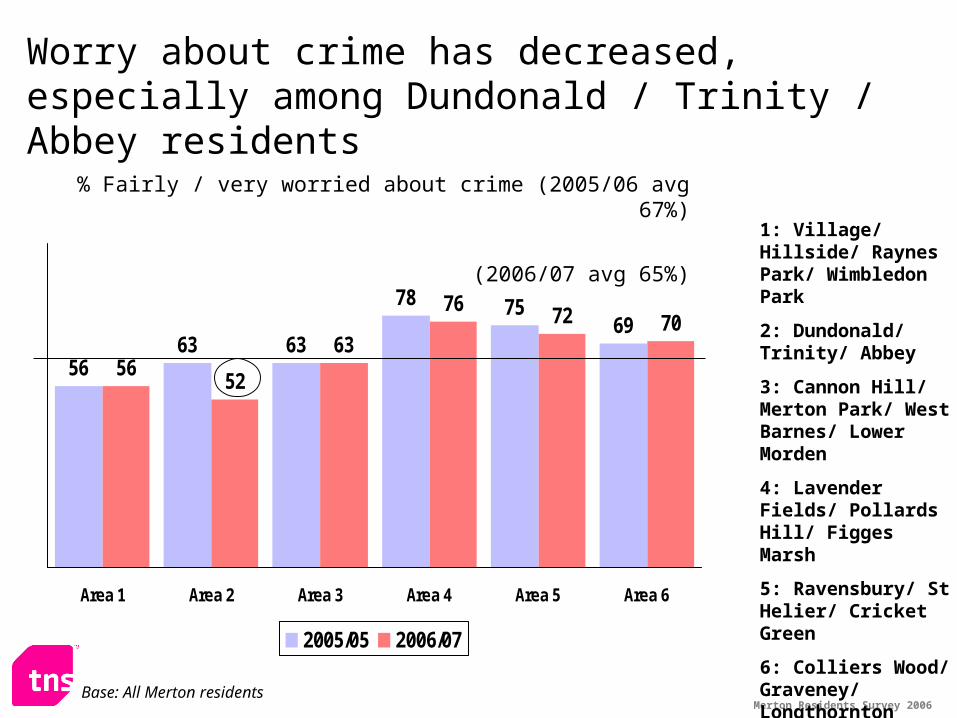
Worry about crime has decreased, especially among Dundonald / Trinity / Abbey residents
5663 63
78 7569
5652
63
76 72 70
Area 1 Area 2 Area 3 Area 4 Area 5 Area 6
2005/05 2006/07
Base: All Merton residents
1: Village/ Hillside/ Raynes Park/ Wimbledon Park
2: Dundonald/ Trinity/ Abbey
3: Cannon Hill/ Merton Park/ West Barnes/ Lower Morden
4: Lavender Fields/ Pollards Hill/ Figges Marsh
5: Ravensbury/ St Helier/ Cricket Green
6: Colliers Wood/ Graveney/ Longthornton
% Fairly / very worried about crime (2005/06 avg 67%)
(2006/07 avg 65%)
Merton Residents Survey 2006
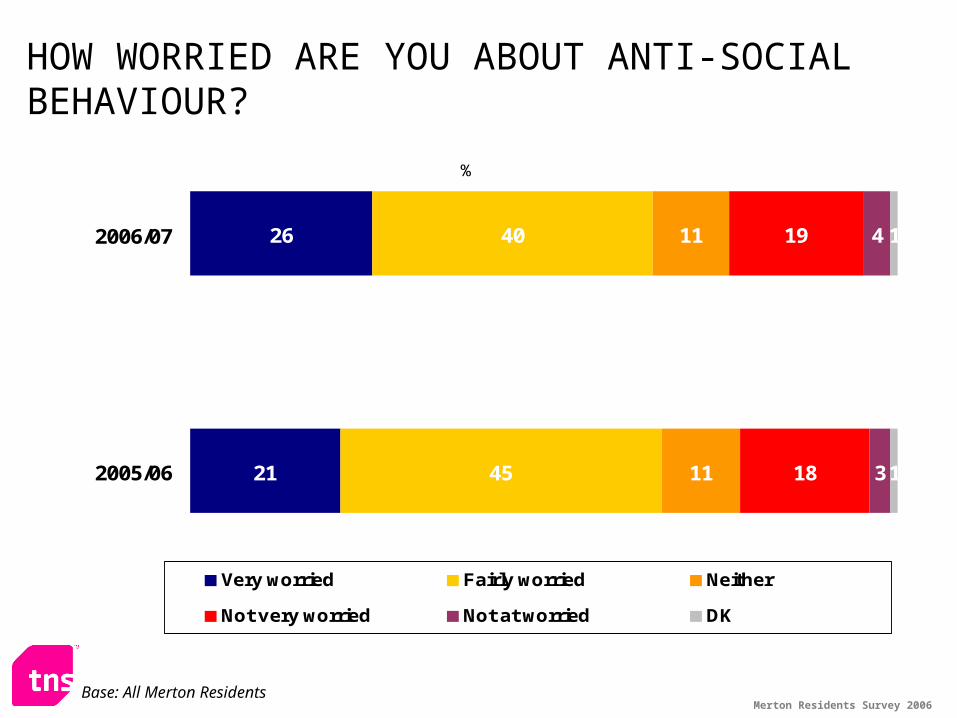
HOW WORRIED ARE YOU ABOUT ANTI-SOCIAL BEHAVIOUR?
26
21
40
45
11
11
19
18 3
1
1
42006/07
2005/06
%
Very worried Fairly worried Neither
Not very worried Not at worried DK
Base: All Merton Residents
Merton Residents Survey 2006
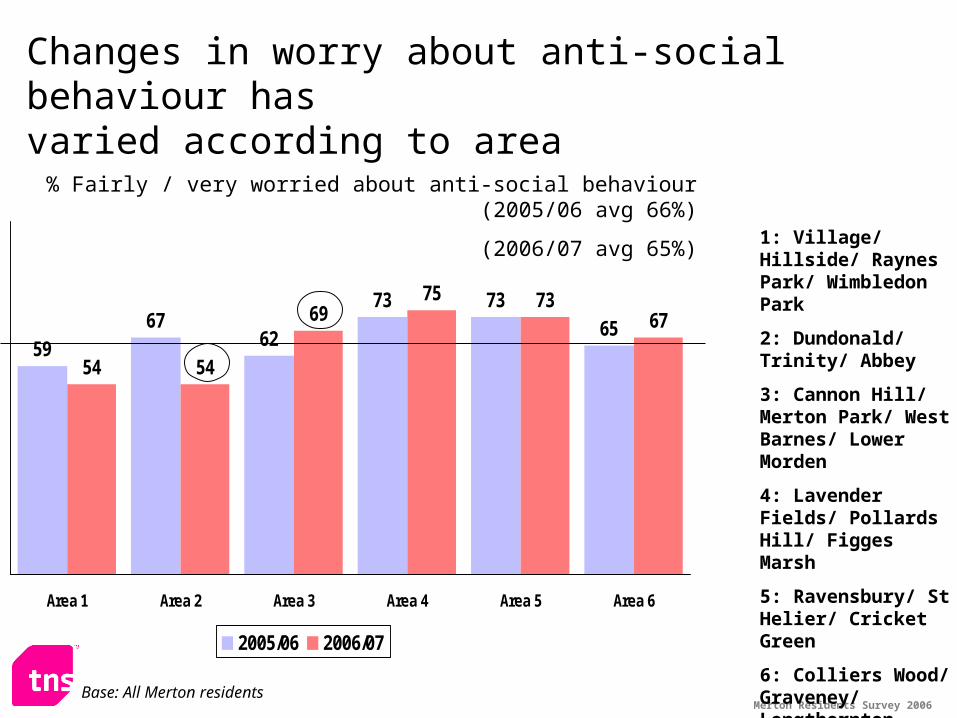
Changes in worry about anti-social behaviour has varied according to area
5967
62
73 7365
54 54
6975 73
67
Area 1 Area 2 Area 3 Area 4 Area 5 Area 6
2005/06 2006/07
% Fairly / very worried about anti-social behaviour (2005/06 avg 66%)
(2006/07 avg 65%)
Base: All Merton residents
1: Village/ Hillside/ Raynes Park/ Wimbledon Park
2: Dundonald/ Trinity/ Abbey
3: Cannon Hill/ Merton Park/ West Barnes/ Lower Morden
4: Lavender Fields/ Pollards Hill/ Figges Marsh
5: Ravensbury/ St Helier/ Cricket Green
6: Colliers Wood/ Graveney/ Longthornton
Merton Residents Survey 2006
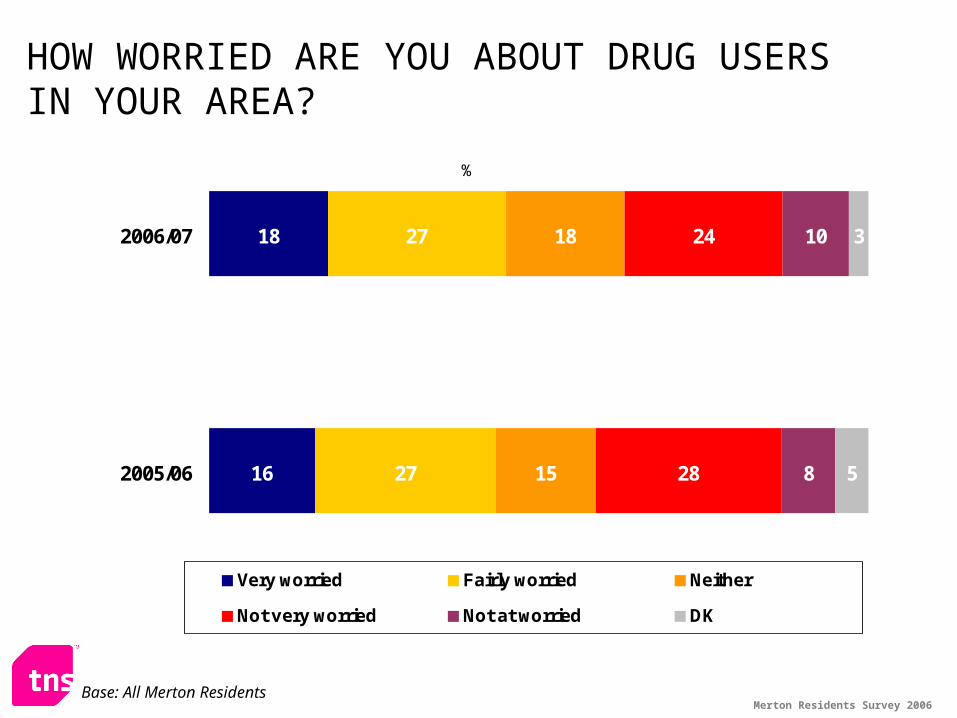
HOW WORRIED ARE YOU ABOUT DRUG USERS IN YOUR AREA?
18
16
27
27
18
15
24
28 8
3
5
102006/07
2005/06
%
Very worried Fairly worried Neither
Not very worried Not at worried DK
Base: All Merton Residents
Merton Residents Survey 2006
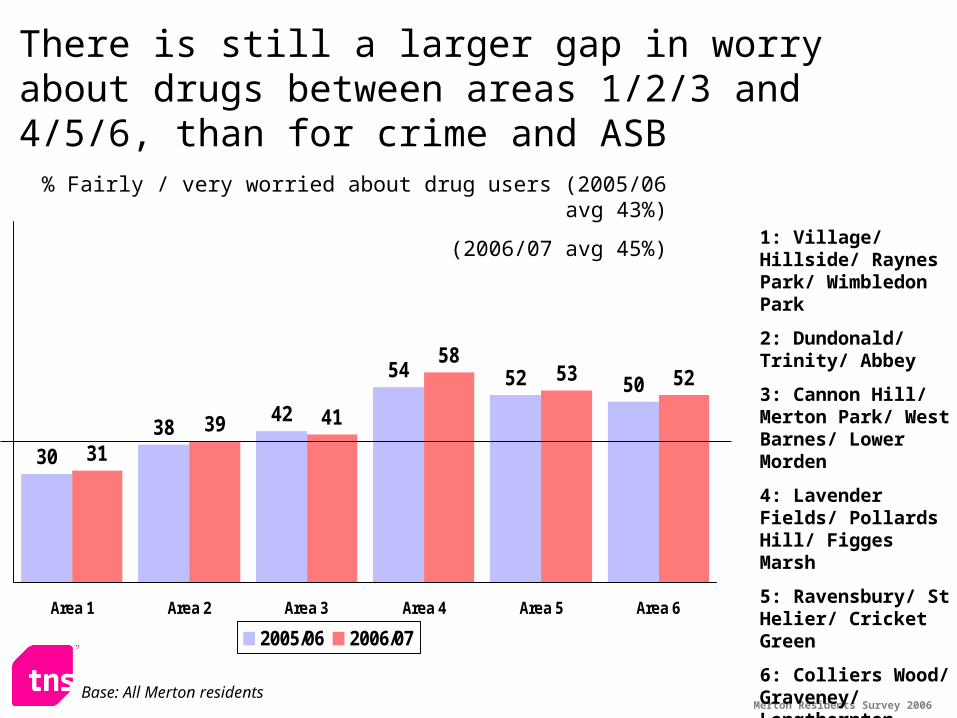
There is still a larger gap in worry about drugs between areas 1/2/3 and 4/5/6, than for crime and ASB
3038
42
54 52 50
3139 41
5853 52
Area 1 Area 2 Area 3 Area 4 Area 5 Area 6
2005/06 2006/07
% Fairly / very worried about drug users (2005/06 avg 43%)
(2006/07 avg 45%)
Base: All Merton residents
1: Village/ Hillside/ Raynes Park/ Wimbledon Park
2: Dundonald/ Trinity/ Abbey
3: Cannon Hill/ Merton Park/ West Barnes/ Lower Morden
4: Lavender Fields/ Pollards Hill/ Figges Marsh
5: Ravensbury/ St Helier/ Cricket Green
6: Colliers Wood/ Graveney/ Longthornton

Respect
Merton Residents Survey 2006
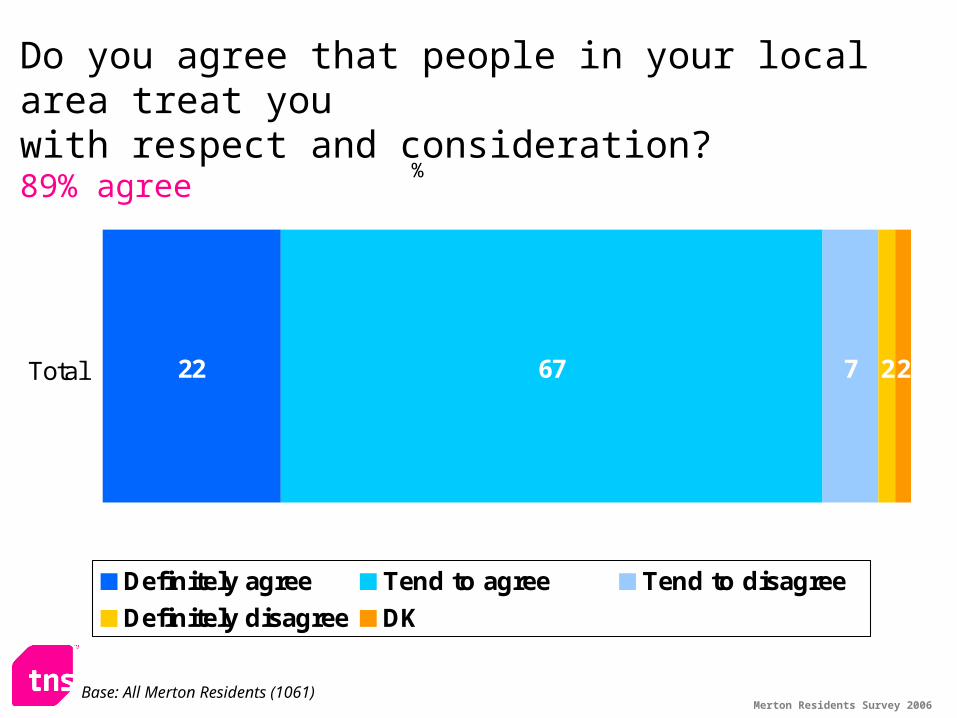
Do you agree that people in your local area treat you with respect and consideration?89% agree
22 67 7 22Total
%
Definitely agree Tend to agree Tend to disagree
Definitely disagree DK
Base: All Merton Residents (1061)
Merton Residents Survey 2006
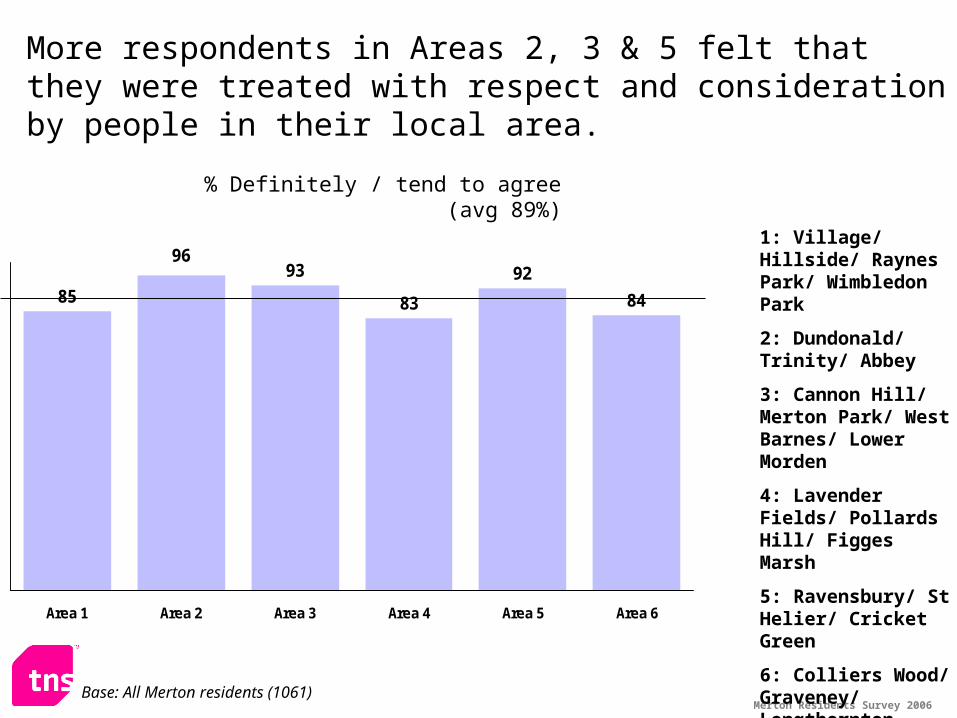
More respondents in Areas 2, 3 & 5 felt that they were treated with respect and consideration by people in their local area.
85
93
83
92
84
96
Area 1 Area 2 Area 3 Area 4 Area 5 Area 6
% Definitely / tend to agree (avg 89%)
Base: All Merton residents (1061)
1: Village/ Hillside/ Raynes Park/ Wimbledon Park
2: Dundonald/ Trinity/ Abbey
3: Cannon Hill/ Merton Park/ West Barnes/ Lower Morden
4: Lavender Fields/ Pollards Hill/ Figges Marsh
5: Ravensbury/ St Helier/ Cricket Green
6: Colliers Wood/ Graveney/ Longthornton
Merton Residents Survey 2006
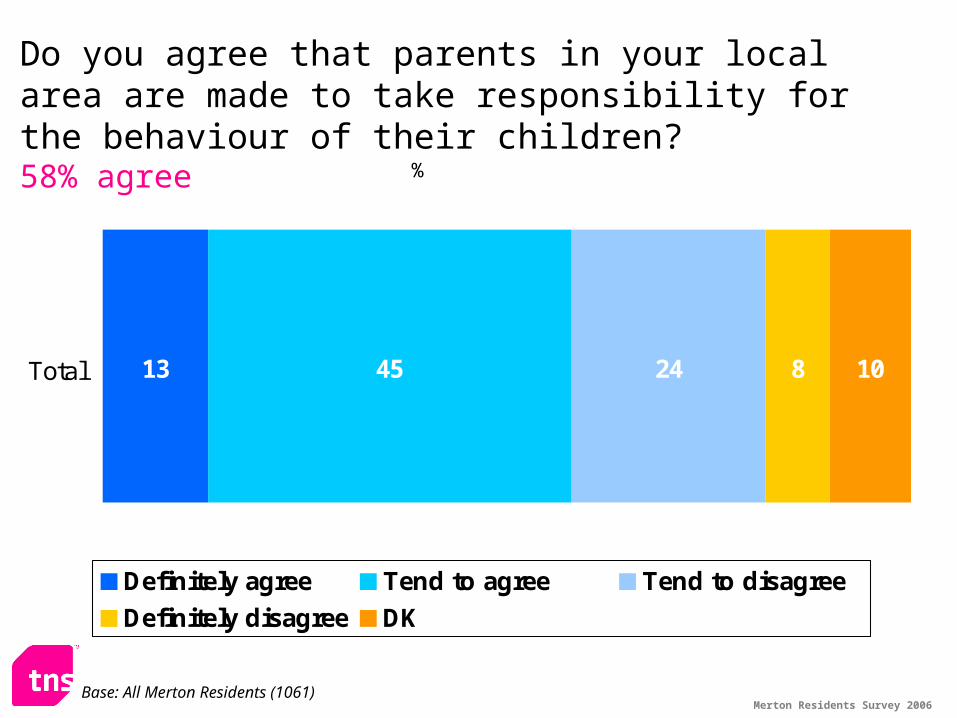
Do you agree that parents in your local area are made to take responsibility for the behaviour of their children?58% agree
13 45 24 8 10Total
%
Definitely agree Tend to agree Tend to disagree
Definitely disagree DK
Base: All Merton Residents (1061)
Merton Residents Survey 2006
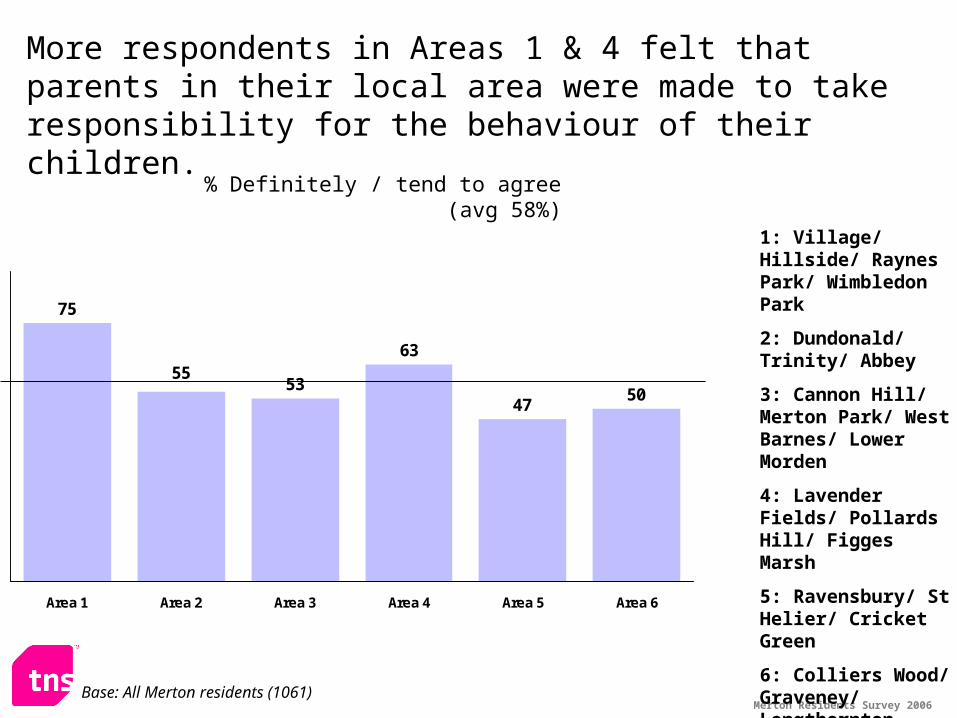
More respondents in Areas 1 & 4 felt that parents in their local area were made to take responsibility for the behaviour of their children.
75
53
63
4750
55
Area 1 Area 2 Area 3 Area 4 Area 5 Area 6
% Definitely / tend to agree (avg 58%)
Base: All Merton residents (1061)
1: Village/ Hillside/ Raynes Park/ Wimbledon Park
2: Dundonald/ Trinity/ Abbey
3: Cannon Hill/ Merton Park/ West Barnes/ Lower Morden
4: Lavender Fields/ Pollards Hill/ Figges Marsh
5: Ravensbury/ St Helier/ Cricket Green
6: Colliers Wood/ Graveney/ Longthornton

Community Activity
Merton Residents Survey 2006
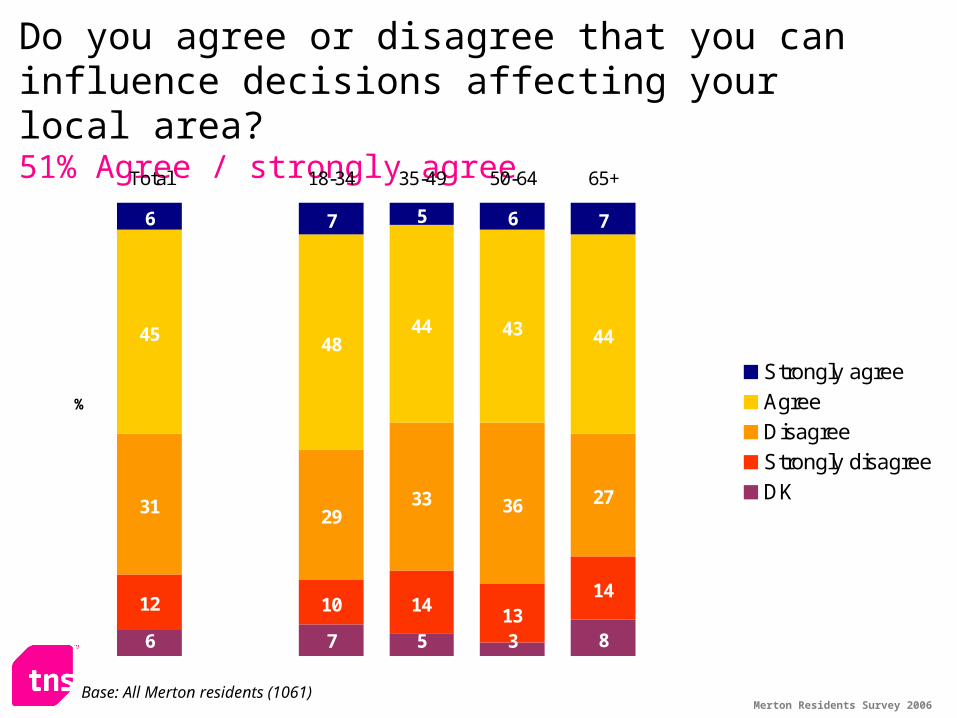
Do you agree or disagree that you can influence decisions affecting your local area?51% Agree / strongly agree
7 5 3 8
1413
14
31 2933 36 27
45 4844 43 44
7 5 6 7
6
1012
6
Total 18-34 35-49 50-64 65+
%
Strongly agree
Agree
Disagree
Strongly disagree
DK
Base: All Merton residents (1061)
Merton Residents Survey 2006
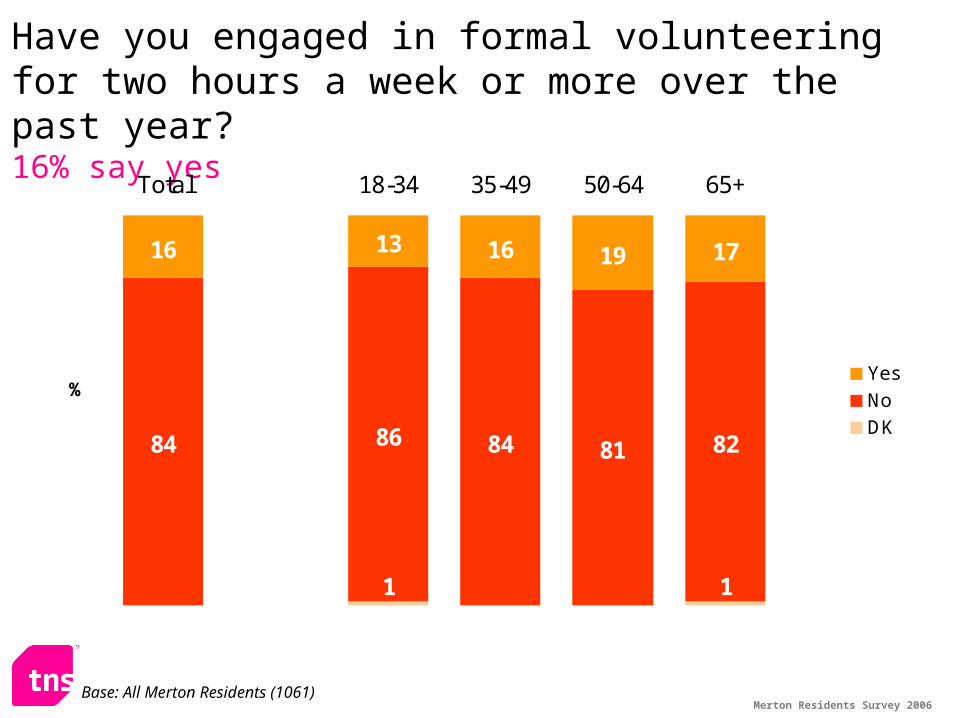
Have you engaged in formal volunteering for two hours a week or more over the past year?16% say yes
1
84 86 84 81 82
16 13 16 19 17
1
Total 18-34 35-49 50-64 65+
%Yes
No
DK
Base: All Merton Residents (1061)
Extra Questions for residents aged over 50
Merton Residents Survey 2006
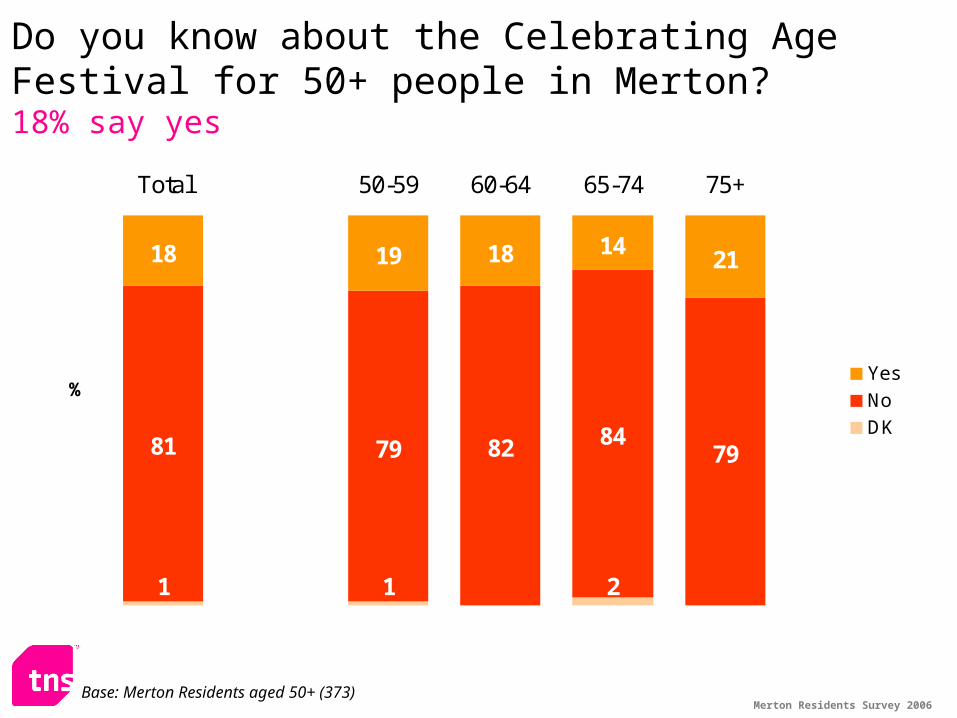
Do you know about the Celebrating Age Festival for 50+ people in Merton?18% say yes
1 1 2
81 79 82 8479
18 19 18 1421
Total 50-59 60-64 65-74 75+
%Yes
No
DK
Base: Merton Residents aged 50+ (373)
Merton Residents Survey 2006
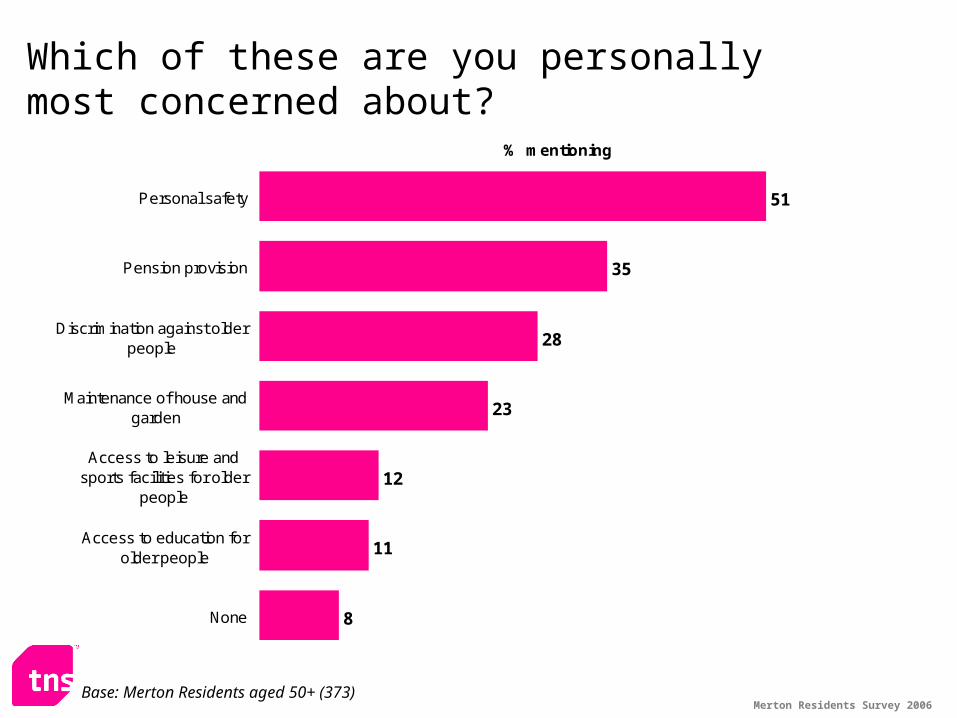
Which of these are you personally most concerned about?
51
35
28
23
12
11
8
Personal safety
Pension provision
Discrimination against olderpeople
Maintenance of house andgarden
Access to leisure andsports facilities for older
people
Access to education forolder people
None
% mentioning
Base: Merton Residents aged 50+ (373)
Merton Residents Survey 2006
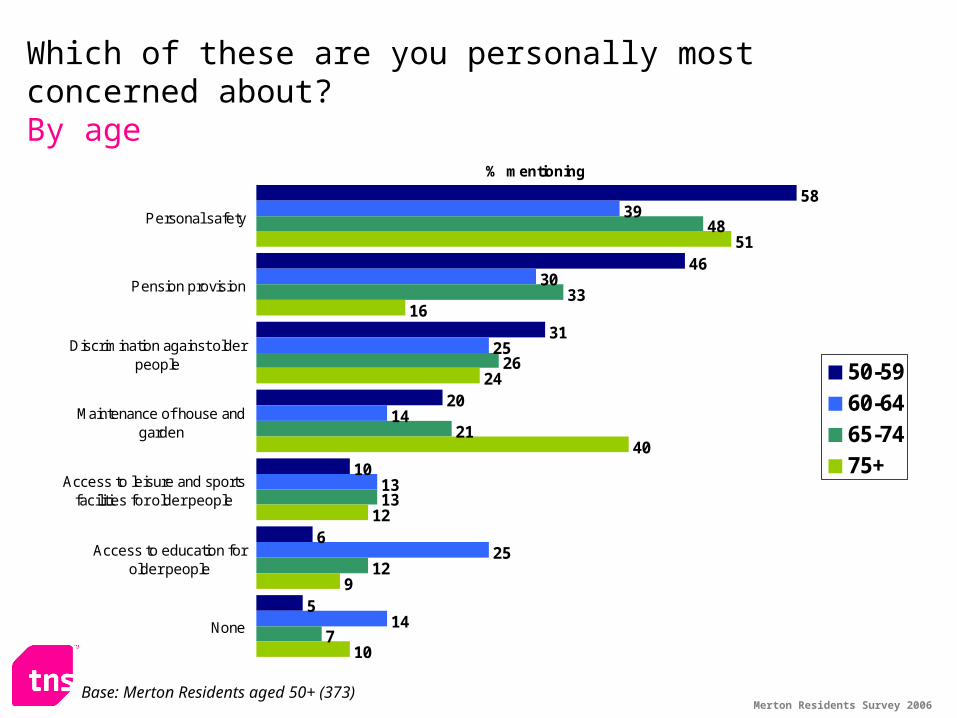
Which of these are you personally most concerned about?By age
58
46
31
20
10
6
5
39
30
25
14
13
25
14
48
33
26
21
13
12
7
51
16
24
40
12
9
10
Personal safety
Pension provision
Discrimination against olderpeople
Maintenance of house andgarden
Access to leisure and sportsfacilities for older people
Access to education forolder people
None
% mentioning
50-5960-6465-7475+
Base: Merton Residents aged 50+ (373)
Merton Residents Survey 2006
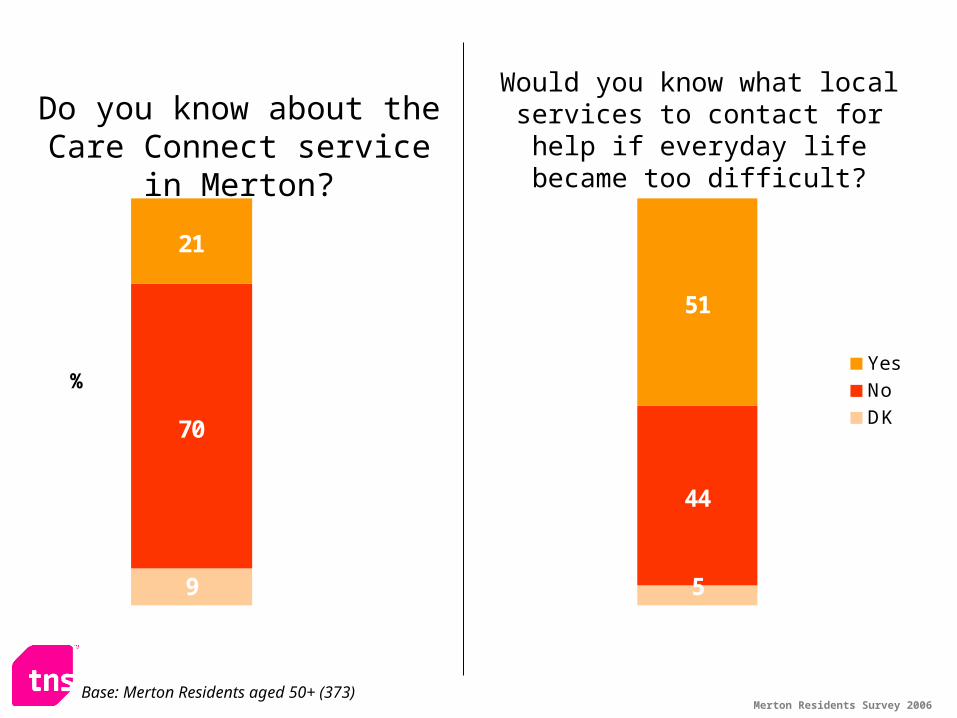
Do you know about the Care Connect service in Merton?
9 5
70
44
21
51
%Yes
No
DK
Base: Merton Residents aged 50+ (373)
Would you know what local services to contact for help if
everyday life became too difficult?
Merton Residents Survey 2006
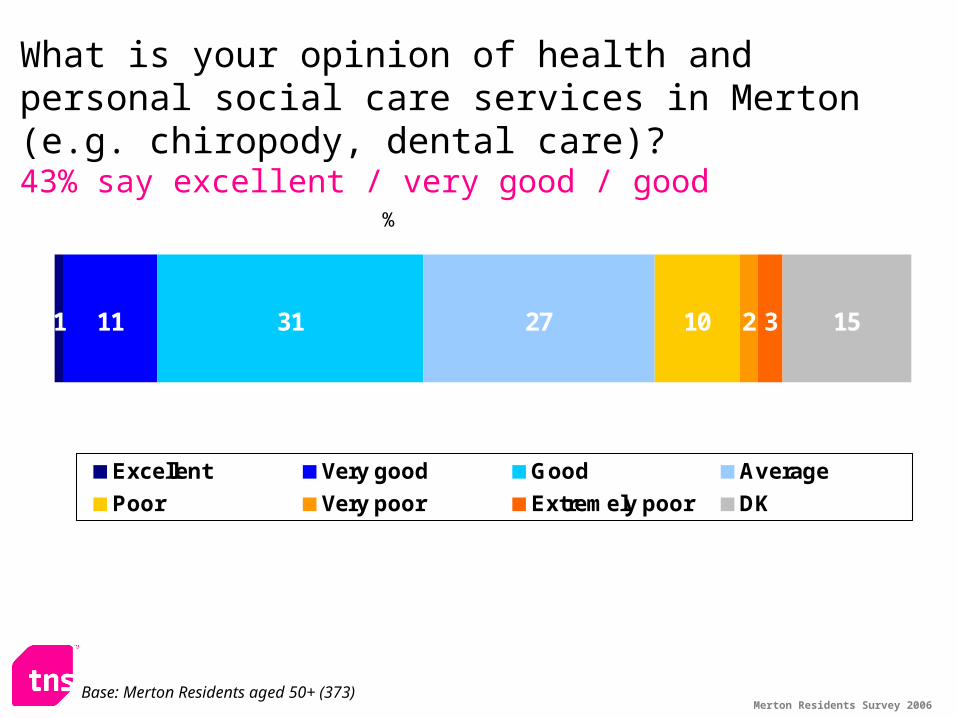
What is your opinion of health and personal social care services in Merton (e.g. chiropody, dental care)?43% say excellent / very good / good
1 11 31 27 2 3 1510
%
Excellent Very good Good Average
Poor Very poor Extremely poor DK
Base: Merton Residents aged 50+ (373)
Merton Residents Survey 2006
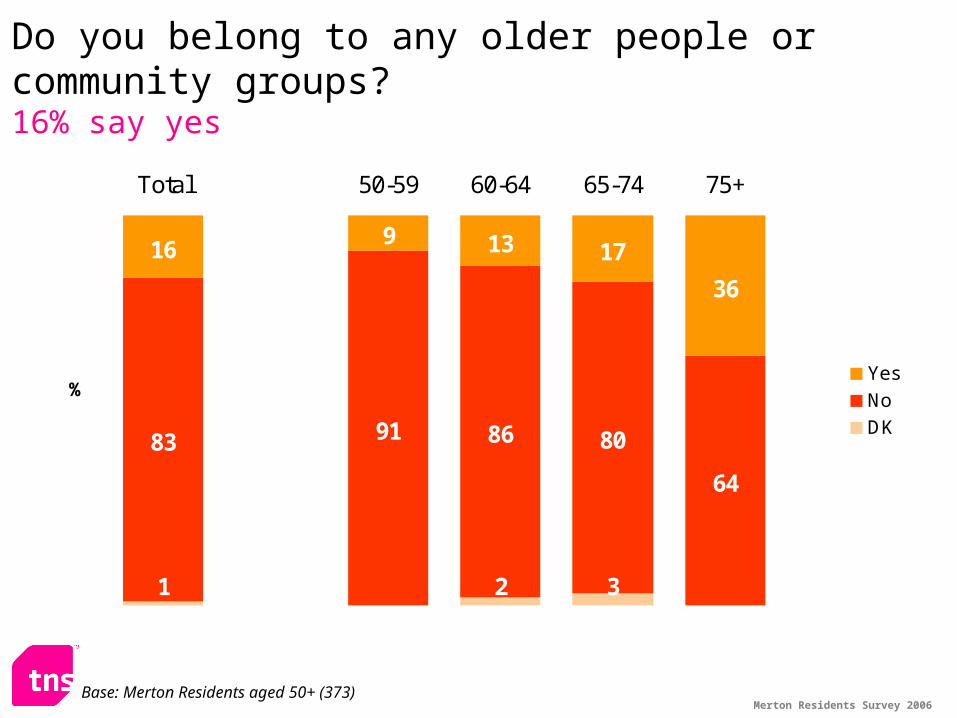
Do you belong to any older people or community groups?16% say yes
1 2 3
83 91 86 80
64
169 13 17
36
Total 50-59 60-64 65-74 75+
%Yes
No
DK
Base: Merton Residents aged 50+ (373)
Merton Residents Survey 2006
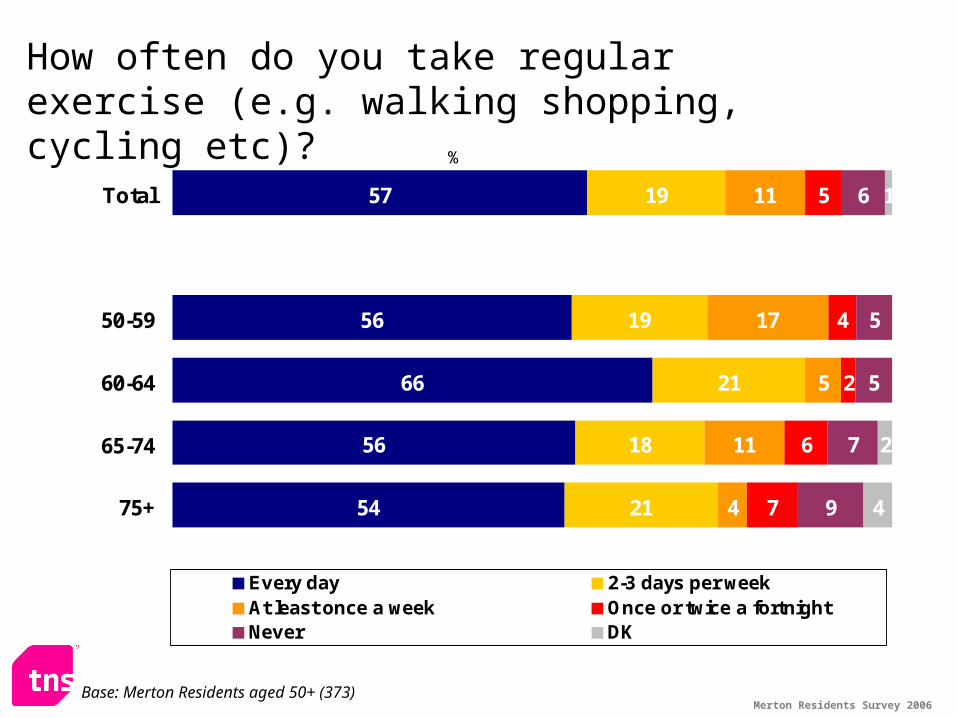
How often do you take regular exercise (e.g. walking shopping, cycling etc)?
57
56
66
56
54
19
19
21
18
21
11
17
5
11
4
5
4
2
6
7
5
5
7
9
1
2
4
6Total
50-59
60-64
65-74
75+
%
Every day 2-3 days per weekAt least once a week Once or twice a fortnightNever DK
Base: Merton Residents aged 50+ (373)
Merton Residents Survey 2006
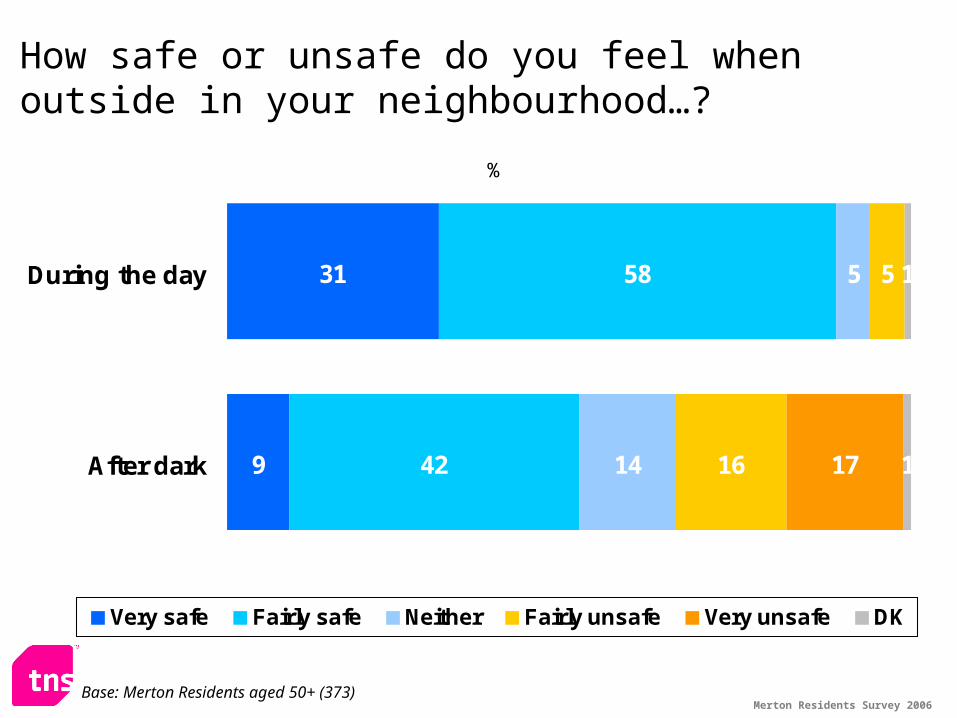
How safe or unsafe do you feel when outside in your neighbourhood…?
31
9
58
42
5
14
5
16 17
1
1
During the day
After dark
%
Very safe Fairly safe Neither Fairly unsafe Very unsafe DK
Base: Merton Residents aged 50+ (373)
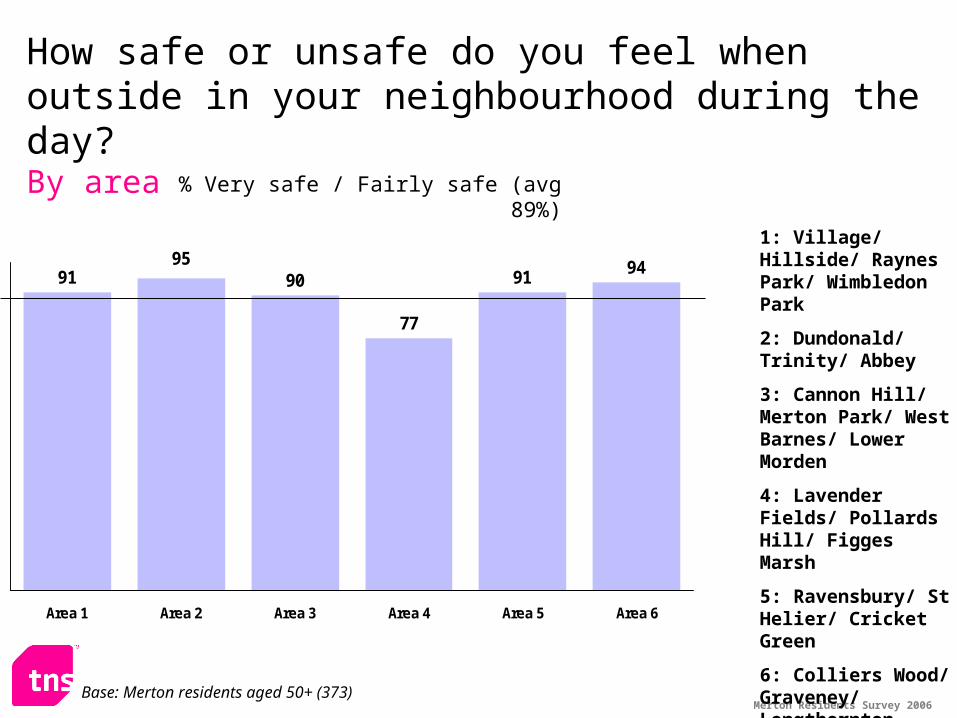
Merton Residents Survey 2006
How safe or unsafe do you feel when outside in your neighbourhood during the day?By area
91 90
77
91 9495
Area 1 Area 2 Area 3 Area 4 Area 5 Area 6
% Very safe / Fairly safe (avg 89%)
Base: Merton residents aged 50+ (373)
1: Village/ Hillside/ Raynes Park/ Wimbledon Park
2: Dundonald/ Trinity/ Abbey
3: Cannon Hill/ Merton Park/ West Barnes/ Lower Morden
4: Lavender Fields/ Pollards Hill/ Figges Marsh
5: Ravensbury/ St Helier/ Cricket Green
6: Colliers Wood/ Graveney/ Longthornton
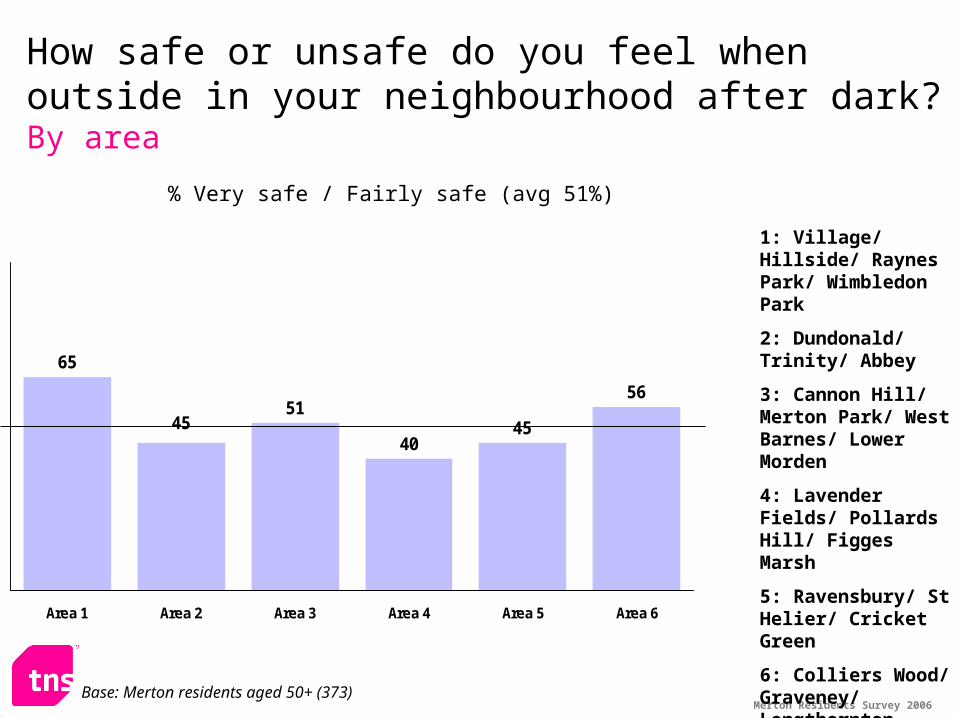
Merton Residents Survey 2006
65
51
4045
56
45
Area 1 Area 2 Area 3 Area 4 Area 5 Area 6
Base: Merton residents aged 50+ (373)
1: Village/ Hillside/ Raynes Park/ Wimbledon Park
2: Dundonald/ Trinity/ Abbey
3: Cannon Hill/ Merton Park/ West Barnes/ Lower Morden
4: Lavender Fields/ Pollards Hill/ Figges Marsh
5: Ravensbury/ St Helier/ Cricket Green
6: Colliers Wood/ Graveney/ Longthornton
How safe or unsafe do you feel when outside in your neighbourhood after dark?By area
% Very safe / Fairly safe (avg 51%)
Merton Residents Survey 2006
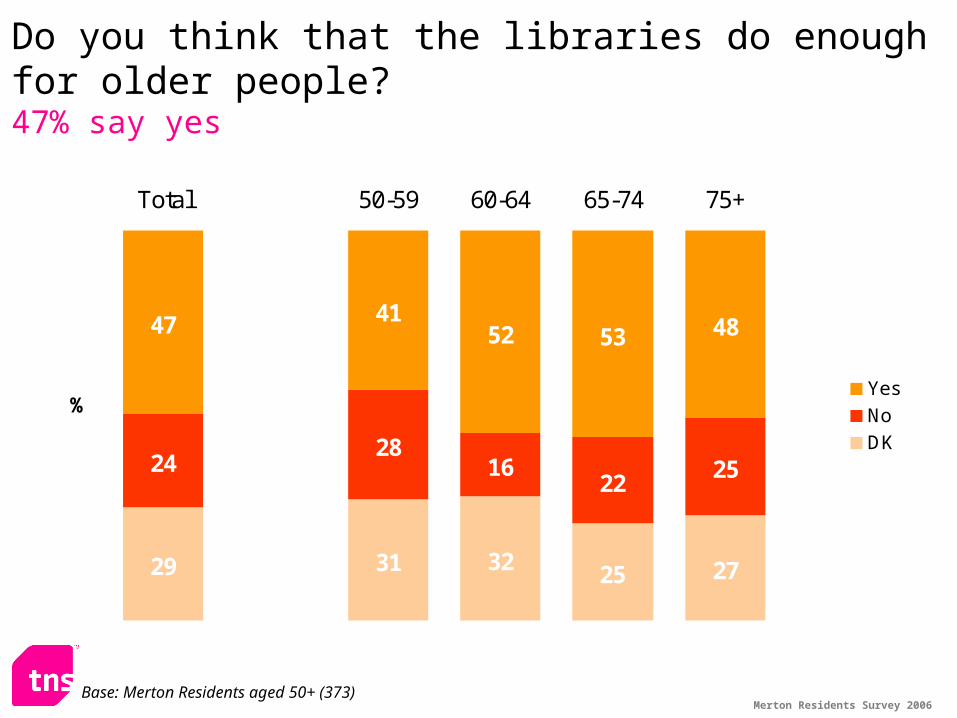
Do you think that the libraries do enough for older people?47% say yes
29 31 32 25 27
2428
1622
25
47 4152 53 48
Total 50-59 60-64 65-74 75+
%Yes
No
DK
Base: Merton Residents aged 50+ (373)
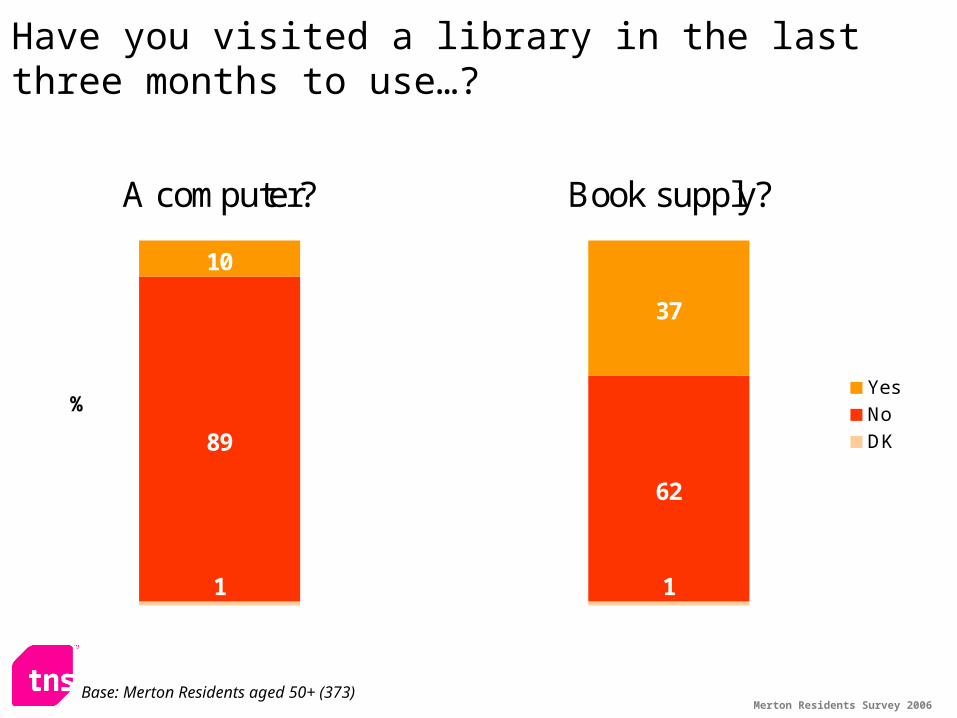
Merton Residents Survey 2006
Have you visited a library in the last three months to use…?
1 1
89
62
10
37
A computer? Book supply?
%Yes
No
DK
Base: Merton Residents aged 50+ (373)

Merton Residents Survey 2006
Young Persons Survey
Merton Residents Survey 2006
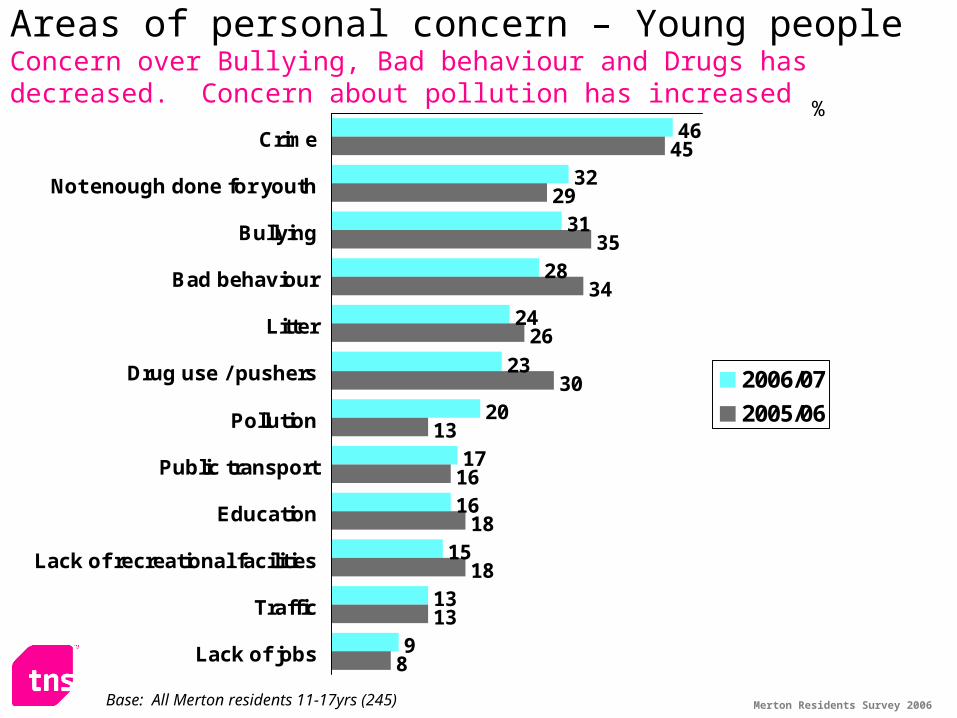
46
32
31
28
24
23
20
17
16
15
13
9
45
29
35
34
26
30
13
16
18
18
13
8
Crime
Not enough done for youth
Bullying
Bad behaviour
Litter
Drug use / pushers
Pollution
Public transport
Education
Lack of recreational facilities
Traffic
Lack of jobs
2006/07
2005/06
Areas of personal concern – Young peopleConcern over Bullying, Bad behaviour and Drugs has decreased. Concern about pollution has increased
Base: All Merton residents 11-17yrs (245)
%
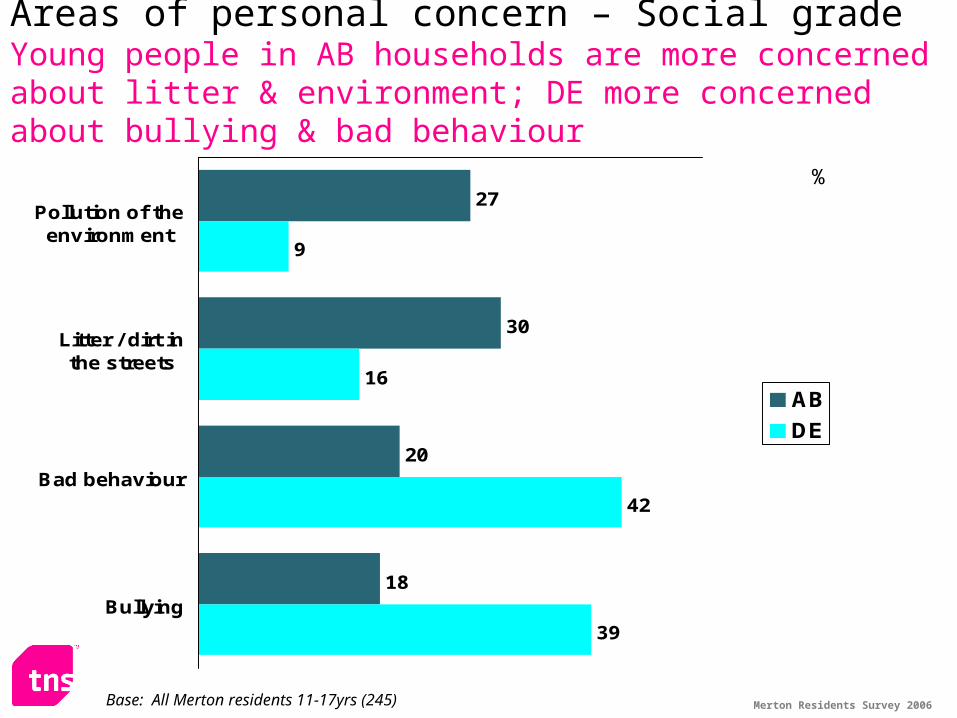
Merton Residents Survey 2006
27
30
20
18
9
16
42
39
Pollution of theenvironment
Litter / dirt inthe streets
Bad behaviour
Bullying
AB
DE
Areas of personal concern – Social grade Young people in AB households are more concerned about litter & environment; DE more concerned about bullying & bad behaviour
Base: All Merton residents 11-17yrs (245)
%
Merton Residents Survey 2006
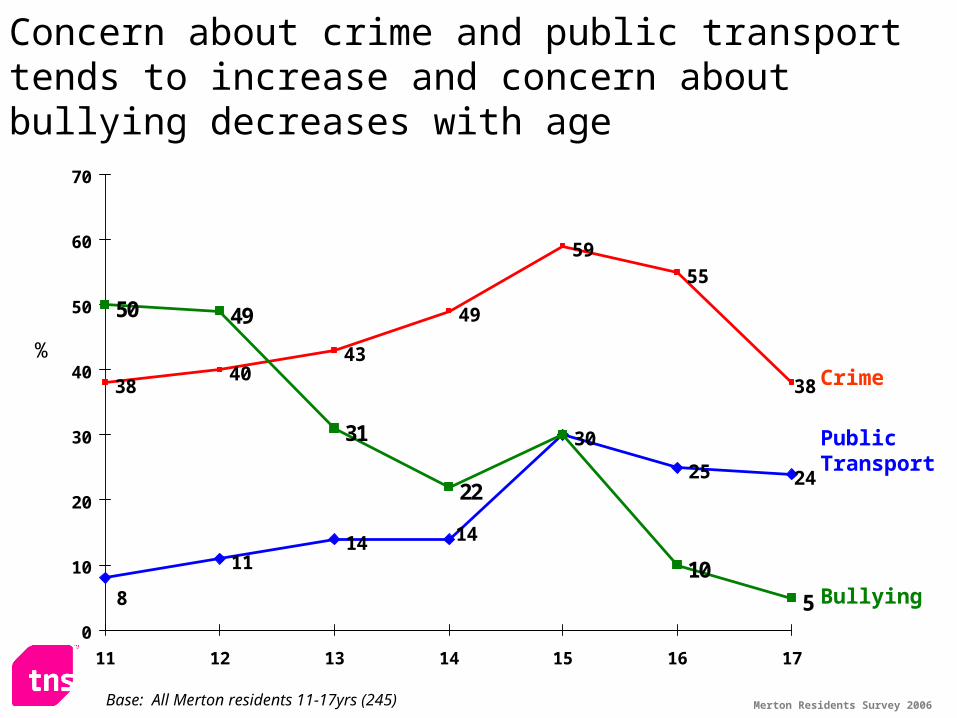
3840
43
49
5955
38
1114
30
25 24
50 49
31
22
10
58
14
0
10
20
30
40
50
60
70
11 12 13 14 15 16 17
Public Transport
Crime
Concern about crime and public transport tends to increase and concern about bullying decreases with age
Bullying
Base: All Merton residents 11-17yrs (245)
%
Merton Residents Survey 2006
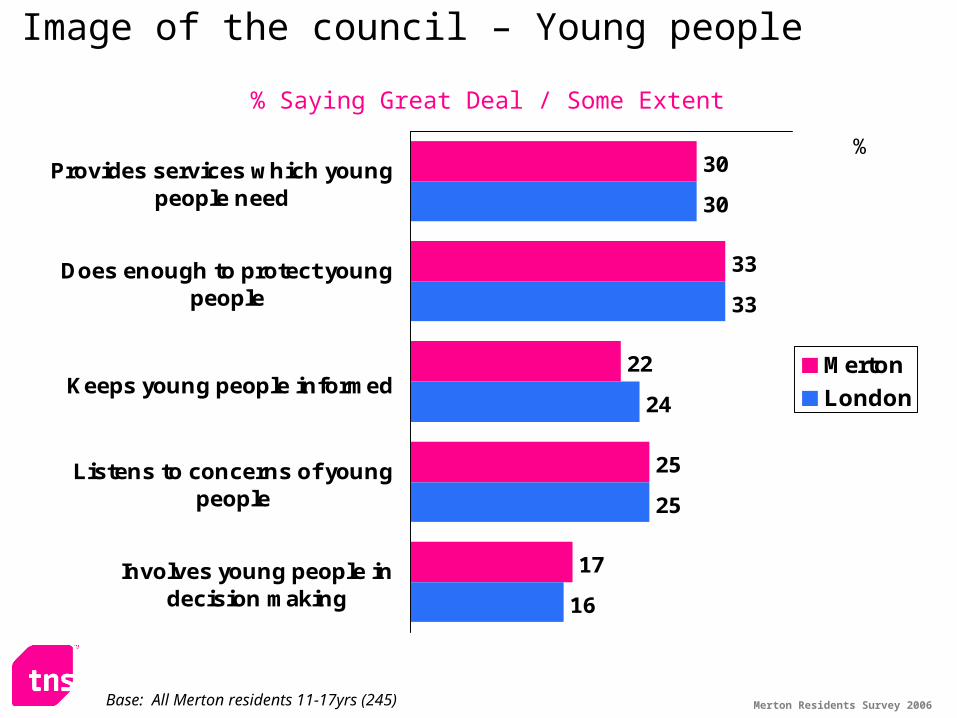
Image of the council – Young people
% Saying Great Deal / Some Extent
30
33
22
25
17
30
33
24
25
16
Provides services which youngpeople need
Does enough to protect youngpeople
Keeps young people informed
Listens to concerns of youngpeople
Involves young people indecision making
Merton
London
Base: All Merton residents 11-17yrs (245)
%
Merton Residents Survey 2006
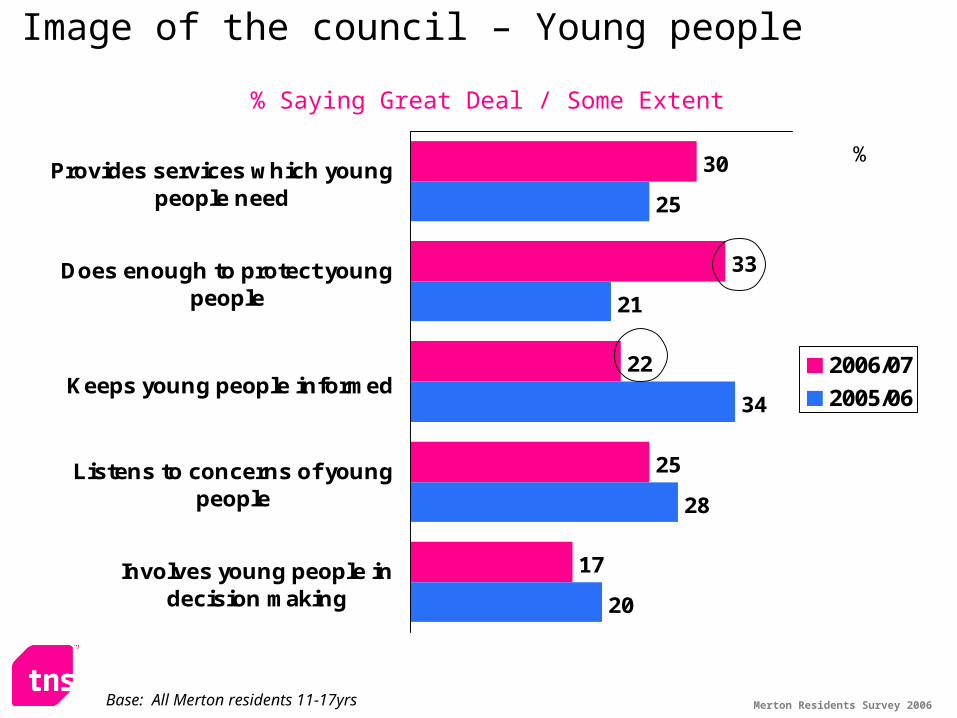
Image of the council – Young people
% Saying Great Deal / Some Extent
30
33
22
25
17
25
21
34
28
20
Provides services which youngpeople need
Does enough to protect youngpeople
Keeps young people informed
Listens to concerns of youngpeople
Involves young people indecision making
2006/07
2005/06
Base: All Merton residents 11-17yrs
%
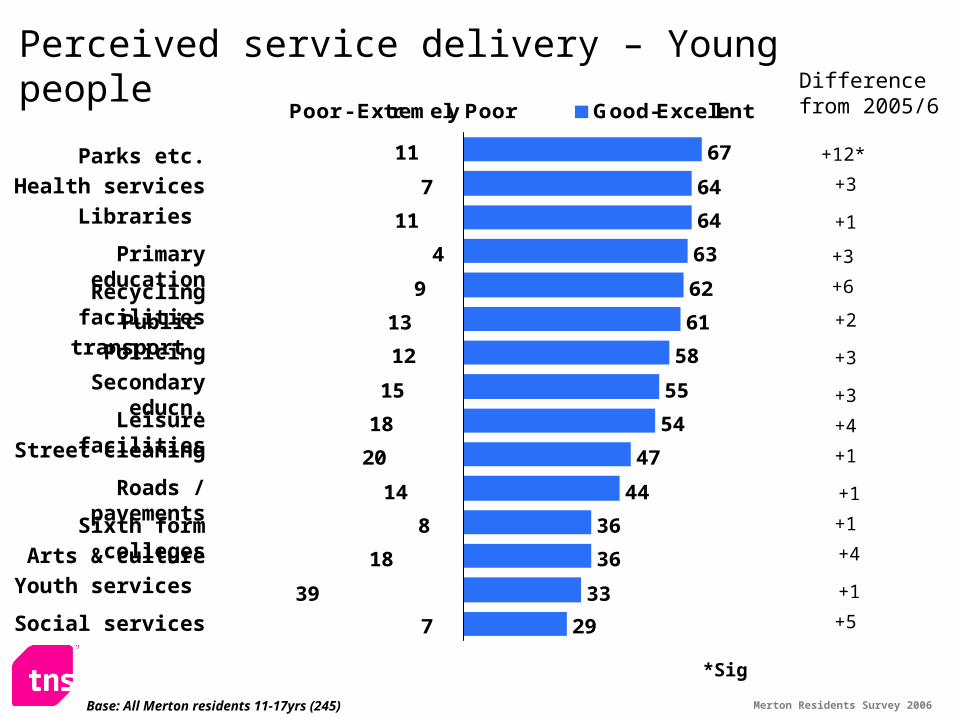
Merton Residents Survey 2006Base: All Merton residents 11-17yrs (245)
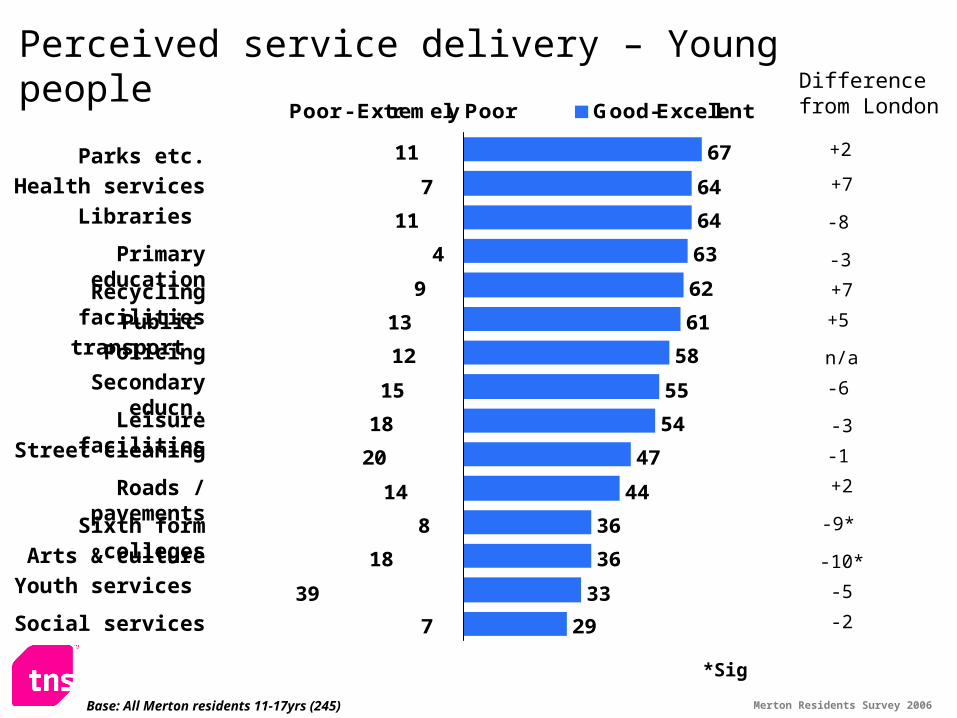
Perceived service delivery – Young peopleDifference from 2005/6
+12*
+3
+1
+3
+6
+2
+3
+3
+1
+1
+1
+4
+5
+1
+4
Arts & culture
Recycling facilities
Public transport
Libraries
Parks etc.
Health services
Street cleaning
Policing
Leisure facilities
Primary education
Roads / pavements
Sixth form colleges
Secondary educn.
Social services
Youth services
*Sig
11
7
11
4
9
13
12
15
18
20
14
8
18
39
7
67
64
64
63
62
61
58
55
54
47
44
36
36
33
29
Poor - Extremely Poor Good-Excellent
Merton Residents Survey 2006Base: All Merton residents 11-17yrs (245)
Perceived service delivery – Young peopleDifference
from London
+2
+7
-8
-3
-2
+7
+5
n/a
-6
-3
-1
+2
-9*
-10*
-5
Arts & culture
Recycling facilities
Public transport
Libraries
Parks etc.
Health services
Street cleaning
Policing
Leisure facilities
Primary education
Roads / pavements
Sixth form colleges
Secondary educn.
Social services
Youth services
*Sig
11
7
11
4
9
13
12
15
18
20
14
8
18
39
7
67
64
64
63
62
61
58
55
54
47
44
36
36
33
29
Poor - Extremely Poor Good-Excellent
Merton Residents Survey 2006
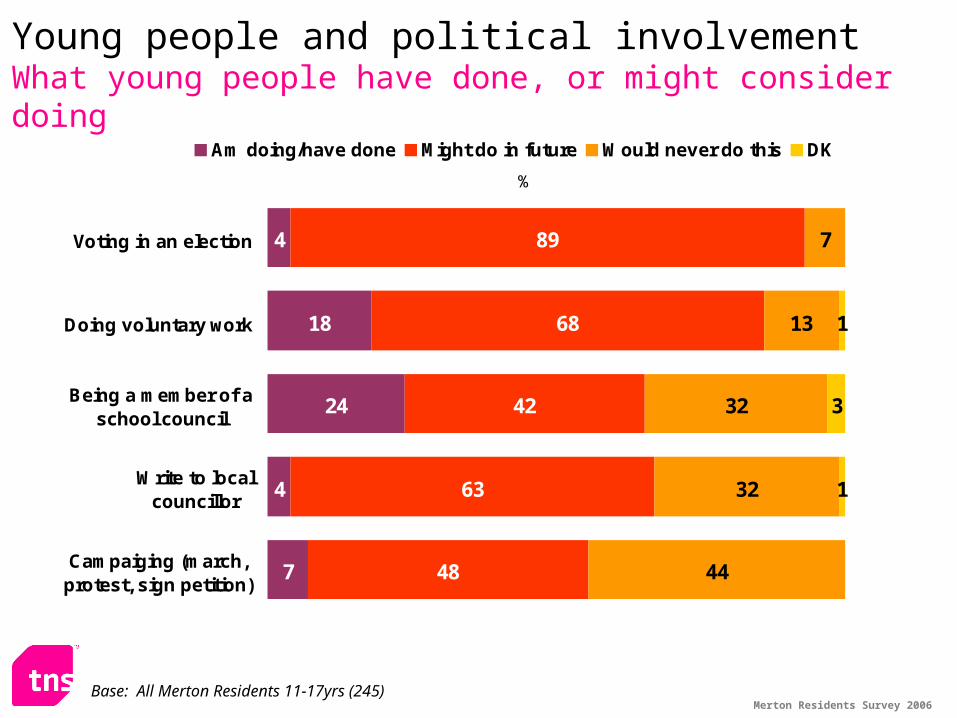
Young people and political involvementWhat young people have done, or might consider doing
18
24
4
7
89
68
42
63
48
7
13
32
32
44
1
3
1
4Voting in an election
Doing voluntary work
Being a member of aschool council
Write to localcouncillor
Campaiging (march,protest, sign petition)
%
Am doing/have done Might do in future Would never do this DK
Base: All Merton Residents 11-17yrs (245)

Merton Residents Survey 2006
Out of school activities attended67% engage in at least one activity, with sports/gym most popular
40
1917
15
96
2
40
2017
12
64
2
Sports /gym
Drama /Dance /Music
After-school club
Youth club Scout /adventure /cadet grps
Other Breakfastclub
2005/06
2006/07
Base: All Merton residents 11-17yrs
%
Male 52%
Female 26%
Male 15%
Female 25%
Merton Residents Survey 2006
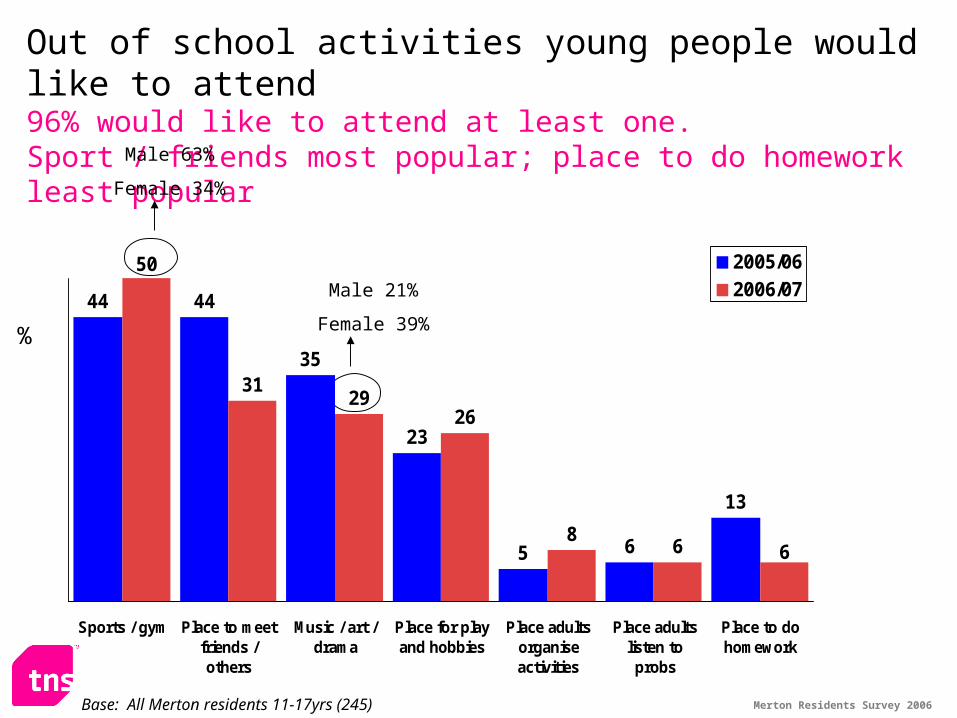
Out of school activities young people would like to attend96% would like to attend at least one. Sport / friends most popular; place to do homework least popular
Base: All Merton residents 11-17yrs (245)
%
Male 63%
Female 34%
Male 21%
Female 39%44 44
35
23
5 6
13
50
3129
26
86 6
Sports / gym Place to meetfriends /others
Music / art /drama
Place for playand hobbies
Place adultsorganiseactivities
Place adultslisten toprobs
Place to dohomework
2005/062006/07

SummarySummary
Merton Residents Survey 2006
SUMMARY - ISSUES
Council tax remains the number one issue in Merton, though concern about crime is not far behind.
Concern about litter has fallen this year and is now the fourth biggest area of concern in Merton.
Concern over affordable housing, services for the elderly and public transport have also risen in the past year.
Merton Residents Survey 2006
SUMMARY - IMAGE
Following a decline in the last two years, the percentage of people saying the Council does a “good job” increased significantly this year
Ratings improved for Council staff being efficient & well run, making the local area a better place to live and keeping residents informed
There were no significant declines in any aspects of the council’s image.
Merton Residents Survey 2006
SUMMARY - SERVICES
Educational services for all ages, from nurseries to evening classes, improved this year.
Facilities in parks, libraries, street lighting and street cleaning were also seen to have improved considerably in the last 12 months.
Among users, all aspects of council services showed an improvement over the past year.
Merton Residents Survey 2006
SUMMARY – Other local issues
Worry about crime and anti-social behaviour in Merton had decreased a little. 89% of respondents felt that people in their local area treated them with respect and consideration.
Attitudes towards the Council’s policy towards discrimination, race and social cohesion had not changed much over the past year.
Half of respondents felt that they were able to influence decisions affecting their local area.
Merton Residents Survey 2006
SUMMARY – Issues for older residents
18% of respondents aged over 50 had heard of the Celebrating Age Festival for 50+ people in Merton
They were most concerned about personal safety and pension provision.
89% felt safe outside in their neighbourhood during the day; 51% felt safe outside in their neighbourhood after dark.
Just under half of older respondents were happy with library services or health and personal social care services in Merton.
Merton Residents Survey 2006
SUMMARY – Young people
Crime is the main area of concern among young people in Merton. Concern over bullying, bad behaviour and drug users / pushers had declined in the past year.
Over the past 12 months, an increased proportion of young people felt that the Council does enough to protect them, though they felt that the Council could be doing more to keep them informed
Young people saw improvements over all aspects of Council service delivery, particularly in the delivery of local park services.
Two thirds of young people engage in at least one out of school activity, with sports/ gym being the most popular, particularly among boys. Dance/ drama/ music is the second most popular activity, but more so among girls than boys.
96% of young people would like to attend at least one out of school activity.