Embed Size (px)
Citation preview

MERRILL LYNCH SUN CITY CONFERENCE
March 2017
Darryll Castle - CEO
Tryphosa Ramano – CFO

2MERRILL LYNCH SUN CITY CONFERENCE MARCH 2017
AGENDA
IntroductionCorporate
Update
Operational Update
Going Forward Questions
CORPORATE UPDATE

4MERRILL LYNCH SUN CITY CONFERENCE MARCH 2017
PROGRESS ON KEY DELIVERABLES
Delivering on our short term strategy
A. DIVERSIFIED PORTFOLIO
• Increasingly diversified portfolio with multiple operating sites in South Africa, embedding of the materials division and expansion into the rest of the African continent
• Operations in the rest of the African continent contributing >30% of group EBITDA
• Delivery of Harare Msasa mill on-time and below budget
• Commissioning of cement plants underway in the DRC and Ethiopia
• Materials division contributing ~20% of group revenue
• The business remains highly cash generative with cash earnings per share consistently exceeding headline earnings per share
B. CAPITAL STRUCTURE MANAGEMENT
• Successful rights issue has led to a significantly improved capital structure
• Net debt reduced from R9billion to R5,3 billion after the rights issue in September 2016
• Equity attributable to shareholders of PPC has risen from R3 billion to almost R7 billion as at September 2016
• In December 2016, net debt reduced further to R4,4 billion following inflows from the B-BBEE I transaction
C. SIGNIFICANTLY ENHANCING
EFFICIENCIES
• Profit Improvement Programme target of R400 million exceeded in less than 18 months – programme continues to be driven and measured internally
• Commissioning of Slurry SK9 upgrade project will yield material cost savings due to lower energy and maintenance costs
• PPC’s inland kilns will be as cost competitive as other modern players in the industry
• 3 mega-plant strategy is bearing fruit with variable and fixed costs reducing over time; while productivity levels rose 12% since 2012
• New Harare mill will ensure reduced costs, improving Zimbabwe’s EBITDA margin by 3% -5%
5MERRILL LYNCH SUN CITY CONFERENCE MARCH 2017
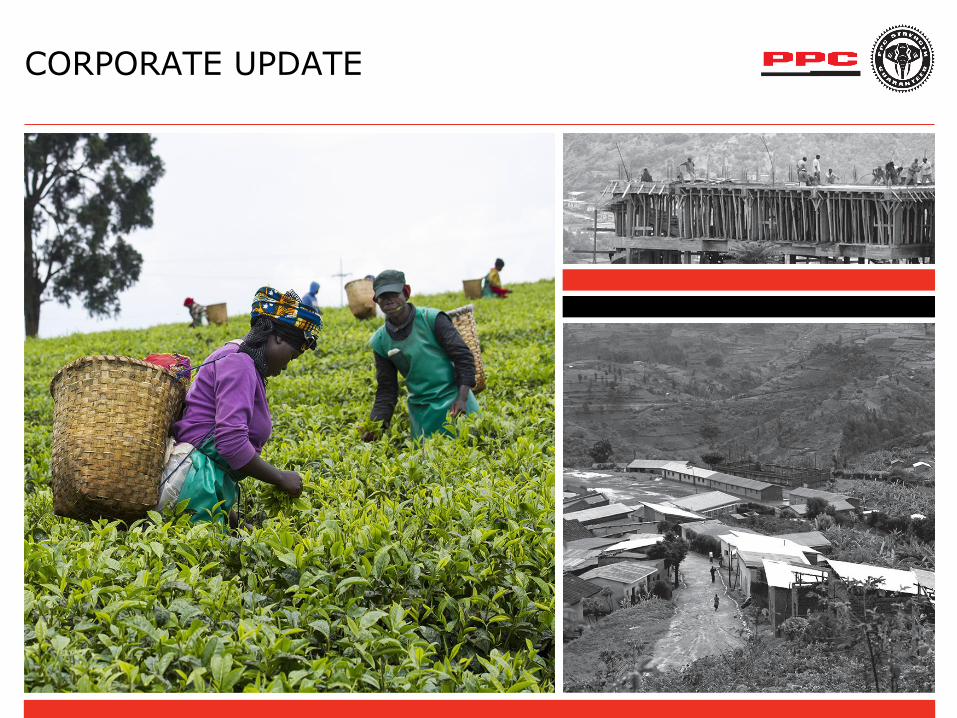
Botswana
Population – 2,2 million
Urbanisation – 57,4%
GDP per capita – US$5 897
Cement consumption/capita – 294 kg
Real GDP growth (16 – 19E) – 4,3%
Current national cement production capacity – 0,6 mtpa
Limestone reserves – Not applicable
Employees – 139
Ethiopia
Population – 91,2 million
Urbanisation – 19,5%
GDP per capita – US$735
Cement consumption/capita – 65 kg
Real GDP growth (16 – 19E) – 6,6%
Current national cement production capacity – 11 mtpa
Limestone reserves – 25 years
Employees – 110
Zimbabwe
Population – 13,6 million
Urbanisation – 32,4%
GDP per capita – US$1 082
Cement consumption/capita – 75 kg
Real GDP growth (16 – 19E) – 3,4%
Current national cement production capacity – 2,2 mtpa
Limestone reserves – 42 years
Employees – 472*
A. DIVERSIFIED PORTFOLIO – OUR FOOTPRINT
Democratic Republic of the Congo
Population – 84,1 million
Urbanisation – 42,5%
GDP per capita – US$490
Cement consumption/capita – 24 kg
Real GDP growth (16 – 19E) – 5,5%
Current national cement production capacity – 1,4 mtpa
Limestone reserves – 54 years
Employees – 63
Rwanda
Population – 11,6 million
Urbanisation – 28,8%
GDP per capita – US$732
Cement consumption/capita – 50 kg
Real GDP growth (16 – 19E) – 6,7%
Current national cement production capacity – 0,7 mtpa
Limestone reserves – 13 years
Employees – 252
* Includes two employees in Mozambique
Countries of operation
Source: International Monetary Fund and PPC estimates
ETHIOPIA
RWANDA
DEMOCRATIC REPUBLIC OF THE CONGO (DRC)
MOZAMBIQUE
ZIMBABWE
BOTSWANA SOUTH AFRICA
MAP KEY
Current operation
Current operation and current project
Current project and export market
Export markets
Current project
South Africa
Population – 55,8 million
Urbanisation – 64,8%
GDP per capita – US$4 768
Cement consumption/capita – 248 kg
Real GDP growth (16 – 19E) – 1,6%
Current national cement production capacity – 17mtpa
Limestone reserves – 240 years
Employees – 2 378
PPC operations on the African continent service 22% of the total population in Africa – PPC is well positioned to take advantage of the infrastructure growth
opportunities on the continent

6MERRILL LYNCH SUN CITY CONFERENCE MARCH 2017
A. DIVERSIFIED PORTFOLIO – PPC CAPACITY
0
100 000
200 000
300 000
400 000
500 000
600 000
700 000
2013 2015
Rwanda Capacity (tpa)
0
500 000
1 000 000
1 500 000
2001 2016
Zimbabwe Capacity (tpa)
PPC invested in CIMERWA in 2013 aspart of its expansion strategy into therest of Africa
CIMERWA had a 100 000 tpa wet feedkiln system
In 2015, CIMERWA commissioned the600 000 tpa state-of-the-art five stagepreheater calciner
CIMERWA is now a regional player withEBITDA margins >30% and share of theRwandan market of ~50%
Now contributes over one tenth ofgroup EBITDA
PPC invested in Zimbabwe in 2001 as oneof the first movers into the rest of Africa
PPC Zimbabwe cement capacity has nowincreased from 1mtpa to 1.4mtpa
The Harare Msasa mill was commissionedat the end of 2016 on-time and belowbudget
PPC Zimbabwe contributes in excess of20% to group EBITDA
PPC is well positioned to take advantage of growth in these key
markets
7MERRILL LYNCH SUN CITY CONFERENCE MARCH 2017
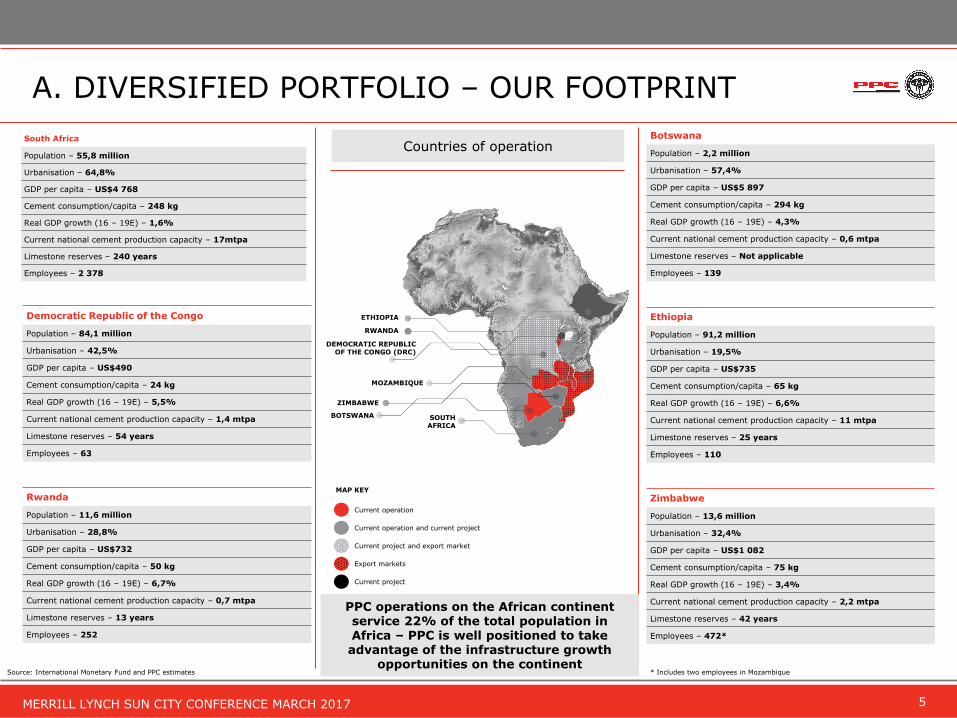
Capacity build up 2016 – 2018 (mt)
A. DIVERSIFIED PORTFOLIO - PPC CAPACITY
9,3
1,0
1,4 11,7
1,0 12,7
0,0
2,0
4,0
6,0
8,0
10,0
12,0
14,0
Capacity 2016(including Rwandaand Zimbabwe's
increased capacity)
DRC Ethiopia Capacity 2017 SK9 Capacity 2018
~40% of capacity will be from RoA operations in calendar 2017

8MERRILL LYNCH SUN CITY CONFERENCE MARCH 2017
A. DIVERSIFIED PORTFOLIO – MATERIALS DIVISION
Rm 6m Mar2016 (A)
6m Sept 2016 (B)
12m(A+B)
Revenue Revenue Revenue
Lime 383 406 789
Aggregates & Readymix
503 713 1 216
Total 886 1 119 2 005
Rm 6m Mar2016 (A)
6m Sept2016 (B)
12m(A+B)
EBITDA EBITDA EBITDA
Lime 96 96 192
Aggregates& Readymix
76 103 282
Total 172 199 371
PPC has a diverse offering with the Lime division and the Aggregates and Readymix division
Acquisitions of Pronto Readymix and 3Q Mahuma Concrete have given further impetus to the materials division strategy
The materials division contributes ~20% of group revenue
• Reviewed interim results used for figures relating to 6m to Sept 2016
• Twelve month figure has been aggregated and not annually adjusted

9MERRILL LYNCH SUN CITY CONFERENCE MARCH 2017
Highly cash-generative business
Business continues to generate superior cash earnings despite capital expenditure requirements
Cash conversion target of 1x continues to be actively monitored
Good working capital management critical for enhanced cash generation
A. DIVERSIFIED PORTFOLIO – CASH MGMT.
0
50
100
150
200
250
300
350
400
450
Sep-0
8
Sep-0
9
Sep-1
0
Sep-1
1
Sep-1
2
Sep-1
3
Sep-1
4
Sep-1
5
Mar-
16*
Cash Earnings Per Share (cents) LHS
Headline Earnings Per Share (cents) LHS
*Restated per pro-forma information 31 March 2016
0
1 000
2 000
3 000
4 000
5 000
6 000
7 000
8 000
9 000
Sep-0
8
Sep-0
9
Sep-1
0
Sep-1
1
Sep-1
2
Sep-1
3
Sep-1
4
Sep-1
5
**Sep-1
6
Capex Additions (Rm) Debt (Rm)
** CAPEX figure is a twelve month figure and has been aggregated and not annually adjusted

10MERRILL LYNCH SUN CITY CONFERENCE MARCH 2017
B. CAPITAL STRUCTURE MGMT. – DEBT PROFILE
-
500
1 000
1 500
2 000
2 500
2017 2018 2019 2020 2021 2022 2023 2024
Financial Years
RoA
RSA
Group Debt (Rm)
Maturity Profile (Rm)
Significant de-gearing post a successful rights issue coupled with inflows relating to the B-BBEE I transaction
Net debt reduced from R9 billion to R5,3 billion after the rights issue in September 2016
In December 2016, net debt reduced further to R4,4 billion following inflows from the B-BBEE I transaction
Included in net debt is ~R1 billion in cash, with ~45% of this relating to Zimbabwe and Rwanda
Maturity profile reflects R1,6 billion of SA debt maturing in September 2017 – much progress has been made in lengthening the maturity profile
The improved balance sheet will mitigate the adverse impact of the cyclical nature of the business
2000
3000
4000
5000
6000
7000
8000
9000
10000
Mar-16 June-16 Sep-16 Dec-16
Gross Debt Net debt

11MERRILL LYNCH SUN CITY CONFERENCE MARCH 2017
Country Project Cost Project Debt PTA Portion IFC Portion
Rwanda US$165 million ~US$88 million ~US$25 million
Zimbabwe US$82 million ~US$55 million** ~US$55 million**
DRC US$280 million ~US$168 million ~US$84 million ~US$84 million
Ethiopia* ~US$175 million ~US$86 million ~US$56 million
Total US$702 million ~US$397 million ~US$220 million ~US$84 million
Preferential Trade Area (PTA) Bank and International Financial Corporation (IFC) are development funding institutions (DFIs) with significant exposure and appetite for investments in the African continent
PPC has deliberately partnered with DFIs as they have a long term commitment to the development of the African continent through economic and infrastructure development
~70% of PPC’s debt relates to the rest of Africa projects; of which PTA Bank’s portion alone exceeds US$200 million (>R2,8 billion)
The IFC is a member of the World Bank Group; it is owned by 184 member countries and has six decades of experience in providing loans, equity and advisory services to private sector companies in emerging markets – its annual funding programme for its FY17 is US$17 billion
B. CAPITAL STRUCTURE MGMT. – FUNDING PARTNERS
*PPC does not consolidate debt relating to Ethiopia **US$5 million was paid in December 2016
12MERRILL LYNCH SUN CITY CONFERENCE MARCH 2017
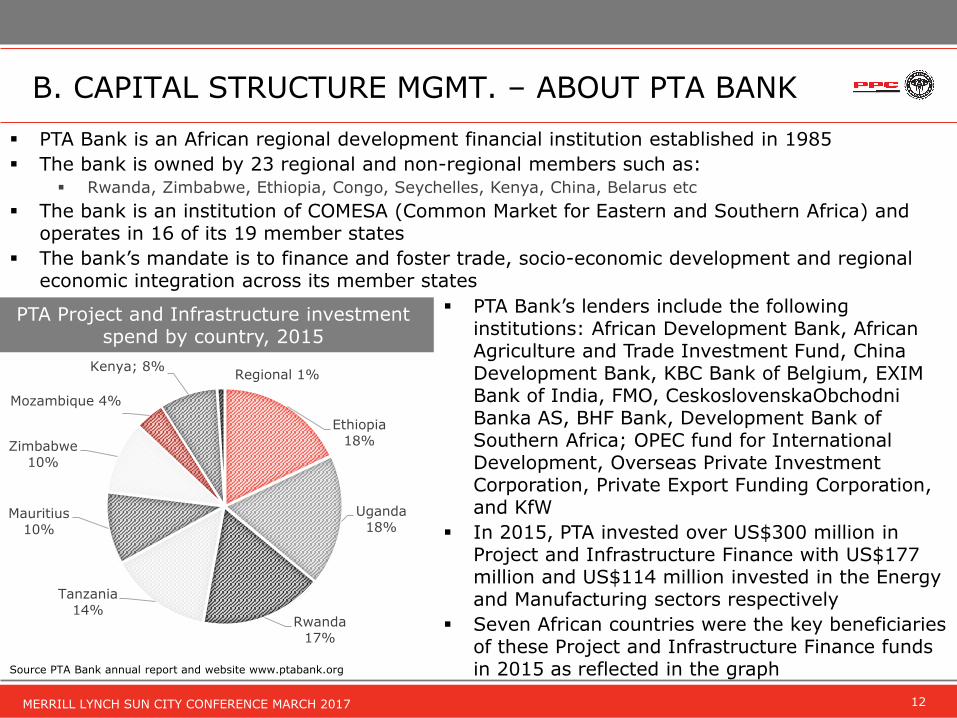
PTA Bank is an African regional development financial institution established in 1985
The bank is owned by 23 regional and non-regional members such as: Rwanda, Zimbabwe, Ethiopia, Congo, Seychelles, Kenya, China, Belarus etc
The bank is an institution of COMESA (Common Market for Eastern and Southern Africa) and operates in 16 of its 19 member states
The bank’s mandate is to finance and foster trade, socio-economic development and regional economic integration across its member states
Source PTA Bank annual report and website www.ptabank.org
B. CAPITAL STRUCTURE MGMT. – ABOUT PTA BANK
PTA Project and Infrastructure investment spend by country, 2015
Ethiopia 18%
Uganda18%
Rwanda17%
Tanzania14%
Mauritius 10%
Zimbabwe 10%
Mozambique 4%
Kenya; 8%Regional 1%
PTA Bank’s lenders include the following institutions: African Development Bank, African Agriculture and Trade Investment Fund, China Development Bank, KBC Bank of Belgium, EXIM Bank of India, FMO, CeskoslovenskaObchodniBanka AS, BHF Bank, Development Bank of Southern Africa; OPEC fund for International Development, Overseas Private Investment Corporation, Private Export Funding Corporation, and KfW
In 2015, PTA invested over US$300 million in Project and Infrastructure Finance with US$177 million and US$114 million invested in the Energy and Manufacturing sectors respectively
Seven African countries were the key beneficiaries of these Project and Infrastructure Finance funds in 2015 as reflected in the graph
13MERRILL LYNCH SUN CITY CONFERENCE MARCH 2017
C. SIGNIFICANTLY ENHANCING EFFICIENCY
Profit Improvement Programme
Aimed to achieve sustainable improvement of R400 million over three years
Target was exceeded in less than 18 months
Internal drive and measurement of PIP continues
Slurry kiln 9 cost savings and efficiencies to be realised
The R1,7 billion Slurry kiln 9 project includes the construction of a new 3000tpd production line using the latest energy efficient technology - a kiln system with six cyclone preheater stages and a precalciner
SK9’s guaranteed specific thermal energy consumption is 3.1 MJ/kg clinker which compares well with modern cement plants globally and is more than 25% and 50% more energy efficient than SK8 and SK7 respectively
Once SK9 is commissioned, PPC’s inland kilns will collectively perform at an average of 3.4 MJ/kg, which is equivalent to the performance of a new 5 stage preheater kiln system
The state-of-the-art system will also lead to reduced maintenance costs; SK9 offers an expected maintenance cost reduction from R22/ton to R12/ton clinker
Post commissioning of SK9, Slurry’s variable costs will decline by ~10% - 15%

14MERRILL LYNCH SUN CITY CONFERENCE MARCH 2017
C. SIGNIFICANTLY ENHANCING EFFICIENCY
SA Cement Costs of production (Real Rm based to 100) SA Cement Costs of production per ton (based to 100)
20
40
60
80
100
120
Sep-09 Sep-10 Sep-11 Sep-12 Sep-13 Sep-14 Sep-15 Sep-16
Variable cost of production (Rm)
Variable delivered cost of production (Rm)
20
40
60
80
100
120
Sep-09 Sep-10 Sep-11 Sep-12 Sep-13 Sep-14 Sep-15 Sep-16
Rand per ton VCOP Rand per ton VDCOP
20
40
60
80
100
120
Sep-09 Sep-10 Sep-11 Sep-12 Sep-13 Sep-14 Sep-15 Sep-16
Fixed costs of production (Rm) Rand per ton
SA Cement Fixed costs of production (Real Rm based to 100)
Volumes sold in the SA Cement business declined significantly post the global financial crisis and World Cup 2010, however since 2012, volumes have shown some improvement to 2016
Since the focus on our 3 mega plant strategy, variable and fixed costs have shown an improvement since 2013
The use of our most efficient plants, restructuring our operations and optimising our logistics have all contributed

15MERRILL LYNCH SUN CITY CONFERENCE MARCH 2017
C. SIGNIFICANTLY ENHANCING EFFICIENCY
SA Cement delivered cost of coal (based to 100)
Over this period the real delivered cost of coal has reduced markedly due to:
Procuring from various key coal suppliers and maintaining sustainable relationships with them
Operating the most efficient kilns which negates higher energy consumption costs
Lower volumes produced over the period
Since 2009, electricity costs have risen significantly but PPC has managed to achieve cost increases below the prevailing inflation rate due to effectively managing time of use and operating our most efficient units
Richards Bay Coal Price & Exchange Rate
6,00
8,00
10,00
12,00
14,00
16,00
18,00
20
40
60
80
100
120
140
2009-0
1-0
1
2009-0
6-0
1
2009-1
1-0
1
2010-0
4-0
1
2010-0
9-0
1
2011-0
2-0
1
2011-0
7-0
1
2011-1
2-0
1
2012-0
5-0
1
2012-1
0-0
1
2013-0
3-0
1
2013-0
8-0
1
2014-0
1-0
1
2014-0
6-0
1
2014-1
1-0
1
2015-0
4-0
1
2015-0
9-0
1
2016-0
2-0
1
2016-0
7-0
1
2016-1
2-0
1
Richard's Bay Coal Price ($/tonne) LHS USDZAR (RHS)
40
50
60
70
80
90
100
110
40
50
60
70
80
90
100
110
Sep-09 Sep-10 Sep-11 Sep-12 Sep-13 Sep-14 Sep-15 Sep-16
Delivered cost of coal (Rm) LHS Rand per ton (RHS)
SA Cement Electricity costs (based to 100)
50
100
150
200
250
Sep-09 Sep-10 Sep-11 Sep-12 Sep-13 Sep-14 Sep-15 Sep-16
Total power Real Rm (consumed & maximum demand)
Rand per ton
Eskom Megaflex price increase (Real)
16MERRILL LYNCH SUN CITY CONFERENCE MARCH 2017
C. SIGNIFICANTLY ENHANCING EFFICIENCY
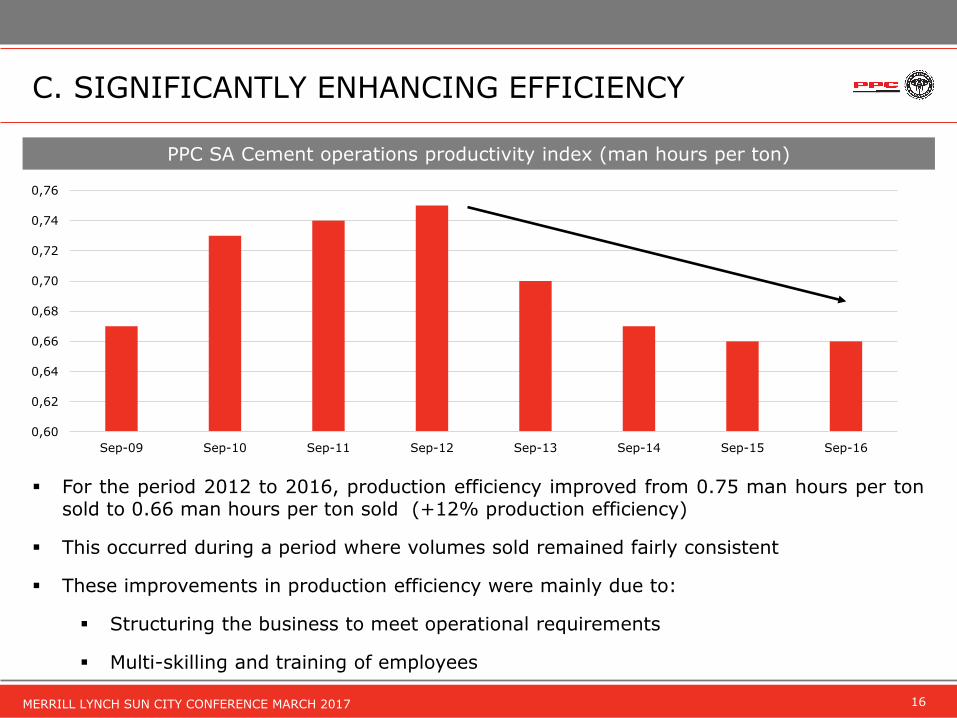
PPC SA Cement operations productivity index (man hours per ton)
For the period 2012 to 2016, production efficiency improved from 0.75 man hours per tonsold to 0.66 man hours per ton sold (+12% production efficiency)
This occurred during a period where volumes sold remained fairly consistent
These improvements in production efficiency were mainly due to:
Structuring the business to meet operational requirements
Multi-skilling and training of employees
0,60
0,62
0,64
0,66
0,68
0,70
0,72
0,74
0,76
Sep-09 Sep-10 Sep-11 Sep-12 Sep-13 Sep-14 Sep-15 Sep-16
OPERATIONAL UPDATE

18MERRILL LYNCH SUN CITY CONFERENCE MARCH 2017
SOUTH AFRICAN OPERATING ENVIROMENT
Real % growth 2014-2016
Average2017F 2018F 2019F
Household consumption
1.1 1.3 2.0 2.3
Gross domestic expenditure
0.6 1.3 1.8 2.2
Gross fixed capital formation
0.1 1.5 1.6 2.8
Real GDP growth 1.1 1.3 2.0 2.2
Consumer Price Index 5.7 6.4 5.7 5.6
Producer Price Index 6.0 5.0 4.8 5.3
Source National Treasury 2017 Budget Speech and Bureau of Economic Research
Real GDP growth has disappointed, averaging only 1% over the past three years; with a slight improvement to 2% forecast only in 2018
Over the past three years, growth in Gross Fixed Capital Formation (GFCF) has been very weak, averaging about 0% - this is forecast to see some improvement in the medium term
Consumer confidence has also been muted mainly due to consumers being downbeat on the economic outlook and their personal finances
Over the past few years, public sectorexpenditure on infrastructure in theprovinces has consistently exceededthe allocated budget, while this hasbeen the opposite in local governmentand with state owned companies
86% of public sector infrastructurespend is executed by provincialgovernment, local government andstate owned enterprises
Public Sector Infrastructure Expenditure Budgeted vs. Spend (Rm)
20
40
60
80
100
120
140
Provincial governments Local government State Owned Companies
2013F 2013A 2014F 2014A 2015F 2015A 2016F 2016A

19MERRILL LYNCH SUN CITY CONFERENCE MARCH 2017
CARBON TAX UPDATE
The 2017 budget speech confirmed there will be a revised carbon tax bill which will bepublished for public consultation and tabled to parliament in mid-2017
CO2 emission in the cement industry is as a result of the thermal and chemical processesrequired in the manufacturing of cement
According to the proposed draft bill dated November 2015, the carbon tax for PPC Group isexpected to be ~R90 million
Currently the tax structure proposes R120 per ton of CO2e emitted for the first phase
Carbon tax will be treated as an environmental levy as contemplated in section 54A of theCustoms and Excise Act
There are allowances that PPC qualifies for in the first phase (up to 2020) whichsubstantially reduces the effective tax rate to less than 30% of the proposed value
PPC is currently looking at a number of initiatives to reduce the carbon tax burden, includingthe replacement of coal with other carbon neutral energy sources and improving theopportunity to increase cement extension
The carbon tax regime does not apply to imports into South Africa and these have not beenmeaningfully implemented elsewhere; they were scrapped in Australia due to the impact onindustry
PPC is ready for the implementation of the carbon tax regime in January 2018 however, we willcontinue to engage government on this matter
20MERRILL LYNCH SUN CITY CONFERENCE MARCH 2017
TRADING ENVIRONMENT – SA IMPORT ACTIVITY
-
50 000
100 000
150 000
200 000
250 000
300 000
350 000
400 000
450 000
Q1-12 Q2-12 Q3-12 Q4-12 Q1-13 Q2-13 Q3-13 Q4-13 Q1-14 Q2-14 Q3-14 Q4-14 Q1-15 Q2-15 Q3-15 Q4-15 Q1-16 Q2-16 Q3-16 Q4-16
Durban PE & EL Cape Town
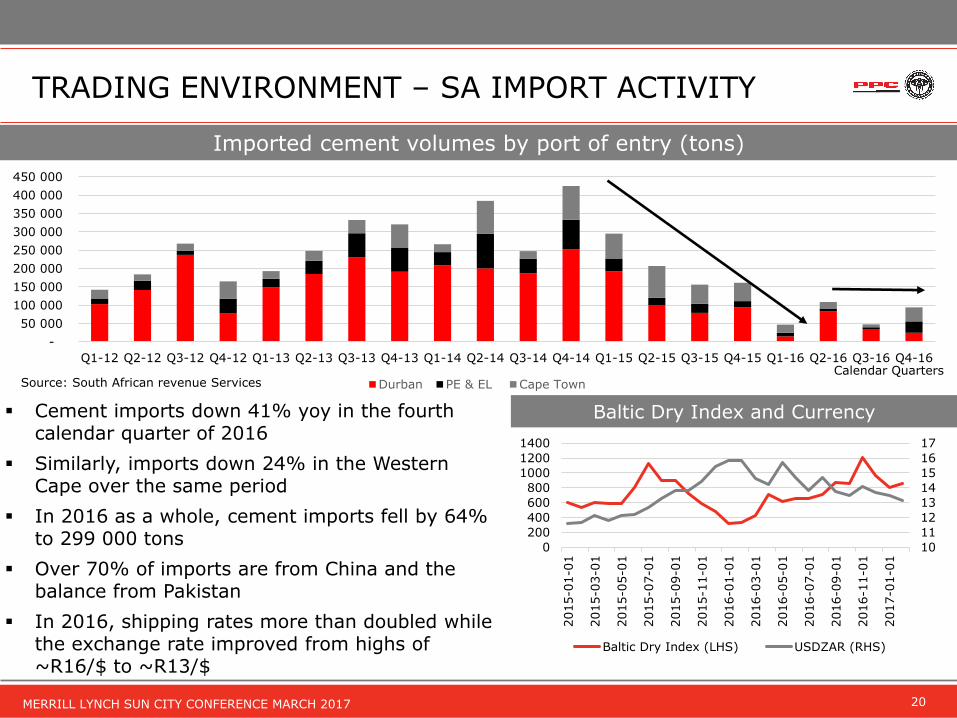
Imported cement volumes by port of entry (tons)
Cement imports down 41% yoy in the fourth calendar quarter of 2016
Similarly, imports down 24% in the Western Cape over the same period
In 2016 as a whole, cement imports fell by 64% to 299 000 tons
Over 70% of imports are from China and the balance from Pakistan
In 2016, shipping rates more than doubled while the exchange rate improved from highs of ~R16/$ to ~R13/$
Calendar Quarters Source: South African revenue Services
Baltic Dry Index and Currency
10
11
12
13
14
15
16
17
0
200
400
600
800
1000
1200
1400
2015-0
1-0
1
2015-0
3-0
1
2015-0
5-0
1
2015-0
7-0
1
2015-0
9-0
1
2015-1
1-0
1
2016-0
1-0
1
2016-0
3-0
1
2016-0
5-0
1
2016-0
7-0
1
2016-0
9-0
1
2016-1
1-0
1
2017-0
1-0
1
Baltic Dry Index (LHS) USDZAR (RHS)

21MERRILL LYNCH SUN CITY CONFERENCE MARCH 2017
OPERATING UPDATE
As at December 2016, group cement sales volumes were up 4% when compared to the previous nine month period ending December 2015
Selling price increases were implemented in Gauteng and the inland regions in October 2016 – however this led to high single digit declines in cement sales volumes for the quarter ended December 2016
For the nine month period to December 2016, PPC’s overall cement volumes in South Africa increased by 4% and the average selling prices decreased by 4%
PPC has implemented further price increases in selected regions effective 1 February 2017 and the impact of this will begin to reflect on the average selling price in the next few months
22MERRILL LYNCH SUN CITY CONFERENCE MARCH 2017
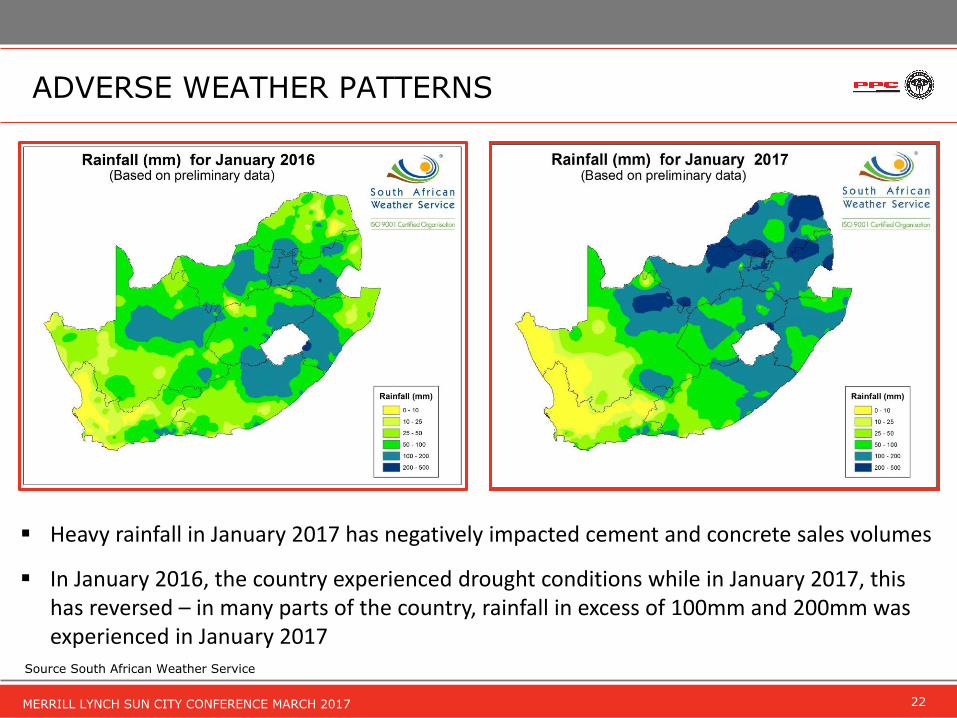
ADVERSE WEATHER PATTERNS
Source South African Weather Service
Heavy rainfall in January 2017 has negatively impacted cement and concrete sales volumes
In January 2016, the country experienced drought conditions while in January 2017, this has reversed – in many parts of the country, rainfall in excess of 100mm and 200mm was experienced in January 2017

23MERRILL LYNCH SUN CITY CONFERENCE MARCH 2017
Source South African Weather Service
ADVERSE WEATHER PATTERNS
Heavy rainfall in February 2017 has negatively impacted cement and concrete sales volumes
In February 2016, the country experienced drought conditions while in February 2017, this has reversed – in many parts of the country, rainfall in excess of 100mm and 200mm was experienced in February 2017

24MERRILL LYNCH SUN CITY CONFERENCE MARCH 2017
REST OF AFRICA & MATERIALS DIVISION
Zimbabwe
The rest of Africa operations collectively recorded cement sales volume increases of 9% for the nine month period to December 2016
Performance in the lime division continues to be negatively impacted by the local steel and alloys industries
Volumes in the aggregates and readymix division continued to show growth on the back of the recent acquisition of 3Q Mahuma Concrete
With the commissioning of the Harare mill, the cement sales volume performance has shown an improvement when compared to previous quarter ending December 2016
There are however liquidity challenges in Zimbabwe which makes it difficult to import key inputs and management is exploring various solutions to overcome these challenges
Botswana
Rwanda
The steady ramp-up in Rwanda continues with 81 000 tonnes of cement sales recorded in the quarter ending December 2016 and 230 000 tonnes of cement sales recorded for the nine month period to December 2016
Since March 2016, debt is being repaid monthly (over a 10 year period)
~60% of debt is USD denominated however progress is being made to convert this to local currency
Cement sales volumes in Botswana showed a 12% growth for the quarter ending December 2016 on the back of increased sales promotions
25MERRILL LYNCH SUN CITY CONFERENCE MARCH 2017
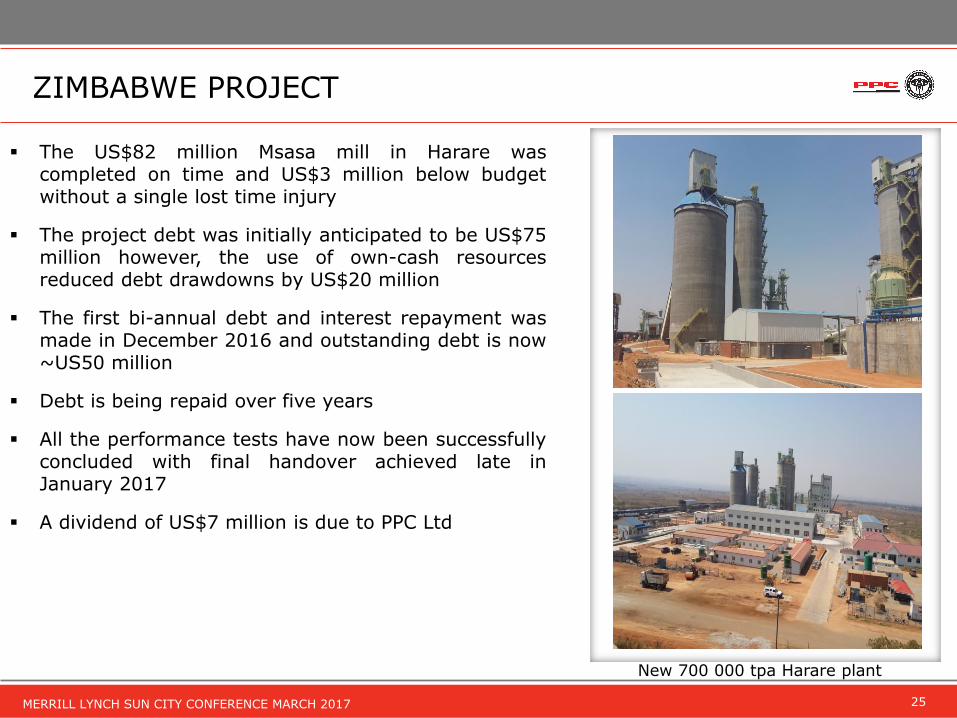
ZIMBABWE PROJECT
The US$82 million Msasa mill in Harare wascompleted on time and US$3 million below budgetwithout a single lost time injury
The project debt was initially anticipated to be US$75million however, the use of own-cash resourcesreduced debt drawdowns by US$20 million
The first bi-annual debt and interest repayment wasmade in December 2016 and outstanding debt is now~US50 million
Debt is being repaid over five years
All the performance tests have now been successfullyconcluded with final handover achieved late inJanuary 2017
A dividend of US$7 million is due to PPC Ltd
New 700 000 tpa Harare plant

26MERRILL LYNCH SUN CITY CONFERENCE MARCH 2017
ETHIOPIA PROJECT
As at January 2017, project construction was at an advanced stage
Electrical installation work from the limestone crusher to the cement proportioning station, including the general substation had been completed
Once the national utility company has concluded the requisite tests and energising of the substation, the kiln will be fired and hot commissioning will commence
Saleable cement production is expected in the second calendar quarter of 2017
New 1.4 mtpa Habesha plant
27MERRILL LYNCH SUN CITY CONFERENCE MARCH 2017
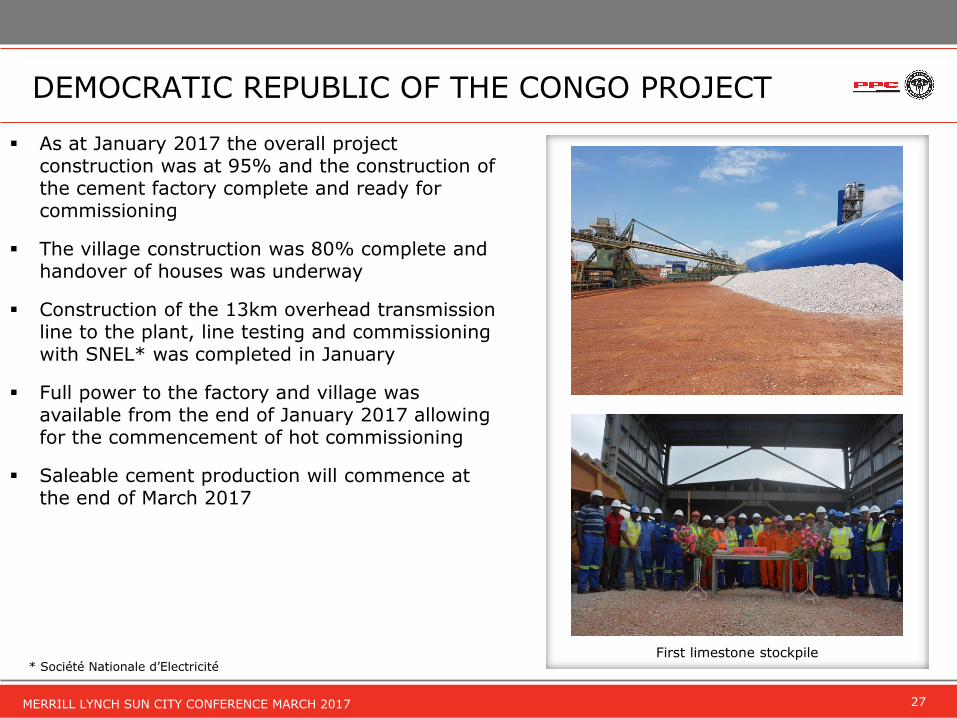
DEMOCRATIC REPUBLIC OF THE CONGO PROJECT
As at January 2017 the overall project construction was at 95% and the construction of the cement factory complete and ready for commissioning
The village construction was 80% complete and handover of houses was underway
Construction of the 13km overhead transmission line to the plant, line testing and commissioning with SNEL* was completed in January
Full power to the factory and village was available from the end of January 2017 allowing for the commencement of hot commissioning
Saleable cement production will commence at the end of March 2017
First limestone stockpile * Société Nationale d’Electricité

28MERRILL LYNCH SUN CITY CONFERENCE MARCH 2017
Project financed on a limited recourse basis to PPC Ltd
Therefore, any funding shortfalls incurred prior to Project Financial Completion will be for the account of PPC Ltd (as First Sponsor)
Project Financial Completion occurs when certain working capital and debt ratios have been met for four consecutive quarters (then project becomes fully ring-fenced)
Maintaining the debt and interest repayment schedule is key, however the full debt accelerates and becomes due only if the project is expropriated or nationalised before Project Financial Completion
Repayment of funding obligations commences July 2017 however negotiations are underway with funders to lengthen the repayment period
Other strategic options to reduce PPC risk exposure to the DRC are also being explored
Project Costs
US$280 million project likely
to rise by 4%-6%
Start up Funding
Likely to be between US$20
million and US$30 million –
relates to VAT repayment &
settling of bank facilities for
trading losses
Ops Cash Flows
Project likely to generate
positive free cash flows before
funding repayments
DEMOCRATIC REPUBLIC OF THE CONGO
29MERRILL LYNCH SUN CITY CONFERENCE MARCH 2017
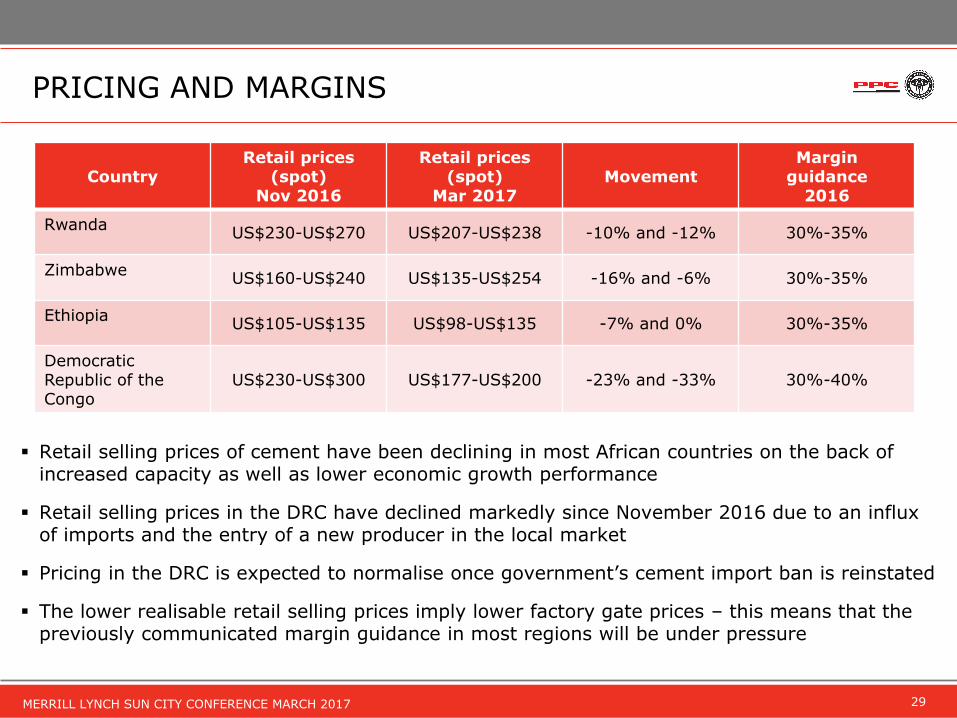
PRICING AND MARGINS
CountryRetail prices
(spot) Nov 2016
Retail prices (spot)
Mar 2017 Movement
Marginguidance
2016
Rwanda US$230-US$270 US$207-US$238 -10% and -12% 30%-35%
ZimbabweUS$160-US$240 US$135-US$254 -16% and -6% 30%-35%
Ethiopia US$105-US$135 US$98-US$135 -7% and 0% 30%-35%
DemocraticRepublic of the Congo
US$230-US$300 US$177-US$200 -23% and -33% 30%-40%
Retail selling prices of cement have been declining in most African countries on the back of increased capacity as well as lower economic growth performance
Retail selling prices in the DRC have declined markedly since November 2016 due to an influx of imports and the entry of a new producer in the local market
Pricing in the DRC is expected to normalise once government’s cement import ban is reinstated
The lower realisable retail selling prices imply lower factory gate prices – this means that the previously communicated margin guidance in most regions will be under pressure

30MERRILL LYNCH SUN CITY CONFERENCE MARCH 2017
SLURRY SK9 PROJECT
The Slurry SK9 project is progressing as well and with overall progress at 54% in January 2017
Commissioning remains scheduled for the first half of 2018
The R1.7 billion Slurry kiln 9 project includes:
construction of a new 3000tpd production line (SK9) using the latest energy efficient technology
replacement of SK8’s electrostatic precipitator (ESP) with a bag filter in order to ensure compliance with environmental legislation in 2020
New 1 mtpa Slurry kiln line
GOING FORWARD
32MERRILL LYNCH SUN CITY CONFERENCE MARCH 2017
Key focus areas going forward
The company remains focused on delivering its expansion projects timeously and cost effectively
As the international projects are at advanced stages, the focus has largely shifted to operational performance and achieving maximum ramp-up without disrupting the market
Management also continues to give special attention to the cash generating units; specifically managing costs within management’s control while maximising efficiencies
Work is also underway to further optimise the company´s capital structure while also exploring ways to de-risk the project in the DRC
Details relating to the proposed new B-BBEE III transaction will be communicated to shareholders during the first half of the 2017 calendar year
MANAGEMENT FOCUS
33MERRILL LYNCH SUN CITY CONFERENCE MARCH 2017
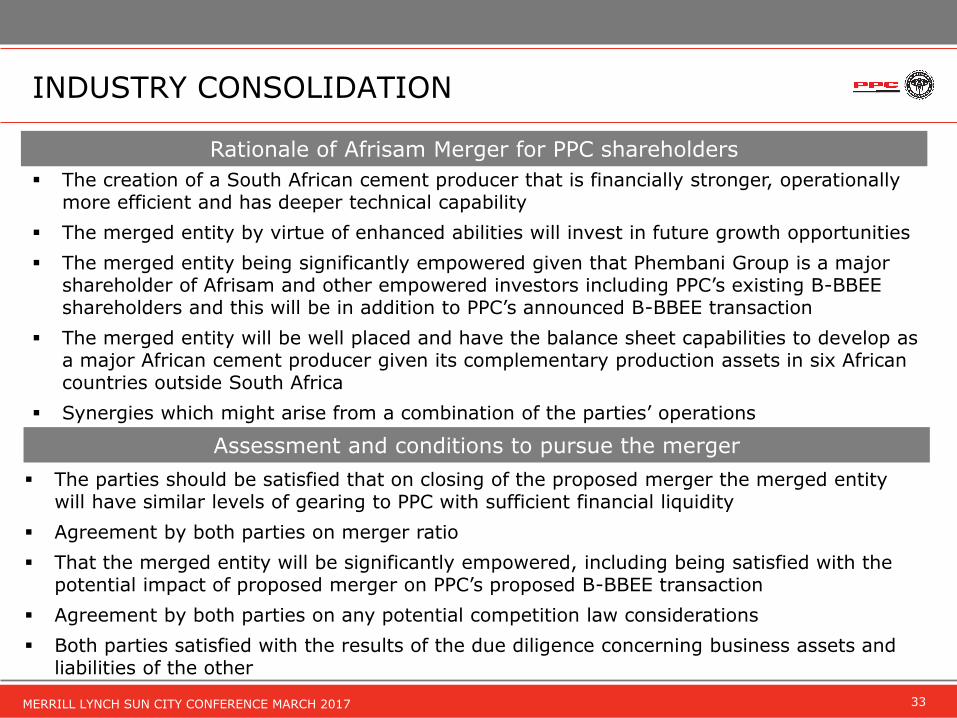
INDUSTRY CONSOLIDATION
Rationale of Afrisam Merger for PPC shareholders
The creation of a South African cement producer that is financially stronger, operationally more efficient and has deeper technical capability
The merged entity by virtue of enhanced abilities will invest in future growth opportunities
The merged entity being significantly empowered given that Phembani Group is a major shareholder of Afrisam and other empowered investors including PPC’s existing B-BBEE shareholders and this will be in addition to PPC’s announced B-BBEE transaction
The merged entity will be well placed and have the balance sheet capabilities to develop as a major African cement producer given its complementary production assets in six African countries outside South Africa
Synergies which might arise from a combination of the parties’ operations
Assessment and conditions to pursue the merger
The parties should be satisfied that on closing of the proposed merger the merged entity will have similar levels of gearing to PPC with sufficient financial liquidity
Agreement by both parties on merger ratio
That the merged entity will be significantly empowered, including being satisfied with the potential impact of proposed merger on PPC’s proposed B-BBEE transaction
Agreement by both parties on any potential competition law considerations
Both parties satisfied with the results of the due diligence concerning business assets and liabilities of the other

APPENDIX

35MERRILL LYNCH SUN CITY CONFERENCE MARCH 2017
PRO-FORMA CONSOLIDATED STATEMENT OF COMPREHENSIVE INCOME: 12 MONTHS ENDED 31 MARCH 2016
Revenue 9 187
Cost of sales 6 492
Gross profit 2 695
Administration and other operating expenditure 1 065
Operating profit before item listed below: 1 630
Empowerment transactions IFRS 2 charges 36
Operating profit 1 594
Fair value adjustments on financial instruments 5 3
Finance costs 5 572
Investment income 29
1 054
Loss from equity accounted investments (13)
Impairments (42)
Other exceptional adjustments and profit on disposal of non-core assets 116
Profit before taxation 1 115
Taxation 384
Profit for the period 731
Attributable to:
Shareholders of PPC Ltd 793
Non-controlling interests (62)
Other comprehensive income, net of taxation
Items that will be reclassified to profit or loss 6 952
Cash flow hedges 48
Taxation on cash flow hedges (14)
Reclassification of profit on sale of available-for-sale financial asset to profit and loss (82)
Taxation impact on reclassification of profit on sale of available-for-sale financial asset to profit and loss 15
Revaluation of available-for-sale financial asset (7)
Taxation impact on the revaluation of available-for-sale financial asset 3
Translation of foreign operations 7 743
Total comprehensive income 1 437
Attributable to:
Shareholders of PPC Ltd 1 377
Non-controlling interests 60
Earnings per share (cents) 8
Basic 151
Diluted 149
Profit before equity accounted earnings and exceptional items
36MERRILL LYNCH SUN CITY CONFERENCE MARCH 2017
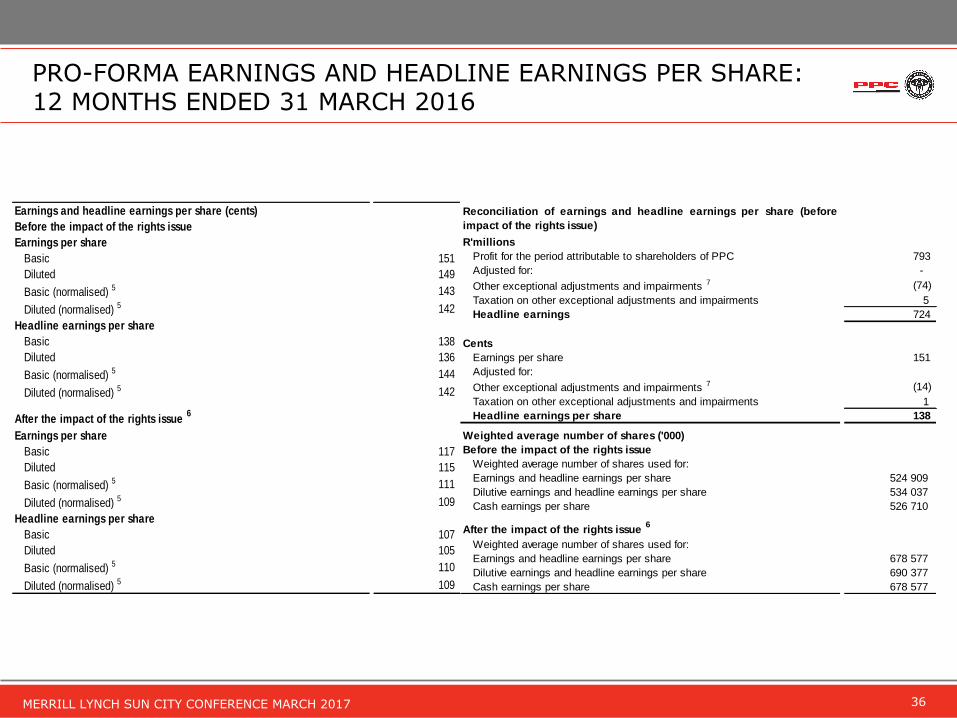
PRO-FORMA EARNINGS AND HEADLINE EARNINGS PER SHARE: 12 MONTHS ENDED 31 MARCH 2016
Earnings and headline earnings per share (cents)
Before the impact of the rights issue
Earnings per share
Basic 151
Diluted 149
Basic (normalised) 5 143
Diluted (normalised) 5 142
Headline earnings per share
Basic 138
Diluted 136
Basic (normalised) 5 144
Diluted (normalised) 5 142
After the impact of the rights issue 6
Earnings per share
Basic 117
Diluted 115
Basic (normalised) 5 111
Diluted (normalised) 5 109
Headline earnings per share
Basic 107
Diluted 105
Basic (normalised) 5 110
Diluted (normalised) 5 109
R'millions
Profit for the period attributable to shareholders of PPC 793
Adjusted for: -
Other exceptional adjustments and impairments 7 (74)
Taxation on other exceptional adjustments and impairments 5
Headline earnings 724
Cents
Earnings per share 151
Adjusted for:
Other exceptional adjustments and impairments 7 (14)
Taxation on other exceptional adjustments and impairments 1
Headline earnings per share 138
Weighted average number of shares ('000)
Before the impact of the rights issue
Weighted average number of shares used for:
Earnings and headline earnings per share 524 909
Dilutive earnings and headline earnings per share 534 037
Cash earnings per share 526 710
After the impact of the rights issue 6
Weighted average number of shares used for:
Earnings and headline earnings per share 678 577
Dilutive earnings and headline earnings per share 690 377
Cash earnings per share 678 577
Reconciliation of earnings and headline earnings per share (before
impact of the rights issue)
37MERRILL LYNCH SUN CITY CONFERENCE MARCH 2017
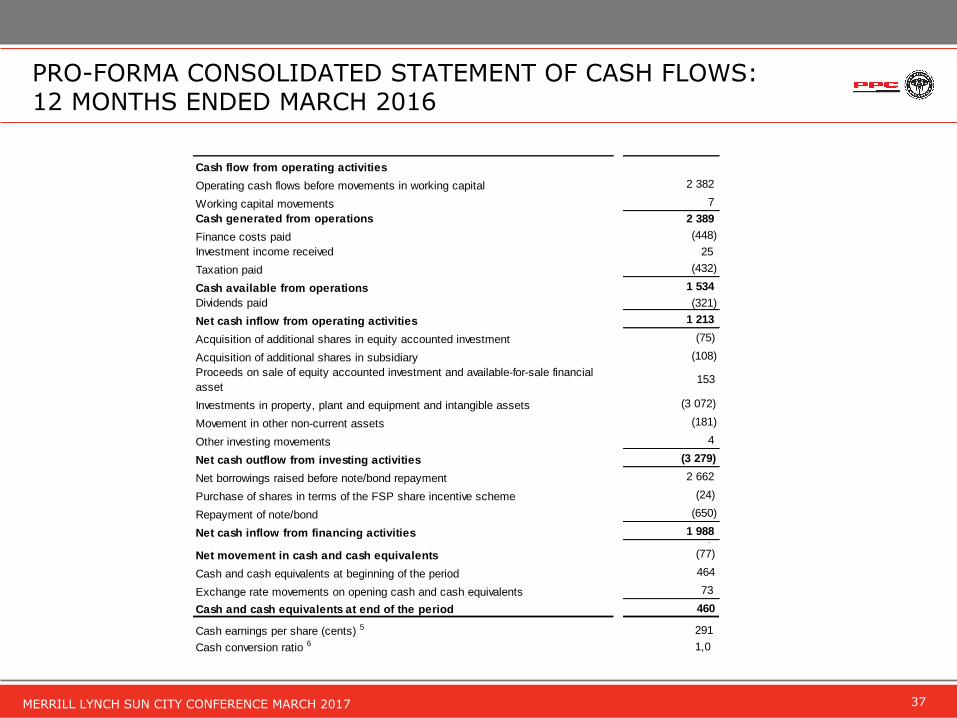
PRO-FORMA CONSOLIDATED STATEMENT OF CASH FLOWS: 12 MONTHS ENDED MARCH 2016
Cash flow from operating activities
Operating cash flows before movements in working capital 2 382
Working capital movements 7
Cash generated from operations 2 389
Finance costs paid (448)
Investment income received 25
Taxation paid (432)
Cash available from operations 1 534
Dividends paid (321)
Net cash inflow from operating activities 1 213
Acquisition of additional shares in equity accounted investment (75)
Acquisition of additional shares in subsidiary (108)
Proceeds on sale of equity accounted investment and available-for-sale financial
asset 153
Investments in property, plant and equipment and intangible assets (3 072)
Movement in other non-current assets (181)
Other investing movements 4
Net cash outflow from investing activities (3 279)
Net borrowings raised before note/bond repayment 2 662
Purchase of shares in terms of the FSP share incentive scheme (24)
Repayment of note/bond (650)
Net cash inflow from financing activities 1 988 -
Net movement in cash and cash equivalents (77)
Cash and cash equivalents at beginning of the period 464
Exchange rate movements on opening cash and cash equivalents 73
Cash and cash equivalents at end of the period 460
Cash earnings per share (cents) 5 291
Cash conversion ratio 6 1,0

38MERRILL LYNCH SUN CITY CONFERENCE MARCH 2017
PPC’S FOOTPRINT IN SOUTHERN AFRICA
39MERRILL LYNCH SUN CITY CONFERENCE MARCH 2017
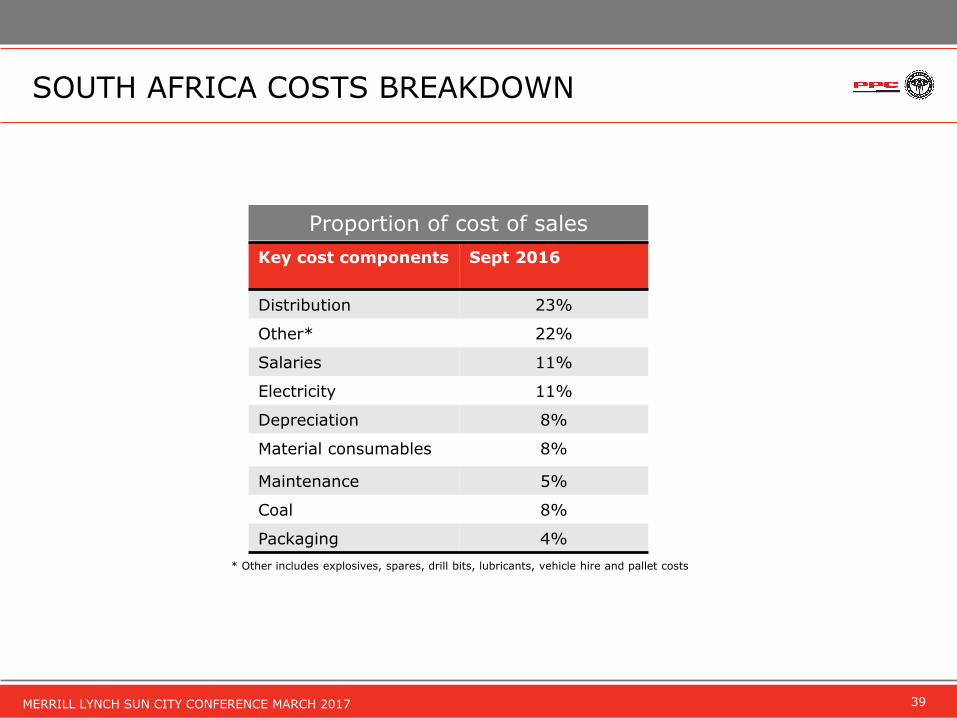
Key cost components Sept 2016
Distribution 23%
Other* 22%
Salaries 11%
Electricity 11%
Depreciation 8%
Material consumables 8%
Maintenance 5%
Coal 8%
Packaging 4%
Proportion of cost of sales
* Other includes explosives, spares, drill bits, lubricants, vehicle hire and pallet costs
SOUTH AFRICA COSTS BREAKDOWN
40MERRILL LYNCH SUN CITY CONFERENCE MARCH 2017
This document including, without limitation, those statements concerning the demandoutlook, PPC’s expansion projects and its capital resources and expenditure, contain certainforward-looking statements and views. By their nature, forward-looking statements involverisk and uncertainty and although PPC believes that the expectations reflected in suchforward-looking statements are reasonable, no assurance can be given that such expectationswill prove to be correct. Accordingly, results could differ materially from those set out in theforward-looking statements as a result of, among other factors, changes in economic andmarket conditions, success of business and operating initiatives, changes in the regulatoryenvironment, other government action and business and operational risk management.
Whilst PPC takes reasonable care to ensure the accuracy of the information presented, PPCaccepts no responsibility for any damages, be they consequential, indirect, special orincidental, whether foreseeable or unforeseeable, based on claims arising out ofmisrepresentation or negligence arising in connection with a forward-looking statement. Thisdocument is not intended to contain any profit forecasts or profit estimates, and theinformation published in this document is unaudited.
DISCLAIMER
41MERRILL LYNCH SUN CITY CONFERENCE MARCH 2017
INVESTOR CONTACTS
Azola Lowan Investor Relations
Vuyo Nombila Investor Relations
Tel. +27 11 386 9000www.ppc.co.za