Embed Size (px)
Citation preview

Mergers and Acquisitions in the Luxury Goods
Industry: Gains for the Acquiring Shareholders
MSc Economics & Business
Financial Economics
MASTER THESIS
Author: Fleur B.W. De Buvry De Mauregnault
Student number: 410321
Thesis supervisor: Dr. J.J.G. Lemmen
Second reader: Dr. C.S. Pfeil
Date: 01-05-2020

2
Preface and Acknowledgements
This thesis is the result of an investigation into mergers and acquisitions in the luxury goods
industry: gains for the acquiring shareholders.
I have chosen this subject because I would like to work in Corporate Finance in mergers and
acquisitions after graduating in Business Economics and because fashion is my passion. I
would like to thank my supervisor Mr. Lemmen for the wonderful way in which he has
supported me. I greatly appreciated the fast feedback on my submitted work which kept me up
to pace. This was all the more beneficial to me because I was doing an internship at the same
time as writing my thesis and also had to prepare for my very last exam.
This thesis completes my Master Financial Economics at the Erasmus University Rotterdam
and also my student days. A new phase arrives, a phase of a new intellectual challenge and
change also on a personal level. Now I really want to stand on my own two feet, with the life
experience as a student, a solid basis from home and especially the mental support of my
parents, I am really looking forward to this new step in my life and I am fully committed to it!
Thanks everyone who helped and supported me for who I am and where I am now.
‘I am a fashion person and fashion is not all about clothes, it’s about all kinds of change.’
-Karl Lagerfeld-

3
Abstract
Three giants of the French and Swiss luxury industry are now taken as a reference to assess the
impact that M&A operations can have in this area. This is one of the few pieces of research of
the literature that investigates mergers and acquisitions (M&As) in the luxury goods industry.
In particular, a 19-year timeframe has been analysed, starting in 2000. The research has utilized
analytical tools such as event study and linear regression. With a total sample of 126 deals, the
empirical results reveal that luxury goods industry acquisitions do not create any value for the
acquiring shareholders with the performance of M&As around the announcement date. However,
it is statistically proven that the creative director (who has become more important for companies
especially since 2013) contributes to the firm growth and gives only a significantly positive
value for the acquiring shareholders within 3 days after the merger and acquisition but not over
11 days.
Keywords: Luxury goods industry, mergers and acquisitions, creative director, announcement
date
JEL Classification: G34, M21, M31, E21, G14

4
Table of contents
Preface and Acknowledgements 2
Abstract 3
1 Introduction 7
2 Literature Review 12
2.1 Mergers and acquisitions 12
2.2 Luxury goods 13
2.3 Mergers and acquisitions in the luxury industry 14
2.4 The creative director 15
3 Data and Methodology 18
3.1 Data selection 18
3.2 Methodology 20
3.2.1 Time and actor perspectives 20
3.2.2 Benchmark model 20
3.3 Estimation window and computation of expected returns 20
3.3.1 Estimation window 21
3.3.2 Computation of expected returns 21
3.4 Event window and computation of abnormal returns 22
3.4.1 Choice of the event window 22
3.4.2 Computation of abnormal returns 22
3.4.3 Computation of cumulative abnormal returns 22
3.5 Cumulative average abnormal returns 23
3.5.1 Computation of average abnormal returns 23
3.5.2 Computation of the cumulative average abnormal return 23
3.6 Parametric and nonparametric t-test 24
3.7 Lineair regression 24
3.7.1 Dependent variables 25
3.7.2 Independent variables 25

5
3.7.3 Control variable 26
4 Results 30
4.1 Descriptive statistics 30
4.2 Correlation 32
4.3 Regression 33
4.4 Robustness test 37
5 Conclusion and Limitations 43
References 46
Appendix A: AAR significance test 54
Appendix B: CAAR significance test 56
Appendix C: Normal Distribution 57

6
List of Tables
Table 1 – Three luxury conglomerates 7
Table 2 – Deals per year per conglomerate 19
Table 3 – Variable Description 28
Table 4 – Descriptive Statistics of Independent and Control Variables 32
Table 5 – Pearson Correlation Matrix 33
Table 6 – Regression Result of M&A Performance over the period
2000 – 2019; CAR (-5, +5) and Ln(Sales) 36
Table 7 – Robustness Test 1 40
Table 8 – Robustness Test 2 42
List of Figures
Figure 1 – CAAR 55

7
1 Introduction
The luxury products industry has experienced a remarkable change in standard models during
the three last decades. In fact, in the mid-1980s the conceptual term luxury industry was adopted
by different companies and was closely related to two main factors: the self-conception of the
business and its costumers’ perception. Status, emotional advantage, exclusiveness and prestige
were crucial for high-quality products sellers. Furthermore, in the first half of the 80s a number
of luxury companies was formed and relocated. In the early 90s a harder competitive scenario
arose in the industry segment. Consequently, market actors began progressively to consolidate
their activities until 2000 when they reached the peak of business deals (Berry, 1994). In this
context, transaction activity became fundamental and was ruled by four (hence especially two:
LVMH and Kering) huge luxury conglomerates in Europe. Therefore, it is possible to speak of
merger mania. Companies that rose up out of this phenomenon were characterized by a high
products variety and a fortified market position. Big French luxury groups like LVMH and
Kering are taking over all kinds of luxury brands. This thesis focuses on the three biggest
conglomerates, which are presented below in Table 1 (Deloitte, 2019). Deloitte is a reputable
accountancy firm; it operates in more than 150 countries and has around 244,000 employees. It
publishes an annual report called ‘Global Power of Luxury Goods’. The report examines and
lists the 100 largest luxury goods companies globally.
Table 1: Three luxury conglomerates
*sales of the luxury goods
**sales growth rates are sales-weighted, currency-adjusted composites
***net profit margin, return on assets and asset turnover ratio are sales-weighted composites
According to Deloitte (2019), the luxury goods industry revealed their strength through M&As
during the last years, thanks to three main factors: the globalization of luxury, the value chain
integration, and company consolidation.
Name of company Country of
origin
Sales* (millions)
Total
revenue
Sales
growth** (millions)
Net profit
margin***
Return on
assets***
LVMH Moët Hennessy- Louis
Vuitton SE
France $27,995 $48,057 17.2% 13.2% 8.2%
Compagnie Financière
Richemont SA
Switzerland $12,819 $12,819 15.7% 8.1% 8.8%
Kering SA France $12,168 $17,446 27.5% 12.1% 7.3%

8
Over the past few years, private equity companies have proved to be an advantageous support
for the luxury goods sector. Currently, they are able to offer capital and skills to aid luxury
goods societies to grow internationally. Just note their influence in world luxury trade. For
example, recently an increasing number of wealthy and middle-class consumers in emerging
markets have shown interest in Western luxury brands. Therefore, various companies of luxury
goods have decided to increase their presence in Asia and the Middle East. Due to the great
success of luxury brands, private equity actors have decided to invest in the acquisition of
Western luxury goods companies, with two main objectives: to increase these brands profiles
in emerging markets and to facilitate their growth. At the same time, European private equity
companies are investing their funds in emerging Asian brands, particularly Chinese and Indian
ones. Their goal is to help these local brands become global luxury brands.
The value chain is crucial for luxury companies. It involves controlling every aspect of
their activities, from the design to the supply of raw materials, from production to marketing
and distribution. The optimal management of the value chain guarantees high levels of quality
and service, as an excellent protection for the luxury brand heritage. Therefore, luxury goods
companies have focused their attention on the vertical integration of the value chain,
fundamental in the M&As activities.
Firstly, luxury companies must ensure proper control of the main raw materials. This
requires access to the major suppliers and their technical expertise. Examples are luxury
handbags and footwear brands that have acquired majority shareholdings in tanning and leather
processing companies. Still, the ‘mine to market’ concept is evident in recent mergers between
mining companies and luxury jewellery manufacturers.
Secondly, control in the point of sale is fundamental (Rosenstein & Wyatt, 1997). Just
think of the joint ventures between emerging brands in the luxury sector and local distributors.
These partnerships aim to ensure the brand a certain level of control over retail transactions.
Finally, the efforts of luxury brands to mint themselves in electronic retail are also
noteworthy, increasing the deal business between luxury brands and online retail specialists.
Consolidation, for example the merger and acquisition of many smaller companies into a few
much larger ones, is for luxury goods firms the key to success and the secret to survive in a
cruel competitive market, in which experience, resources and knowledge are fundamental.
Large luxury assemblies have, above all, the advantages of providing additional capital and
sharing assets such as production facilities, operating systems and real estate. This means that
small luxury brands can grow and become global luxury brands; whilst large luxury

9
conglomerates can increase their empires by incorporating new successful brands. In this way,
M&As activities have increased as never before in the company consolidation phenomenon.
Continuous growth can be very complicated. Luxury firms should remain perceived as
exclusive, rare and prestigious. A possibly easier and less risky strategy could be the purchase
of additional market shares or the acquisition of competitors with high growth potential (Forbes,
2017). And the consolidation strategy (Locarno, 2016) of the luxury industry is vital.
Consequently, M&A motivated by this approach can be very beneficial to the acquirers. In fact,
this can increase their market power in many ways and secure their supply in rare raw materials
or the shopping experience delivered to end consumers (both important in the luxury industry).
This is the main objective of this thesis: to examine the impact on the value initiated by M&A
announcements in the luxury goods industry.
The three main key characteristics of the luxury industries are illustrated below. First,
luxury companies are extremely active in terms of M&A. Their consolidation phase began in
the ‘90s with the emergence of larger groups as LVMH (Cavender & Kincade, 2012) and
Kering. Even if this process had some periods of stalemate, it is still ongoing and companies as
LVMH, Kering and Richemont are relevant pieces of evidence. As an example, Coach acquired
Kate Spade for $2.4 billion in 2017. According to its CEO, Victor Luis, further strategic M&A
will be adopted shortly (Chaffin & Gray 2019). Moreover, the Luxury Marketing Council’s
leader, Greg Furman, talked about the ‘LVMH-izing American luxury’ (Chaffin & Gray, 2019).
Second, the luxury industry is unique. A controversial logic dominates its line of action. Dubois
(1998) states that doing the exact opposite of what is called ‘traditional’ in other sectors leads
the luxury industries to success. In this perspective, M&A interestingly affects this type of
business. Third, it is interesting to deepen and analyse the effects of mergers and acquisitions
on the market and the financial value in the luxury industry (Konigs & Schiereck, 2006) since
the literature is rather poor in this field.
The purchasers’ role is crucial in value creation, as Sudarsanam et al. (1996) show. In
particular, there is a considerable benefit from taking joint and simultaneous action in various
areas, such as the organisational and accounting aspects of a company, the operational aspects
and those relating to finance. However, there are factors that can have a significant impact on
the shareholders’ value creation. In particular, the payment method and the ownership structure
are the main issues discussed by Myers and Maljuf (1984) in their pecking order theory. These

10
academics show the disadvantage of paying in equity. Therefore, preferring the cash
compensation form can increase the gains and taking into account that larger shareholders,
associated with the equity payment, generate less earnings. This is due to dilution of the profit
for the acquirer’s shareholders if the merger is paid with shares.
Finally, an additional method adopted by some authors considers the success evaluation
of an M&A announcement on the stock markets in terms of resulting abnormal returns
(Martynova & Renneboog, 2008). The objective of this study is to show the reaction of the
acquiring shareholders to the announcement of the M&A, since they are the owners of the
company, by using an event study method. To compare if their reactions are significantly
different from each other regarding some days before and after the announcement. Thus, the
research question is as follows:
Does the announcement of an M&A in the luxury industry create any value for acquiring
firms’ shareholders?
During the last few decades, the luxury industry has been experiencing a flourishing
consolidation (Konigs & Schiereck, 2008), especially through mergers and acquisitions. This
growth in M&As is illustrated by Wang & Moini (2012): between 1987 and 2012 M&A
rocketed from $97.3 billion to $2,400 billion. M&A announcements have an impact on the
luxury industry. The main aim of this thesis is to analyse this effect and, in particular, its
influence in terms of value.
In order to discover the relationship between M&As in the luxury goods industry and
shareholders’ wealth creation, this paper analyses M&A transactions between 2000 and 2019.
With a total sample of 126 deals, the empirical results reveal that luxury goods industry
acquisitions do delete: not create any value for the acquiring shareholders with the performance of
M&As around the announcement date.
An overview of this thesis will be discussed now. First of all, the literature review will allow
rediscovery of the evolution that merger and acquisition operations have experienced in recent
years and their importance in the luxury industry. This ongoing growth has been particularly
accentuated within the three main giants of the luxury sector, thanks mainly to factors and
figures that, over time, have assumed an increasingly important role. An example of this is the
creative director. After this brief overview, the third chapter will focus on the technical part of
data gathering and event study, based on statistics. The next section will present and comment

11
on the results obtained, focusing on the most important ones. Finally, conclusions will be drawn
with particular attention to the limitations that have arisen.

12
2 Literature Review
This chapter presents the theory and provides a literature review related to mergers and
acquisitions in the luxury goods industry. The development of the hypotheses will be discussed
within the literature review. Since this study focuses on the luxury industry, this literature
review is meant for the purpose of gaining a better understanding of the impact of M&As in the
luxury goods industry.
2.1 Mergers and acquisitions
M&As has always been studied in the field of economics and finance. Research has been carried
out on merger and acquisition events in connection with the capital markets reaction. It has
been noted that this behaviour is influenced by various factors such as regional, industrial and
objective differences. Despite this, however, the literature analysis has few relevant materials
regarding the implications of M&A announcements on the capital market and on the wealth
impact within the luxury industry.
Lane and Jacobson (1995) investigated responses to financial exchanges on expansion
statements in the food trade. In particular, they provided evidence of the relationship between
brand use and recognition, trademark mindset and financial market response. They discovered
two possible market responses: a positive response to a higher valued and better known brand;
less effect in cases of excessive customer awareness as opposed to brand attitude and vice versa.
Likewise, Hosken and Simpson (2001) acquired observational evidence about wealth
impacts of supermarket mergers. These empirical studies led them to consider positively
supermarket mergers. This conclusion was based on the stock market reactions and the effects
of a potential growth in the price setting power. Supermarket mergers did not hurt customers
as far as higher retail costs were concerned. It is interesting to note the applications of these
experimental studies to the luxury retail sector.
Therefore, this section of thesis work will make assumptions about possible responses from the
capital market. Establishing and defending a prestigious reputation is vital for a luxury
company. This is the key to attracting and maintaining customers: to esteem the brand as
exclusive, high and popular. It implies that, according to Lane and Jacobson’s studies, M&A
announcements will naturally have a positive impact on the market, if there is no significant
difference between attitude and familiarity. Take the example of three luxury conglomerates,
namely LVMH, Kering (formerly PPR) and Richemont. They have created a nearly

13
oligopolistic market structure in Europe. If these luxury retail oligopolists acted as non-luxury
retailers and did not abuse their market power, there would be no reason to fear that the
transactions involving them would be rejected because of an excessive price-fixing force.
In addition to the assessment of mergers and acquisitions impact in the luxury retail
industry, studies have been conducted to provide a theoretical basis for M&A. For example,
Halpern (1983) introduced two different theories regarding the global non-profitability of
M&As and the correlation between capital market reactions and the intention of maximizing.
Regarding the first theory, mergers and acquisitions are intended to increase sales and control.
Therefore, transaction costs should offset the resulting gains. Still, financial motivations are the
basis for the second theory. Just think of how the existing information asymmetries are powerful
tools. For example, if the buyer has information about the financial undertaking, he maintains
this exclusivity on the market actors (Eckbo et al., 1990). In addition, there exist synergy
potentials. Also, an acquisition produces diversification effects that reduce expected bankruptcy
costs. Ultimately, the corporate control scenario involves the pre-event under-performance of
the reference target and is valid if the purchaser undertakes simple control measures such as
management replacement after the transaction completion (Jensen, 1986). If the notions of
signalling effects are added, the impact of new market information may also be considered. In
fact, these will result in a positive impact on capital market operators who will have more data
eligible to form the basis for their decisions (Staw & Ross, 1978; Blazenko, 1987).
2.2 Luxury goods
An important part of this thesis is luxury goods. The economic eccentricity of luxury consumer
goods with regard to ordinary (that is to say non-luxury goods) consumer goods. Risk and
return are key elements of equity value. These are the factors behind the theories of Ait-Sahalia,
Parker and Yogo on luxury goods. They considered the variety in functionality and consequent
demand curves of luxury goods and common consumer goods. According to these experts in
financial affairs, there is an enormous disproportion between the demand for luxury goods and
the consequent sensitivity to market shocks (Ait-Sahalia et al., 2004). This would result in an
increased volatility of luxury corporate revenues. According to the WHO (2020), expectations
are that the Corona crisis will continue for about two years. During these two years, the situation
is unstable and unpredictable. As soon as the situation has normalized again to the situation
before the Corona crisis, the advice formulated in this thesis will apply again. The same applies
to luxury equities, when the shareholder value depends on the cash flows to be supplied. As a

14
result, luxury equity returns, and risk are inevitably related. Therefore, in order to reliably assess
the effects on actual wealth, any excess return should be risk adjusted.
2.3 Mergers and acquisitions in the luxury industry
Many studies (Konigs & Schiereck, 2006) have so far considered the impact of M&A on the
involved firms’ performances. Numerous academics have conducted event research to test these
effects across many different industries (Konigs & Schiereck, 2006). For example, the literature
review of Tuch & O’Sullivan (2007) concluded that the acquirers’ abnormal returns are
negative or statistically insignificant. However, given the lack of information and the wide
variety of results in the luxury industry’s literature, this thesis will show how the
announcements of M&A have a positive impact on acquiring firms’ shareholders’ value.
First, according to Lane & Jacobson (1995), brand perception by customers is vital and
the announcement of the relative extension in the retail market depends on it. Share prices will
tend to respond more positively and inversely (Lane & Jacobson, 1995) at the increasing
perception of the trademark’s prestige. Therefore, Chevalier & Mazzalovo (2008) consider
important for all luxury firms to have powerful and prestigious brands. By extending Lane &
Jacobson’s conclusions (1995) to the luxury industry, it is natural to assume the M&As’
announcements financially positively impacting on the acquiring firms involved.
Second, another proof of the positive impact of M&A on the firm’s value is
demonstrated by Hosken & Simpson (2001). They show how mergers and acquisitions between
supermarkets generate favourable returns on the stock market by not increasing the prices for
end consumers. This is relevant for the luxury industry, highly active in the retail segment (35%
in 2016 and expected to grow further).
Third, between 1993 and 2005 Konigs & Schiereck (2006) delivered an evaluation of
M&As’ financial performance in the luxury industry. Their conclusion was a positive effect on
the acquirers’ share prices. Therefore, this tendency should stay unchanged through 2000 and
2019 as well as using different features. Fourth, according to Chevalier & Mazzalovo (2008),
luxury groups should keep very powerful brands because of their ability to generate profits.
Therefore, the acquisition of a strong trademark would be beneficial in the market. On these
grounds, the market reacts positively to such strategies as long as regulators do not restrict them.
Due to oligopolistic or monopolistic tendencies, which would make these conglomerates too
powerful. (Das & Donnenfeld, 1989). For all these reasons, mergers and acquisitions’

15
announcements should create a positive value for the acquirers’ shareholders. The formulation
of the hypotheses advanced in this thesis is listed below.
Hypothesis 1: In the, up to, twenty days preceding and following its announcement, M&A has
a positive impact on the value’s creation for the acquirers’ shareholders in the luxury goods
industry.
This hypothesis prevents any anticipation of M&A announcements on the event window up to
20 days. And ensures that no significant adjustments of the market occur after the
announcement day on the lapse of time. Thereby, M&A should not impact the creation’s value
in the days preceding and following their announcement date.
2.4 The creative director
Creative directors are popular these days because they allow brands to play on higher ground
(Harvard Business Review, 2013). No longer are they simply promoting an image, they are
making a difference. The role of the creative director has become crucial since 2013, evolving
to include store strategy, social media, advertising campaigns, and global brand vision (Harvard
Business Review, 2013). In fact, the standardization of products, their short life cycle, the mass
production and online promoting, risk dropping luxury fashion into mere marketing. Standing
out from the multitude means focusing on the brand name, product craftsmanship and excellent
quality. It is up to the creative director to use all his professionalism and artistic talent to make
the iconic symbols and brand products the more relevant than ever in the current market.
After several years of rapid turnover, brands are now looking for candidates with staying
power. Currently, a creative director has three years to realize the goal the company has given.
If this does not happen, another creative director will be appointed. In the past, a creative
director was ‘a lifetime job’ (Winser, 2013).
The continuous and rapid evolution of the luxury industry requires considerable tools
and knowledge from creative directors. There are various theories about this. For example,
according to the Kapferer & Bastien model (2012), creative directors need to integrate several
key aspects of luxury industry into the brand and product strategies. It is necessary to create a
new future vision of the brand that keeps up with the modern market (New York Times, 2007).
Yves St Laurent, Coco Chanel, Christian Dior, Hubert de Givenchy and Valentino Garavani
began their careers in the Haute Couture context, they did not exactly know that their products
16
and brands would involve global multi-million-dollar businesses. However, industry evolution
towards the selling of a real lifestyle required an extra gear.
A turning point in the concept of creative director took place with Yves Saint Laurent.
In fact, when Christian Dior died in 1957, according to his wishes, Yves Saint Laurent became
his successor and was named artistic director of the haute couture house at the age of 21. Since
then, the role of creative director has become increasingly important within luxury companies
to provide sustainability and growth, to increase the brand’s heritage and to attract new
customers (Winser, 2013).
Notably, in premium ateliers around the world, the appointment of a new creative
director before launching a new product is so critical that it can make or break a business
(Winser, 2013). In addition, designers aspiring to this role require super salaries and benefits
that can include penthouse apartments, six-figure grooming allowances, college fees and first-
class tickets to move between family and fashion house.
An example of this is one of fashion’s most controversial and creative talents, John
Galliano. He benefited from a remuneration of one million euros, combined with annual
bonuses of up to 700,000 euros. Galliano has thus become the emblem of the difference between
a designer and a creative director (Winser, 2013). A designer would never have the same calibre
as a creative director. Understandably, when Galliano was selected, Dior felt his vision precious
and he was a label icon for 14 years. Yet it is not known whether Raf Simons, Creative Director
at Dior since last year, will be perceived to measure up to Galliano.
In conclusion, the task of the creative director is not limited to the design of a product
and is potentially very risky. It requires a skilled, ambitious mind, in order to have an overall
vision of the brand that includes marketing strategy, retail environments, format of presentation
on the catwalk and lifestyle. The role of the creative director has become more complex,
evolving to include store strategy, social media and advertising campaigns, and global brand
vision (Mondalek, 2019). The very appointment of a new creative director can bring to the
company a large number of new clients or can lead many of them to distance themselves from
it. Due to the influence that this role has, many emerging designers consider the appointment
of creative director as a steppingstone. This leads to the second hypothesis:
Hypothesis 2a: Since 2013, creative directors have been judged more by their performance
and shareholders will respond more positively to announcement of M&A deals in the luxury
goods industry

17
The added value of this hypothesis is the fact that until 2013, the creative director was not really
in the foreground within the luxury goods industry, especially through social media, the public
as well as shareholders have more insights of the creative director and as a result of this the
shareholders can react differently to M&A deals.
The ultimate purpose of an enterprise is to create economic value. This happens if it generates
a utility surplus. In particular, the fact that the company strives to maximise its profit may be
interpreted as the attempt to create economic value in particular for shareholders. To attract
capital, the company must be able to pay a return at least equal to that which the provider of
capital could achieve by using his own resources in comparable investment alternatives.
Consequently, shareholders base future performance expectations on an analysis of the average
returns achieved by the company in the past and assess the possibility of growth through new
investments (Kasznik & McNichols, 2002). For example, the company can aim to increase its
profitability, to increase the operations it already undertakes or to adopt new and more
profitable ones. However, it is important to favour net sales (Shepherd et al., 2009). Therefore,
another possible way to measure the response of shareholders towards the creative director
leads to the following hypothesis:
Hypothesis 2b: Since 2013, the growth of the three luxury goods conglomerates increases
with the visibility of the creative director.

18
3 Data and Methodology
This chapter presents the sample selection, construction and the methodology intended to use.
3.1 Data selection
The analysis provided in this thesis relies on company-specific data, that includes the three
biggest luxury goods conglomerates worldwide: LMVH, Kering and Richemont. The annual
data used ranges from the period between 1997 and 2019. Therefore, several steps are taken to
construct the final dataset. The data for the M&A deal is identified using the Zephyr database,
and the selection criteria are as follows:
1. The announcement data of M&A activities occurred between 01-01-2000 and 29-11-
2019.
2. Share price data is from 03-01-2001 till 31-12-2019
3. M&A deals must acquire at least 50% of the target shares after the deal has completed;
acquirer will be the dominated owner of the target
4. The acquirer must be a conglomerate
5. The acquirer company’s status must be publicly listed
6. The deal must be completed.
By implementing these selection criteria, an initial dataset is produced which consists of 126
M&A transactions. The CAR may vary depending on whether the target is public or private
(Capron, 2007). In this dataset the split between public and private was: 91 deals were private
targets and 35 were public. In the regression analysis there is a control variable for this split.
Afterwards, the M&A transaction deals such as deal type, acquirer name and deal
characteristics are extracted from Zephyr. Then, the share price data is obtained from Yahoo
Finance. The share prices are daily adjusted closing prices, corrected for share splits and
dividends.
Each dataset is merged using US SIC code and acquirer ISIN number. When merging
the dataset, some of the deal-observations have been dropped due to constraints on other
variables.
Ultimately, since the luxury industry is subject to various value determinants, and
reactions to market effects vary from company to company, it is relevant to consider data on

19
the most appropriate main local market index. The choice of a main market index as a
benchmark portfolio is dictated by the lack of sufficient external benchmarks and feasibility
factors. The two market indices analysed are: CAC 40 (Kering and LVMH) and Swiss Market
Index (Richemont). These market indices are obtained from Yahoo Finance and Thomson
Reuters. The indices are adjusted for dividends, share splits and capital increases.
Table 2: Deals per year per conglomerate
LVMH Kering Richemont Total Year Private Public Private Public Public Private Private Public 2000 7 0 0 0 0 0 7 0 2001 3 1 0 0 0 0 4 1 2002 2 0 0 0 0 0 2 0 2003 4 0 0 0 0 0 5 0 2004 3 1 0 0 1 1 3 2 2005 0 1 0 2 0 0 0 3 2006 1 2 0 0 0 0 1 2 2007 1 4 0 1 0 4 5 5 2008 4 0 0 0 1 2 7 1 2009 1 0 0 0 0 1 2 0 2010 5 3 1 1 0 1 4 4 2011 7 3 2 3 0 1 7 6 2012 4 0 4 2 1 2 10 3 2013 9 0 4 1 0 0 13 1 2014 3 1 1 0 1 0 3 2 2015 3 0 0 0 0 0 3 0 2016 5 1 0 1 0 0 5 2 2017 2 0 0 0 1 1 3 1 2018 2 0 0 1 0 1 3 1 2019 3 1 0 0 0 2 4 1
Kering and Richemont started with mergers and acquisitions in 2004, while LVMH had
already 7 private mergers and acquisitions in 2000. There is no evidence suggesting that from
2007 till 2011 the financial crisis had a visible effect on the number of mergers and acquisitions.
However, it becomes clear that at the end of the economic crisis there is a considerable increase
of the number of mergers and acquisitions per year. This suggests that there is a ‘shakeout sale’
of luxury goods companies, probably because due to the economic crisis these firms are in
financial distress and can be acquired at a cheaper price (Day, 1997).

20
3.2 Methodology
Particular attention will regard abnormal returns reflected in the involved firms’ share prices
(Wang & Moini, 2012). They are important in the financial performance of mergers and
acquisitions.
Abnormal returns according to the market model are determined by comparing the
observed returns with the expected ones around the announcement day. They occur when the
observed returns are significantly different than the expected returns. Profits are reflected in
economic achievements. Notably, positive abnormal returns are synonymous with good
financial performance since they increase the shareholders’ value and vice versa (Wang &
Moini, 2012).
Ultimately, cumulative average abnormal returns will be considered to evaluate M&A’s
financial effect in the personal luxury goods industry.
3.2.1 Time and actor perspectives
Eventually, this thesis focuses on the value (positive or negative) created by the acquiring firms
for their shareholders. The acquired companies’ M&A financial performance will not be studied
in this dissertation.
3.2.2 Benchmark model
The benchmark model selection is a vital step in the event studies, and it involves both positive
and negative aspects.
The model used in this thesis correlates to the company’s share returns with those of the
corresponding market index (Campbell et al., 1997). This means, inter alia, that the firm’s share
prices are closely connected with the market’s cost. The identification of the expected returns
(Campbell et al., 1997) is therefore facilitated.
3.3 Estimation window and computation of expected returns
Abnormal returns derive from the comparison between the observed returns with the expected
ones.
The first step is the evaluation of the expected returns by using an OLS regression on
the time interval called ‘estimation window’ (lapse of time that precedes the event window and
defined ‘normal’). The reason for this is that these data meet the requirements of a normal
distribution, which is essential in the regression analysis applied to value the parameter in the

21
risk-adjusted market model. It should also be borne in mind that these returns have a greater
symmetry and have more stable power moments than discrete returns.
3.3.1 Estimation window
Although the literature is in a short supply of information regarding the setting of the estimation
window, it is possible to follow certain guidelines.
For instance, according to Campbell et al. (1997) and MacKinlay (1997), the estimation
window should not overlap the event window so that the event studied does not affect the
‘variation’ of the estimation period (Campbell et al., 1997; MacKinlay, 1997).
A peculiarity of the estimation window is its different length across the literature. For example,
Konigs & Schiereck (2006) set an estimation period of 250 days, preceding the event window,
for their event study method testing the financial performance of M&A in the luxury sector
between 1993 and 2005. Furthermore, for a similar study Del Giudice & Maggioni (2014) used
an estimation window of 200 days before the event window. It is noteworthy that academics do
not justify their choice in both cases.
The model used in this thesis is the one introduced by Campbell et al. (1997). According
to their pattern the event study’s estimation window ‘could be set over the 120 days prior to the
event’. However to keep the estimation window as ‘clean’ as possible, there will be a gap from
-30 to -20, between the estimation window and the event window, to ensure that no reactions
from shareholders end up in the estimation window. So, the estimation window will be (-150,
-30).
3.3.2 Computation of expected returns
Expected returns are estimated by using an OLS regression model (MacKinlay, 1997):
E(Rit)= αi + βiRmt + εit
Where:
- αi is the first regression parameter specific to the security i;
- βi is the second regression parameter expressing the sensitivity of the security i to the
market index m;

22
- Rmt is the t-period observed return on the market index m;
- εit is the zero mean disturbance term.
In the above equation, α and β are the parameters of the OLS regression that correlate the
company’s stock returns with those of the corresponding market index (Campbell et al., 1997).
3.4 Event window and computation of abnormal returns
3.4.1 Choice of the event window
Abnormal returns are estimated over the ‘event window’, i.e. the lapse of time around the
announcement date (time 0) during which the M&A’s financial performance is evaluated.
This thesis is based on an event period of 11 days that includes the event day itself (day
0) and 5 transaction days before and after the event date (11 in total). The choice of this lapse
of time (-5; +5) was strategic to avoid any longer window to exclude more events due to the
resulting overlapping of several event ranges (Konings & Schiereck, 2006). But such broad
window could include more noise and confounding info, so also the window (-1,1) is tested in
the robustness test (section 5.4).
3.4.2 Computation of abnormal returns
According to MacKinlay (1997) the acquiring firm’s abnormal returns are equal to the
difference between the observed returns and the expected returns:
ARi,t = Rit – E(Rit)
In the equation below:
- ARit is the t-period abnormal return on the security i;
- Rit is the t-period observed return on the security i;
- E(Rit) is the t-period expected return on the security i.
3.4.3 Computation of cumulative abnormal returns
The CAR is the aggregation of the abnormal returns in the event window (MacKinlay, 1997).
Then, the acquiring firms’ CAR is calculated using the following formula:

23
CAR[x; y] = ∑ 𝐴𝑅!"#$ it
Where x and y are the days between the event window. The CAR variable has been inspected
for its distribution and its extreme values, so called ‘outliers’. Based on this inspection the
CAR value is winsorized at 1.5% and 97% (Stevens, 1984).
3.5 Cumulative average abnormal returns
3.5.1 Computation of average abnormal returns
The compute of the cumulative average abnormal returns first requires the calculation of the
average abnormal returns across the n events analysed (Ribonnet & Coeurderoy, 2015):
AARt = %&∑ 𝐴𝑅&#% it
Where:
- AARt is the t-period average abnormal return;
- ARit is the t-period abnormal return on the security i.
3.5.2 Computation of the cumulative average abnormal return
M&A’s impact evaluation on the financial performance of the acquiring companies is vital
throughout the entire event window and across the whole sample. Therefore, the cumulative
average abnormal returns should be calculated as the sum of the average abnormal returns
(Ribonnet & Coeurderoy, 2015):
CAAR[x;y] = ∑ 𝐴𝐴𝑅!"#$ t
In the above formula:
- CAAR[x; y] is the cumulative average abnormal return across the time interval [x; y];
- AARt is the t-period average abnormal return.
Once the cumulative average abnormal return is computed, the following conclusions about
M&As’ financial performance are deducted.

24
A positive CAAR means a positive value created by M&A for the firms’ shareholders
and vice versa (Wang & Moini, 2012). Moreover, the CAAR should not vary (Kirchhoff &
Schiereck, 2011) when no event occurs (market efficiency assumption).
3.6 Parametric and nonparametric t-test
First of all, the CARs statistical significance is proven and the entire sample undergoes one-
sample t-test. A parametric t-test for normal distribution is adopted in order to check normally
distributed returns’ value and reliability.
Regarding t-tests, the authors Barber and Lyon assume that these investigations are
suitable for an event frame of 41 days. But they point out that the consistency of t-tests is
undermined by a more extended event window than can lead to improper results when the null
assumption is not excluded with the appropriate incidence (Barber & Lyon, 1997). On the other
side, authors as Dodd & Warner (1983), Mikkelson & Partch (1986) or Boehmer et al. (1991)
are more critical with simple tests. To face the problem, they suggest a cross sectional
standardization when there is suspicion of a cross sectional dependence between the examined
cases. It is important to consider that such a dependency may occur due to the limited number
of firms that the sample includes. Additionally, they propose a grouping of events, an adjusted
test method and a standardisation of excess return. The latter is appropriate when the variance
of excess returns increases during the event period (Boehmer et al., 1991).
It is important to apply, in the final analysis, the Generalized Rank Z test: a
nonparametric statistical test that compares two paired groups, because a t-test is sensitive for
three biases. The investigation essentially calculates the difference between each set of pairs
and analyses these differences.
3.7 Lineair regression
This part will examine dependent and independent variables. A linear regression searches for
connections and relations between the deal characteristics (e.g. public or private targets) and
the financial characteristics of the conglomerate or whether this has an impact on the reactions
of the shareholders of the conglomerates. This only looks at the acquisitions that surprise the
shareholders, because the CAR only looks at the abnormal returns. Since this dataset is a

25
repeated meeting of the same companies, this repeated meeting takes place at irregular times,
as a result of which there are many missing observations. As a result, the data set does not
characterize itself as a panel data set. That is why the OLS regressive has been checked for the
firm fixed effects by means of the inclusion of a firm dummy variable. This corrects for auto
correlation and the heterogeneity of firm specific effects.
3.7.1 Dependent variables
The literature review defines the dependent variable as the cumulative abnormal share return
of acquiring companies around the announcement date of merger and acquisition as a substitute
for M&A performance. Starting from this definition, this thesis will consider the acquisitions
results as dependent variable, with the aim of verifying the acquiring enterprises’ earnings.
At this regard, academics delivered several analyses. For example, Bruner (2002)
measures the M&A profitability of a company by using the events examination. He also adopts
the CAR as a direct means of estimating the value for shareholders. This is important since the
share price is equal to the present value of the expected future cash flows.
Andrade et al. (2001) verify whether mergers create gains for the investors by analyzing
the abnormal reaction of the stock market at the announcement date.
Noteworthy is the analysis carried out by MacKinlay (1997). He uses an event study
method and he applies the market model to explain respectively the generation and the
computation of abnormal share return. The CAR is calculated using an Event Study Tool.
Secondly, a key pillar of this research is to examine the effect of the creative director on the
growth of the company that could eventually lead to wealth creation for the shareholders. The
firm’s growth opportunities are approximated by the sales. Firm growth is measured by the rate
of net sales revenues of the firm in the same year as the M&A. It is a more frequently used and
referenced measure of growth in academic studies (Shepherd et al., 2009).
3.7.2 Independent variables
Deciding where to invest is crucial matter in the expanding business process of acquiring
companies. They can, in fact, opt for domestic mergers and acquisitions, that is in their own
country, or make investments in other countries (cross-border M&As).
Ben-amar et al. (2011) use target nationality as their variable to verify the value creation.
For example, their studies show positive abnormal returns in cross-border M&A operations.

26
Based on Ben-amar et al.’s research, two dummy variables were defined: ‘1’ if the target and
the acquirer have different nationality, which is France for LMVH and Kering or which is
Switzerland for Richemont; ‘0’ any other way. The target nationality data comes from Zephyr’s
database.
The Return on Equity is a powerful tool for measuring the profitability of a company (Beccalli
& Frantz, 2009) and in this thesis this measure has been inspected for its distribution and
outliers. Using the Thomson One banker database, the ROE is calculated by dividing profit
before interest, tax and depreciation (EBITDA) with shareholder’s equity. Is important to
underline that no correction has been applied. Finally, the ROE had been checked for linearity
with the CAR variable and no linear relationship has been found.
3.7.3 Control variable
Over the years, various theories have been developed about the benefits of investing in public
or private companies. According to Draper & Paudyal (2006) shareholders’ wealth gains are
strictly dependent on target status, public or private firms. In particular, according to these
academics investing in private companies means maximizing the shareholders’ wealth. In
addition, Fuller et al. (2002) consider that purchasers achieve better results by dealing with
private companies rather than public companies. According to these studies, this thesis will
introduce two dummy variables (note that the data are gathered from Zephyr): ‘1’ if the target
firms are private; ‘0’ public.
A second control variable is defined by the acquirer’s firm size. Firm size and acquisition
announcement returns are strongly correlated. In particular, the studies delivered by Moeller et
al. (2004) show that this relationship is negative, especially as the size of the company increases.
For example, small target firms are able to generate higher M&As performance because they
have a lower premium payment. By contrast, large corporations generally pay a higher
premium. Therefore, abnormal returns created by big enterprises are lower. This data is
accessible in Thomson One Banker Database. This variable has been inspected for its
distribution and outliers. Because of this, to calculate the total assets there has been used a
natural logarithm of the book value of total assets. Total assets have been checked on the
linearity with the CAR variable, there is no evidence that there is no linear relation.

27
A third control variable is defined by leverage. According to Myers and Majluf (1984), in their
pecking order theory, issuing shares will present the wrong signal to markets. Leverage is
important during M&A activities, because the amount of leverage reduces the risk taking of the
company (Admati et al., 2017). This can lead to less risky M&As. Leverage variable is defined
by dividing the amount of debt with the amount of equity. This data is accessible in Thomson
One Banker Database. This variable has been inspected for its distribution and outliers. Based
on this inspection the leverage variable is natural logarithm transformed thereafter winsorized
on 10.9% and 89.1%. Leverage has been checked on the linearity with the CAR variable, there
is no evidence that there is no linear relation.
A fourth control variable is defined by making a difference between a hostile or friendly
takeover. It is possible to distinguish the acquisition attitudes by three types: hostile, friendly
and neutral takeovers. In particular, various studies show that the performance of the acquiring
company’s shareholders is deeply and differently influenced depending on whether attitudes
are hostile or friendly. For example, Cartwright & Schoenberg (2006) explain that a hostile
takeover creates a higher abnormal return on stock. Considering the above theory, this thesis
adopts two dummy variables: ‘1’ if the transaction is hostile and ‘0’ any other way. Zephyr
collects al the various means of the type of take over. This thesis attempts to include take over
types as control variable. Nonetheless, there is no data available for hostile M&As in the deal
editorial. Hence, a comparison cannot made between hostile and friendly attitudes and thus
everything has been classified as neutral and friendly takeover.
A fifth control variable is defined by the role of the creative director. According to Harvard
Business Review (2013), this figure has become crucial since 2013 and it significantly
influences the business strategy, the advertising campaigns and the firm’s global vision. The
creative director can even influence the success of M&As. Therefore, according to Business of
Fashion (2016), simply changing the person playing this role can boost a fashion house. An
example of this is Yves Saint Laurent: the appointment of the new creative director increased
the sales revenue of the parent company Kering up to 27% (Business of Fashion, 2016).
Considering this, the present thesis work will take up the dummy variables (note that the data
are gathered from Zephyr): ‘1’ if the M&A announcement date occurs after and in 2013; ‘0’ if
the M&A announcement date occurs before 2013.

28
Table 3: Variable Description Variable Description Variable Measurement
Target Nationality TargetNationality ‘1’ if the target and the acquirer have
different nationality, which is France
for LMVH and Kering or which is
Switzerland for Richemont
Return on Equity ROE Earnings before interest, tax and
depreciation (EBITDA) to total
shareholder’s equity
Status of Target Firms TargetStatus ‘1’ if the target firms are private
Acquirer firm size Ln(FirmSize) Natural logarithm of total assets
Leverage Ln(Leverage) Natural logarithm of proportion of total
amount of debt to total amount of
equity
Creative Director CreativeDirector ‘1’ if M&A announcement date occurs
after and in 2013
Interaction term of ROE and Target
Nationality
ROE*TargetNationality Multiplication of ROE and Target
Nationality
Since it is not known how fast or slow shareholders respond to an announcement, the event
window (-5, +5) has been chosen, because this event window gives the best display of their
responds, so that as little as possible irrelevant matters are included. Also based on the cross
sectional t-test and the generalized rank z-test, because these values are the closest to
significance (see Appendix B). This given result does not support the first hypothesis.
Verified the normal distribution for the CAR (see Appendix C), it is possible to test
hypotheses 1 and 2a with the following regression model:
CAR (-5,+5) = α + β1TargetNationalityi + β2ROEi + β3TargetStatusi + β4LnFirmSizei +
β5Leveragei + β6CreativeDirectori +β7ROE*TargetNationalityi + εi
In the regression analysis the error term will be inspected via the residual histogram, the
predicted versus the residual plot and the VIF values.
To see if the creative director affects the growth since 2013, this thesis includes an additional
model that put the natural logarithm of the sales as a dependent variable. Total assets have been
removed; this creates too much correlation between independent and dependent variable. The
regression may become unreliable as a result and the results may therefore be unreliable. This
is also called multicollinearity. Verified the normal distribution for the sales (see Appendix C),
the regression model to test hypothesis 2b is as follows:

29
Ln (sales) = α + β1TargetNationalityi + β2ROEi + β3TargetStatusi + β4Leveragei +
β5CreativeDirectori +β6ROE*TargetNationalityi + εi

30
4 Results
This chapter will analyse the empirical results obtained, starting from the various hypotheses.
The structure will be organised as follows. Section 4.1: discussion of descriptive statistics.
Section 4.2: analysis of the correlation between control variables and independent variables.
Section 4.3: evaluation of regression results to demonstrate the validity of assumptions and
section 4.4: re-assessment of assumptions using robustness tests.
4.1 Descriptive statistics
In table 4 is possible to note the descriptive statistics of the dependent, independent and control
variables considered. In particular, statistical indices such as the number of observations, mean,
median, standard deviation, minimum and maximum values of each variable were analysed.
The first dependent variable studied is the CAR. It can be noted that the average CAR
of the acquiring companies assumes a positive value on the 11-day event window (-5, +5). The
period considered runs from 2000 to 2019. This positive value is coherent with previous
investigation (Konings & Schiereck, 2006). Furthermore, the median of CAR (-5, +5) has
proved to be in line with the research conducted by Feito-Ruiz & Menéndez-Requejo (2011).
The CAR value observed is, equal to 0,0005 and shows that on average the acquiring enterprises
obtain positive returns in 11 days around the announcement period of the M&A operations. The
cumulative AAR is shown in appendix A; figure 1, which is a graphical representation of the
AAR in window (-20, +20). From this plot it can be deduced whether there is a significant
effect, which shows that in window (-5, +5) the effect is the strongest.
The second dependent variable analysed is the natural logarithm of sales. This value is
important in order to assess whether, from 2013, a greater visibility of the creative director
allows a bigger growth of the three conglomerates of luxury goods. The coefficient of variation,
which can be calculated by dividing the standard deviation by the mean, is relatively small.
This could imply that the three big luxury conglomerates follow a similar M&A strategy.
This section continues with the analysis of independent variables. First, it should be
noted that 60.3% of the total sample analysed is made up of cross-border mergers and
acquisitions with their main objectives outside France for LVMH and Kering and outside
Switzerland for Richemont.
Moreover, it is important to mention that the acquiring companies in the sample have a positive
ROE, which varies between 0.095 and 0.579. The fact that the mean value is 0,290 implies a
positive ROE for competitors. Considered also the interaction between ROE and

31
TargetNationality, a positive ROE is observed for 18.1% of the sample that is implicated in
acquisitions outside France and Switzerland.
After the analysis of dependent and independent variables, it is important to investigate
the control variables. They are related to the characteristics of the transaction, consisting of the
status of the target companies, and the business characteristics of the acquirer, namely the size
of the company, leverage and creative director. In this regard, interesting information is shown
in table 4. Indeed, it appears that more than 72.2% of the target group for mergers and
acquisitions is a private company. This is fully in accordance with the studies of Fuller et al.
(2002) that explain how the best results are obtained by acquirers involved in private rather than
public companies. Again, concerning the firm size, it is normalized by the natural logarithm of
the total assets. The total of this last value varies from 22,241 to 24,897 with an average of
23,762. Thus, on an average, the acquiring companies have a positive value of the assets. As
for the average leverage, transformed back into a lineair number is about 40.5%.
Thus, in general acquiring companies use debt higher than the equity to finance their business
transactions. Finally, a careful analysis shows that since 2013 the creative director affected
around 33% of the observed M&As’ activities.

32
Table 4: Descriptive Statistics of Independent and Control Variables The main statistical data (shown in the table) as the number of observations, mean, median, standard deviation, minimum value and maximum
value will now be presented for the measures are: (1) CAR (-5, +5): the Cumulative Abnormal Return or CAR of the acquiring firms after the
120-day estimation period is calculated using the market model according to MacKinlay (1997). (2) Ln(Sales): is the natural logarithm of the
sales of the year for the merger and acquisition action. (3) TargetNationality: is a dummy variable that can assume value ‘1’ if the target
enterprise is situated outside of France or Switzerland and ‘0’ otherwise. (4) ROE: is the EBITDA divided between the shareholders’ equity
of the acquiring companies. (5) TargetStatus: is a dummy variable of ‘1’ if the target status is private and ‘0’ otherwise. (6) Ln(FirmSize): this
measure is equal to the natural logarithm of total assets. (7) Ln(leverage): this measure is the natural logarithm of total liabilities divided by
total assets. (8) CreativeDirector: value equal to ‘1’ if the announcement date of M&A occurs in 2013 and after this date. (9)
ROE*TargetNationality: is given by the multiplication of ROE and TargetNationality as interaction term.
Variables Observations Mean Median Standard
Deviation Minimum Maximum
CAR (-5,+5) 126 0.007 0.000 0.043 -0.100 0.100
Ln(Sales) 122 23.179 23.057 0.640 21.532 24.462
TargetNationality 126 0.603 1.000 0.491 0.000 1.000
ROE 122 0.290 0.273 0.114 0.095 0.579
TargetStatus 126 0.722 1.000 0.450 0.000 1.000
Ln(FirmSize) 122 23.762 23.724 0.624 22.241 24.897
Ln(Leverage) 122 -0.903 -0.912 0.633 -2.000 0.200
CreativeDirector 126 0.333 0.000 0.473 0.000 1.000
ROE*TargetNationality 124 0.181 0.181 0.175 0.000 0.579
4.2 Correlation
The following section will illustrate the correlation between dependent and control variables.
In particular, the correlation matrix in table 5 shows a star (*) as a significant sign at 5%
confidence level. It is important to specify that the correlation, despite a significant indication,
lies between the values -1 and 1. Therefore, there is no problem of multicollinearity between
the independent and control variables. Moreover, for most variables, the coefficient does not
exceed 0.5. The only exception is the ROE*TargetNationality variable which shows a relatively
high correlation (TargetNationality with 0.847 percentage) given by the interaction between
ROE and TargetNationality.

33
Table 5: Pearson Correlation Matrix In this table is possible to visualize the interaction between all dependent, independent and control variables in the regression models. It sets
out Pearson’s correlation coefficients. The measures and indices adopted are: (1) CAR (-5, +5): the Cumulative Abnormal Return or CAR of
the acquiring firms after the 120-days estimation period is calculated using the market model according to Mackinlay (1997). (2) Ln(Sales): is
the natural logarithm of the sales of the year for the merger and acquisition action. (3) TargetNationality: is a dummy variable that can assume
value ‘1’ if the target enterprise is situated outside of France or Switzerland and ‘0’ otherwise. (4) ROE: is the EBITDA divided between the
shareholders’ equity of the acquiring companies. (5) TargetStatus: is a dummy variable of ‘1’ if the target status is private and ‘0’ otherwise.
(6) Ln(FirmSize): this measure is equal to the natural logarithm of total assets. (7) Ln(leverage): this measure is the natural logarithm of total
liabilities divided by total assets. (8) CreativeDirector: value equal to ‘1’ if the announcement date of M&A occurs in 2013 and after this date.
(9) ROE*TargetNationality: is given by the multiplication of ROE and TargetNationality as interaction term. It should also be noted that: (*)
The single star in the coefficient indicates the significance at the level of 5%; (**): the double star in the coefficient indicates the significance
at the level of 1%. The values in parentheses are the standard errors.
Variables CAR (-5,
+5) Ln(Sales)
TargetNatio
nality ROE
Target
Status
Ln(Fir
mSize)
Ln(Levera
ge)
CreativeDi
rector
ROE*TargetN
ationality
CAR (-5,+5) 1
Ln(Sales) 0.014 1
TargetNationality -0.058 0.015 1
ROE 0.034 0.192* 0.142 1
TargetStatus 0.006 0.058 0.454** 0.146 1
Ln(FirmSize) -0.012 0.968** 0.040 0.130 0.062 1
Ln(Leverage) 0.086 0.026 0.202* 0.637** 0.009 0.032 1
CreativeDirector 0.013 0.472** 0.034 -0.137 0.170 0.487** -0.206* 1
ROE*TargetNati
onality
-0.017 0.023 0.847** 0.554** 0.440** 0.008 0.461** -0.058 1
4.3 Regression
The following section of this thesis aims to present the analysis that has been carried out on the
primary regression. In particular, it will set out the results following from testing the
assumptions made before. Two regression models have been formed. This allowed examining
the creation of wealth for the acquirer shareholders. Noteworthy is table 6, which provides the
results of multiple linear regressions.
Firstly, it is important to specify that the event window has 11 days. Its function as a
dependent variable is important in order to observe the relationship between the figures of the
creative director, the announcement of merger and acquisition and the creation of value for the
acquiring shareholders, always during the period of time specified.
An additional dependent variable used is the Ln(Sales), fundamental in order to estimate
the impact that the creative director exerts on the business increase.
Further considerations involve the TargetNationality coefficients that introduce two
similar trends: in both models they are negative and insignificant. This points out that merger
and acquisition operations outside France or Switzerland produce less results than the same

34
operations carried out at domestic level; moreover, M&As carried outside French or Swiss
territory produce less sales than the same domestic M&As. This negative trend is fully in line
with the results of Datta & Puia (1995) and Andrade et al. (2001) stating that foreign
acquisitions will lead in the future to the destruction of the companies’ value. Therefore, this
confirms that the geographic area is particularly correlated to the good performance of mergers
and acquisitions.
To see the different results between private and public target firms, this thesis
demonstrates an additional control variable. When target status is included in the regressions,
it does give diverse results among the models. In model 1 this is a positive value, which implies
that if the target changes from public to private the average CAR increases by 0.2%. But the
coefficient is not significant so no statistical conclusion can be based on this result. While in
model 2 this is a negative value, which implies that if the target changes from public to private
the average sales decreases by 0.13%. But the coefficient is not significant so no statistical
conclusion can be based on this result. This analysis shows that the TargetStatus has no
significant and determining effect on the CAR and Sales.
Furthermore, as regards ROE it was found that this coefficient is negative in model 1
and 2. According to Beccalli & Frantz (2009) M&A operations will have an important impact
by weakening the ROE value.
Concerning the ROE*TargetNationality term, this coefficient shows a negative value.
This indicates the advantages of an acquirer with a better ROE that, focusing on domestic
acquisitions, can generate a superior CAR. In model 1 and 2 the ROE*TargetNationality is
statistically insignificant. Therefore, the result does not illustrate the effect of this parameter on
the share return during the 11 days (-5, +5) CAR and, in this case, no conclusions can be drawn.
Finally, it is important to specify that, in any event, positive abnormal return does not always
ensure a higher ROE (Ahsan, 2012) to the bidders.
Another important parameter to take into account is the firm size. In particular, this
thesis section shows how business dimensions have a negative and statistically insignificant
trend in model 1. Moreover, the delivered analysis indicates that the firm size doesn’t affect the
market’s reaction to merger and acquisition activities (Dutta & Jog, 2009). As far as model 2 is
concerned, the acquirer firm size has not been included due to the possible emergence of
multicollinearity.
Again, M&A operations can be significantly influenced and aggravated by leverage
(Pervan et al., 2015). Analysing this measure, in fact, there are negative and insignificant results
using CAR (-5, +5). This is also due to the fact that, since the leverage does not control

35
managers, they do not always work in the interests of shareholders. This is in line with the
agency theories, which says that there is a separation of ownership and control that managers
will act on their own behalf and not in the interest of shareholders. (Hill & Jones, 1992).
It is also important to mention the variable creative director, which is an addition to the
current literature. In particular, a value of 1% significance was found in model 2. As shown by
Harvard Business Review (2013) and Business of Fashion (2016), from 2013 the role of
creative director has become increasingly vital. This gives a positive value, even though there
is no static evidence and this creates a higher value for the acquiring shareholders. Moreover,
the results obtained show a significant statistical impact on sales. This variable corresponds to
hypotheses 2a and 2b.
The coefficient of determination or the adjusted R-squared is now introduced. A close
correlation between model 1 and 2 can be pointed out. The adjusted R-squared is, in fact,
negative for model 1 showing a not sufficiently representative explanation of the model. On the
other hand, model 2 has a positive coefficient of 30.2%. This leads to the conclusion that model
2 can be used to better interpret the data of model 1. Using the histogram of the residues and
the scatter plot of the residues, relative to the predicted value, the error terms were checked for
homoscedasticity bias and the normal distribution.
Finally, two additional fixed effects are presented. In particular, the year fixed effects
are those between the crisis years from 2007 to 2011. For this reason, a dummy time is adopted.
The dummy variables used, assume value ‘1’ during the crisis years and ‘0’ in all other years.
Second, it is important to consider that the fixed effect for the company concerns the repeated
measurement of the same firms and this grouping could lead to an optimistic standard error.
Ultimately, the firm dummy variables can assume value ‘1’ if it is Kering and ‘0’ otherwise.
The Anova measures the discriminatory power of the analysis. If the Anova is not significant,
the model as a whole is unreliable and therefore the R-square, the explanatory power, is not
reliable. For model 1 the F-value is 0.317 and the p-value is 0.945 therefore the discriminatory
power is too low so the R-square of 0.019 is unreliable. But, in model 2 the F-value is 9.737
and the p-value is 0.000 therefore the R-square of 0.337 is reliable and trustworthy.

36
Table 6: Regression Result of M&A Performance over the period 2000 – 2019; CAR (-5, +5) and Ln(Sales) Table 6 shows the results for two regression models concerning the merger and acquisition performance in the period between 2000 and 2019.
It is important to specify that in model 1 the dependent variable is 11 days CAR of the acquiring companies around the date of M&A
announcement. The dependent variable used in model two, instead, is Ln(Sales) that allows to measure the business growth. The measures and
indices adopted are: (1) CAR (-5, +5): the Cumulative Abnormal Return or CAR of the acquiring firms after the 120-days estimation period is
calculated using the market model according to MacKinlay (1997). (2) Ln(Sales): the natural logarithm of the sales of the year for the merger
and acquisition action. (3) TargetNationality: a dummy variable that can assume value ‘1’ if the target enterprise is situated outside of France
or Switzerland and ‘0’ otherwise. (4) ROE: the EBITDA divided between the shareholders’ equity of the acquiring companies. (5) TargetStatus:
a dummy variable of ‘1’ if the target status is private and ‘0’ otherwise. (6) Ln(FirmSize): this measure is equal to the natural logarithm of total
assets. (7) Ln(leverage): this measure is the natural logarithm of total liabilities divided by total assets. (8) CreativeDirector: value equal to ‘1’
if the announcement date of M&A occurs in 2013 and after this date. (9) ROE*TargetNationality: given by multiplying ROE by
TargetNationality as interaction term. It should also be noted that: (*) The single star in the coefficient indicates the significance at the level
of 10%; (**): the double star in the coefficient indicates the significance at the level of 5%; (***): the triple star in the coefficient indicates the
significance at the level of 1%. The values in parentheses are the standard errors.
CAR (-5,+5) Ln(Sales)
1 2 Constant -0.026 22.088***
(0.023) (0.090) TargetNationality -0.004 -0.017
(0.005) (0.036) ROE -0.002 -0.034
(0.009) (0.061) TargetStatus 0.002 -0.013
(0.005) (0.036) Ln(FirmSize) -0.013
(0.010) Ln(Leverage) -0.003 -0.193***
(0.009) (0.058) Creative Director 0.006 0.300***
(0.007) (0.038) ROE*TargetNationality 0.001 -0.043
(0.050) (0.032) Adjusted R-Square -0.072 0.765 R Square 0.019 0.337 F Value 0.317 9.737*** Observations 122 122 Year Fixed Effect Yes Yes 2007 -0.011 -0.079 (0.018) (0.122) 2008 0.007 0.268** (0.019) (0.126) 2009 0.032 0.231 (0.033) (0.230) 2010 0.002 0.257* (0.019) (0.131) 2011 -0.002 0.305*** (0.017) (0.113) Firm Fixed Effect Yes Yes

37
4.4 Robustness test
This section sets out the robustness tests performed to further check the abnormal return. More
specifically, the main assumptions are tested using a sample of all three companies each based
on their scale and business portfolio.
The analysis by Donzé (2017) was conducted starting from a quick overview of the total assets
of the various luxury conglomerates, all different in terms of size. The data collected for the
fiscal year 2015 were 57.6 billion euros for LVMH, compared with the 20.1 billion euros for
Richemont and the 23.4 billion euros for Kering. It can be noticed that LVMH proved to be an
undisputed leader in the luxury industry by reporting total assets twice or even three times
higher than its direct competitors. The same can be stated for the workforce. In fact, in 2015
LVMH employed 57,601 persons, Richemont 28,324 and Kering 34,697.
A second basic element in this analysis is the portfolio of the various companies. In fact,
each of the three conglomerates holds specific brands in various luxury sectors. LVMH
certainly holds the most diversified portfolio. Its brands range from the fashion industry to
champagne and spirits, from perfume and cosmetics to watches and jewelry as well as to
selective distribution. Its direct competitor Richemont, however, is focused on watches and
jewelry (83.8% of sales in fiscal year 2016). Moreover, it has few fashion brands and no activity
in the field of drinks and cosmetics. Finally, Kering is specialized in luxury fashion, though
with a few watch brands, while it is not involved with either drinks or cosmetics. The company
also shows a strong division outside of luxury especially within the Sports & Lifestyle industry
(including Puma, 32% of sales in 2015).
The data analyzed by Donzé (2017) above show that the three conglomerates adopted a
different timing in the engagement of these groups in the luxury business thus explaining their
various sizes and brand portfolios. For example, when LVMH was founded, in 1987, the
consolidation of Louis Vuitton and Moët-Hennessy had already started about a decade before.
Instead, the active strategy of merger and acquisition in the luxury sector was adopted by
Richemont and Kering only later, starting in the mid-1990s and after 2000 respectively.
It is also important to list the changes related to the measures used in the robustness
tests, aimed at reducing autocorrelation and checking whether there is a difference in response
from the shareholders between the firms. First of all, it should be specified that the interaction
term ROE*TargetNationality has been deleted due to multicollinearity. The same applies to the
firm size in respect to the company dummies.

38
Due to the OLS regression methodology, omitted variable bias and endogenity could not be
excluded. But, in the residual plot there are no indications of a bias. Therefore, this study
assumes that the omitted variable bias is limited.
Finally, CAR shows how, although these three conglomerates are used to undertake M&A
operations (therefore shareholders should no longer be surprised by any M&A) each merger
and acquisition is different and has a unique impact on the firm. In fact, CAR allows calculating
the response to unexpected news, which is a disadvantage. But it is also a precise measure of
how the shareholder is surprised by news of M&A. Due to this reason three models have been
tested with only one company included each time. In model 1 Kering is included, in model 2
LVMH and in model 3 Richemont.
The robustness check shows significant changes especially in terms of coefficient. In this
respect, Datta & Puia (1995) attest to the negative effect of international M&As. Table 7 shows
their insignificance and negative impact on the CAR in each of the three reported cases.
An important index analysed is the ROE, whose positivity is neatly in contradiction with
the theories of Beccalli & Frantz (2009). The table shows positive results only in the case of
Kering. The luxury giants LVMH and Richemont indicate, instead, negative performances, in
spite of a high ROE.
Positive outcomes are evidenced by the leverage effect, which shows a return on
investment higher than the cost of corporate debt, resulting in higher profitability.
As for the control variables, there is a trend analogy with the regression of section 4.3,
since the target status is positive in all three models.
Finally, the latest figure analysed is that of the increasingly important figure held by the
creative director, which should generate greater profitability. If this is true for Kering and
LVMH, it is not the same for Richemont. Despite the insignificance of the results, this
phenomenon could be attributable to the sector of interest of the companies themselves, focused
more on clothing in the case of LVMH and Kering and on watches and jewelry in the case of
Richemont.
The Anova measures the discriminatory power of the analysis. If the Anova is not significant,
the model as a whole is unreliable and therefore the R-square, the explanatory power is not
reliable. For model 1, the F-value is 0.977 and the p-value is 0.495 therefore the discriminatory
power is too low and the R-square 0.369 is unreliable. For model 2, the F-value is 0.476 and

39
the p-value is 0.899 therefore the discriminatory power is too low and the R-square 0.070 is
unreliable. For model 3, the F-value is 1.312 and the p-value is 0.324 therefore the
discriminatory power is too low and the R-square 0.522 is unreliable.
The creative director variable is based on a split before and after 2013. This implies that the
creative director variable is a time oriented variable. If this study were to include all available
time dummies, there would be multicollineairity between the creative director and time
variables. In this thesis the creative director variable is one of the main variables, therefore
including all time dummies is no option. But, to control for the crisis effect, the time variables
during the crisis period from 2007 till 2011 are included. Therefore, the multicollineairity
between the creative director and time variable is limited and both the creative director and
controls for the crisis could be included in the analysis.

40
Table 7: Robustness Test 1 Table 7 shows the results for three regression models concerning the merger and acquisition performance in the period between 2000 and 2019.
It is important to specify that in all three models the dependent variable is 11 days CAR of the acquiring companies around the date of M&A
announcement. Model 1 is focused on the company Kering, model 2 LVMH and model 3 Richemont. The measures and indices adopted are:
(1) CAR (-5, +5): the Cumulative Abnormal Return or CAR of the acquiring firms after the 120-days estimation period is calculated using the
market model according to Mackinlay (1997). (2) TargetNationality: a dummy variable that can assume value ‘1’ if the target enterprise is
situated outside of France or Switzerland and ‘0’ otherwise. (3) ROE: the EBITDA divided between the shareholders’ equity of the acquiring
companies. (4) TargetStatus: a dummy variable of ‘1’ if the target status is private and ‘0’ otherwise. (5) Ln(leverage): this measure is the
natural logarithm of total liabilities divided by total assets. (6) CreativeDirector: value equal to ‘1’ if the announcement date of M&A occurs
in 2013 and after this date. It should also be noted that: (*) The single star in the coefficient indicates the significance at the level of 10%; (**):
the double star in the coefficient indicates the significance at the level of 5%; (***): the triple star in the coefficient indicates the significance
at the level of 1%. The values in parentheses are the standard errors.
CAR (-5,+5) 1 2 3 Constant 0.030 0.008 0.006 (0.024) (0.010) (0.043) TargetNationality -0.008 -0.002 -0.033 (0.013) (0.007) (0.022) ROE 0.032 -0.002 -0.026 (0.023) (0.013) (0.030) TargetStatus 0.006 0.000 0.009 (0.009) (0.007) (0.020) Ln(Leverage) 0.022 0.007 0.015 (0.036) (0.015) (0.021) CreativeDirector 0.000 0.009 -0.030 (0.011) (0.009) (0.014) Adjusted R-Square -0.009 -0.077 0.124 R-Square 0.369 0.070 0.522 F Value 0.977 0.476 1.312 Observations 25 74 23 Year Fixed Effect Yes Yes Yes 2007 -0.021 -0.020 -0.069 (0.054) 0.024 0.052 2008 0.082 0.014 -0.077 (0.054) 0.026 0.038 2009 -0.010 0.069 0.046 0.056 2010 0.011 0.008 -0.016 (0.039) (0.027) 0.056 2011 0.030 -0.011 -0.038 (0.026) (0.024) 0.055

41
The Anova measures the discriminatory power of the analysis. If the Anova is not significant,
the model as a whole is unreliable and therefore the R-square, the explanatory power is not
reliable. The F-value is 1,508 and the p-value is 0.120 therefore the discriminatory is too low
and the R-square 0.056 is unreliable. This implies, that only 5.6% can explain the change of
CAR.
In many studies, the event window (-1, +1) is used, in this thesis, looking at CAAR plot (-5,
+5) was most close to significance with a generalized Z value of 1.730, compared to window
(-1, +1) with a generalized Z value 1.418, therefore event window (-5, +5) was chosen because
it had a higher value for the significance test. However, because the event window (1, + 1) is
most commonly used in many studies such as that of Anrade et al. (2001) and Moeller and
Schlingemann (2005), this event window has been added to the Robustness test.
The main differences, which are the only variables that are significant, between CAR (-5, +5)
and CAR (-1, +1) will be pointed out below.
First, TargetNationality is negatively significant. This means that there is a 0.6% lower
CAR for foreign acquisitions. So, outside of Switzerland and France.
Second, rreative director is significant, this means that in the event window (-1, +1) it
matters whether the merge and or acquisition took place before or after 2013. This implies that
CAR before 2013 is on average 0.9% lower than after 2013. This means that the influence of
the creative director on the event window (-1, +1) is 0.9% on the CAR. This gives evidence for
hypothesis 2a.
Lastly, Firm size is significant, but has an increased multicolinearity because the
conglomerates differ significantly with respect to their size. There could be a significant overlap
between the size of the company and the firm dummy.

42
Table 8: Robustness Test 2 Table 8 shows the results for the regression model concerning the merger and acquisition performance in the period between 2000 and 2019.
It is important to specify that the dependent variable is 3 days CAR of the acquiring companies around the date of M&A announcement. The
measures and indices adopted are: (1) CAR (-1, +1): the Cumulative Abnormal Return or CAR of the acquiring firms after the 120-days
estimation period is calculated using the market model according to MacKinlay (1997). (2) TargetNationality: a dummy variable that can
assume value ‘1’ if the target enterprise is situated outside of France or Switzerland and ‘0’ otherwise. (3) ROE: the EBITDA divided between
the shareholders’ equity of the acquiring companies. (4) TargetStatus: a dummy variable of ‘1’ if the target status is private and ‘0’ otherwise.
(5) Ln(FirmSize): this measure is equal to the natural logarithm of total assets. (6) Ln(leverage): this measure is the natural logarithm of total
liabilities divided by total assets. (7) CreativeDirector: value equal to ‘1’ if the announcement date of M&A occurs in 2013 and after this date.
(8) ROE*TargetNationality: given by multiplying ROE by TargetNationality as interaction term. It should also be noted that: (*) The single
star in the coefficient indicates the significance at the level of 10%; (**): the double star in the coefficient indicates the significance at the level
of 5%; (***): the triple star in the coefficient indicates the significance at the level of 1%. The values in parentheses are the standard errors.
CAR (-1,+1) 4 Constant -0.021 (0.012) TargetNationality -0.006** (0.003) ROE 0.006 (0.005) TargetStatus 0.002 (0.003) Ln(FirmSize) -0.014*** (0.005) Ln(Leverage) -0.007 (0.005) CreativeDirector 0.009** (0.004) ROE*TargetNationality -0.003 (0.002) Adjusted R-Square 0.056 R Square 0.165 F Value 1.508 Observations 122 Year Fixed Effect Yes 2007 -0.005 (0.009) 2008 0.013 (0.010) 2009 0.035** (0.017) 2010 -0.002 (0.010) 2011 0.017 (0.009) Firm Fixed Effect Yes

43
5 Conclusion and Limitations
This thesis aims to be innovative from the point of view of the impact that merger and
acquisition announcements can have on the value creation for the shareholders. In particular,
the key concept that guided the whole thesis is focused on the perception of the acquiring
shareholders during a merger and acquisition and how the creative director influences the post-
merger integration in the short term. Several researchers in the past have focused their attention
on the generic effects of M&A operations (Alexandridis et al., 2010). Others, such as Beccalli
& Frantz (2009) have conducted more specific studies about the matter. Still, since mergers
and acquisitions undertaken in the last few years by the three major luxury industry giants have
become a global example (Deloitte, 2019), researchers have deepened the luxury in its true term
(Ko et al., 2019; Hurt, 2007) and in reference to marketing (Vickers & Renand, 2003; Phau &
Prendergast, 2000). Even more recently, academics such as Jacobs et al. (2016) have considered
the impact that leading figures such as creative director can have in creating value for luxury
companies.
Therefore, the innovation of this work consists in the idea of merging all the aspects
mentioned above, in order to evaluate the impact of M&A operations in a complete and
exhaustive way. For this purpose, a sample of 122 transactions over a period of 20 years since
2000 has been selected. The analytical approach used in the evaluation of data is a scientific-
statistical one, based on an event study method. In addition, independent and control variables
have been set up in order to verify their effect on abnormal stock return by means of multiple
linear regressions. After that, focusing on the announcement date of a M&A, an 11-day event
window (-5,+5) has been taken as reference. This allowed an estimate to be made of the
abnormal return of the purchasing companies around the same pronouncement date. In detail,
it was decided to assess a market model over a projected period of 120 days to predict abnormal
returns. The following hypotheses have been examined:
Hypothesis 1: in the, up to, twenty days preceding and following its announcement, M&A has
a positive impact on the value's creation for the acquirers' shareholders in the personal luxury
goods industry.
The results obtained allow some conclusions on the various hypotheses. Above all, the first
hypothesis is not acceptable. This is demonstrated by the fact that the acquisitions made in the
luxury market, despite being advantageous, do not produce significant positive effects on the

44
CAR of the acquiring shareholders. In particular, this is verified around the date of a merger
and acquisition announcement and in the following twenty days.
Hypothesis 2a: Since 2013, creative directors have been judged more by their performance and
shareholders will respond more positively to announcement of M&A deals in the luxury goods
industry.
Regarding the upcoming importance of the role as a creative director, this study reveals that the
creative director was positively correlated with the acquiring shareholders’ value. Although, it
was not significant in CAR (-5, +5), in CAR (-1, +1) the variable CreativeDirector is positive
significant. So, there is statistical evidence that acquiring shareholders react differently after
2013 when the creative director played a more important role than before 2013. Therefore, the
second hypothesis is rejected with CAR (-5, +5) and accepted with CAR (-1, +1).
Hypothesis 2b: Since 2013, the growth of the three luxury goods conglomerates increases with
the visibility of the creative director.
Interesting is the verified correlation between sales and creative director. In particular, it has
been demonstrated that the accurate choice of directors has a statistical and significant influence
on the company growth. The positive results obtained are fully in accord with Winser’s (2013)
statements and underline that the more the creative director becomes master of the brand’s
protocol, the more the company can benefit. An example of this is Olivier Rousteing, creative
director of Balmain, who carries out many tasks embracing the entire brand’s concept. The
results obtained make the third hypothesis acceptable.
The samples selected over the period 2000 to 2019 allow drawing some conclusions. Firstly, it
is demonstrated that the status of the company has no influence on two important elements:
M&As announcements and value creation for acquiring shareholders. However, the same
cannot be said for the variable creative director, whose role impacts greatly on the company
growth and on the value creation itself. Moreover, the effects of merger and acquisition
announcements in French and Swiss dominant luxury markets have been investigated.
The added value of this thesis is the use of the recent research data, attributable to the last ten -
years. In a world economic context in continuous evolution and where globalization reigns,

45
focusing on current information and analysing it in the light of past trends, allows to obtain a
precious knowledge on modern luxury markets and their future development. This will enable
the companies concerned to take strategic further actions.
As regards the limitations found in this thesis, they begin already at the root of the hypotheses
advanced. An event study, in fact, is based on M&A announcements made within a time frame
search that is strongly affected by the influence of stock market trends and other factors. This
is why it is proposed to use a substitute parameter, such as the acquisition premium, to measure
the effects of mergers and acquisitions.
A further limitation is constituted from the same data that allow disposing of only a
limited number of variables. One solution could be to replace the business dimension with its
relative size or market capitalisation. In addition, the data problem imposes the verification of
measures on the totality of sales and activities. Lastly, the detailed analysis of the influence of
the creative director, especially beginning from 2013, does not offer precise results as when
using the exact turnover date of the assignment for this role.
The improvements proposed for future research in the study of the impact that merger and
acquisition announcements can have on the value creation for the shareholders are set out
below. First, M&A operations should be optimised to include business governance procedures
such as shareholders’ security and ownership structure. In a constantly evolving and expanding
luxury economic market, it is profitable to improve the merger and acquisition actions to be
undertaken. As a sample of this, only in 2017 the luxury sector made €1.2 trillion, showing an
increase of 5%. As attested by Bain & Company, in the same year the luxury goods for personal
use amounted to €262 billion. Moreover, in 2019 LVMH increased its revenues by 13%, billing
€42.6 billion. These record values lead to even more optimistic forecasts. From the data
analysed emerges that in the next three years this market segment will increase of an ulterior
5% approximately, carrying to invoice €305 billion for luxury goods to personal use. But due
to the conditions created by the Corona virus, these forecasts could be different, since Chinese
customers constitute a large group in the luxury goods industry. And they need at least one year
to recover. Although, according to Hodgson (2018) deals across Asia and USA are just a small
percentage of all the deals that takes place. Therefore, there are interesting acquisitions
proposals for all the corporate giants who intend to grow in the luxury market. Second, in the
next research the event study could be complemented with an analysis of CAAR with
accounting performance and an analysis of long-term AR.
46
References
Admati, A. R., Demarzo, P. M., Hellwig, M. F., & Pfleiderer, P. (2017). The Leverage Ratchet
Effect. The Journal of Finance, 73(1), 145–198.
Ashan, A. F. M. (2012). Can ROE Be Used To Predict Portfolio Performance? Journal of
Economics, Management and Financial Markets, (2), 132–148.
Ait-Sahalia, Y., Parker, J. A., & Yogo, M. (2004). Luxury Goods and the Equity Premium. The
Journal of Finance, 59(6), 2959–3004.
Alexandridis, G., Petmezas, D., & Travlos, N. G. (2010). Gains from Mergers and Acquisitions
Around the World: New Evidence. Financial Management, 39(4), 1671–1695.
Andrade, G., Mitchell, M., & Stafford, E. (2001). New Evidence and Perspectives on
Mergers. Journal of Economic Perspectives, 15(2), 103–120.
Barber, B.M., & Lyon, J. D. (1997). Detecting abnormal operating performance: The empirical
power and specification of test statistics. Journal of Financial Economics, 41(3), 359–399.
Beccalli, E., & Frantz, P. (2009). M&A Operations and Performance in Banking. Journal of
Financial Services Research, 36(203), 203-226.
Ben-Amar, W., Francoeur, C., Hafsi, T., & Labelle, R. (2011). What Makes Better Boards? A
Closer Look at Diversity and Ownership. British Journal of Management, 24(1), 85–101.
Berry, S. T. (1994). Estimating Discrete-Choice Models of Product Differentiation. The RAND
Journal of Economics, 25(2), 242.
Berry, C.J., (1994). The Idea of Luxury. Cambridge: Cambridge University Press.
Blazenko, G. W. (1987). Managerial Preference, Asymmetric Information, and Financial
Structure. The Journal of Finance, 42(4), 839–862.
47
Boehmer, E., Masumeci, J., & Poulsen, A.B., (1991). Event-study methodology under
conditions of event-induced variance. Journal of Financial Economics, 30(2), 253–272.
Business of Fashion. (2016, 8 February). The Risks of Changing Creative Directors. Retrieved
from https://www.businessoffashion.com/articles/bof-comment/in-fashion-the-risks-of-
changing-the-guard
Bruner, R. F. (2002). Does M&A Pay? A Survey of Evidence for the Decision-Maker. From
https://www.researchgate.net/profile/Robert_Bruner/publication/228225776_Does_MA_Pay_
A_Survey_of_Evidence_for_the_Decision-maker/links/0c960530ab40055438000000/Does-
M-A-Pay-A-Survey-of-Evidence-for-the-Decision-maker.pdf
Campbell, Y., Lo, W., & Mackinlay, C. (1997). The econometrics of financial markets.
Princeton, New Jersey: Princeton University Press.
Capron, L. (2007). Acquisitions of Private vs. Public Firms: Private Information, Target
Selection, and Acquirer Returns. Strategic Management Journal, 28(9), 891-911.
Cartwright, S., & Schoenberg, R. (2006). Thirty Years of Mergers and Acquisitions Research:
Recent Advances and Future Opportunities. British Journal of Management, 17(S1), S1–S5.
Cavender, R., & H. Kincade, D. (2014). Management of a luxury brand: dimensions and sub-
variables from a case study of LVMH. Journal of Fashion Marketing and Management: An
International Journal, 18(2), 231–248.
Chaffin, J., & Gray, A. (2019, 4 september). Tapestry chairman Jide Zeitlin to replace chief
Victor Luis. Financial Times. Retrieved from https://www.ft.com
Chevalier, M., & Mazzalovo, G. (2008). Luxury Brand Management: A World of
Privilege (1ste editie). Hoboken, NJ, United States: Wiley.
Das, S.P., & Donnenfeld, S. (1989). Oligopolistic competition and international trade: Quantity
and quality restrictions. Journal of International Economics, 27(3), 299-318.

48
Datta, D. K., & Puia, G. (1995). Cross-Border Acquisitions: An Examination of the Influence
of Relatedness and Cultural Fit on Shareholder Value Creation in U.S. Acquiring Firms.
Management International Review, 35(4), 337–359.
Day, G. S. (1997). Strategies for surviving a shakeout. Harvard Business Review, 75(2), 92-
100.
Del Giudice, M., & Maggioni, V. (2014). Managerial practices and operative directions of
knowledge management within inter-firm networks: a global view. Journal of Knowledge
Management, 18(5), 841–846.
Deloitte. (2019). Global Powers of Luxury Goods 2019. From
https://www2.deloitte.com/content/dam/Deloitte/ar/Documents/Consumer_and_Industrial_Pr
oducts/Global-Powers-of-Luxury-Goods-abril-2019.pdf
Dodd, P., & Warner, J. B. (1983). On corporate governance. Journal of Financial
Economics, 11(1–4), 401–438.
Donzé, P.Y. (2017). The Birth of Luxury Big Business: LVMH, Richemont and Kering. Global
Luxury, 19–38.
Dubois, B., & Laurent, G. (1998). The New Age of Luxury Living. Financial Times Mastering
Management Review, 32–35.
Dubois, Bernard, Czellar, S., & Laurent, G. (2005). Consumer Segments Based on Attitudes
Toward Luxury: Empirical Evidence from Twenty Countries. Marketing Letters, 16(2), 115–
128.
Dutta, S., & Jog, V. (2009). The long-term performance of acquiring firms: A re-examination
of an anomaly. Journal of Banking & Finance, 33(8), 1400–1412.
Draper, P., & Paudyal, K. (2006). Acquisitions: Private versus Public. European Financial
Management, 12(1), 57–80.

49
Eckbo, B. E., Giammarino, R. M., & Heinkel, R. L. (1990). Asymmetric Information and the
Medium of Exchange in Takeovers: Theory and Tests. Review of Financial Studies, 3(4), 651–
675.
Feito-Ruiz, I., & Menéndez-Requejo, S. (2011). Cross-border Mergers and Acquisitions in
different legal environments. International Review of Law and Economics, 31(3), 169–187.
Fionda, A. M., & Moore, C. M. (2009). The anatomy of the luxury fashion brand. Journal of
Brand Management, 16(5–6), 347–363.
Forbes. (2017, 26 December). This Is Why Companies Make Acquisitions. Retrieved from
https://www.forbes.com/sites/richardkestenbaum/2017/12/26/this-is-why-companies-make-
acquisitions/#202fe50637a4
Fuller, K., Netter, J., & Stegemoller, M. (2002). What Do Returns to Acquiring Firms Tell Us?
Evidence from Firms That Make Many Acquisitions. The Journal of Finance, 57(4), 1763–
1793.
Halpern, P. (1983). Corporate Acquisitions: A Theory of Special Cases? A Review of Event
Studies Applied to Acquisitions. The Journal of Finance, 38(2), 297.
Hill, C.W.L., & Jones, T.M. (1992). Stakeholder-agency theory. Journal of Management
Studies, 29(2), 131-154.
Hodgson, L. (2018, 29 November). European luxury fashion M&A is in style. Retrieved from
https://pitchbook.com/news/articles/european-luxury-fashion-ma-is-in-style
Hosken, D., & Simpson, J. D. (2001). Have Supermarket Mergers Raised Prices? An Event
Study Analysis. International Journal of the Economics of Business, 8(3), 329–342.
Hurt, H. (2007, 18 August). Luxury, and How It Became Common. Retrieved from
https://www.nytimes.com/2007/08/19/business/yourmoney/19shelf.html

50
Jacobs, S., Cambré, B., Huysentruyt, M., & Schramme, A. (2016). Unraveling Belgian fashion
designers’ high perceived success: A set-theoretic approach. Journal of Business Research,
69(4), 1407–1411.
Jensen, C. (1986). Agency Costs of Free Cash Flow, Corporate Finance, and Takeovers. The
American Economic Review, 76(2), 323–329.
Kapferer, Jean-Noël. (1998). ‘Why Are We Seduced by Luxury Brands?’ Journal of Brand
Management 6(1), 44–49.
Kapferer, J. N., & Bastien, V. (2012). The Luxury Strategy. United States: Kogan Page.
Kasznik, R., & McNichols, M. F. (2002). Does Meeting Earnings Expectations Matter?
Evidence from Analyst Forecast Revisions and Share Prices. Journal of Accounting Research,
40(3), 727–759.
Kering. (2019). Financial Document 2018. Retrieved from
https://keringcorporate.dam.kering.com/m/5950e4d285ac1f9a/original/2019-Financial-
Document.pdf
Ko, E., Costello, J. P., & Taylor, C. R. (2019). What is a luxury brand? A new definition and
review of the literature. Journal of Business Research, 99(6), 405–413.
Konigs, A., & Schiereck, D. (2006). Wealth creation by M&A activities in the luxury goods
industry (7). From https://researchgate.net
Konigs, A., & Schiereck, D. (2008). Combined in Luxury: M&A Announcement Effects and
Capital Market Integration in Europe. Journal of Mergers & Acquisitions, 5(1), 30-56.
Lane, V., & Jacobson, R. (1995). Stock Market Reactions to Brand Extension Announcements:
The Effects of Brand Attitude and Familiarity. Journal of Marketing, 59(1), 63–77.
Lee Yohn, D. (2013, 9 July). Why Are So Many Celebrities Now ‘Creative Directors’? Harvard
Business Review. Retrieved from https://hbr.org

51
Locarno, F. (2016). The luxury consolidation jungle: large group affiliated brands versus
independent players (kings of the jungle vs code breakers). From https://tesi.luiss.it/18314/
LVMH. (2019). Annual Report 2018. Retrieved from https://www.lvmh.com/news-
documents/news/lvmh-publishes-2018-annual-report/
MacKinlay, A. C. (1997). Event Studies in Economics and Finance. Journal of Economic
Literature, 35(1), 13–39.
Martynova, M., & Renneboog, L. (2008). A century of corporate takeovers: What have we
learned and where do we stand? Journal of Banking & Finance, 32(10), 2148–2177.
Moeller, S. B., Schlingemann, F. P., & Stulz, R. M. (2004). Firm size and the gains from
acquisitions. Journal of Financial Economics, 73(2), 201–228.
Moeller, S. B., Schlingemann, F. P., & Stulz, R. M. (2005). Wealth Destruction on a Massive
Scale? A Study of Acquiring-Firm Returns in the Recent Merger Wave. The Journal of
Finance, 60(2), 757–782.
Mikkelson, W. H., & Partch, M. M. (1986). Valuation effects of security offerings and the
issuance process. Journal of Financial Economics, 15, 31–60.
Myers, S., & Majluf, N. (1984). Corporate Financing and Investment Decisions When Firms
Have Information That Investors Do Not Have. Journal of Financial Economics.
Mondalek, B. A. (2019, 14 November). What luxury fashion brands want in a creative director.
Retrieved from https://www.voguebusiness.com/talent/articles/luxury-fashion-brands-
creative-director-balmain-louis-vuitton-virgil-abloh/
Pervan, M., Višić, J., & Barnjak, K. (2015). The Impact of M&A on Company Performance:
Evidence from Croatia. Procedia Economics and Finance, 23, 1451–1456.
Phau, I., & Prendergast, G. (2000). Consuming luxury brands: The relevance of the ‘Rarity
Principle’. Journal of Brand Management, 8(2), 122–138.
52
Ribonnet, B., & Coeurderoy, R. (2015). Analyse des strategies de F&A et de leur impact sur la
performance financiere et l’innovation: etude de cas des Big Pharma entre 2004 et 2013.
Retrieved from
https://scholar.google.nl/scholar?hl=nl&as_sdt=0%2C5&as_vis=1&q=ribonnet+2015&btnG=
Richemont. (2019). Annual Report and Accounts 2019. Retrieved from
https://www.richemont.com/investor-relations/reports.html
Rosenstein, S., & Wyatt, J. G. (1997). Inside directors, board effectiveness, and shareholder
wealth. Journal of Financial Economics, 44(2), 229–250.
Shepherd, D. A., Wiklund, J. & Patzelt, H. (2009). Building an integrative model of small
business growth. Small Business Economics, 32(4), 351–374.
Staw, B. M., & Ross, J. (1978). Commitment to a Policy Decision: A Multi-Theoretical
Perspective. Administrative Science Quarterly, 23(1), 40-64
Stevens, J. P. (1984). Outliers and influential data points in regression analysis. Psychological
Bulletin, 95(2), 334–344.
Sudarsanam, S., Holl, P., & Salami, A. (1996). Shareholder wealth gains in mergers: effect of
synergy and ownership structure. Journal of Business Finance & Accounting, 23(5–6), 673–
698.
Tuch, C., & O’Sullivan, N. (2007). The impact of acquisitions on firm performance: A review
of the evidence. International Journal of Management Reviews, 9(2), 141–170.
Van der Ploeg, A. J., & Lee, S.-E. (2018). The role of the creative director in sustaining the
luxury brand. Fashion, Style & Popular Culture, 5(3), 343–358.
Vickers, J. S., & Renand, F. (2003). The Marketing of Luxury Goods: An exploratory study –
three conceptual dimensions. The Marketing Review, 3(4), 459–478.
53
Wang, D., & Moini, H. (2012). Motives for Cross-border Mergers and Acquisitions. From
https://pdfs.semanticscholar.org/b7de/17758d2438cc4fc2b44548df080802c2ba25.pdf
WHO. (2020, 3 maart). WHO: ontwikkeling vaccin tegen coronavirus duurt lang. Retrieved
from
https://www.vereniginginnovatievegeneesmiddelen.nl/nieuwsberichten/2020/03/website/who-
ontwikkeling-vaccin-tegen-coronavirus-duurt-lang
Winser, K. (2013, 9 July). Why Do Luxury Brands Need High Profile Creative
Directors? Retrieved from https://www.forbes.com/sites/kimwinser/2013/07/09/why-do-
luxury-brands-need-high-profile-creative-directors/#7359f6333a48
Wong, N. Y. & . Ahuvia, A.C.. (1998). Personal Taste and Family Face: Luxury Consumption
in Confucian and Western Societies, Psychology & Marketing 15(5), 423–441

54
Appendix A: AAR significance test
Grouping Variable/N AAR value AAR cumulative N Csect T Generalized Rank Z
AAR(-20) -0,001 -0,001 126,000 -0,963 0,072
AAR(-19) -0,001 -0,002 129,000 -1,231 -0,705
AAR(-18) -0,002 -0,004 133,000 -1,717 -1,065
AAR(-17) 0,001 -0,003 133,000 0,430 0,000
AAR(-16) 0,001 -0,002 133,000 1,150 0,369
AAR(-15) 0,000 -0,002 133,000 -0,345 0,223
AAR(-14) 0,000 -0,002 133,000 0,265 0,169
AAR(-13) -0,002 -0,004 133,000 -1,874 -1,365
AAR(-12) -0,001 -0,005 133,000 -0,472 -0,221
AAR(-11) 0,000 -0,005 133,000 -0,190 1,045
AAR(-10) 0,001 -0,004 133,000 0,640 -0,390
AAR(-9) -0,001 -0,006 133,000 -1,309 -1,261
AAR(-8) -0,002 -0,008 133,000 -2,115 -1,621
AAR(-7) -0,001 -0,009 133,000 -1,233 -1,627
AAR(-6) -0,001 -0,010 133,000 -0,537 -0,978
AAR(-5) 0,000 -0,010 133,000 -0,078 0,303
AAR(-4) 0,001 -0,009 133,000 0,847 0,708
AAR(-3) 0,001 -0,009 133,000 0,430 0,685
AAR(-2) 0,000 -0,009 133,000 0,283 -0,164
AAR(-1) 0,001 -0,008 133,000 0,571 0,333
AAR(0) 0,002 -0,006 133,000 1,334 1,010
AAR(1) 0,002 -0,004 133,000 1,603 1,001
AAR(2) -0,002 -0,006 133,000 -1,099 -1,393
AAR(3) 0,000 -0,006 133,000 -0,003 0,227
AAR(4) 0,000 -0,005 133,000 0,088 -0,700
AAR(5) 0,001 -0,005 133,000 0,408 0,017
AAR(6) -0,003 -0,008 133,000 -2,295 -2,572
AAR(7) 0,001 -0,007 133,000 0,576 0,276
AAR(8) -0,001 -0,008 133,000 -0,559 -0,206
AAR(9) 0,000 -0,008 133,000 0,096 -0,700
AAR(10) -0,003 -0,011 133,000 -3,122 -2,098
AAR(11) -0,001 -0,012 133,000 -1,602 -1,931
AAR(12)
-0,012 133,000 0,000 -0,079
AAR(13) 0,002 -0,011 133,000 1,418 0,844
AAR(14) 0,000 -0,011 133,000 0,079 -0,209
AAR(15) 0,000 -0,010 133,000 0,094 0,040
AAR(16) 0,001 -0,010 133,000 0,435 -0,474
AAR(17) -0,001 -0,011 133,000 -1,351 -1,274
AAR(18) 0,000 -0,011 131,000 0,180 0,921
AAR(19) -0,001 -0,012 125,000 -0,866 -0,521
AAR(20) 0,000 -0,012 121,000 0,091 2,433
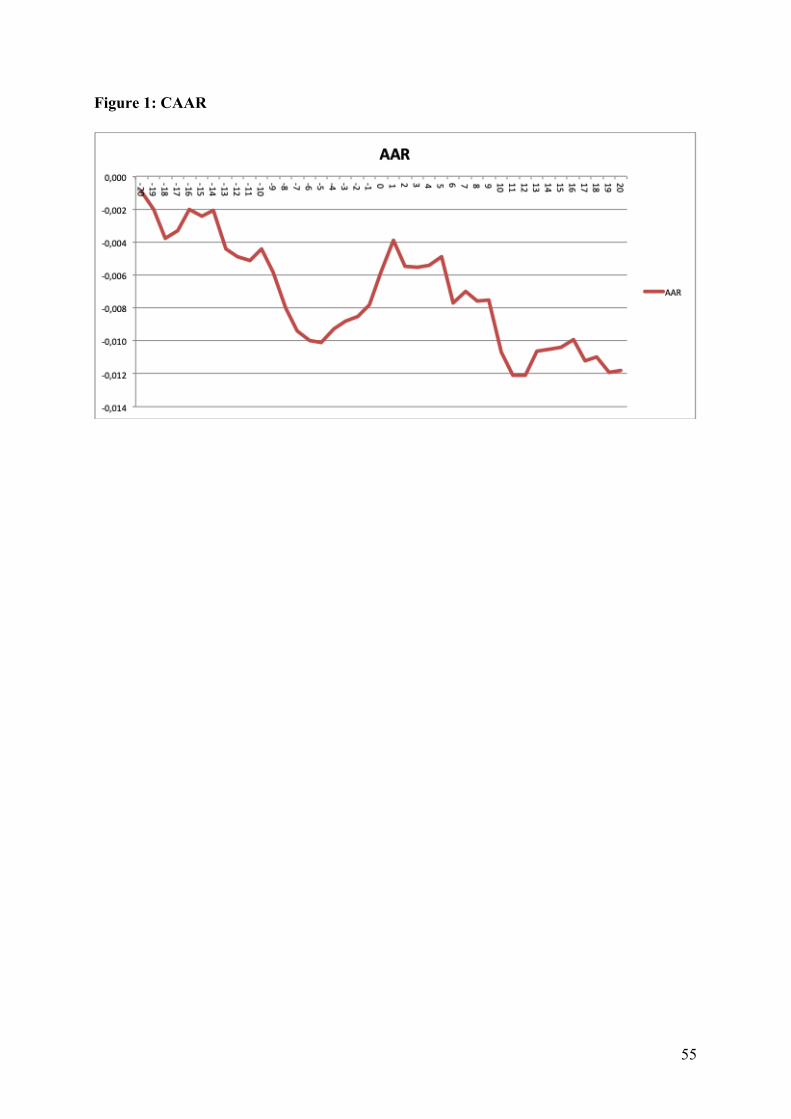
55
Figure 1: CAAR

56
Appendix B: CAAR significance test
CAAR Type CAAR Value Precision Weighted
CAAR Value
Number of CARs
considered Csect T Generalized Rank Z
(-20, 20) -0.011 -0.010 118 -1.543 0.430
(-10, 10) -0.005 -0.004 125 -0.972 -0.020
(-10, 1) 0.000 0.000 133 0.063 -0.055
(-10, 0) -0.001 -0.001 133 -0.356 -0.659
(-5, 5) 0.006 0.005 130 1.449 1.730
(-2, 2) 0.003 0.003 133 1.119 0.484
(-1, 1) 0.004 0.004 133 1.762 1.418

57
Appendix C: Normal Distribution
1. CAR (-5,+5)
2. Ln(Sales)