Embed Size (px)
Citation preview
�
Mergers, Acquisitions and Export Competitive-ness: Experience of Indian Manufacturing Sector
Mishra Pulak, Jaiswal NehaAbstractIn the context of economic reforms in general and subsequent wave of M&A in particular, this paper attempts to examine the impact of M&A on the export competitiveness of firms in the Indian manufacturing sector. By using a panel dataset of 33 industries from the period of 2000-01 to 2007-08, it is found that, the wave of M&A has enhanced the export competitive-ness of firms. The industries with larger number of M&A have greater penetration in the inter-national market. The other factors that have significantly contributed to export competitive-ness include the presence of MNCs and import of foreign technology. Export competiveness is higher in the industries that have larger presence of MNCs and greater foreign technology purchase intensity. On the other hand, industries with higher capital intensity or greater selling efforts by firms have limited penetration in the international market. However, this paper did not find any significant influence of market concentration, competition from imports, in-house efforts, or profitability on export competitiveness of firms. Therefore, the findings from this paper have important policy implications in relation to the regulation of M&A and entry of MNCs as well as the import of capital goods.
Key words: Mergers and acquisitions, export competitiveness, reforms, competition, India.
1. INTRODUCTIONThe process of economic reforms initiated since 1991 in general and changes in industry, in-vestment and competition related policies in particular have resulted in a significant increase in the number of mergers and acquisitions (M&A)1 in Indian corporate sector (Chandrasekhar, 1999; Basant, 2000; Beena, 2000; Kumar, 2000; Mantravadi and Reddy, 2008). Under the new business conditions, the domestic firms have taken the route of M&A to restructure their busi-ness and grow, whereas the foreign firms have used the same to enter into and raise control in Indian industry sector (Basant, 2000). In addition, many of the M&A have also been driven by the motives of diversification of product/service portfolio, consolidation of shareholding, financial and tax consideration (Venkiteswaran, 1997), and overcoming the shortage of human capital (Roy, 1999). The wave of M&A in Indian corpoate sector, particularly during the 1990s has led to introduc-tion of a number strict provisions relating to regulation of M&A under the Competition Act 2002. The Act regulates different forms of business combinations like mergers and acquisi-tions through the Competition Commission of India to ensure that such a business combina-
1 Although mergers and acquisitions are different in definitions and the statutory procedures, their effects from an economic perspective are the same as in both the cases the control of one company passes on to another. As a result, in the present paper, no distinction is made between the mergers and the acquisitions.
Vol. 4, Issue 1, pp. 3-19, March 2012 ISSN 1804-171X (Print), ISSN 1804-1728 (On-line), DOI: 10.7441/joc.2012.01.01
Journal of Competitiveness
joc_1-2012_v3doi.indd 3 17.4.2012 10:56:01
Journal of Competitiveness �
tion does not cause adverse impact on competition in the relevant market2. But, while the mo-nopoly theory postulates that the firms use the route M&A to raise their market power (Steiner, 1975, Chatterjee, 1986), according to the efficiency theory, M&A are planned and executed to reduce costs by achieving scale economies (Porter, 1985; Shelton, 1988)3 . This means that, in addition to increase in market power, integration of two or more firms into a single entity may also enhance productive efficiency through a better allocation of resources leading to lower prices and hence greater allocative efficiency. Besides, M&A can result in greater innovative efforts and dynamic efficiency of the firms4, whereas integration with the MNCs in particular is likely result in technology spillovers, and managerial competencies.Hence, designing a comprehensive policy framework for M&A requires examining the impact of these strategies on competitiveness in addition to understanding their impact on market concentration5. Although some of the existing studies (e.g., Basant and Morris; Mishra, 2005; Mishra and Behera, 2007) in Indian context have explored the state of market competition in general and impact of M&A on market concentration in particular, examining the impact on competitiveness has remained largely unexplored. The present paper attempts to fill in this gap. The objective of the present paper is to examine the impact of M&A on competitiveness of the firms. The rest of the paper is divided into five sections. The second section deals with the theoretical model. The methodology applied and the sources of data are given in the third section. The regressions results are presented in the fourth section. The fifth section discusses the regression results, whereas the sixth section concludes the paper.
2. TheOReTICal MODel Of COMpeTITIveNess2.1 Specification of the ModelThe paper attempts to examine impact of M&A on competitiveness as the industries differ substantially in their technology base (Dosi, 1988), and the relation between technology related variables such as R&D and economies of scale and exports are likely to vary across industries (Wagner, 2001). Although there are several indicators such as profitability of the domestic firms in the industry, trade balance in the industry, balance of outbound and inbound foreign direct investment, cost and quality, etc. to measure competitiveness at the industry level, in the present paper it is assessed in terms of firms’ performance in the international marketplace. The functional model is specified by using the generalized structure-conduct-performance-policy framework based on Scherer and Ross (1990)�. It is assumed that export competitiveness (EXP) of the firms in an industry is determined by the degree of sellers’ concentration (CON), competition from imports (IMP), presence of the MNCs (MNC), capital intensity (CI), in-
2 For the details, see “Provisions Relating to Combination”, Competition Act 2002 Advocacy Series �, Com-petition Commission of India, March 2011.3 These scale economies may arise at the plant level (Pratten, 1971) or as a result of operating several firms within one firm (Scherer et al., 1975). In either case, MAs bring together firms, which individually fall short of the minimum efficient scale.4 According to Levin (1990), the horizontal mergers that involve combinations of less than 50 percent of the market enhance efficiency.5 For example, understanding the impact of M&A on export competitiveness of a developing country like India is important as the exporting firms have higher survival rate and can achieve greater employment growth when compared with the non-exporters (Bernard and Jensen, 1999; Muuls and Pisu, 2007).� For a detail review of structure-conduct-performance-policy relationships, see Mishra and Behera (2007).
joc_1-2012_v3doi.indd 4 17.4.2012 10:56:01
�
house R&D efforts (R&D), purchase of foreign technology (FTPI), mergers and acquisitions (M&A), selling efforts (SELL)7 , and financial performance (PROF)8, i.e.,
),,&,,&,,,,( PROFSELLAMFTPIDRCIMNCIMPCONfEXP =
Here, market concentration, import competition, MNC participation, and capital intensity are expected to control structural aspects of the market, in-house R&D, technology imports, mergers and acquisitions, and selling efforts for conducts of the firms, and profitability for their performance. In addition, MNC and M&A can control for the impact of investment and competition related policies, whereas IMP is likely to proxy for changes in trade policies. Simi-larly, R&D and FTPI can capture effects of policy changes relating to innovation and foreign technology purchase.However, many the independent variables are likely to be influenced by export intensity as well bringing in the problem of endogeneity. For example, one may expect an inverse relationship between export intensity and market concentration (Chou, 198�). Similarly, export orienta-tion is expected to affect innovation of a firm favourably (Braga and Willmore, 1991; Kumar and Saqib, 199�; Kumar and Agarwal, 2000; Mishra, 2010). Export intensity can also have a positive impact on firms’ decisions relating to M&A (Mishra, 2011). Further, impact of many of the independent variables may not be instantaneous in nature. In order to control for such simultaneity bias and non-instantaneity in the specified relationships, a one-year lag is intro-duced in each of the independent variables. Hence, the above functional specification can be rewritten as,
),,&,,&,,,,( 1,1,1,1,1,1,1,1,1, −−−−−−−−−= tjtjtjtjtjtjtjtjtjjt PROFSELLAMFTPIDRCIMNCIMPCONfEXP
The Herfindahl-Hirschman Index (HHI) is the most widely used measure of market concen-tration in empirical research, and many of the existing studies in Indian context (e.g., Basant and Morris, 2000; Ramaswamy, 200�; Mishra and Behera, 2007; Mishra, 2008) have used this measure. However, the HHI is not a very accurate measure, particularly, in comparison with the alternative indices like the entropy index, the Ginevicius index or the GRS index (Mishra et al., 2011). Instead, the GRS index, suggested by Ginevicius and Cirba (2009), appears to be more accurate measure in Indian context (Mishra et al., 2011). Hence, the present paper uses both the HHI and the GRS index as alternative measures of market concentration to substanti-ate the findings.
2.2 Possible Impact of the Independent VariablesMarket Concentration (CON): On the one hand, greater degree of sellers’ concentration may allow the firms to exercise their monopoly power in the domestic market and thereby may cause X-inefficiency. On the other hand, in a concentrated market, the firms may have greater scope to reap the benefits of economies of scale. This may reduce the average cost of production of the firms and thereby may provide competitive edge in the international market. Lower concentration in the domestic market may also force the firms to innovate and improve, and thereby may improve their export competitiveness (Porter, 1990). In addition, greater market competition can result in better managerial practices, and greater scope to penetrate in
7 Here, selling efforts refer to advertising, marketing, and distribution related efforts by the firms.8 In the present paper, financial performance of the firms is measured in terms of their profitability.
joc_1-2012_v3doi.indd 5 17.4.2012 10:56:01

Journal of Competitiveness �
international market. The nature of impact depends on how these opposite forces empirically dominate each other. Import Intensity (IMP): Greater competition from imports is likely to enhance efficiency and hence export competitiveness. However, greater import intensity may strengthen the in-cumbents’ position in the domestic market and thereby may restrict entry of new firms into the industry. It may also force many of the smaller firms to leave the industry. As a result, com-petition in the domestic market may decline reducing the urge of the firms to be competitive. Hence, the nature of impact of import intensity on export competitiveness depends on which of the two diverse forces outweighs the other.Presence of MNC (MNC): Presence of the MNCs in an industry is expected raise its export competitiveness in a significant way as these enterprises enjoy certain benefits that are not generally available to many of the domestic firms. The MNCs have greater access to superior production technology and management know-how (Ramstetter, 1999). This helps these enter-prises to produce their products more efficiently. The MNCs also possess internally established brands and sophisticated marketing networks that help them to penetrate in the international market in a larger way. In addition, the demonstration effects or technology externalities and emerging competitive threats from the MNCs can increase innovative efforts of the domestic firms. When it is so, the industries with larger presence of the MNCs are likely to have greater export competitiveness. Capital Intensity (CI): Higher capital intensity of the firms in an industry deters entry and, therefore, reduces possible competitive threats and their export competitiveness. Similarly, when the capital equipments are imported, the firms may not necessarily have competitive advantage in the international market. However, lack of competition may also encourage in-house R&D enhancing competitiveness of the firms. Further, higher capital intensity of the firms can make them more export competitive when capital goods embody better technology. The nature of impact of capital intensity on export competitiveness, therefore, depends on the relative strength of these diverse forces.In-house R&D Intensity (R&D): Innovation is expected to have significant influence on technological competitiveness of the firms (Grossman and Helpman, 1995), and hence on their export performance. Greater in-house R&D enables the firms to move up along the supply chain by producing new varieties of products, and improving quality of the existing product, whereas process related innovation reduces the cost of the products and their prices. Hence, the industries with greater innovative efforts by the firms are likely to have higher export competitiveness. However, greater in-house R&D efforts may give new opportunities to the firms in the domestic market. It may also restrict entry of new firms and hence competition in the domestic market. This, in turn, may reduce efficiency and competitiveness of the firms in the international market. The nature of impact of in-house R&D on export competitiveness, therefore, depends on how these diverse forces dominate each other9.
9 A review of the existing studies does not show any consensus on the nature of impact of in-house R&D efforts on export competitiveness of the firms. For example, while Willmore (1992) and Wagner (2001) find a positive impact of in-house R&D on exports, Lefebvre et al. (1998) find no significant impact of in-house R&D on export competitiveness of the firms.
joc_1-2012_v3doi.indd 6 17.4.2012 10:56:01
�
Foreign Technology Purchase Intensity (FTPI): Foreign technology purchase is expected to enhance export competitiveness of the firms of the developing countries like India. This so because the R&D base of the developing country firms is generally low due to their limited financial and intellectual capabilities towards development of indigenous technologies, and their overall technical change is adaptive in nature (Kumar and Siddharthan, 1994). This is true particularly, for the small and the medium firms that do not have in-house R&D facilities (Brouwer and Kleinknecht, 1993). However, reliance entirely on foreign technology and lack of efforts towards development of indigenous technology may limit competitive edge in the international market in the long-run when the technologies imported are obsolete in nature. Besides, lack of necessary knowledge and skills may also limit benefits of imported technolo-gies.Mergers and Acquisitions (M&A): M&A can affect the export competitiveness of a firm in two possible ways. On the one hand, M&A may result in greater monopoly power, and when it is so, lack of competitive threat in the market is likely to reduce efficiency and export competitiveness of the firms. On the other hand, integration of firms through M&A can help the firms to reap the benefits of large-scale production and hence to lower costs and prices of the products in the international market. Besides, increase in market concentration following M&A may also encourage the firms towards greater in-house R&D yielding new and better products10 as well as lowering costs and prices. This can enhance competitiveness of the firms in the international market. The nature of impact of M&A on export competitiveness of a firm, therefore, depends on the relative strength these diverse possibilities.Selling Intensity (SELL): Selling efforts of a firm refer to firm’s expenditure towards ad-vertising, distribution and marketing. While advertising benefits the firms in the form of product differentiation and image advantage in the market, marketing and distribution related complementary assets help them in reaching the consumers. This means that the industries with greater selling efforts by the firms are expected to have higher competitiveness in the international market. However, entry barriers created through advertising and resulting mo-nopoly may induce the firms to concentrate in the domestic market. Besides, increase in market concentration may also reduce firms’ efficiency and competitiveness in the long run. Hence, the impact of selling strategies on export competitiveness of the firms is not clear and remains an important empirical question.Profitability (PROF): It is commonly perceived that higher profitability of the existing firms in an industry comes from their greater market power. When it is so the firms may suffer from the problem of X-inefficiency and the costs of operation may rise above the minimum possible level, reducing competitiveness in the international market. Besides, the firms earning high profitability in the domestic market may not be so enthusiastic to penetrate in the international market. On the other hand, it is also possible that greater profitability would encourage new firms to enter into the industry resulting in greater market competition, and hence enhanced export competitiveness of the firms. The nature of impact of profitability on export competi-tiveness of a firm, therefore, depends on relative strength of these diverse forces.
10 Such new products of better quality serve a useful social purpose by giving consumers a variety of choices, particularly, when the information on product quality and reliability is not free.
joc_1-2012_v3doi.indd 7 17.4.2012 10:56:02
Journal of Competitiveness �
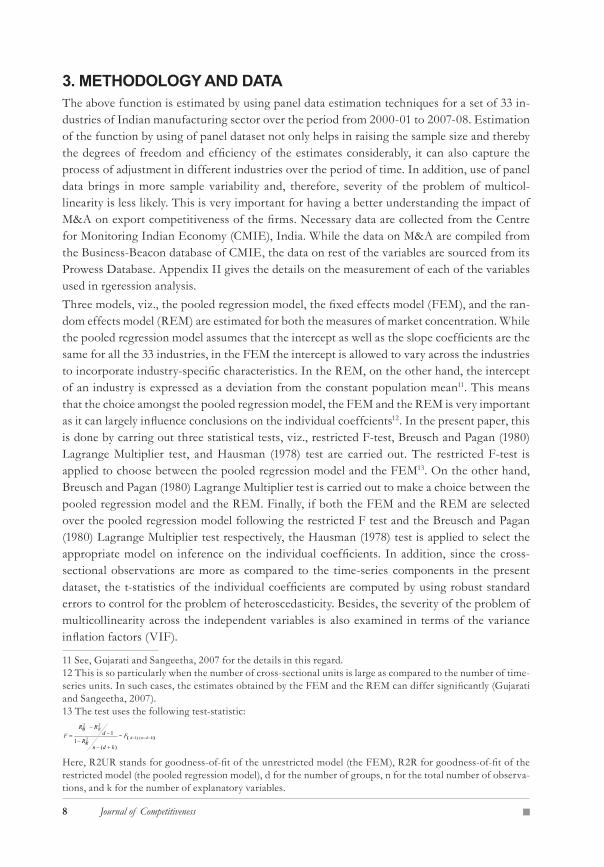
3. MeThODOlOgy aND DaTaThe above function is estimated by using panel data estimation techniques for a set of 33 in-dustries of Indian manufacturing sector over the period from 2000-01 to 2007-08. Estimation of the function by using of panel dataset not only helps in raising the sample size and thereby the degrees of freedom and efficiency of the estimates considerably, it can also capture the process of adjustment in different industries over the period of time. In addition, use of panel data brings in more sample variability and, therefore, severity of the problem of multicol-linearity is less likely. This is very important for having a better understanding the impact of M&A on export competitiveness of the firms. Necessary data are collected from the Centre for Monitoring Indian Economy (CMIE), India. While the data on M&A are compiled from the Business-Beacon database of CMIE, the data on rest of the variables are sourced from its Prowess Database. Appendix II gives the details on the measurement of each of the variables used in rgeression analysis.Three models, viz., the pooled regression model, the fixed effects model (FEM), and the ran-dom effects model (REM) are estimated for both the measures of market concentration. While the pooled regression model assumes that the intercept as well as the slope coefficients are the same for all the 33 industries, in the FEM the intercept is allowed to vary across the industries to incorporate industry-specific characteristics. In the REM, on the other hand, the intercept of an industry is expressed as a deviation from the constant population mean11. This means that the choice amongst the pooled regression model, the FEM and the REM is very important as it can largely influence conclusions on the individual coeffcients12. In the present paper, this is done by carring out three statistical tests, viz., restricted F-test, Breusch and Pagan (1980) Lagrange Multiplier test, and Hausman (1978) test are carried out. The restricted F-test is applied to choose between the pooled regression model and the FEM13. On the other hand, Breusch and Pagan (1980) Lagrange Multiplier test is carried out to make a choice between the pooled regression model and the REM. Finally, if both the FEM and the REM are selected over the pooled regression model following the restricted F test and the Breusch and Pagan (1980) Lagrange Multiplier test respectively, the Hausman (1978) test is applied to select the appropriate model on inference on the individual coefficients. In addition, since the cross-sectional observations are more as compared to the time-series components in the present dataset, the t-statistics of the individual coefficients are computed by using robust standard errors to control for the problem of heteroscedasticity. Besides, the severity of the problem of multicollinearity across the independent variables is also examined in terms of the variance inflation factors (VIF).
11 See, Gujarati and Sangeetha, 2007 for the details in this regard.12 This is so particularly when the number of cross-sectional units is large as compared to the number of time-series units. In such cases, the estimates obtained by the FEM and the REM can differ significantly (Gujarati and Sangeetha, 2007).13 The test uses the following test-statistic:
Here, R2UR stands for goodness-of-fit of the unrestricted model (the FEM), R2R for goodness-of-fit of the restricted model (the pooled regression model), d for the number of groups, n for the total number of observa-tions, and k for the number of explanatory variables.
)](),1[(2
22
~
)(1
1kdnd
UR
RUR
F
kdnR
dRR
F
joc_1-2012_v3doi.indd 8 17.4.2012 10:56:02

�
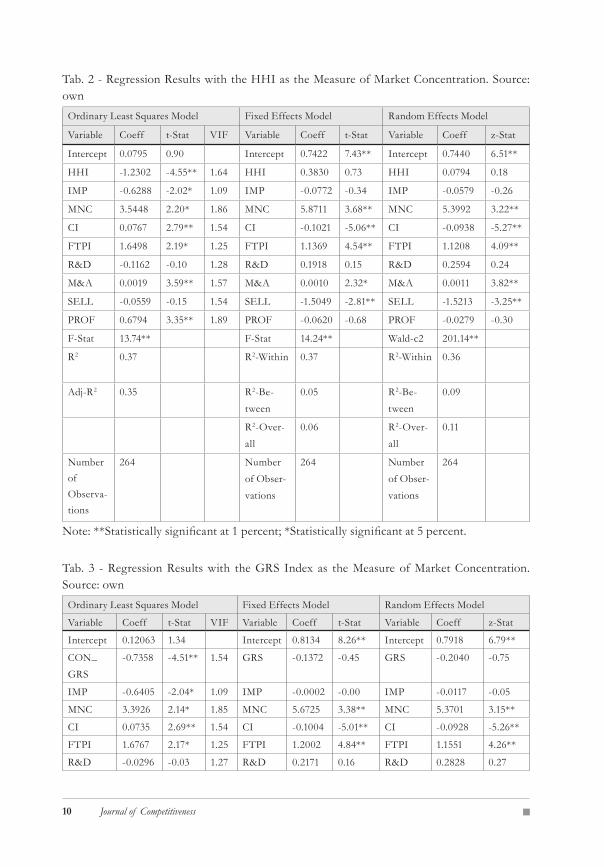
4. RegRessION ResUlTs The summary statistics of the variables used in regression analysis are presented in Table 1, whereas Table 2 and Table 3 present the regression results. It is observed that the F-statistic of the pooled regression model and the FEM, and the Wald-χ2 of the REM are statistically significant. This means all the estimated models are statistically significant. While explanatory power of the pooled regression model is reasonably high, that of the REM is low, and it is very low for the FEM. However, this does not necessarily indicate that the estimated models are not acceptable (Gujarati and Sangeetha, 2007). According to Goldberger (1991), R2 has a very modest role in regression analysis. In classical linear regression model (CLRM), it is not neces-sary that the value of R2 should be high. Neither a high value of R2 favors a model, nor is a low value of R2 evidence against it.
Tab. 1 - Summary Statistics of Variables used in Regression Model. Source: own
VariableNumber of
ObservationsMean
Standard Deviation
Minimum Maximum
EXP 264 0.4865 0.4268 0.0198 2.4481CON_HHI 264 0.089� 0.0847 0.0097 0.4112CON_GRS 264 0.1898 0.1334 0.0378 0.�28�IMP 264 0.0315 0.0468 0.0000 0.2391CI 264 1.9100 0.7419 0.5759 5.00�2MNC 264 0.0084 0.0157 0.0000 0.1049R&D 264 0.0117 0.0185 0.0001 0.1520FTPI 264 0.0406 0.0302 0.0038 0.1979M&A 264 �5.7�52 71.0787 3.0000 432.0000SELL 264 0.1�01 0.0783 0.0409 0.4222PROF 264 0.2��8 0.1313 -0.11�2 0.7354
The variance inflation factors (VIF) are computed for each of the explanatory variables to examine the severity of multicollinearity problem. It is found that the VIF of each of the ex-planatory variables is less than 2. Following (Belsey et al., 1980), it can, therefore, be said that the estimated models do not suffer from severe multicollinearity problem14. The t-statistics and z-statistics for the individual coefficients are computed by using White’s (1980) robust standard errors to control for heteroscedasticity and autocorrelation.
14 Another important symptom of multicollinearity is high value of R2 with only a few or no statistically signi-ficant t-ratio. In the present case, R2 is not very high (rather it is low) and majority of the t-ratios are statistically significant. This also indicates that the estimated models do not suffer from severe multicollinearity problem.
joc_1-2012_v3doi.indd 9 17.4.2012 10:56:02
Journal of Competitiveness 10
Tab. 2 - Regression Results with the HHI as the Measure of Market Concentration. Source: own
Ordinary Least Squares Model Fixed Effects Model Random Effects Model
Variable Coeff t-Stat VIF Variable Coeff t-Stat Variable Coeff z-Stat
Intercept 0.0795 0.90 Intercept 0.7422 7.43** Intercept 0.7440 6.51**
HHI -1.2302 -4.55** 1.64 HHI 0.3830 0.73 HHI 0.0794 0.18
IMP -0.�288 -2.02* 1.09 IMP -0.0772 -0.34 IMP -0.0579 -0.2�
MNC 3.5448 2.20* 1.8� MNC 5.8711 3.68** MNC 5.3992 3.22**
CI 0.07�7 2.79** 1.54 CI -0.1021 -5.06** CI -0.0938 -5.27**
FTPI 1.6498 2.19* 1.25 FTPI 1.13�9 4.54** FTPI 1.1208 4.09**
R&D -0.11�2 -0.10 1.28 R&D 0.1918 0.15 R&D 0.2594 0.24
M&A 0.0019 3.59** 1.57 M&A 0.0010 2.32* M&A 0.0011 3.82**
SELL -0.0559 -0.15 1.54 SELL -1.5049 -2.81** SELL -1.5213 -3.25**
PROF 0.6794 3.35** 1.89 PROF -0.0�20 -0.�8 PROF -0.0279 -0.30
F-Stat 13.74** F-Stat 14.24** Wald-c2 201.14**
R2 0.37 R2-Within 0.37 R2-Within 0.3�
Adj-R2 0.35 R2-Be-tween
0.05 R2-Be-tween
0.09
R2-Over-all
0.0� R2-Over-all
0.11
Number of Observa-tions
264 Number of Obser-vations
264 Number of Obser-vations
264
Note: **Statistically significant at 1 percent; *Statistically significant at 5 percent.
Tab. 3 - Regression Results with the GRS Index as the Measure of Market Concentration. Source: own
Ordinary Least Squares Model Fixed Effects Model Random Effects Model
Variable Coeff t-Stat VIF Variable Coeff t-Stat Variable Coeff z-Stat
Intercept 0.120�3 1.34 Intercept 0.8134 8.26** Intercept 0.7918 6.79**
CON_GRS
-0.7358 -4.51** 1.54 GRS -0.1372 -0.45 GRS -0.2040 -0.75
IMP -0.6405 -2.04* 1.09 IMP -0.0002 -0.00 IMP -0.0117 -0.05
MNC 3.392� 2.14* 1.85 MNC 5.�725 3.38** MNC 5.3701 3.15**
CI 0.0735 2.69** 1.54 CI -0.1004 -5.01** CI -0.0928 -5.26**
FTPI 1.�7�7 2.17* 1.25 FTPI 1.2002 4.84** FTPI 1.1551 4.26**
R&D -0.029� -0.03 1.27 R&D 0.2171 0.1� R&D 0.2828 0.27
joc_1-2012_v3doi.indd 10 17.4.2012 10:56:02
11
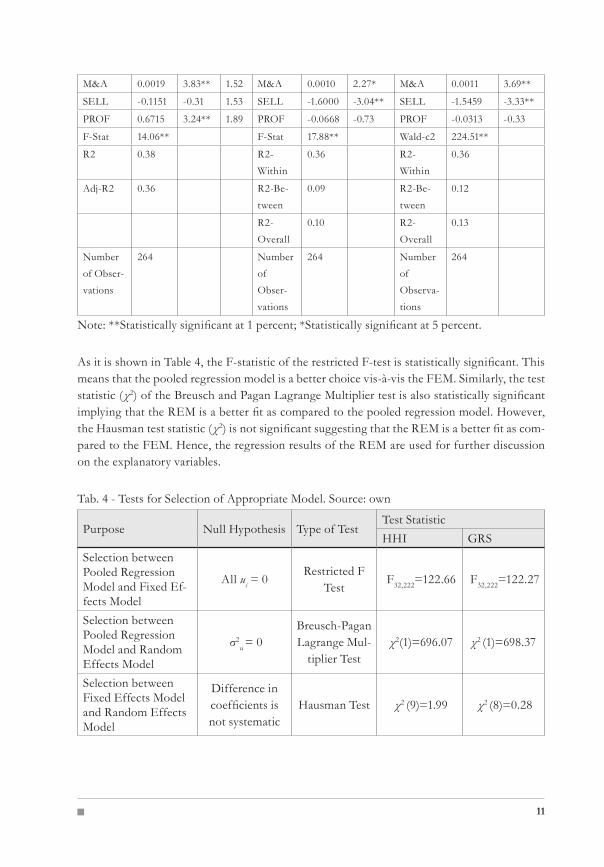
M&A 0.0019 3.83** 1.52 M&A 0.0010 2.27* M&A 0.0011 3.69**
SELL -0.1151 -0.31 1.53 SELL -1.�000 -3.04** SELL -1.5459 -3.33**
PROF 0.�715 3.24** 1.89 PROF -0.0��8 -0.73 PROF -0.0313 -0.33
F-Stat 14.06** F-Stat 17.88** Wald-c2 224.51**
R2 0.38 R2-Within
0.3� R2-Within
0.3�
Adj-R2 0.3� R2-Be-tween
0.09 R2-Be-tween
0.12
R2-Overall
0.10 R2-Overall
0.13
Number of Obser-vations
264 Number of Obser-vations
264 Number of Observa-tions
264
Note: **Statistically significant at 1 percent; *Statistically significant at 5 percent.
As it is shown in Table 4, the F-statistic of the restricted F-test is statistically significant. This means that the pooled regression model is a better choice vis-à-vis the FEM. Similarly, the test statistic (χ2) of the Breusch and Pagan Lagrange Multiplier test is also statistically significant implying that the REM is a better fit as compared to the pooled regression model. However, the Hausman test statistic (χ2) is not significant suggesting that the REM is a better fit as com-pared to the FEM. Hence, the regression results of the REM are used for further discussion on the explanatory variables.
Tab. 4 - Tests for Selection of Appropriate Model. Source: own
Purpose Null Hypothesis Type of TestTest StatisticHHI GRS
Selection between Pooled Regression Model and Fixed Ef-fects Model
All ui = 0Restricted F
Test F32,222=122.�� F32,222=122.27
Selection between Pooled Regression Model and Random Effects Model
σ2u = 0
Breusch-Pagan Lagrange Mul-
tiplier Test χ2(1)=�9�.07 χ2 (1)=�98.37
Selection between Fixed Effects Model and Random Effects Model
Difference in coefficients is not systematic
Hausman Test χ2 (9)=1.99 χ2 (8)=0.28
joc_1-2012_v3doi.indd 11 17.4.2012 10:56:02
Journal of Competitiveness 1�
It is found that the coefficient of CI, TIMP, MNC, M&A and SELL are statistically significant (Table 2 and 3). Further, while the coefficient of MNC, M&A and FTPI are positive, the coef-ficient of SELL and CI are negative. This means that export competitiveness is higher in the industries with larger number of mergers and acquisitions, higher technology purchase inten-sity, or greater presence of the MNCs. On the other hand, the industries with greater selling efforts or higher capital intensity have low export competitiveness. However, the coefficient of market concentration, IMP, R&D and PROF are not statistically significant. This implies that market concentration, import competition, in-house R&D efforts, and firms’ profitability do not have any significant impact on export competitiveness of the firms in Indian manufactur-ing sector.
5. DIsCUssIONsThe regression results have important implications for Indian manufacturing sector. First, firms can enhance export competitiveness through mergers and acquisitions. This is consistent with the observation of Beena (2008) that M&A results in greater exports. Restructuring of business largely through M&A (Basant, 2000), operation at a greater scale, and other synergy effects seem to have helped the firms to enhance their efficiency and competitiveness in the in-ternational market. On the other hand, entry of the foreign firms through M&A seems to have raised competitive pressure in the domestic market forcing the firms to boost their competi-tiveness15. In addition, better technology knowhow and managerial efficiencies of the MNCs and import of foreign technology might have raised firms’ export competitiveness. However, M&A may undermine firms’ innovative efforts and hence their competitiveness, particularly when integration with the MNCs helps the firms to have easy access to better technology. This may discourage the firms towards in-house R&D. Besides, if M&A results in greater monopoly power, the firms may have a weaker incentive to innovate, though the nature of relationship between market structure and firms’ innovative efforts is not very clear in the literature1�.Second, market concentration does not have any significant impact on export competitive-ness of the firms. This is contradictory to the proposition that lower market concentration and hence greater domestic rivalry forces the firms to innovate and improve, which in turn raise their shares and profits in export markets (Porter, 1990). This may largely be due to no significant increase in market concentration in majority of the industries following economic reforms. In majority of the industries, market concentration has either declined or has re-mained largely the same in the 1990s, and the wave of M&A has failed to influence market concentration (Mishra, 2005). Third, competition from imports does not necessarily enhance export competitiveness of the firms. Import competition may enhance efficiency and may create opportunity for greater exports for the larger firms, but it can also squeeze opportunities for the small firms in the
15 It is observed that the wave of M&A in Indian corporate sector did not have any detrimental impact on market competition (Mishra, 2005), or consumers’ welfare (Mishra and Kumar, 2011),16 For example, while Schumpeter (1942) propounded that the large firms in imperfectly competitive markets are the most conducive conditions for technical progress, according to Arrow (19�2), a pre-innovation mono-polist has a weaker incentive to innovate than a firm operating in a competitive market. Rather, it is competitive pressure that raises innovation, especially for the new firms (Aghion et al 2002).
joc_1-2012_v3doi.indd 12 17.4.2012 10:56:02

1�
domestic market forcing them to leave the industry. When it is so, many of the larger firms may prefer to concentrate in the domestic territory and their export intensity may decline. A balance between these two diverse forces may leave export competitiveness of the industry unchanged even if import competition increases.
6. CONClUsIONsIn the context of economic reforms in general and the subsequent wave of M&A in particular, the present paper attempts to examine the impact of these M&A on export competitiveness of the firms in Indian manufacturing sector. It is found that the industries with larger number of deals of M&A have greater export competitiveness. Export competiveness is also higher in the industries that have larger presence of the MNCs and greater foreign technology purchase intensity. On the other hand, industries with higher capital intensity or greater selling efforts by the firms have limited penetration in the international market. However, the present paper does not find any significant influence of market concentration, competition from imports, in-house R&D efforts, and profitability on export competitiveness of the firms.The findings of present paper have important policy implications. First, given that M&A en-hance export competitiveness of the firms, the issue of designing policy resolutions to encour-age the firms more towards M&A requires further scrutiny. Second, greater presence of the MNCs may force the local firms to exit the market, and market concentration may increase. Besides, a considerable portion of FDI inflows into India have taken the route of M&A limit-ing expansion of productive capacity during the post-reform period. It is also observed that the foreign affiliates operating in India spend significantly less on in-house R&D as compared to their domestic counterparts (Kumar, 1987; Kumar and Saqib, 199�; Kumar and Agarwal, 2000). This means that the policy measures should guide entry of the MNCs more through the mode of Greenfield investment. Finally, since capital intensive industries have lower export competitiveness, the policies towards imports of foreign embodied technology, efforts should be made towards development of indigenous capital equipments and their better utilization with a pool of skilled human resources.
ReferencesAghion, P., Carlin, W. & Schaffer, M. (2002). Competition, Innovation and Growth in Transition: Exploring the Interactions between Policies, William Davidson Working Paper 151, William David-son Institute, University of Michigan.Arrow, K. J. (1962). Economic Welfare and the Allocation of Resources for Invention’, In Richard R. Nelson (ed.), The Rate and Direction of Inventive Activity: Economic and Social Factors. National Bureau of Economic Research, Conference Series, Princeton: Princeton University Press, �09-�25.Basant, R. (2000). Corporate Response to Economic Reforms, Economic and Political Weekly, 35(10), 813-822.Basant, R. & Morris, S., (2000). Competition Policy in India: Issues for a Globalising Economy. Project Report Submitted to the Ministry of Industry, New Delhi: Government of India.
1.
2.
3.
4.
joc_1-2012_v3doi.indd 13 17.4.2012 10:56:03

Journal of Competitiveness 1�
Beena, P. L. (2000). An Analysis of Mergers in the Private Corporate Sector (CDS Working Paper 301). Kerala: Centre for Development Studies.Beena, S. (2008). Mergers and Acquisitions in the Indian Pharmaceutical Industry: Nature, Structure and Performance (MPRA Paper 8144). Besley, D. A., Kuh, E. & Selsch, R.E. (1980). Regression Diagnostics: Indentifying Influential Data and Source of Collinearity, New York: John Wiley & Sons. http://dx.doi.org/10.1002/0471725153Braga, H. & Willmore, L. (1991). Technological Imports and Technological Effort: An Anal-ysis of Their Determinants in Brazilian Firms. Journal of Industrial Economics, 39(4), 421–432. http://dx.doi.org/10.2307/2098441Breusch, T. S. & Pagan, A. R. (1980). The Lagrange Multiplier Test and its Applications to Model Specifications in Econometrics. Review of Economic Studies, 47(1), 239-253. http://dx.doi.org/10.2307/2297111Brouwer, E. & Kleinknecht, A. (1993). Technology and Firm’s Export Intensity: The Need for Adequate Measurement. Konjunkturpolitik, 39(5), 315-325.Chatterjee, S. (1986). Types of Synergy and Economic Value: The Impact of Acquisitions on Merging and Rival Firms. Strategic Management Journal, 7(2), 119-139. http://dx.doi.org/10.1002/smj.4250070203Chandrasekhar, C. P. (1999). Firms, Markets and the State: An Analysis of Indian Oligopoly. In A. K. Bagchi (Eds.), Economy and Organization- Indian Institutions under Neo Liberalized Regime. New Delhi: Sage Publications.Chou, T. C. (1986). Concentration, Profitability and Trade in a Simultaneous Equation Analysis: The Case of Taiwan. Journal of Industrial Economics, 34(4), 429-23. http://dx.doi.org/10.2307/2098627Dosi, G. (1988). Sources, Procedures, and Microeconomic Effects of Innovation. Journal of Economic Literature, 2�(3), 1120-1171.Ginevicius, R. & Cibra, S. (2009). Additive Measurement of Market Concentration. Jour-nal of Business Economics and Management, 10(3), 191-198. http://dx.doi.org/10.3846/1611-1�99.2009.10.191-198Goldberger, A. S. (1991). A Course in Econometrics. Cambridge: Harvard University Press.Grossman, G. & Helpman, E. (1995). Innovation and Growth in the Global Economy. Cambridge, MA: MIT Press.Gujarati, D. N. & Sangeeta, (2007). Basic Econometrics. New Delhi: Tata McGraw Hill Publica-tion.Hausman, J. A. (1978). Specification Tests in Econometrics. Econometrica, 46(6), 1251-1271. http://dx.doi.org/10.2307/1913827Kumar, N. (1987). Technology Imports and Local Research and Development in Indian Manufacturing. The Developing Economies, 25(3), 220-33. http://dx.doi.org/10.1111/j.1746-1049.1987.tb00107.xKumar, N. & Siddharthan, N.S. (1994). Technology, Firm Size and Export Behaviour in Developing Countries: The Case of Indian Enterprises. Journal of Development Studies, 31(2), 289-309. http://dx.doi.org/10.1080/00220389408422362
5.
�.
7.
8.
9.
10.
11.
12.
13.
14.
15.
1�.17.
18.
19.
20.
21.
joc_1-2012_v3doi.indd 14 17.4.2012 10:56:03
1�
Kumar, N. & Saqib, M. (199�). Firm Size, Opportunities for Adaptation, and In-House R&D Ac-tivity in Developing Countries: The Case of Indian Manufacturing. Research Policy, 25(5), 712–722. http://dx.doi.org/10.1016/0048-7333(95)00854-3Kumar, N. & Agarwal, A. (2000). Liberalization, Outward Orientation and In-house R&D Activity of Multinational and Local Firms: A Quantitative Exploration for Indian Manufac-turing (RIS Discussion Paper 07/20002).Levin, D. (1990). Horizontal Mergers: The 50-Percent Benchmark. American Economic Review, 80(5), 1238-45.Lefebvre, E., Lefebvre, L.A., & Bourgault, M. (1998). R&D-Related Capabilities as De-terminants of Export Performance. Small Business Economics 10(4), 365–377. http://dx.doi.org/10.1023/A:1007960431147Mantravadi, P. & Reddy A. V. (2008). Post-Merger Performance of Acquiring Firms from Different Industries in India. International Research Journal of Finance and Economics, 22, 193-204.Mishra, P. (2005) Mergers and Acquisitions in the Indian Corporate Sector in the Post-Lib-eralization Era: An Analysis, Ph.D. Thesis, Vidyasagar University, India.Mishra P. & Behera B. (2007). Instabilities in Market Concentration: An Empirical Investi-gation in Indian Manufacturing Sector. Journal of Indian School of Political Economy, 19(3), 419-449.Mishra, P. (2008). Concentration-Markup Relationship in Indian Manufacturing Sector. Eco-nomic and Political Weekly, 43(39), 76-81.Mishra, P. & Kumar, P. V. K. (2011). Impact of Mergers and Acquisitions on Consumers’ Welfare: Experience of Indian Manufacturing Sector. World Academy of Science, Engineering and Technolog y, 80, 1�20-1�30.Mishra, P. (2010). R&D Efforts by Indian Pharmaceutical Firms in the New Patent Regime. South East European Journal of Economics and Business, 5(1), 83-94. http://dx.doi.org/10.2478/v10033-010-0018-zMishra, P. (2011). Determinants of Inter-Industry Variations in Mergers and Acquisitions: Empirical Evidence from Indian Manufacturing Sector. Artha Vijnana, 53(1), 1-22.Mishra, P., Mohit, D. & Parimal, (2011). Market Concentration in Indian Manufacturing Sec-tor: Measurement Issues. Economic and Political Weekly, 46 (49), 76-80.Muûls, M. & Pisu, M. (2007). Imports and Exports at the Level of the Firm: Evidence from Belgium (Research Series 200705-03). National Bank of Belgium.Narayana, K. (1998). Technology Acquisition, De-regulation and Competitiveness: A study of Indian Automobile Industry. Research Policy, 27(2), 215-228. http://dx.doi.org/10.1016/S0048-7333(98)00037-7Porter, M. E. (1990). The Competitive Advantage of Nations. New York: The Free Press.Pratten, C. F. (1971). Economies of Scale in Manufacturing Industry. Cambridge: Cambridge Uni-versity Press.Ramaswamy, K. V. (2006). State of Competition in Indian Manufacturing Industry. In Me-hta, P. S. (Ed.), A Functional Competition Policy for India. New Delhi: Academic Foundation.
22.
23.
24.
25.
2�.
27.
28.
29.
30.
31.
32.
33.
34.
35.
3�.37.
38.
joc_1-2012_v3doi.indd 15 17.4.2012 10:56:03
Journal of Competitiveness 1�
Ramstetter, E. D. (1999). Trade Propensities and Foreign Ownership Shares in Indonesian Manufacturing. Bulletin of Indonesian Economic Studies, 35(2), 43-66. http://dx.doi.org/10.1080/00074919912331337587Roy, M. (1999). Mergers and Takeovers: The Indian Scene during the Nineties. In A. K. Bagchi (Ed.), Economy and Organization- Indian Institutions under Neo Liberalized Regime. New Delhi: Sage Publications.Scherer, F. M., Beckensten, A., Kaufer, E. & Murphy, R. D. (1975). The Economics of Multi-plant Operation: An International Comparisons Study. Cambridge: Harvard University Press.Scherer, F. M. & Ross, D. (1990). Industrial Market Structure and Economic Performance. Chicago: Rand-Mcnally.Shumpeter J. A. (1942). Capitalism, Socialism, and Democracy. New York: Harper. Shelton, L. M. (1988). Strategic Business Fits and Corporate Acquisitions: Empirical Evi-dence. Strategic Management Journal, 9(3), 279-287. http://dx.doi.org/10.1002/smj.4250090307Steiner, P. O. (1975). Mergers, Motives, Effects and Policies. Ann Arbor, MI: University of Michi-gan Press.Venkiteswaran, N. (1997). Restructuring of Corporate India: The Emerging Scenario. Vika-lpa, 22(3), 3-13.Wagner, J. (2001). A Note on the Firm Size Export Relationship. Small Business Economics, 17, 229-237. http://dx.doi.org/10.1023/A:1012202405889White, H. (1980). A Heteroscedasticity Consistent Covariance Matrix Estimator and a Direct Test of Heteroscedasticity. Econometrica, 48(4), 817-818. http://dx.doi.org/10.2307/1912934Willmore, L. (1992). Industrial policy in Central America. Cepal Review, No. 48, 95-105.
Contact informationPulak MishraAssociate ProfessorDepartment of Humanities and Social SciencesIndian Institute of Technolog y Kharagpur, Kharagpur 721 302E-mail: [email protected]
Neha JaiswalResearch AssistantDepartment of Humanities and Social SciencesIndian Institute of Technolog y Kharagpur, Kharagpur 721 302 E-mail: [email protected]
39.
40.
41.
42.
43.44.
45.
46.
47.
48.
49.
JEL Classification: L1, L2, L4, L5
joc_1-2012_v3doi.indd 16 17.4.2012 10:56:03
1�
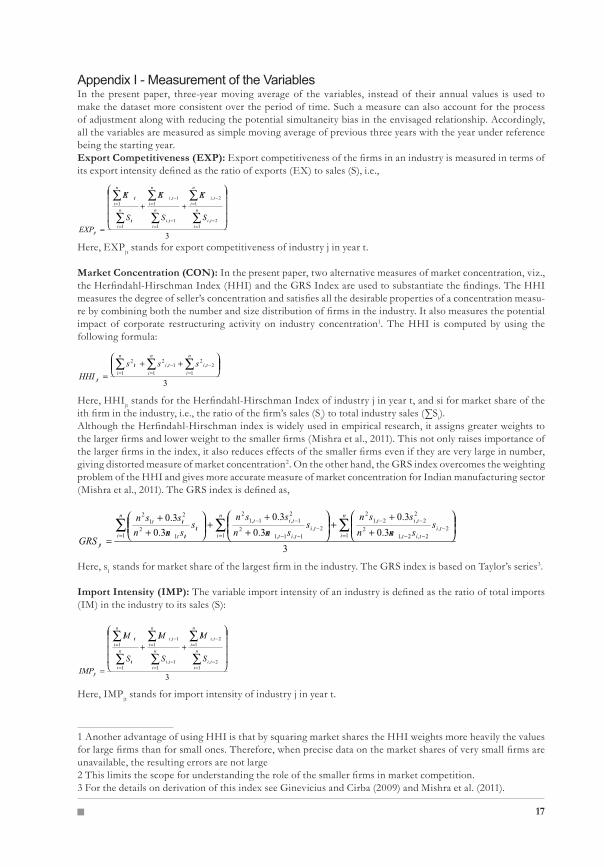
Appendix I - Measurement of the VariablesIn the present paper, three-year moving average of the variables, instead of their annual values is used to make the dataset more consistent over the period of time. Such a measure can also account for the process of adjustment along with reducing the potential simultaneity bias in the envisaged relationship. Accordingly, all the variables are measured as simple moving average of previous three years with the year under reference being the starting year. Export Competitiveness (EXP): Export competitiveness of the firms in an industry is measured in terms of its export intensity defined as the ratio of exports (EX) to sales (S), i.e.,
Here, EXPjt stands for export competitiveness of industry j in year t.
Market Concentration (CON): In the present paper, two alternative measures of market concentration, viz., the Herfindahl-Hirschman Index (HHI) and the GRS Index are used to substantiate the findings. The HHI measures the degree of seller’s concentration and satisfies all the desirable properties of a concentration measu-re by combining both the number and size distribution of firms in the industry. It also measures the potential impact of corporate restructuring activity on industry concentration1. The HHI is computed by using the following formula:
Here, HHIjt stands for the Herfindahl-Hirschman Index of industry j in year t, and si for market share of the ith firm in the industry, i.e., the ratio of the firm’s sales (Si) to total industry sales (∑Si). Although the Herfindahl-Hirschman index is widely used in empirical research, it assigns greater weights to the larger firms and lower weight to the smaller firms (Mishra et al., 2011). This not only raises importance of the larger firms in the index, it also reduces effects of the smaller firms even if they are very large in number, giving distorted measure of market concentration2. On the other hand, the GRS index overcomes the weighting problem of the HHI and gives more accurate measure of market concentration for Indian manufacturing sector (Mishra et al., 2011). The GRS index is defined as,
Here, s1 stands for market share of the largest firm in the industry. The GRS index is based on Taylor’s series3.
Import Intensity (IMP): The variable import intensity of an industry is defined as the ratio of total imports (IM) in the industry to its sales (S):
Here, IMPjt stands for import intensity of industry j in year t.
1 Another advantage of using HHI is that by squaring market shares the HHI weights more heavily the values for large firms than for small ones. Therefore, when precise data on the market shares of very small firms are unavailable, the resulting errors are not large2 This limits the scope for understanding the role of the smaller firms in market competition.3 For the details on derivation of this index see Ginevicius and Cirba (2009) and Mishra et al. (2011).
3
12,
12,
11,
11,
1
1
++
=∑
∑
∑
∑
∑
∑
=−
=−
=−
=−
=
=n
iti
n
iti
n
iti
n
iti
n
iit
n
iit
jt
S
EX
S
EX
S
EX
EXP
31
2,2
1
1,2
1
2
++
=∑∑∑
=−
=−
=
n
i
ti
n
i
ti
n
i
it
jt
sss
HHI
3
3.0
3.0
3.0
3.0
3.0
3.0
1 12,
2,2,12
22,2,1
2
12,
1,1,12
21,1,1
2
12
21
2
∑ ∑∑= =
−−−
−−
=−
−−
−−
+
++
+
++
+
+
=
n
i
n
iti
tit
titn
iti
tit
titit
itt
itt
jt
ssnsn
ssns
snsn
ssns
snsn
ssn
GRS
3
12,
12,
11,
11,
1
1
++
=∑
∑
∑
∑
∑
∑
=−
=−
=−
=−
=
=n
iti
n
iti
n
iti
n
iti
n
iit
n
iit
jt
S
IM
S
IM
S
IM
IMP
joc_1-2012_v3doi.indd 17 17.4.2012 10:56:03

Journal of Competitiveness 1�
MNC: The present paper measures presence of MNCs in industry j in year t (MNCjt) as the ratio of foreign exchange spending as dividend (FSD) to sales (S) in the industry, i.e.,
Capital Intensity (CI): The capital intensity of an industry is measured as the ratio of capital employed (CE) in the industry to its sales (S), i.e.,
Here, CIjt stands for capital intensity of industry j in year t.
Foreign Technology Purchase Intensity (FTPI): The present paper measures foreign technology purchase intensity as the ratio of expenditure on purchase of foreign technology (FTP) to sales (s) i.e.,
Here, FTPIjt stands for foreign technology purchase intensity in industry j in year t.
R&D Intensity (R&D): The ratio of expenditure on in-house research and development (RD) in an industry to its sales is used as a measure of R&D intensity of the industry, i.e.,
Here, R&Djt stands for the in-house R&D intensity in industry j in year t.
Mergers and Acquisitions (M&A): The extent of mergers and acquisitions in industry j in year t (M&Ajt) is measured as the total number of deals in the industry over previous three years with the year under reference being the starting year.
Here, M&Ait stands for number of deals by firm i in the industry in year t.
Selling Intensity (SELL): The present paper measures selling intensity in an industry as the ratio of total selling expenses (SE) by the firms in the industry to their total sales (S), i.e.,
Here, SELLjt stands for the selling intensity in industry j in year t.
31
2,
12,
11,
11,
1
1
++
=∑
∑
∑
∑
∑
∑
=−
=−
=−
=−
=
=n
iti
n
iti
n
iti
n
iti
n
iit
n
iit
jt
S
FSD
S
FSD
S
FSD
MNC
31
2,
12,
11,
11,
1
1
++
=∑
∑
∑
∑
∑
∑
=−
=−
=−
=−
=
=n
iti
n
iti
n
iti
n
iti
n
iit
n
iit
jt
S
CE
S
CE
S
CE
CI
31
2,
12,
11,
11,
1
1
++
=∑
∑
∑
∑
∑
∑
=−
=−
=−
=−
=
=n
iti
n
iti
n
iti
n
iti
n
iit
n
iit
jt
S
FTP
S
FTP
S
FTP
FTPI
++= ∑
∑
∑
∑
∑
∑
=−
=−
=−
=−
=
=
3
&1
2,
12,
11,
11,
1
1n
iti
n
iti
n
iti
n
iti
n
iit
n
iit
jt S
RD
S
RD
S
RD
DR
∑∑∑=
−=
−=
++=n
iti
n
iti
n
iitjt AMAMAMAM
12,
11,
1
&&&&
31
2,
12,
11,
11,
1
1
++
=∑
∑
∑
∑
∑
∑
=−
=−
=−
=−
=
=n
iti
n
iti
n
iti
n
iti
n
iit
n
iit
jt
S
SE
S
SE
S
SE
SELL
joc_1-2012_v3doi.indd 18 17.4.2012 10:56:03

1�
Profitability (PROF): In the present paper, profitability of an industry is measured as the ratio of profit before interest and tax (PBIT) of the industry to its sales (S), i.e.,
Here, PROFjt stands for profitability of industry j in year t.3
12,
12,
11,
11,
1
1
++
=∑
∑
∑
∑
∑
∑
=−
=−
=−
=−
=
=n
iti
n
iti
n
iti
n
iti
n
iit
n
iit
jt
S
PBIT
S
PBIT
S
PBIT
PROF
joc_1-2012_v3doi.indd 19 17.4.2012 10:56:03