Embed Size (px)
Citation preview

Merger and Acquisition Modelling Apr 19, 2023 1
LBO General Discussion
www.edbodmer.com [email protected] Apr 19, 20232
LBO and Private Equity Terms
• Strategic Acquisition
• Same industry, synergies
• Financial Acquisition
• Purely an investment without links to other businesses (e.g. private equity)
• Trading Comparables and Public Comparables
www.edbodmer.com [email protected] Apr 19, 20233
Leveraged Finance - Introduction
• Leveraged Finance simply means funding a company or business unit with more debt than would be considered normal for that company or industry.
• Higher-than-normal debt implies that the funding may be riskier, and therefore more costly, than normal borrowing -- higher credit spreads and fees. It is often also more complex with covenants and waterfalls.
• Hence leveraged finance is commonly employed to achieve a specific, often temporary, objective: to make an acquisition, to effect a buy-out, to repurchase shares or fund a one-time dividend, or to invest in a self sustaining, cash-generating asset.
www.edbodmer.com [email protected] Apr 19, 20234
Leveraged Buyout Process
• A group takes over control of a company (sometimes with hostile takeovers).
• Use high level of leverage and multiple debt layers to take control
• Once in control, improve operations – increase EBITDA, divest unrelated businesses to generate cash for transaction, re-sell the new company for a profit.
• High amortization assures self-restraint on behalf of the borrower.
• In a typical LBO, capital expenditures do not exceed depreciation by much.
• By changing the relative participation of debt and equity in the capital structure, an LBO redistributes returns and risks among providers of capital.
www.edbodmer.com [email protected] Apr 19, 20235
Deal Sources
• Some of the Targets for Private Equity and LBO’s Include:
• Family Businesses (Seeking Partnerships)
• Divisions of Large Corporations (Non-Core)
• Privatizations
• Forced Divestitures
• Other Private Equity Firms
www.edbodmer.com [email protected] Apr 19, 20237
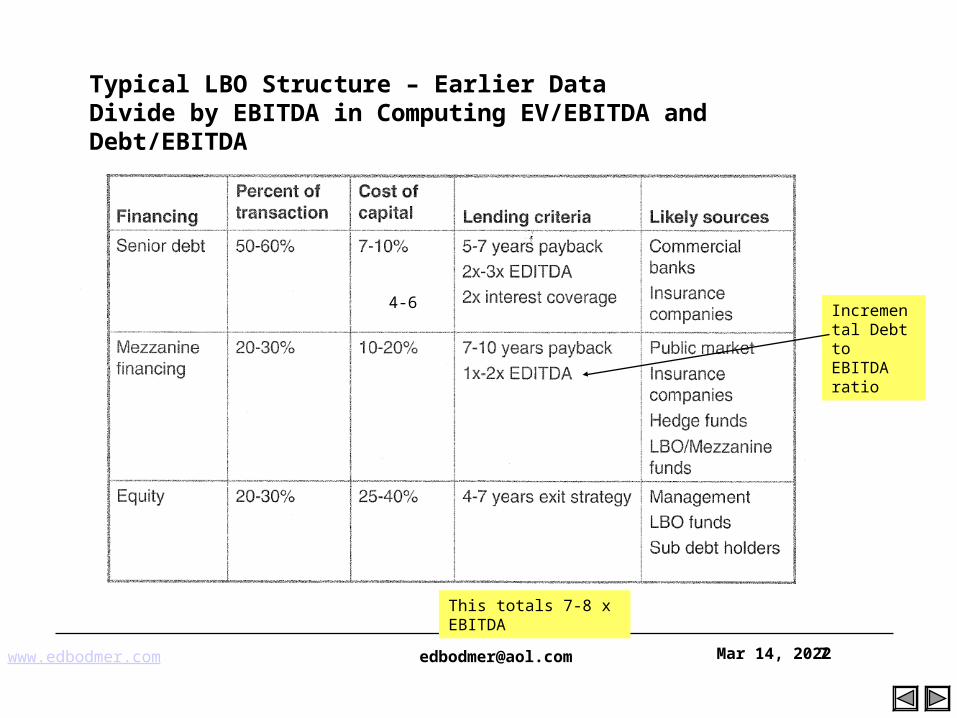
Typical LBO Structure – Earlier DataDivide by EBITDA in Computing EV/EBITDA and Debt/EBITDA
Incremental Debt to EBITDA ratio
This totals 7-8 x EBITDA
4-6
www.edbodmer.com [email protected] Apr 19, 20239
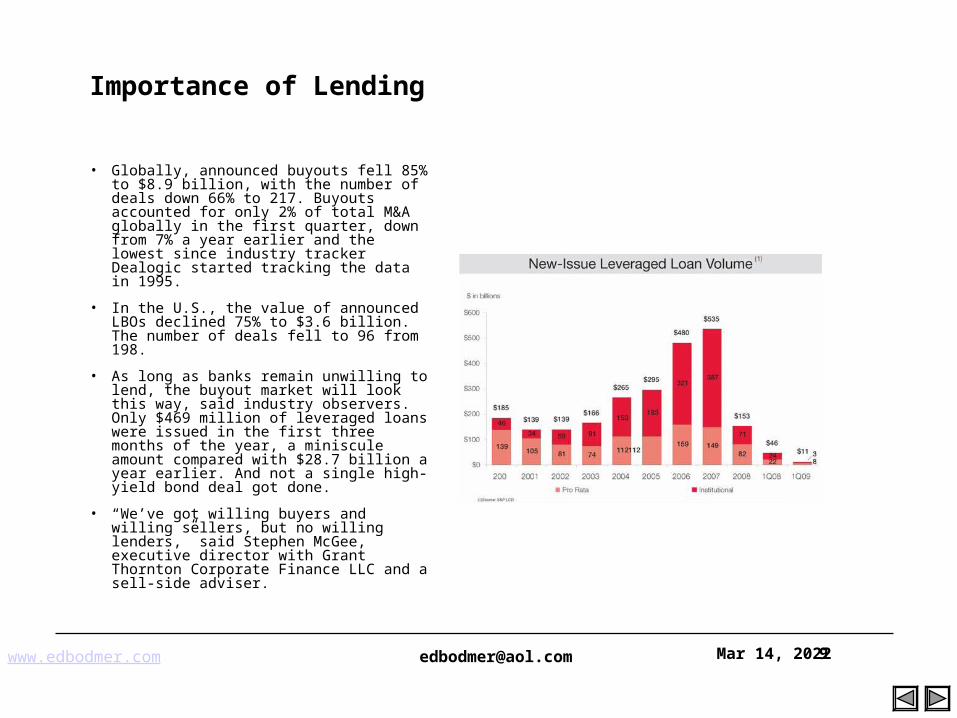
Importance of Lending
• Globally, announced buyouts fell 85% to $8.9 billion, with the number of deals down 66% to 217. Buyouts accounted for only 2% of total M&A globally in the first quarter, down from 7% a year earlier and the lowest since industry tracker Dealogic started tracking the data in 1995.
• In the U.S., the value of announced LBOs declined 75% to $3.6 billion. The number of deals fell to 96 from 198.
• As long as banks remain unwilling to lend, the buyout market will look this way, said industry observers. Only $469 million of leveraged loans were issued in the first three months of the year, a miniscule amount compared with $28.7 billion a year earlier. And not a single high-yield bond deal got done.
• “We’ve got willing buyers and willing sellers, but no willing lenders,” said Stephen McGee, executive director with Grant Thornton Corporate Finance LLC and a sell-side adviser.
www.edbodmer.com [email protected] Apr 19, 202310
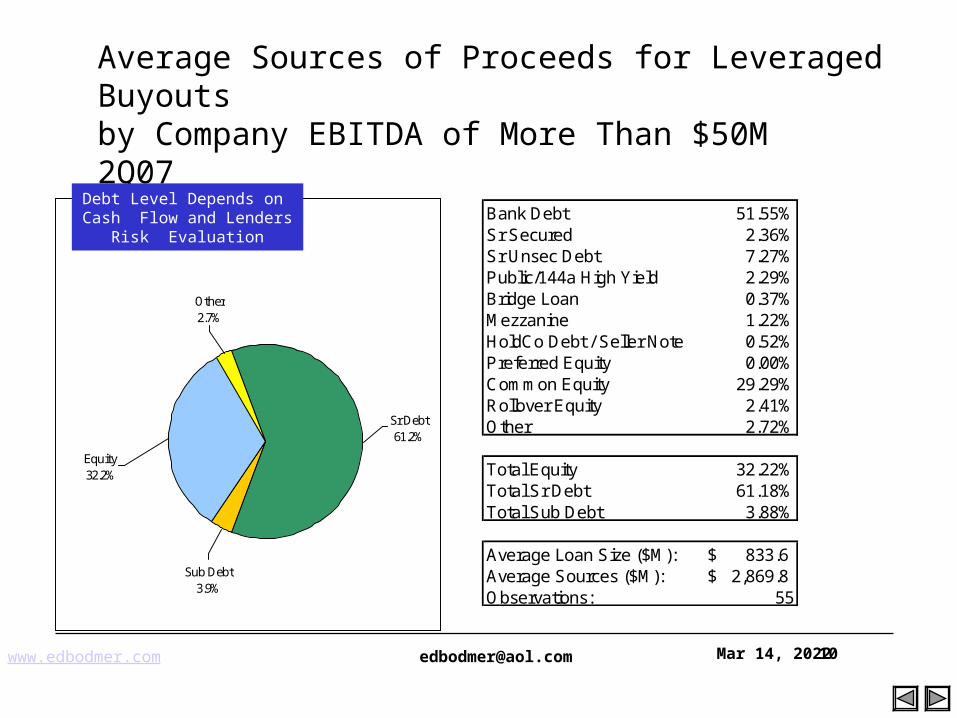
Average Sources of Proceeds for Leveraged Buyouts by Company EBITDA of More Than $50M2Q07
Sr Debt61.2%
Sub Debt3.9%
Equity32.2%
Other2.7%
Bank Debt 51.55%Sr Secured 2.36%Sr Unsec Debt 7.27%Public/144a High Yield 2.29%Bridge Loan 0.37%Mezzanine 1.22%HoldCo Debt / Seller Note 0.52%Preferred Equity 0.00%Common Equity 29.29%Rollover Equity 2.41%Other 2.72%
Total Equity 32.22%Total Sr Debt 61.18%Total Sub Debt 3.88%
Average Loan Size ($M): 833.6$ Average Sources ($M): 2,869.8$ Observations: 55
Debt Level Depends on Cash Flow and Lenders Risk
Evaluation
www.edbodmer.com [email protected] Apr 19, 202311
1111
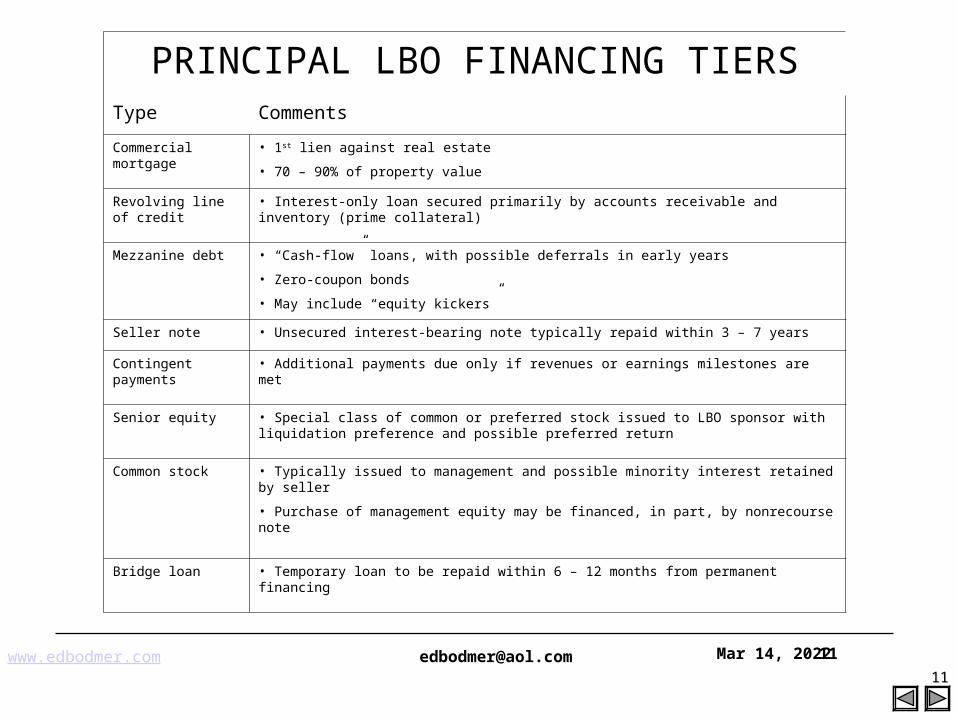
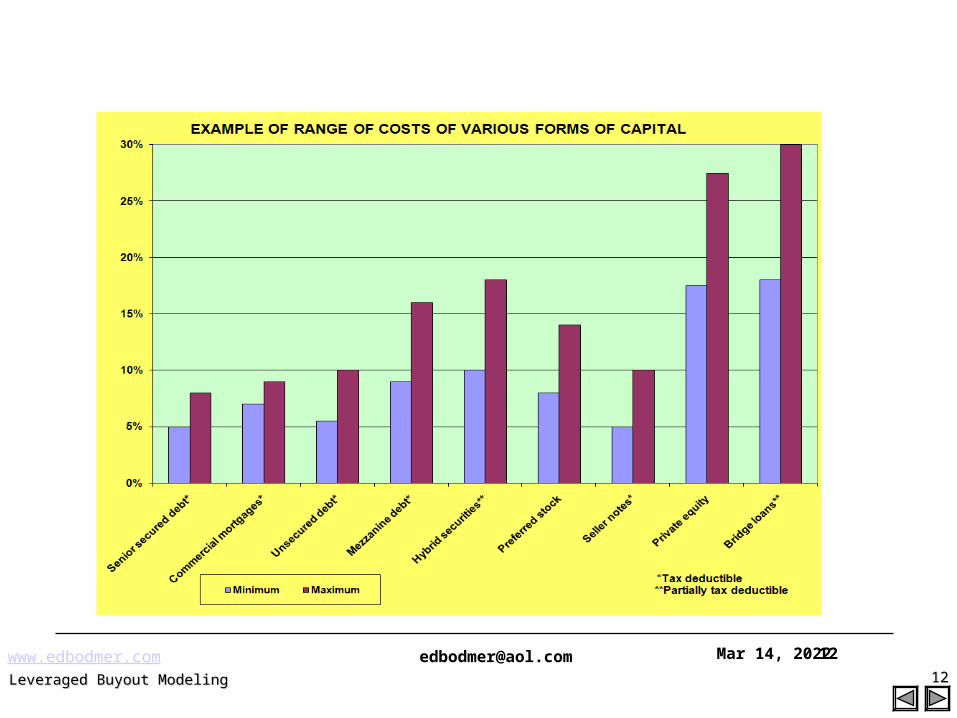
PRINCIPAL LBO FINANCING TIERSType Comments
Commercial mortgage
• 1st lien against real estate
• 70 – 90% of property value
Revolving line of credit
• Interest-only loan secured primarily by accounts receivable and inventory (prime collateral)
Mezzanine debt • “Cash-flow” loans, with possible deferrals in early years
• Zero-coupon bonds
• May include “equity kickers”
Seller note • Unsecured interest-bearing note typically repaid within 3 – 7 years
Contingent payments • Additional payments due only if revenues or earnings milestones are met
Senior equity • Special class of common or preferred stock issued to LBO sponsor with liquidation preference and possible preferred return
Common stock • Typically issued to management and possible minority interest retained by seller
• Purchase of management equity may be financed, in part, by nonrecourse note
Bridge loan • Temporary loan to be repaid within 6 – 12 months from permanent financing
www.edbodmer.com [email protected] Apr 19, 202312
Leveraged Buyout ModelingLeveraged Buyout Modeling 1212
www.edbodmer.com [email protected] Apr 19, 202313
Use of Mezzanine Debt to Meet Objectives and Restrictions of Equity and Senior Debt LBO General Points
• An LBO is a transaction in which an investor group acquires a company by taking on an extraordinary amount of debt, with plans to repay the debt with funds generated from the company or with revenue earned by selling off the newly acquired company's assets
• Leveraged buy-out seeks to force realization of the firm’s potential value by taking control (also done by proxy fights)
• Leveraging-up the purchase of the company is a "temporary“ structure pending realization of the value
• Leveraging method of financing the purchase permits "democracy“ in purchase of ownership and control--you don't have to be a billionaire to do it; management can buy their company.
• Raise money to pay for buyout premium
• Get as much as possible from the senior lenders
• Get as little as possible from the equity investors
• Tailor the terms of the mezzanine to be serviced from the expected cash flow.
www.edbodmer.com [email protected] Apr 19, 202314
Leveraged Buyout General Characteristics
• Leverage ranges from 6:1 to 12:1. Debt to EBITDA ranges from 3.5 times to 6 times or even more.
• Investors seek equity returns of 20 percent or more – focus is on equity IRR rather than free cash flow.
• Average life of 6.7 years, after which investors take the firm public. Bank amortizes senior debt over 3-7 years.
• Characteristics
• Strong and stable cash flows
• Low level of capital expenditures
• Strong market position
• Low rate of technological change
• Relatively low market valuation
www.edbodmer.com [email protected] Apr 19, 202315
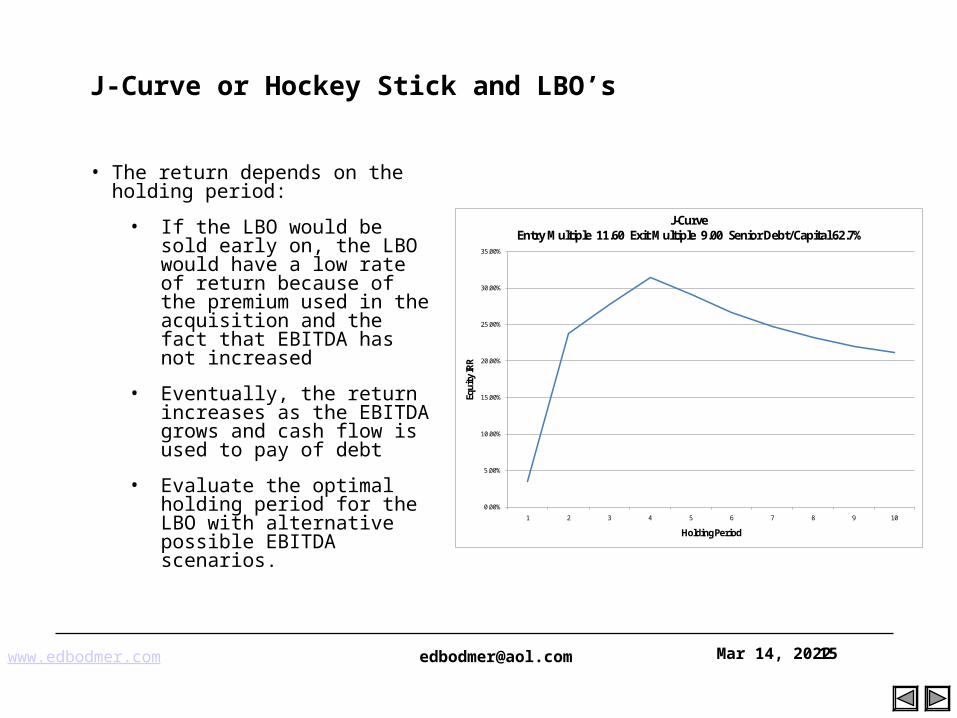
J-Curve or Hockey Stick and LBO’s
• The return depends on the holding period:
• If the LBO would be sold early on, the LBO would have a low rate of return because of the premium used in the acquisition and the fact that EBITDA has not increased
• Eventually, the return increases as the EBITDA grows and cash flow is used to pay of debt
• Evaluate the optimal holding period for the LBO with alternative possible EBITDA scenarios.
0.00%
5.00%
10.00%
15.00%
20.00%
25.00%
30.00%
35.00%
1 2 3 4 5 6 7 8 9 10
Equi
ty IR
R
Holding Period
J-CurveEntry Multiple 11.60 Exit Multiple 9.00 Senior Debt/Capital 62.7%
Merger and Acquisition Modelling Apr 19, 2023 16
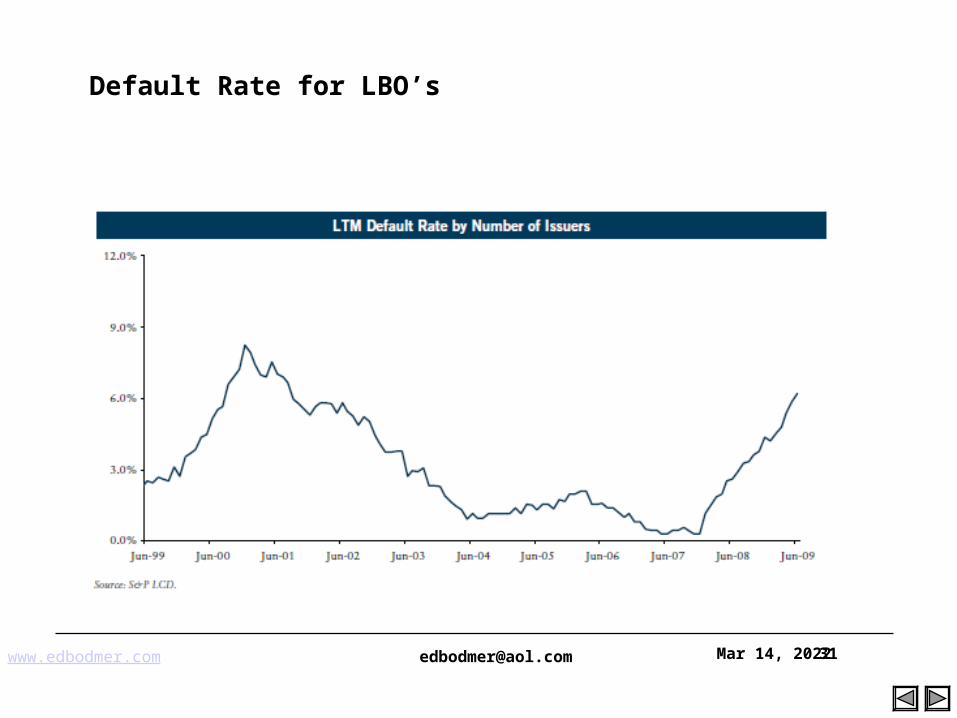
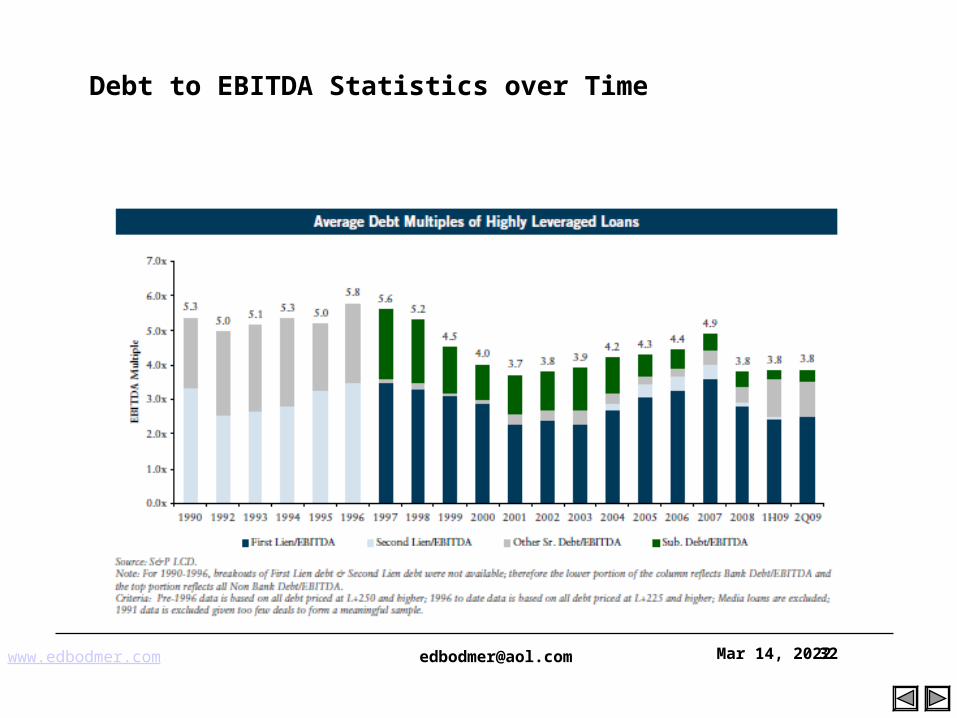
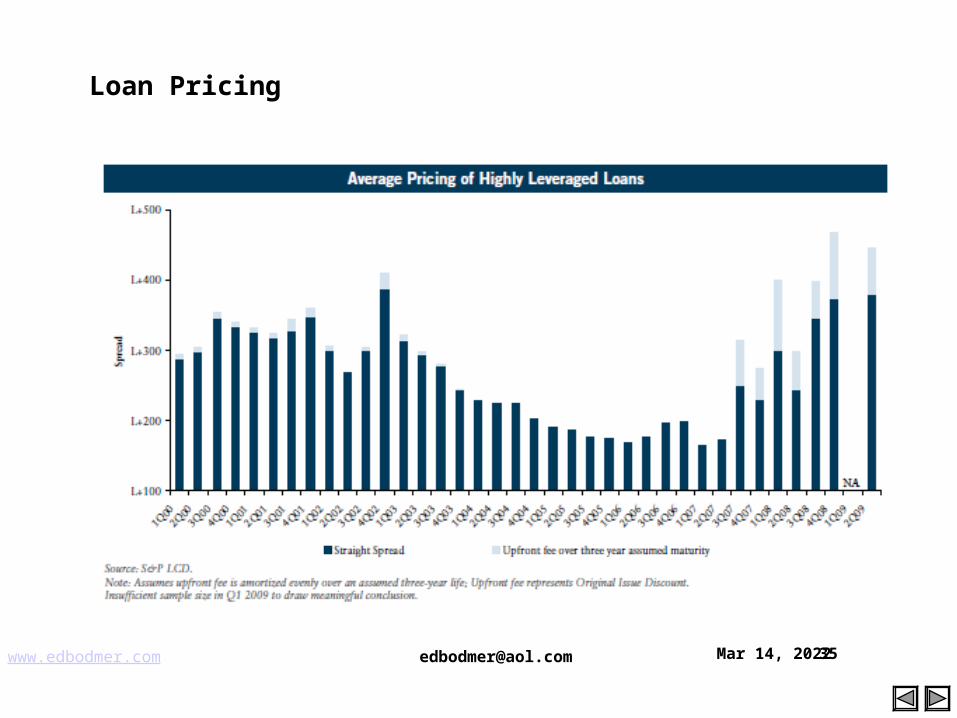
Some General LBO Statistics
www.edbodmer.com [email protected] Apr 19, 202318
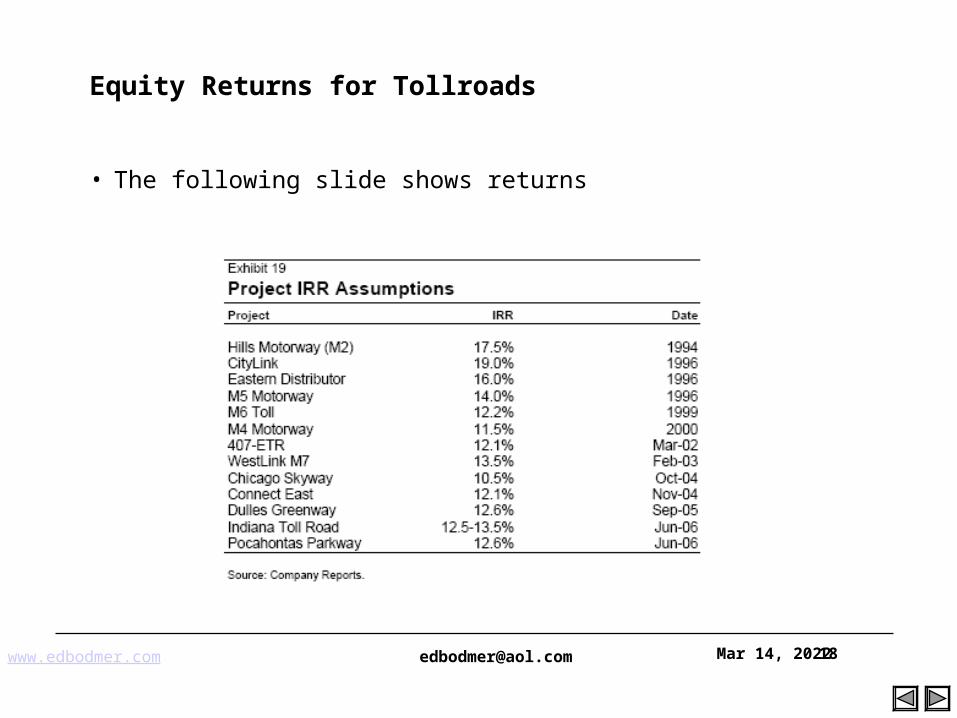
Equity Returns for Tollroads
• The following slide shows returns
www.edbodmer.com [email protected] Apr 19, 202319
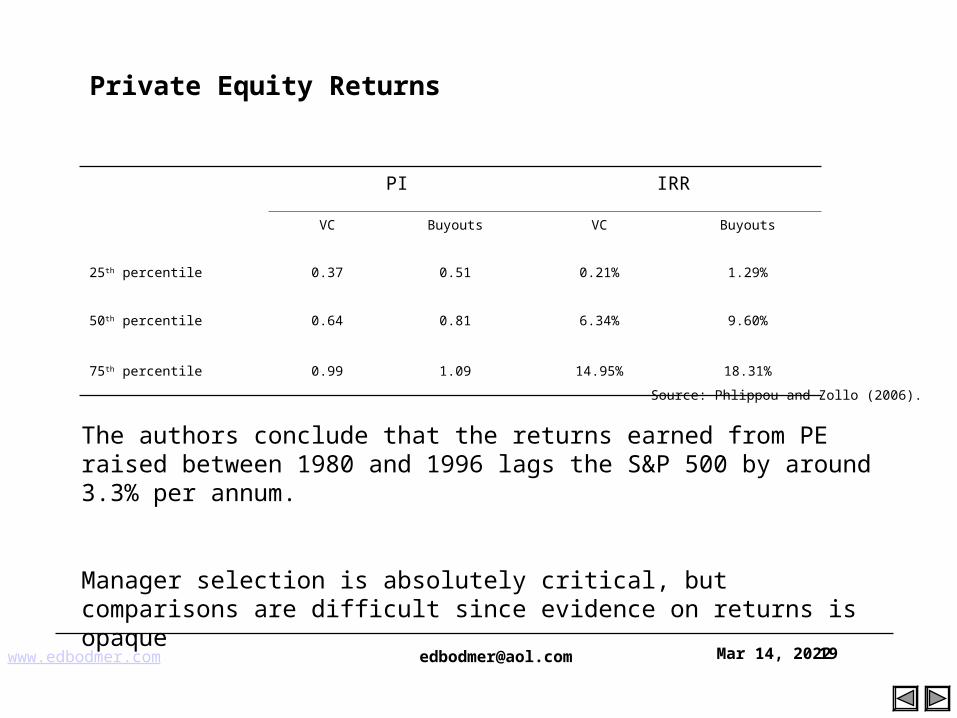
Private Equity Returns
PI IRR
VC Buyouts VC Buyouts
25th percentile 0.37 0.51 0.21% 1.29%
50th percentile 0.64 0.81 6.34% 9.60%
75th percentile 0.99 1.09 14.95% 18.31%
Source: Phlippou and Zollo (2006).
The authors conclude that the returns earned from PE raised between 1980 and 1996 lags the S&P 500 by around 3.3% per annum.
Manager selection is absolutely critical, but comparisons are difficult since evidence on returns is opaque
www.edbodmer.com [email protected] Apr 19, 202322
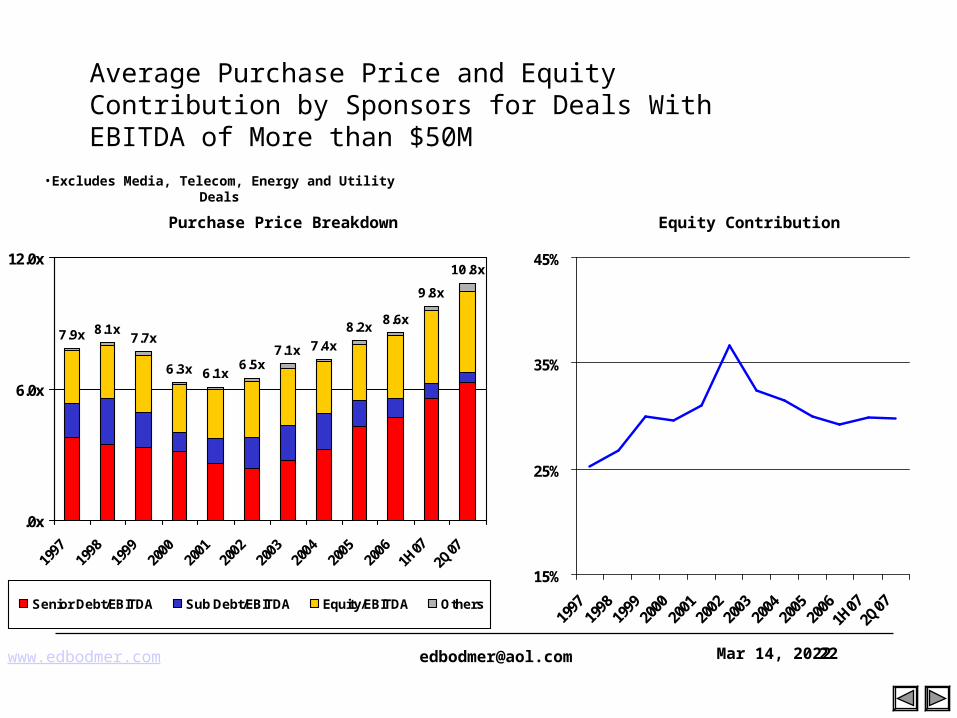
7.9x 8.1x7.7x
6.3x 6.1x6.5x
7.1x 7.4x
8.2x8.6x
9.8x
10.8x
.0x
6.0x
12.0x
1997
1998
1999
2000
2001
2002
2003
2004
2005
2006
1H072Q07
Senior Debt/EBITDA Sub Debt/EBITDA Equity/EBITDA Others
15%
25%
35%
45%
1997
1998
1999
2000
2001
2002
2003
2004
2005
2006
1H07
2Q07
Purchase Price Breakdown Equity Contribution
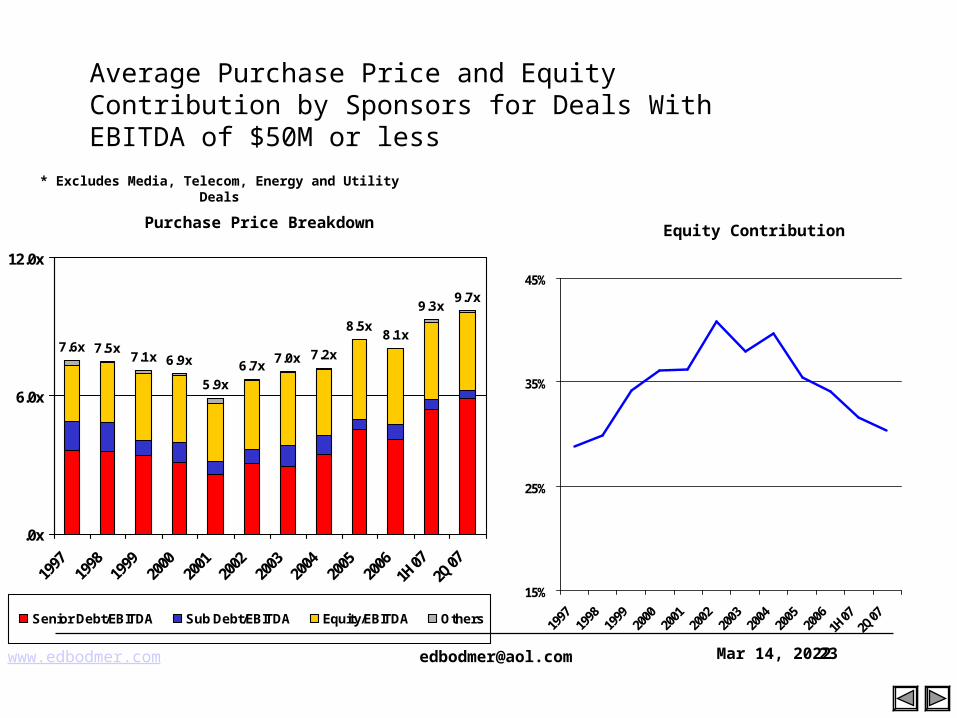
Average Purchase Price and Equity Contribution by Sponsors for Deals With EBITDA of More than $50M
•Excludes Media, Telecom, Energy and Utility Deals
www.edbodmer.com [email protected] Apr 19, 202323
7.6x 7.5x7.1x 6.9x
5.9x
6.7x7.2x
8.5x8.1x
9.3x9.7x
7.0x
.0x
6.0x
12.0x
1997
1998
1999
2000
2001
2002
2003
2004
2005
2006
1H07
2Q07
Senior Debt/EBITDA Sub Debt/EBITDA Equity/EBITDA Others
15%
25%
35%
45%
1997
1998
1999
2000
2001
2002
2003
2004
2005
2006
1H07
2Q07
Equity Contribution
* Excludes Media, Telecom, Energy and Utility Deals
Average Purchase Price and Equity Contribution by Sponsors for Deals With EBITDA of $50M or less
Purchase Price Breakdown
www.edbodmer.com [email protected] Apr 19, 202325
21
18
25
16
24
17
20
1819
15
17
13
20
16
21
19
23
17
25
17
24
21
0
5
10
15
20
25
30
1996 1997 1998 1999 2000 2001 2002 2003 2004 2005 2006
Public Private
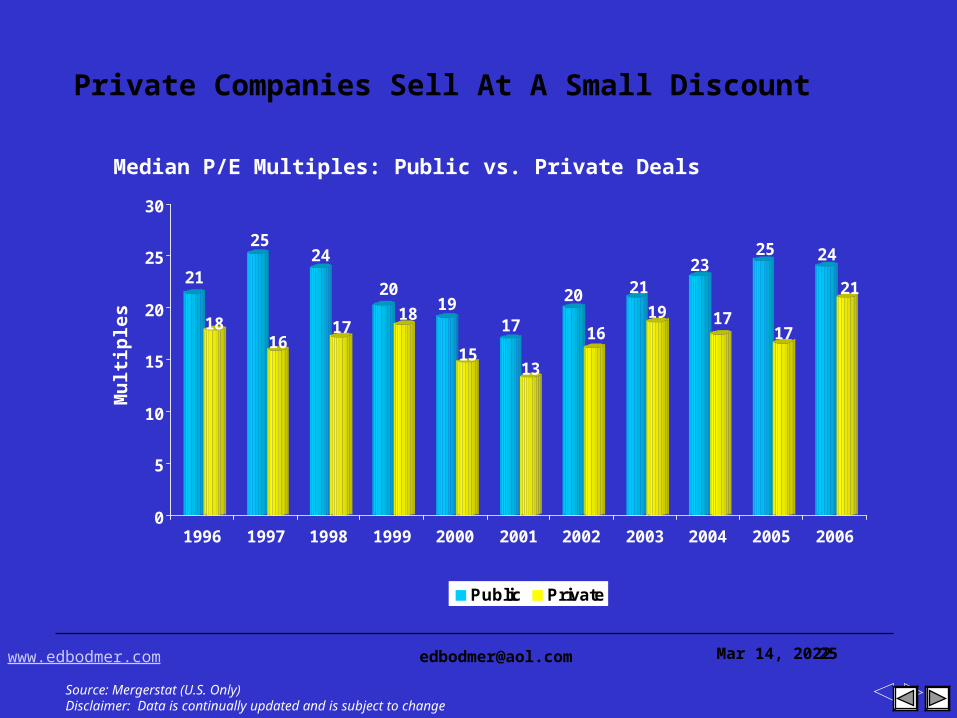
Private Companies Sell At A Small Discount
Median P/E Multiples: Public vs. Private Deals
Mu
ltip
les
Source: Mergerstat (U.S. Only)Disclaimer: Data is continually updated and is subject to change
www.edbodmer.com [email protected] Apr 19, 202326
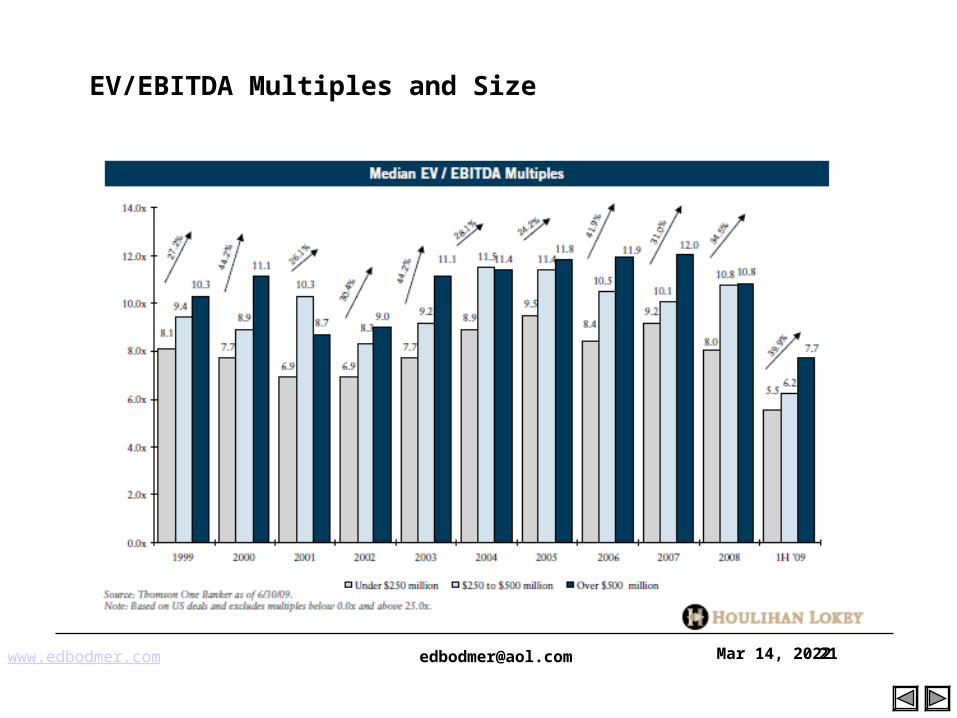
9.610.0
10.9
8.8
11.4
12.8
8.3
11.111.6
8.29.2
10.3
7.7
9.3
11.1
6.9
9.38.4
7.0
8.69.4
7.88.8
11.3
9.49.9
11.8
9.19.9
11.8
8.5
11.4 11.3
0
2
4
6
8
10
12
14
1996 1997 1998 1999 2000 2001 2002 2003 2004 2005 2006
Under $250 Million $250 to $500 Million Over $500 Million
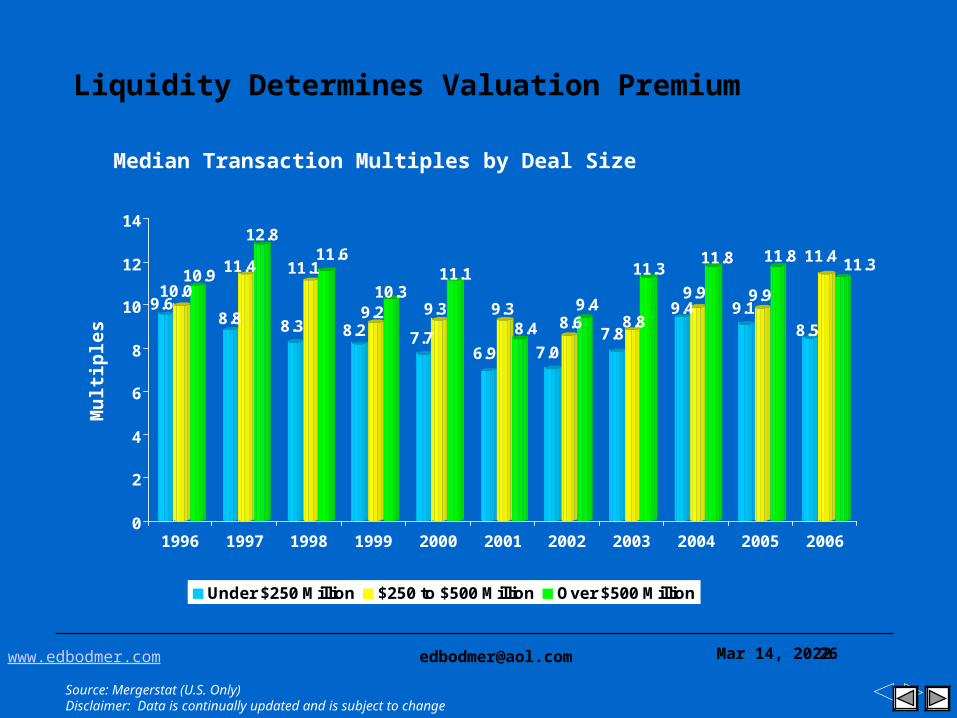
Liquidity Determines Valuation Premium
Median Transaction Multiples by Deal Size
Mu
ltip
les
Source: Mergerstat (U.S. Only)Disclaimer: Data is continually updated and is subject to change
www.edbodmer.com [email protected] Apr 19, 202327
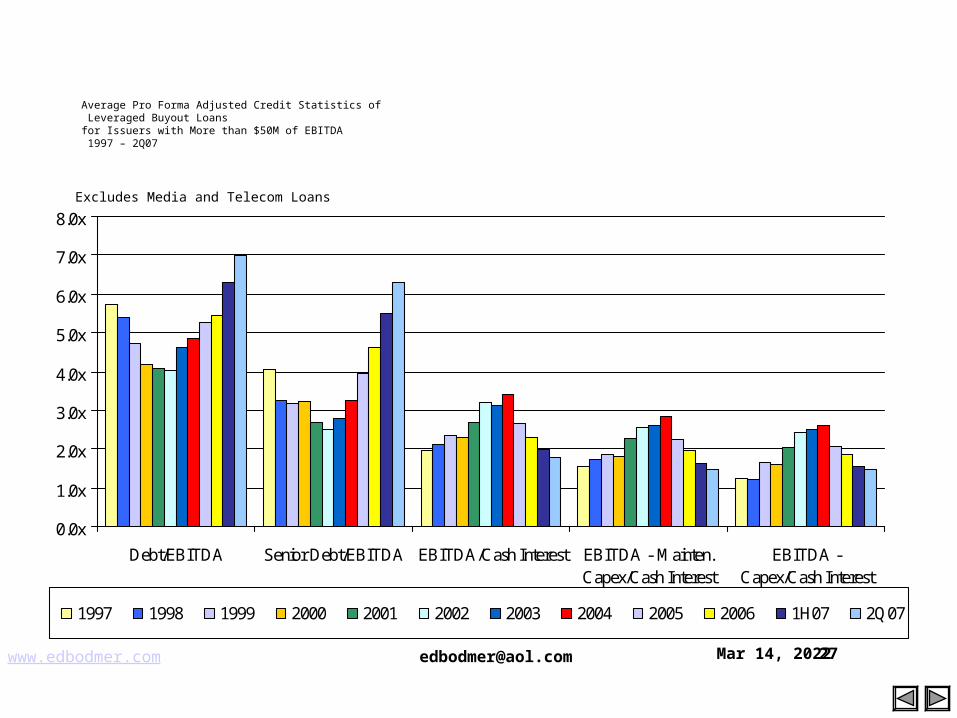
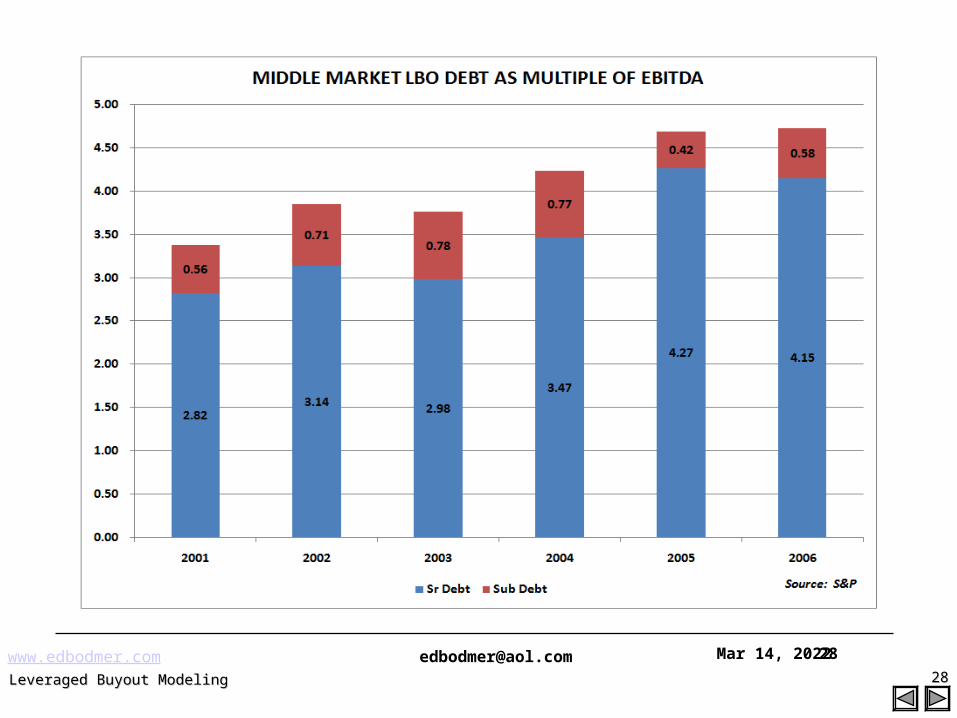
Average Pro Forma Adjusted Credit Statistics of Leveraged Buyout Loans for Issuers with More than $50M of EBITDA 1997 – 2Q07
0.0x
1.0x
2.0x
3.0x
4.0x
5.0x
6.0x
7.0x
8.0x
Debt/EBITDA Senior Debt/EBITDA EBITDA/Cash Interest EBITDA - Mainten.Capex/Cash Interest
EBITDA -Capex/Cash Interest
1997 1998 1999 2000 2001 2002 2003 2004 2005 2006 1H07 2Q07
Excludes Media and Telecom Loans
www.edbodmer.com [email protected] Apr 19, 202328
Leveraged Buyout ModelingLeveraged Buyout Modeling 2828
www.edbodmer.com [email protected] Apr 19, 202333
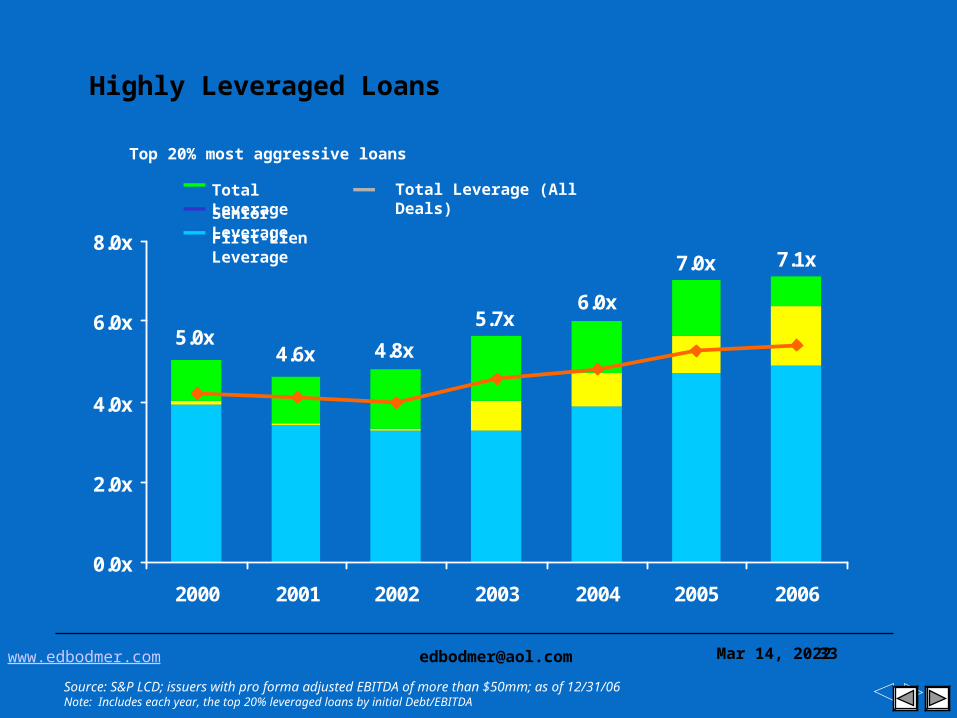
Source: S&P LCD; issuers with pro forma adjusted EBITDA of more than $50mm; as of 12/31/06Note: Includes each year, the top 20% leveraged loans by initial Debt/EBITDA
7.1x7.0x
6.0x5.7x
4.6x5.0x
4.8x
0.0x
2.0x
4.0x
6.0x
8.0x
2000 2001 2002 2003 2004 2005 2006
Top 20% most aggressive loans
Total Leverage
Senior Leverage
First-Lien Leverage
Total Leverage (All Deals)
Highly Leveraged Loans
www.edbodmer.com [email protected] Apr 19, 202334
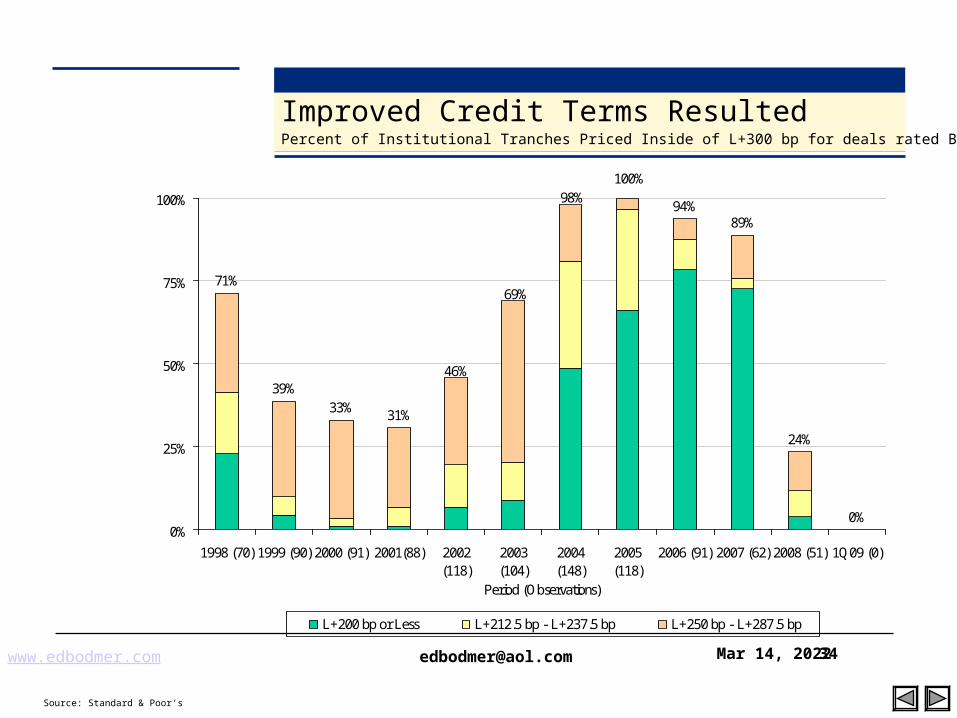
Improved Credit Terms ResultedPercent of Institutional Tranches Priced Inside of L+300 bp for deals rated BB- or higher
Source: Standard & Poor‘s
71%
39%33%
31%
94%89%
24%
0%
98%100%
69%
46%
0%
25%
50%
75%
100%
1998 (70) 1999 (90) 2000 (91) 2001(88) 2002(118)
2003(104)
2004(148)
2005(118)
2006 (91) 2007 (62) 2008 (51) 1Q09 (0)
Period (Observations)
L+200 bp or Less L+212.5 bp - L+237.5 bp L+250 bp - L+287.5 bp
www.edbodmer.com [email protected] Apr 19, 202336
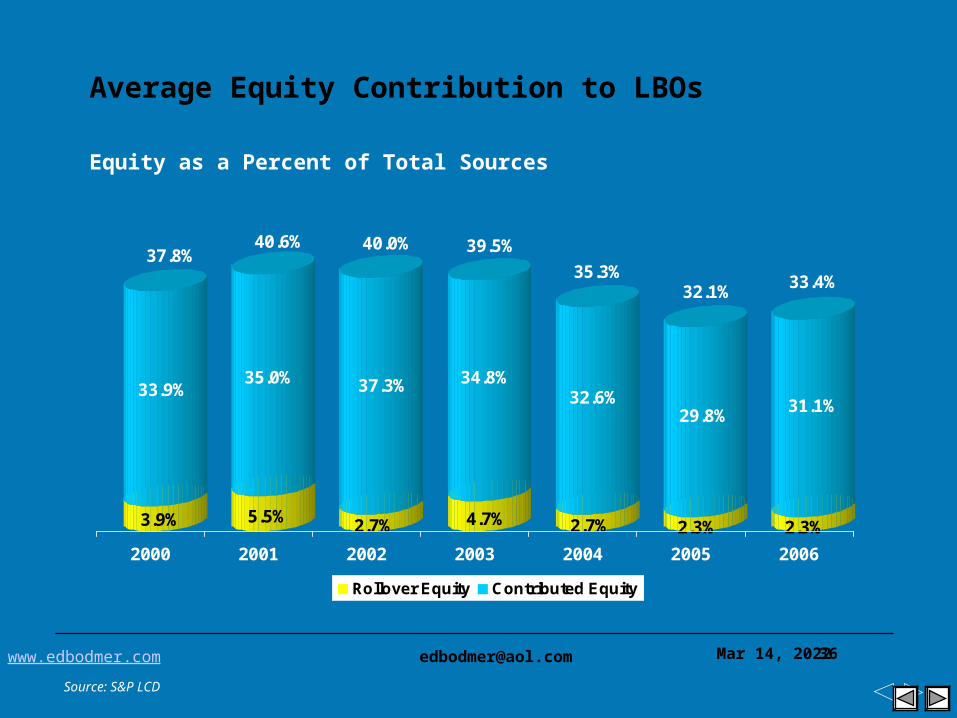
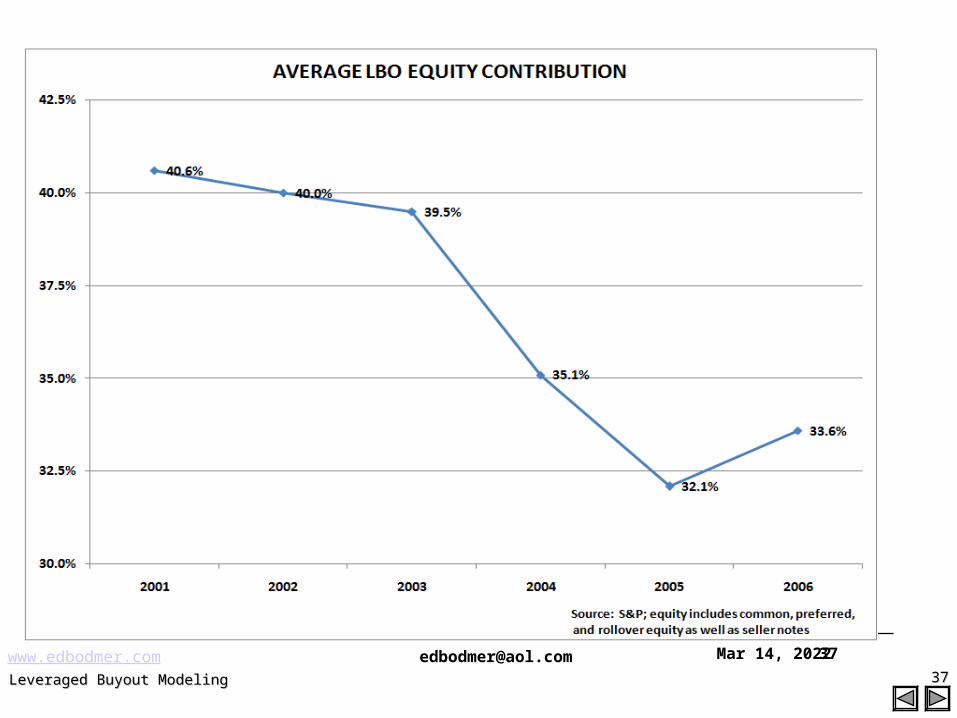
Average Equity Contribution to LBOs
Source: S&P LCD
3.9%
33.9%
37.8%
5.5%
35.0%
40.6%
2.7%
37.3%
40.0%
4.7%
34.8%
39.5%
2.7%
32.6%
35.3%
2.3%
29.8%
32.1%
2.3%
31.1%
33.4%
2000 2001 2002 2003 2004 2005 2006
Rollover Equity Contributed Equity
Equity as a Percent of Total Sources
www.edbodmer.com [email protected] Apr 19, 202337
Leveraged Buyout ModelingLeveraged Buyout Modeling 3737
www.edbodmer.com [email protected] Apr 19, 202338
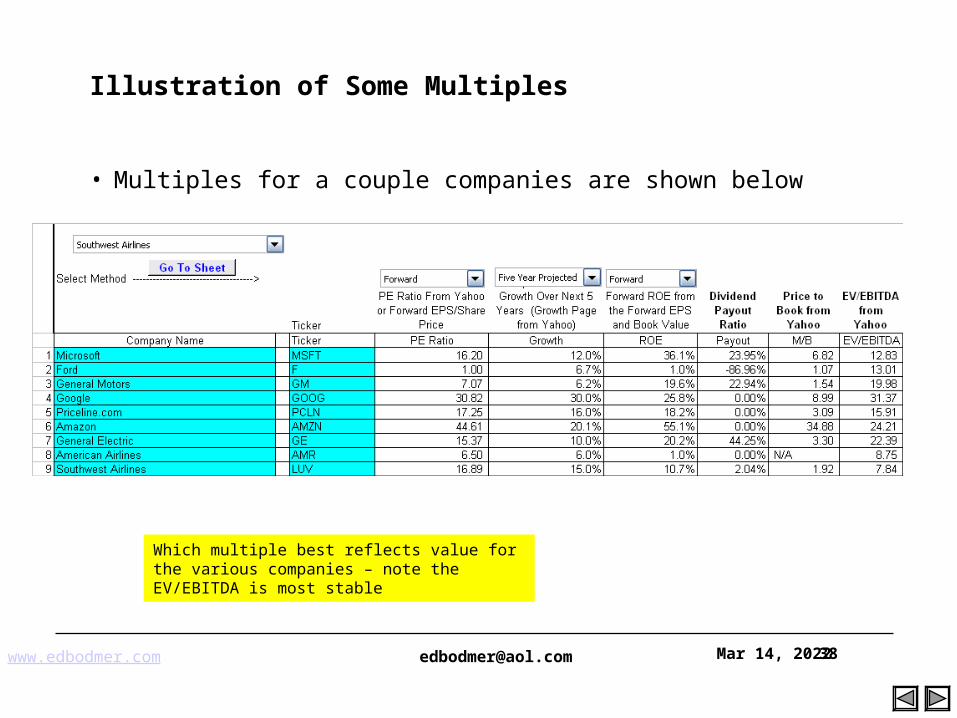
Illustration of Some Multiples
• Multiples for a couple companies are shown below
Which multiple best reflects value for the various companies – note the EV/EBITDA is most stable
www.edbodmer.com [email protected] Apr 19, 202339
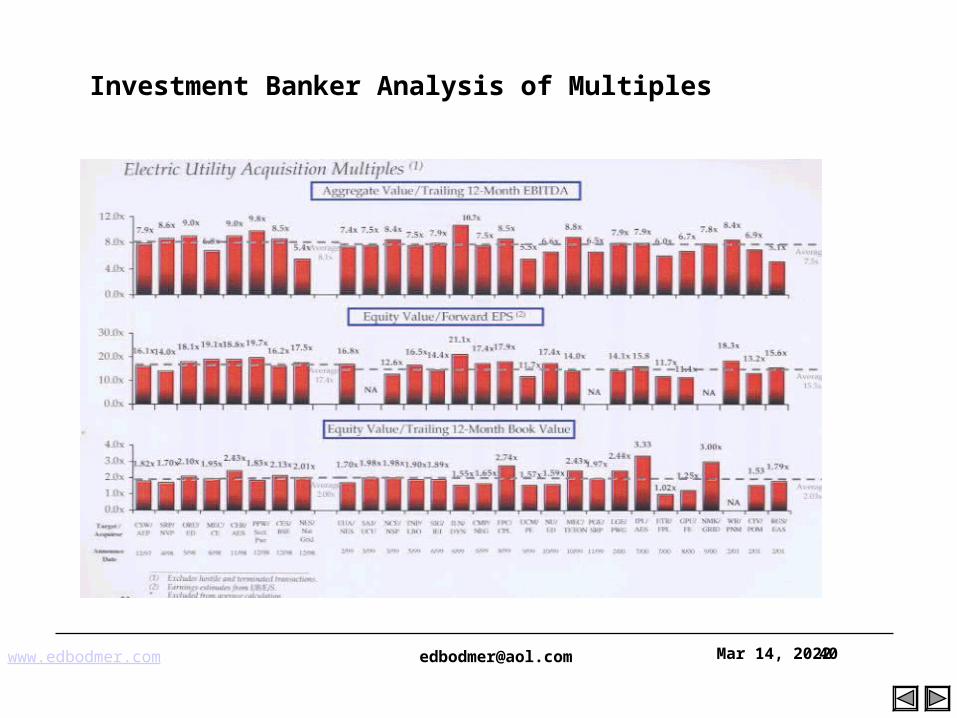
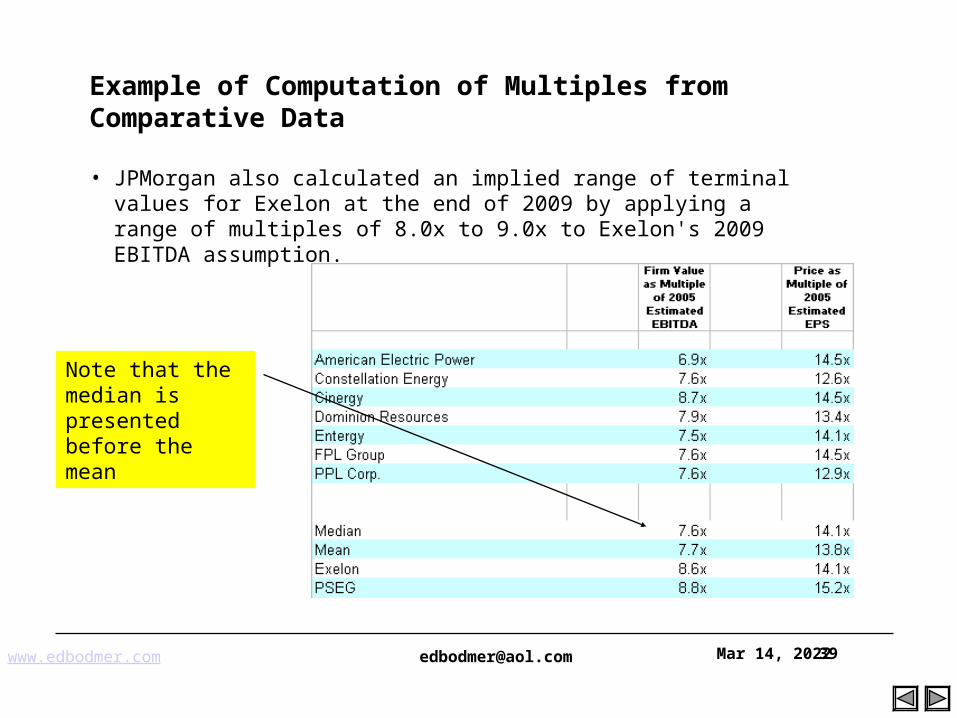
Example of Computation of Multiples from Comparative Data
• JPMorgan also calculated an implied range of terminal values for Exelon at the end of 2009 by applying a range of multiples of 8.0x to 9.0x to Exelon's 2009 EBITDA assumption.
Note that the median is presented before the mean
www.edbodmer.com [email protected] Apr 19, 202342
Private Equity Market
• global fundraising from since 1998 estimated at more than $1,000 billion
• US represents about two-thirds
• Europe represents about one-quarter; not much left for the rest of the world, but some signs that the focus is spreading East
• about two-thirds of the equity raised for private equity is devoted to buy-outs (in both Europe and US)
• but these are highly leveraged – often with only 30% equity in capital structure; so the value of transactions is much larger than the equity figures suggest
• money is pouring into buy-out funds: $96 billion was committed to US funds alone in the first half of 2006
• funds are getting bigger: Blackstone recently raised a $15.6 billion fund; TPG raised $15 billion; Permira raised €11 billion …
• secondary deals are on the rise: in 2005, 28% of all buy-out deals were between PE houses, amounting to over $100 billion (Dealogic)

Merger and Acquisition Modelling Apr 19, 2023 43
Debt Capacity
www.edbodmer.com [email protected] Apr 19, 202344
Computation of Debt Capacity
• Computation of debt capacity cannot be reduced to a simple formula:
• Re-calculate the debt capacity under many scenarios.
• Stress tests should include price and volume pressure resulting from unfavorable competitive or macro-economic pressures.
• Need assurance on cash flows in the first couple of years.
• The debt is an important signal along with the equity investment of managers.
• LBO financing is expressed in terms of debt to EBITDA
• Secured financing
•3 x EBITDA
• High yield
•2.5 to 3.5 x EBITDA Incremental
• Equity
•1.5 to 2 x EBITDA
• Total Transaction Value
•7 to 8 x EBITDA
www.edbodmer.com [email protected] Apr 19, 202345
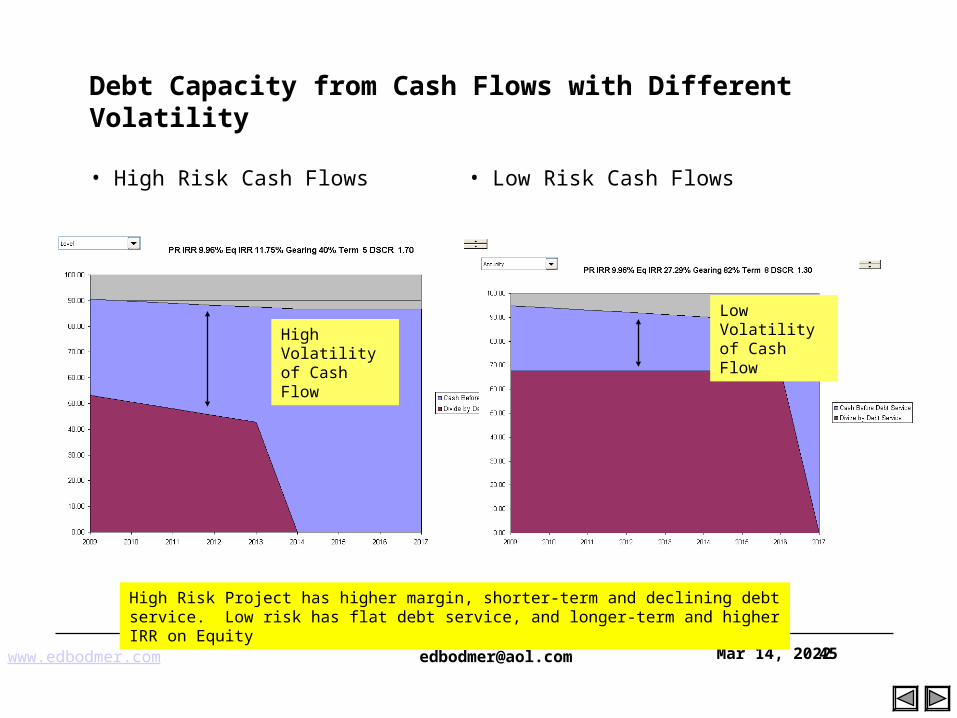
Debt Capacity from Cash Flows with Different Volatility
• High Risk Cash Flows • Low Risk Cash Flows
High Risk Project has higher margin, shorter-term and declining debt service. Low risk has flat debt service, and longer-term and higher IRR on Equity
High Volatility of Cash Flow
Low Volatility of Cash Flow
www.edbodmer.com [email protected] Apr 19, 202346
Debt Capacity Method
• Balance sheet approach
• Market value of debt as percentage of market value of the firm
• Compare with industry average
• Free cash flow approach
• Is there enough cash flow to pay more interest comfortably?
• How much more interest?
• How much more debt?
• Debt/EDITDA, EBIT/Interest, other measures
www.edbodmer.com [email protected] Apr 19, 202347
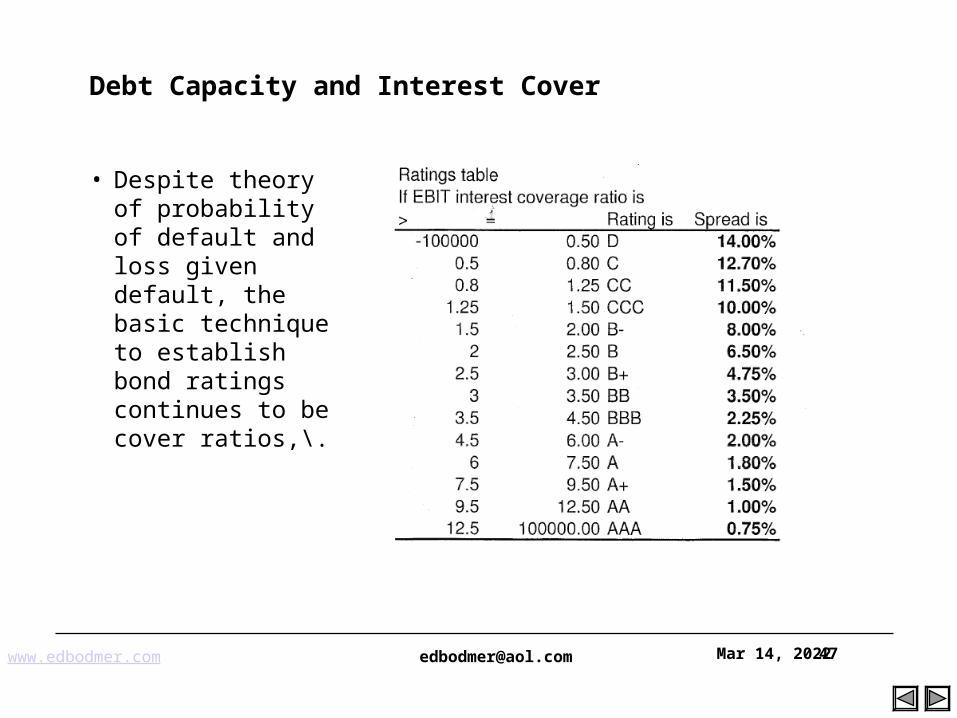
Debt Capacity and Interest Cover
• Despite theory of probability of default and loss given default, the basic technique to establish bond ratings continues to be cover ratios,\.
www.edbodmer.com [email protected] Apr 19, 202348
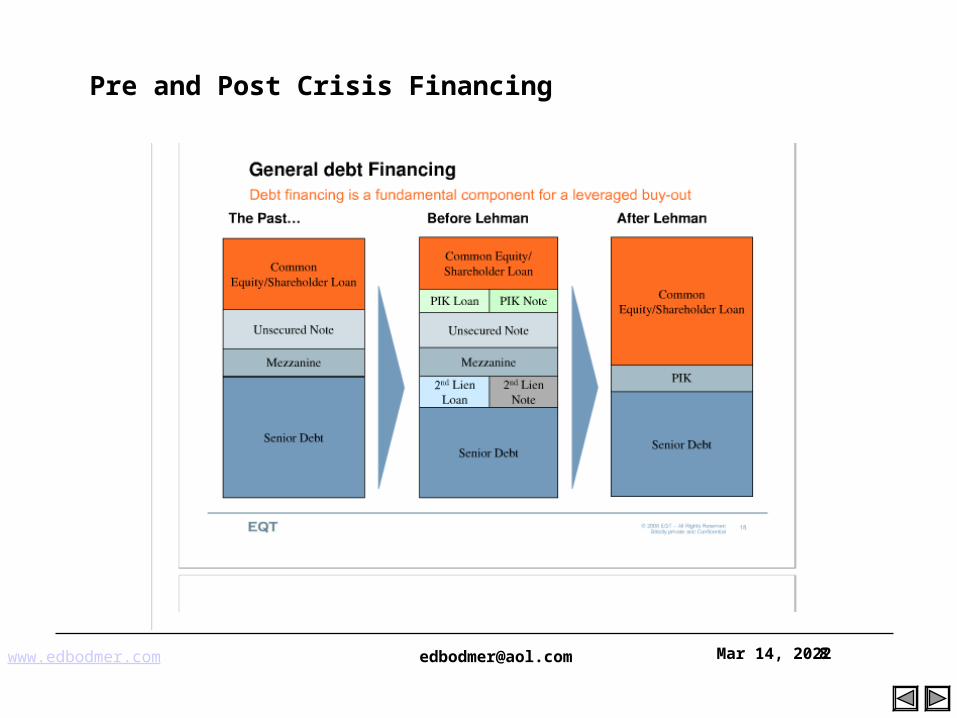
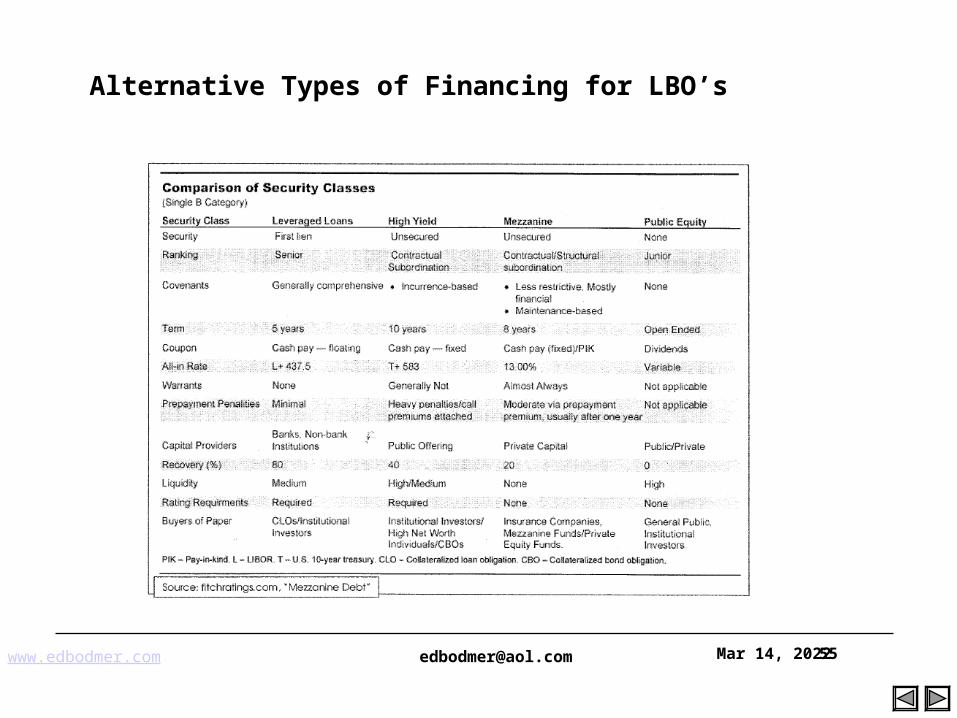
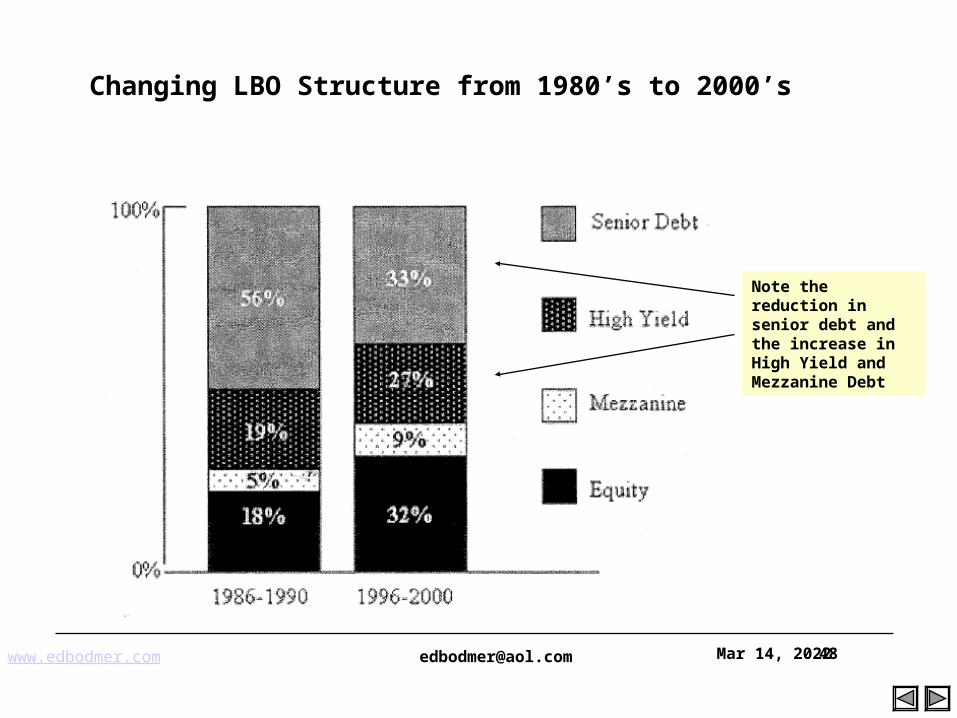
Changing LBO Structure from 1980’s to 2000’s
Note the reduction in senior debt and the increase in High Yield and Mezzanine Debt
www.edbodmer.com [email protected] Apr 19, 202349
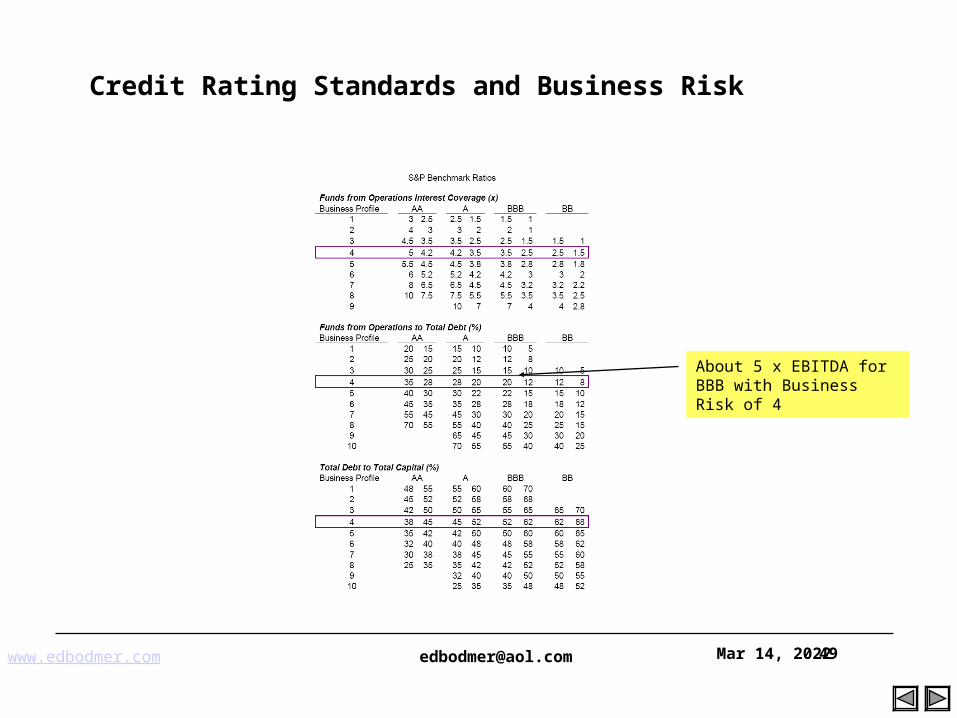
Credit Rating Standards and Business Risk
About 5 x EBITDA for BBB with Business Risk of 4
Merger and Acquisition Modelling Apr 19, 2023 50
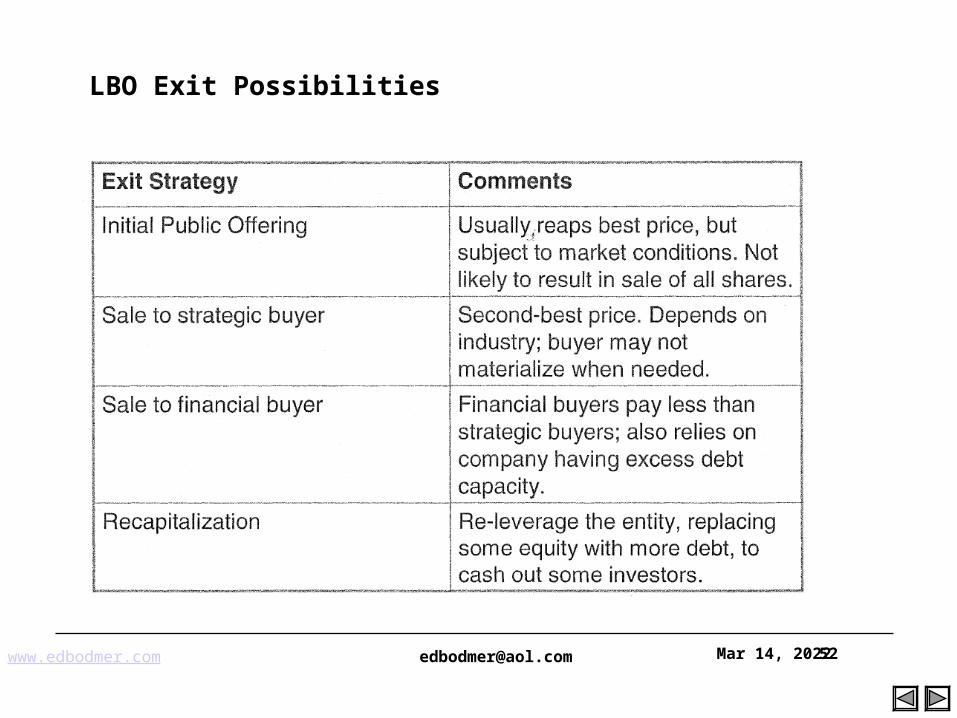
LBO Exit
www.edbodmer.com [email protected] Apr 19, 202351
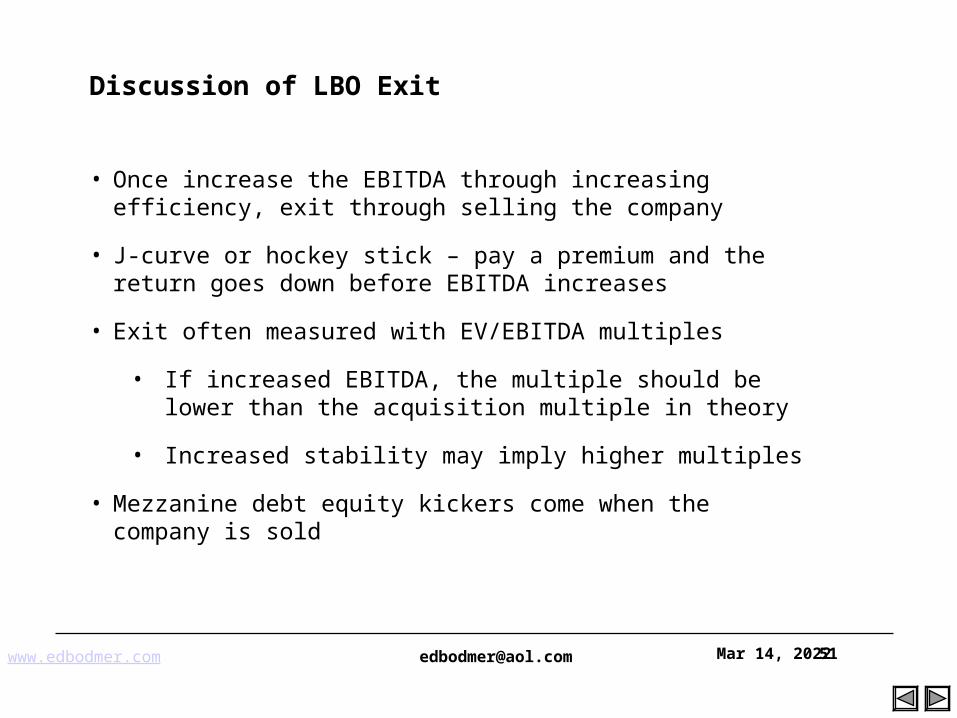
Discussion of LBO Exit
• Once increase the EBITDA through increasing efficiency, exit through selling the company
• J-curve or hockey stick – pay a premium and the return goes down before EBITDA increases
• Exit often measured with EV/EBITDA multiples
• If increased EBITDA, the multiple should be lower than the acquisition multiple in theory
• Increased stability may imply higher multiples
• Mezzanine debt equity kickers come when the company is sold
www.edbodmer.com [email protected] Apr 19, 202353
Splitting Terminal Value
• Provide Incentives to management
• Hurdle rate of return
• Sharing of Excess Return
• Use future value factors
• Complex when multiple cash inflows rather than a single cash inflow

Merger and Acquisition Modelling Apr 19, 2023 54
Subordinated Debt
www.edbodmer.com [email protected] Apr 19, 202356
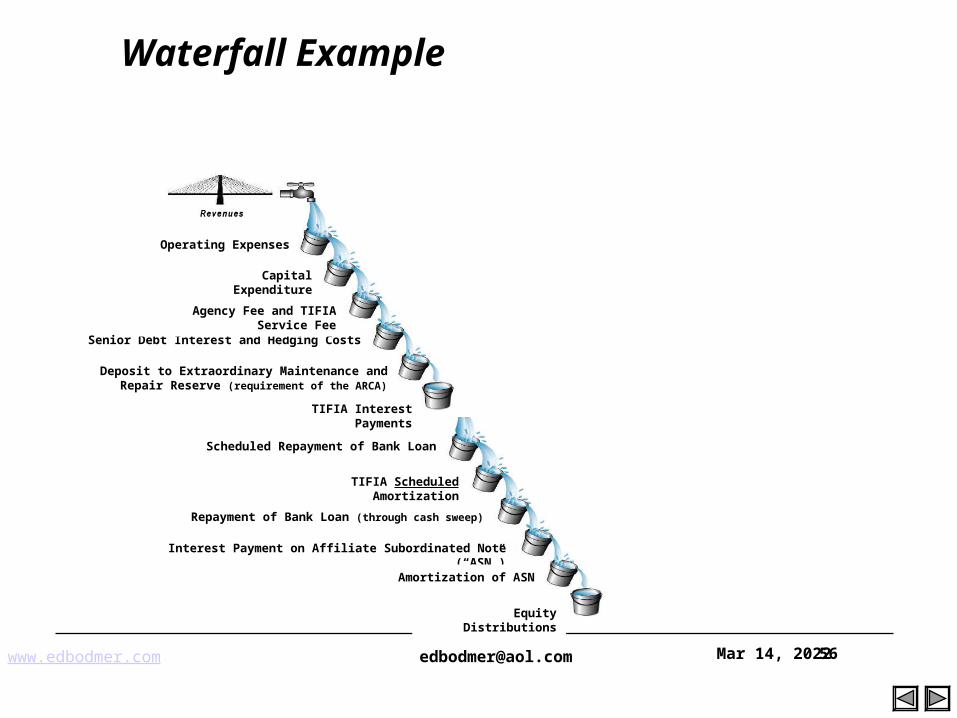
Waterfall Example
Operating Expenses
Capital Expenditure
TIFIA Interest Payments
TIFIA Scheduled Amortization
Senior Debt Interest and Hedging Costs
Scheduled Repayment of Bank Loan
Repayment of Bank Loan (through cash sweep)
Equity Distributions
Agency Fee and TIFIA Service Fee
Deposit to Extraordinary Maintenance and Repair Reserve (requirement of the ARCA)
Interest Payment on Affiliate Subordinated Note (“ASN”)
Amortization of ASN
www.edbodmer.com [email protected] Apr 19, 202357
Payment in Kind Notes
• PIK notes are fixed-income securities that pay interest in the form of additional bonds rather than cash. Like zero-coupon bonds, they give a company breathing room before having to make cash outlays, offering in return rich yields.
• Example: In 2005, Wornick Co., a Cincinnati supplier of packaged meals controlled by Veritas Capital Fund, raised $26 million in 13.875% senior PIK notes through CIBC World Markets. Some deals are floaters: Innophos's 10-year, noncaii-2 notes were priced to yield 800 bp over LIBOR.
• Some PIKs have the added risk of being issued at the holding company level, meaning they are subordinated and rely on a stream of cash from the operating company to pay them down.
• PIK notes tend to receive ratings at the lower tier of the junk spectrum. Examples: the Norcross deal was rated Caal/B-; Warner Music and K&F were rated Caa2/B-; and Innophos came at B3/B-.
www.edbodmer.com [email protected] Apr 19, 202358
Mezzanine Debt
• Mezzanine debt is issued with a cash pay interest rate of 12 to 12 1/2 percent and a maturity ranging from five to seven years.
• The remainder of the required 18 to 20 percent all-in-return consists of warrants to buy common stock, which the investor values based on the outlook of the company, or incremental interest paid on a "pay-in-kind" or PIK basis.
• The fee for raising the money runs between two and three percent of the transaction.
• Deal sizes typically range from three million to $25 million but can go as high as $150 million.
• Source: Bank of America
www.edbodmer.com [email protected] Apr 19, 202359
Mezzanine Debt
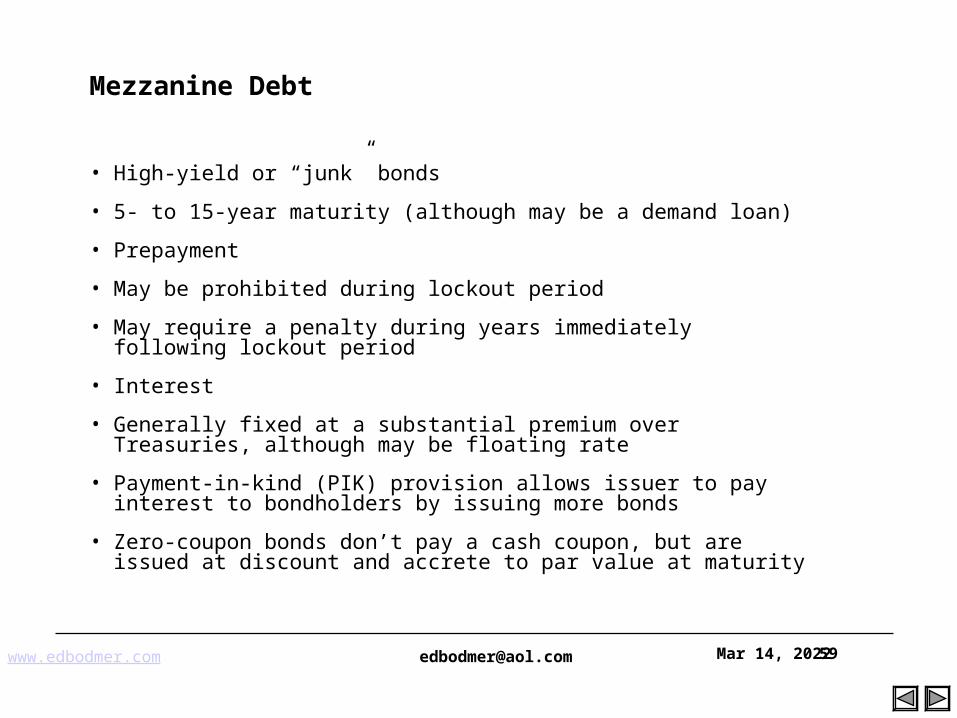
• High-yield or “junk” bonds
• 5- to 15-year maturity (although may be a demand loan)
• Prepayment
• May be prohibited during lockout period
• May require a penalty during years immediately following lockout period
• Interest
• Generally fixed at a substantial premium over Treasuries, although may be floating rate
• Payment-in-kind (PIK) provision allows issuer to pay interest to bondholders by issuing more bonds
• Zero-coupon bonds don’t pay a cash coupon, but are issued at discount and accrete to par value at maturity
www.edbodmer.com [email protected] Apr 19, 202360
Issuers of High Yield Bonds
• "Fallen angels" are the classic issuer of junk bonds. These are former investment-grade companies that are experiencing hard times, which cause their credit to drop from investment-grade to lower ratings.
• "Rising stars" are emerging companies that have not yet achieved the operational history, the size or the capital strength required to receive an investment-grade rating. These companies may turn to the bond market to obtain seed capital. A start-up company that qualifies for a single-B rating should have about the same risk level as a going concern with the same rating.
• High-debt companies (which may be blue chip in size and revenues) leveraged with above-average debt loads that may cause concern among rating agencies. Leveraged buyouts (LB0s) create a special type of company that typically uses high-yield bonds to buy a public corporation from its shareholders.
• Capital-intensive companies turn to the high-yield market when they are not able to finance all their capital needs through earnings or bank borrowings. For example, cable TV companies require large amounts of capital to acquire, expand or upgrade their systems.
• Foreign governments and foreign corporations, often less familiar to domestic investors, may rely on high-yield bonds to attract capital.
www.edbodmer.com [email protected] Apr 19, 202361
Covenants and Events of Default for High Yield Debt
• High yield bonds have a "standard" covenant package intended to maintain the credit quality of the issuer and its group and the unencumbered movement of cash up the issuer's group and ensure that the issuer deals on an arm's length basis with its group companies. The covenants will include limitations on the ability of the issuer and other group companies from
• incurring further indebtedness,
• making certain "restricted payments" (such as dividends and other distributions to shareholders, intra-group loan repayments and investments)
• asset transfers
• granting liens over its property and assets
• entering into non-arm's length transactions with group companies.
• "Events of default" include any default in the payment of principal or interest (usually following a specified grace period), any breach of covenant and the instigation of insolvency or other related proceedings against the issuer or the group.
www.edbodmer.com [email protected] Apr 19, 202362
Spreads on High Yield Bonds
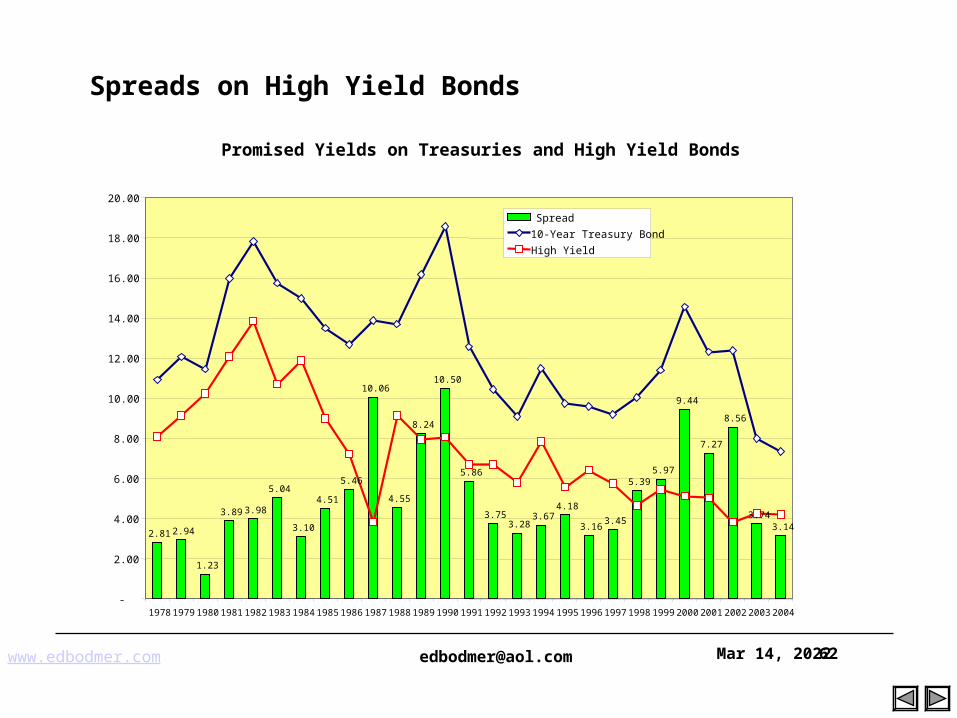
Promised Yields on Treasuries and High Yield Bonds
2.81 2.94
1.23
3.89 3.98
5.04
3.10
4.51
5.46
10.06
4.55
8.24
10.50
5.86
3.753.28
3.674.18
3.163.45
5.395.97
9.44
7.27
8.56
3.743.14
-
2.00
4.00
6.00
8.00
10.00
12.00
14.00
16.00
18.00
20.00
1978 1979 1980 1981 1982 1983 1984 1985 1986 1987 1988 1989 1990 1991 1992 1993 1994 1995 1996 1997 1998 1999 2000 2001 2002 2003 2004
Spread
10-Year Treasury Bond
High Yield
www.edbodmer.com [email protected] Apr 19, 202364
Buyouts and Real Estate
• CI Buyout shops like The Blackstone Group, Permira, Apollo and CVC Capital Partners have long coveted real estate because they can use the buildings as guarantees against hefty bank loans.
• Rich property assets were one of the main drivers behind the leveraged acquisition of U.S.-based toy retailer Toys R Us Valuable real estate has also driven most of Europe's big retail deals in the past two years, with department stores Selfridges, Debenhams, Harvey Nichols, Bhs and Arcadia all taken private.
• Another factor luring private financiers to property is the expected introduction of real estate investment trusts, or REITs. REITs are listed property funds which can carry out their investment activities tax free provided they pay out a high proportion of their profits in the form of taxable dividends.

Merger and Acquisition Modelling Apr 19, 2023 65
Buyout Examples
www.edbodmer.com [email protected] Apr 19, 202366
LBO Example – Michaels Stores
• It was a buyout deal that tested the outer limits of leverage. In June of 2006, Bain Capital LLC and Blackstone Group LP acquired arts and crafts retailer Michaels Stores Inc., known for its knitting, beading and framing supplies, for $6.3 billion. The sponsors put in $2.18 billion in equity, paying a rich multiple of 11.7 times Ebitda for the chain.
• In making their pitch to finance providers, Michaels' sponsors lobbied for flexibility, portraying the largest crafts supply chain in the U.S. as a category killer, with few competitors that could match its scale. Michaels operates about 900 stores in North America, plus other art and design outlets. The debt markets eventually agreed to a "covenant lite" structure. Financing came at a steep 9.3 times debt-to-Ebitda ratio that levels off to 7.5 times before expenses and other charges.
• The leverage, however, leaves Michaels with little room for error to meet interest payments. Coming out of the deal, Michaels' interest coverage ratio -- its Ebitda relative to interest expenses -- is only 1.3 times, where a ratio below 1 means negative cash flow. While the company purports to have strong free cash flow projections without relying on huge capital expenditures, its coverage ratio would be considered tight by historical standards.
www.edbodmer.com [email protected] Apr 19, 202367
LBO Example – RJR Nabisco
• the $31.3 billion LBO of RJR Nabisco by Kohlberg Kravis Roberts & Co. The RJR deal carried such a large debt load that the interest expense and capital expenditures actually topped RJR's cash flow.
• Many other LBO'd companies back then were smaller, marginal businesses that took on too much debt and then collapsed as soon as the economy slowed.
• http://www.youtube.com/watch?v=GNEQyKvbsX4
www.edbodmer.com [email protected] Apr 19, 202368
LBO example – Toys R Us
• Toys "R" Us is among those deals with exceptionally high debt multiples, close to 8 times debt to Ebitda, and a significant proportion of bridge debt is in its capital structure. Toys was purchased in June 2005 for about $8 billion in a buyout by KKR, Bain Capital LLC and the country's largest real estate investment trust, Vornado Realty Trust. The toy retailer got a B- rating from S&P because it is in an intensely competitive industry and its total debt -- about $8 billion -- is high. Sales in the U.S. have been soft, and its business is extremely seasonal, analysts say. Cash flow comes pretty much from the fourth- quarter holiday season, although its less seasonal Babies "R" Us unit has become a bigger part of the business. As of its fiscal year ended Jan. 28, its $777 million Ebitda barely covers interest expenses and capex of about $718 million. That equates to roughly a 1.1 ratio.
www.edbodmer.com [email protected] Apr 19, 202369
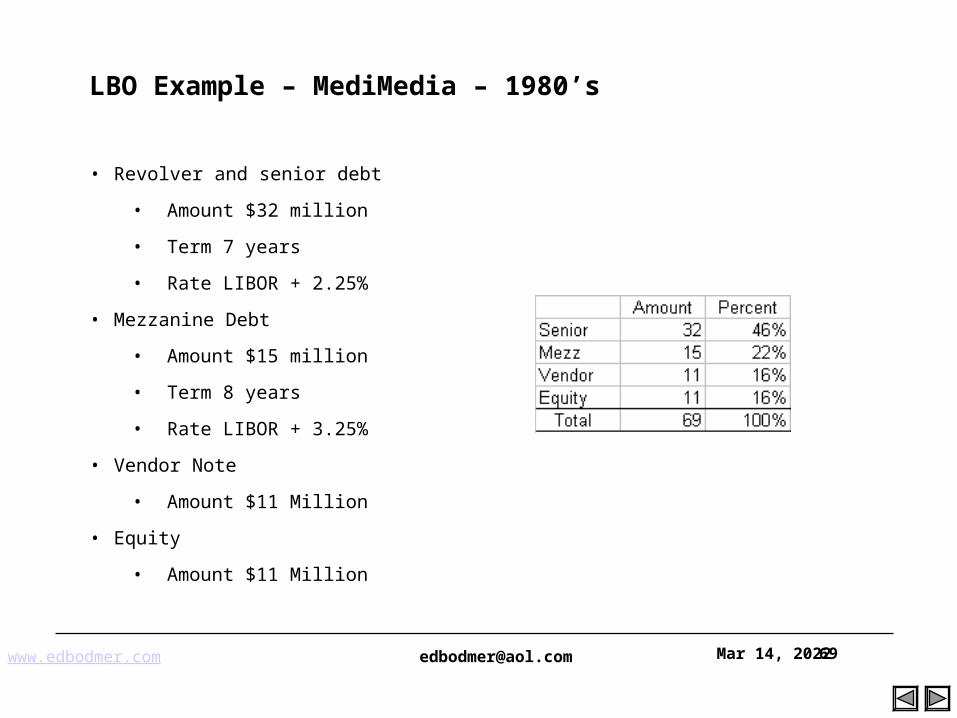
LBO Example – MediMedia – 1980’s
• Revolver and senior debt
• Amount $32 million
• Term 7 years
• Rate LIBOR + 2.25%
• Mezzanine Debt
• Amount $15 million
• Term 8 years
• Rate LIBOR + 3.25%
• Vendor Note
• Amount $11 Million
• Equity
• Amount $11 Million
www.edbodmer.com [email protected] Apr 19, 202370
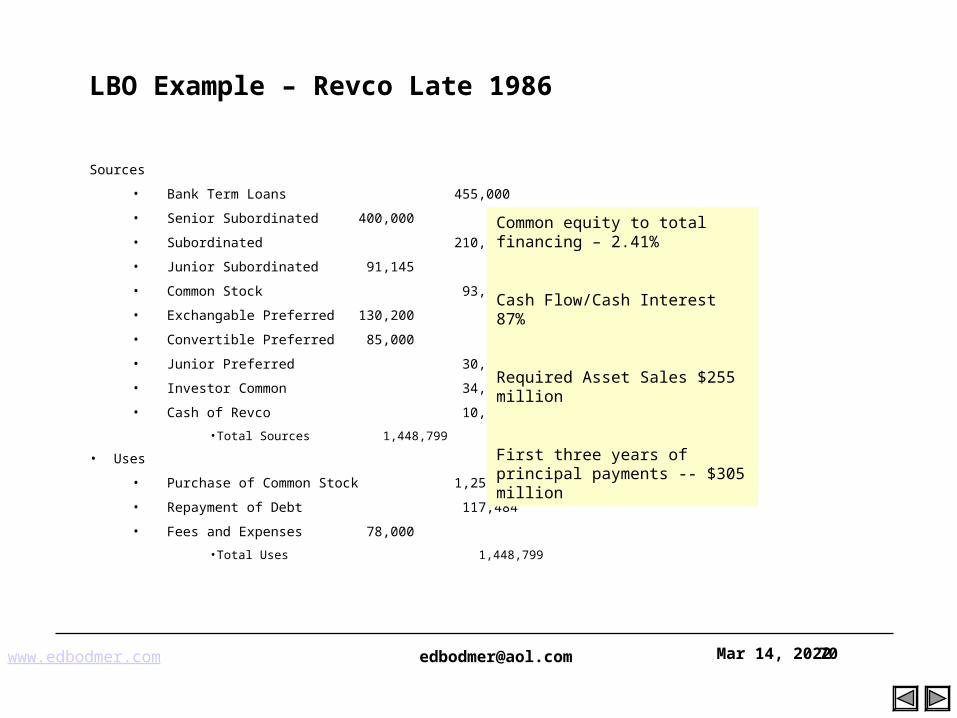
LBO Example – Revco Late 1986
Sources
• Bank Term Loans 455,000
• Senior Subordinated 400,000
• Subordinated 210,000
• Junior Subordinated 91,145
• Common Stock 93,750
• Exchangable Preferred 130,200
• Convertible Preferred 85,000
• Junior Preferred 30,098
• Investor Common 34,276
• Cash of Revco 10,655
•Total Sources 1,448,799
• Uses
• Purchase of Common Stock 1,253,315
• Repayment of Debt 117,484
• Fees and Expenses 78,000
•Total Uses 1,448,799
Common equity to total financing – 2.41%
Cash Flow/Cash Interest 87%
Required Asset Sales $255 million
First three years of principal payments -- $305 million
www.edbodmer.com [email protected] Apr 19, 202371
LBO Example – Revco Drug Stores
• Poor stock performance before the LBO
• Taken private at $1.4 billion in 1986 – one of the largest LBO’s
• Premium of 48% compared to year earlier stock price
• Complex capital structure with 9 layers of debt and preferred stock
• Collapsed 19 months after going private
• Maintained capital expenditures
www.edbodmer.com [email protected] Apr 19, 202372
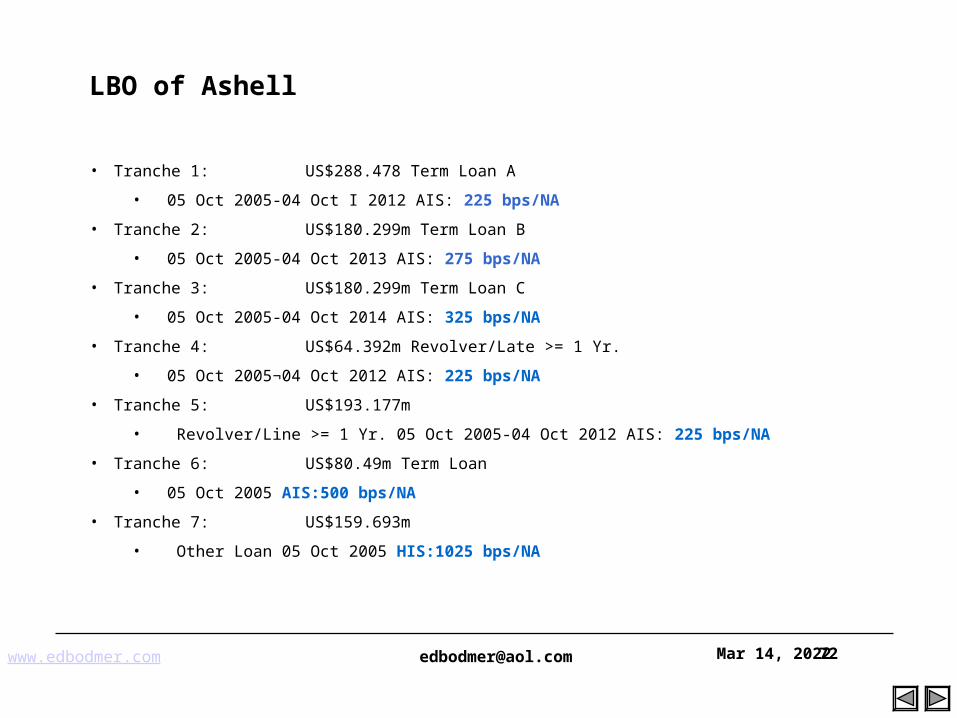
LBO of Ashell
• Tranche 1: US$288.478 Term Loan A
• 05 Oct 2005-04 Oct I 2012 AIS: 225 bps/NA
• Tranche 2: US$180.299m Term Loan B
• 05 Oct 2005-04 Oct 2013 AIS: 275 bps/NA
• Tranche 3: US$180.299m Term Loan C
• 05 Oct 2005-04 Oct 2014 AIS: 325 bps/NA
• Tranche 4: US$64.392m Revolver/Late >= 1 Yr.
• 05 Oct 2005¬04 Oct 2012 AIS: 225 bps/NA
• Tranche 5: US$193.177m
• Revolver/Line >= 1 Yr. 05 Oct 2005-04 Oct 2012 AIS: 225 bps/NA
• Tranche 6: US$80.49m Term Loan
• 05 Oct 2005 AIS:500 bps/NA
• Tranche 7: US$159.693m
• Other Loan 05 Oct 2005 HIS:1025 bps/NA
www.edbodmer.com [email protected] Apr 19, 202373
TRW Payment in Kind Note Example
• In March 2003, Blackstone Group acquired TRW Automotive from Northrop Grumman for $4.7 billion.
• Part of the debt financing was a 600 million, 8% pay-in-kind note payable to a subsidiary of Northrop Grumman Corporation
• Valued at $348 million on a 15-year life using a 12% discount rate
• As of September, 2004, the accreted book value totaled $417 million, and accreted face-value was $678 million
• That month TRW Automotive repurchased the Seller Note and settled various contractual issues stemming from the acquisition, for a net amount of $493.5 million.
www.edbodmer.com [email protected] Apr 19, 202374
Woodstream
• Brockway Moran & Partners purchased Woodstream Corp., a maker of wild animal cage traps, rodent control devices and pesticides, from Friend Skoler Co. LLC.
• The $100 million purchase price is equivalent to between 6.5 and 7x EBITDA.
• Of the equity, Brockway contributed 85% of the total, with management chipping in 10%. Lenders Antares Capital Corp. and Allied Capital Corp. fill in the remaining 5%. Total equity represents approximately 40% of the purchase price.
• On the debt side, Antares led a $58 million senior facility, along with Merrill Lynch and GE Capital Corp. The senior debt component also contains a revolver to be used in the future as working capital (and not included in the $100 million purchase price).
• CIT Private Equity and Denali Advisors LLC provided a subordinated note in the amount of $17 million.
www.edbodmer.com [email protected] Apr 19, 202375
Woodstream Debt
• Senior debt: Libor + 3.50%, 4 year amortization
• Subordinated notes:
• 7% cash interest
• 7% pay-in-kind interest
• Warrants to purchase 5% of the company's equity at $0.05 per share
• Repayment after 5 years or at exit event
• Fees 1.5%
• Equity
• 27% required return
Merger and Acquisition Modelling Apr 19, 2023 76
LBO History
www.edbodmer.com [email protected] Apr 19, 202377
Finance Theory and LBO’s
• Desirable to adopt high leverage during a transition period
• Leveraged buyouts – acquisitions financed mainly by borrowing
• Leveraged recapitalizations – companies borrow to retire most of their equity
• Workouts – companies with excessive debt that have to be recapitalized in order to meet debt capacity.
• Jensen’s free cash-flow hypothesis.
• Managers spend excess cash at their discretion rather than in the interest of the firm.
• Debt reduces the agency cost and restores the valuation to the enterprise value
• Sponsor’s incentive from the equity investment that does not get paid until the debt is repaid.
www.edbodmer.com [email protected] Apr 19, 202378
General Concept
• New Owners
• Improve Operations
• Divest Unrelated Business
• Re-sell the Newly Made Company at a Profit
• Early Successes with High Yield Bonds
• 1981 – 99 LBO’s
• 1988 – 381 LBO’s
• Discipline declined with increased deals
• Made assumptions that growth and margins could reach levels never before achieved
www.edbodmer.com [email protected] Apr 19, 202379
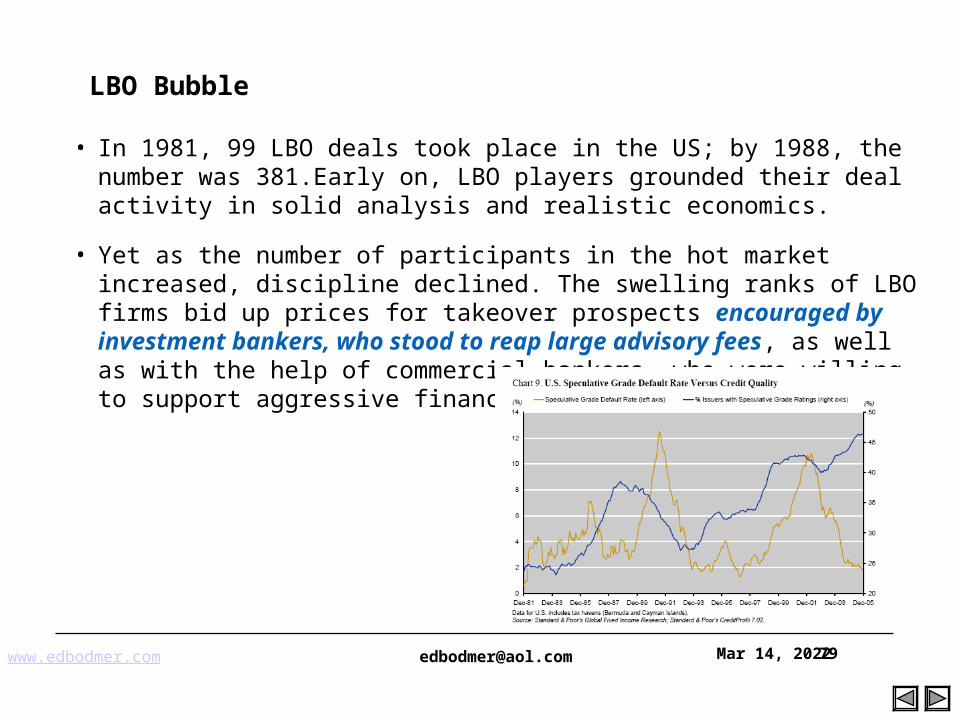
LBO Bubble
• In 1981, 99 LBO deals took place in the US; by 1988, the number was 381.Early on, LBO players grounded their deal activity in solid analysis and realistic economics.
• Yet as the number of participants in the hot market increased, discipline declined. The swelling ranks of LBO firms bid up prices for takeover prospects encouraged by investment bankers, who stood to reap large advisory fees, as well as with the help of commercial bankers, who were willing to support aggressive financing plans.
www.edbodmer.com [email protected] Apr 19, 202380
LBO Bubble - Continued
• We have reviewed some financial projections that underpinned several high-profile LBO bankruptcies in the late 1980s. Many of these transactions were based on assumptions that the companies could achieve levels of performance, revenue growth, operating margins, and capital utilization never before achieved in their industry. The buyers of these companies typically had no concrete plans for executing the financial performance necessary to meet their obligations. In many such transactions, the buyers simply assumed that they could resell pieces of the acquired companies for a higher price to someone else.
• Why wouldn't investors see through such shoddy analyses?
• In many of these transactions, bankers and loan committees felt great pressure to keep up with their peers and generate high up-front fees, so they approved highly questionable loans. In other cases, each participant assumed someone else had carefully done the homework.
• Buyers assumed that if they could get financing, the deal must be good.
• High-yield bond investors figured that the commercial bankers providing the senior debt must surely have worked their numbers properly. After all, the bankers selling the bonds had their reputations at stake, and the buyers had some capital in the game as well.
• Whatever the assumption, however, the immutable laws of economics and value creation prevailed. Many deals went under.
www.edbodmer.com [email protected] Apr 19, 202381
LBO’s in the U.S.
• In the early 1980s inflation became under control. Investors rediscovered the confidence to innovate.
• A market for corporate control emerged, in which companies and private investors (corporate raiders) demonstrated their ability to successfully complete hostile takeovers of poorly performing companies.
• Once in control, the new owners often improve operations, divest unrelated businesses, and then resell the newly made-over company for a substantial profit.
• The emergence of high-yield bond financing opened the door for smaller investors, known as leveraged-buyout (LBO) firms, to take a leading role in the hostile-takeover game.
www.edbodmer.com [email protected] Apr 19, 202382
LBO Statistics
• 3% to 6% of M&A activity in number of transactions
• Peak in 1980’s
• Significant increases in efficiency
• Late 1980’s, 27 percent of LBO’s defaulted
• Opportunities to transfer wealth between groups
www.edbodmer.com [email protected] Apr 19, 202383
The Deal Decade, 1981-1989 (the fourth movement)
• Motivating forces
• Surge in the economy and stock market beginning in mid-1982
• Impact of international competition on mature industries such as steel and auto
• Unwinding diversified firms
• New industries as a result of new technologies and managerial innovationsDecade of big deals
• Ten largest transactions
•Exceeded $6 billion each
•Summed to $126.1 billion
• Top 10 deals reflected changes in the industry
•Five involved oil companies — increased price instability resulting from OPEC actions
•Two involved drug mergers — increased pressure to reduce drug prices
•Two involved tobacco companies — diversified into food industry
www.edbodmer.com [email protected] Apr 19, 202384
1980s LBO Wave
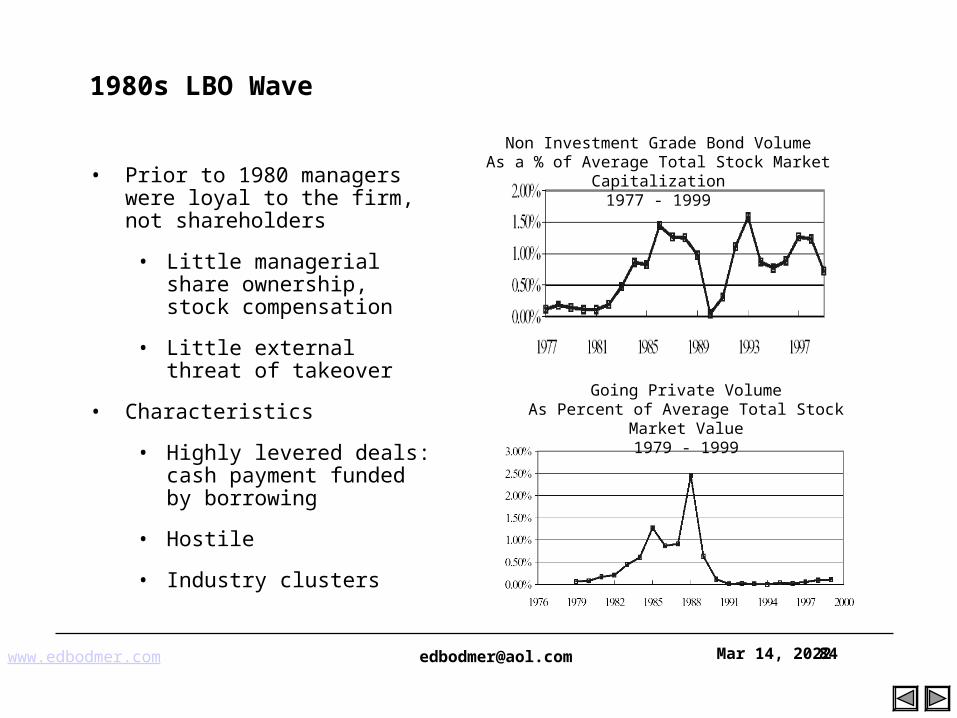
• Prior to 1980 managers were loyal to the firm, not shareholders
• Little managerial share ownership, stock compensation
• Little external threat of takeover
• Characteristics
• Highly levered deals: cash payment funded by borrowing
• Hostile
• Industry clusters
Non Investment Grade Bond VolumeAs a % of Average Total Stock Market Capitalization
1977 - 1999
Going Private VolumeAs Percent of Average Total Stock Market
Value1979 - 1999
www.edbodmer.com [email protected] Apr 19, 202385
The Deal Decade, 1981-1989 (Continued)
• Financial innovations
• High yield bonds provided financing for aggressive acquisitions by raiders
• Financial buyers
•Arranged going private transactions
•Bought segments of diversified firms
• "Bustup acquisitions"
•Buyers would seek firms whose parts as separate entities were worth more than the whole
•After acquisitions, segments would be divested
•Proceeds of sales were used to reduce the debt incurred to finance the transaction
• Rise of wide range of defensive measures as a result of increased hostile takeovers
www.edbodmer.com [email protected] Apr 19, 202386
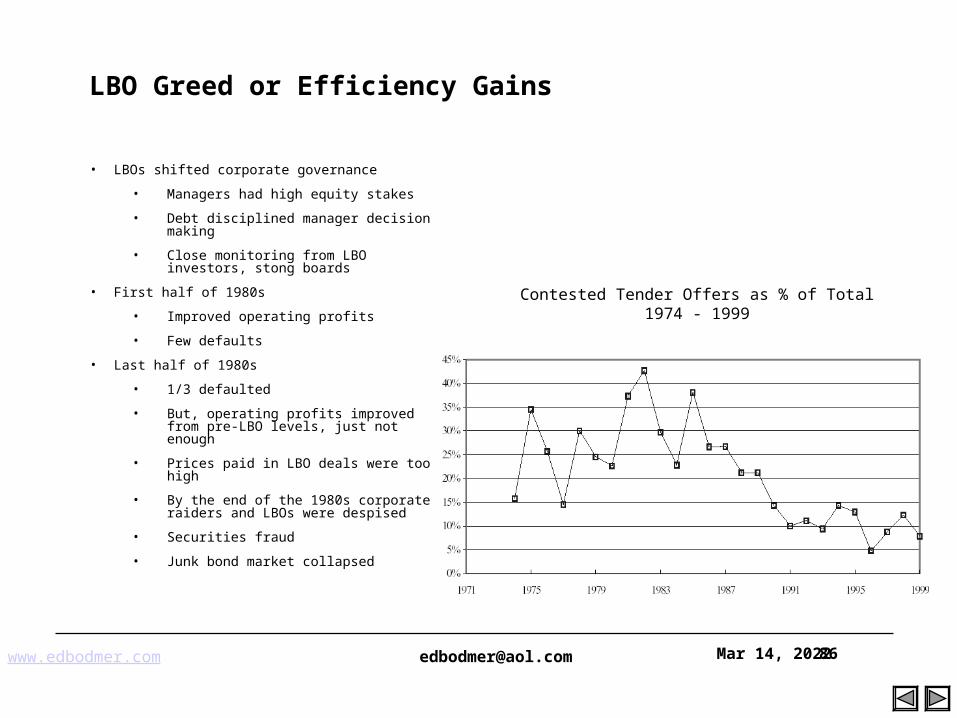
LBO Greed or Efficiency Gains
• LBOs shifted corporate governance
• Managers had high equity stakes
• Debt disciplined manager decision making
• Close monitoring from LBO investors, stong boards
• First half of 1980s
• Improved operating profits
• Few defaults
• Last half of 1980s
• 1/3 defaulted
• But, operating profits improved from pre-LBO levels, just not enough
• Prices paid in LBO deals were too high
• By the end of the 1980s corporate raiders and LBOs were despised
• Securities fraud
• Junk bond market collapsed
Contested Tender Offers as % of Total1974 - 1999
www.edbodmer.com [email protected] Apr 19, 202387
• Managers are more shareholder focused
• Hostile takeovers not as necessary
• More shares are owned by institutional investors (1980 <30 % to 2000 >50%)
• More monitoring and activism from shareholders
• Management stock ownership and stock compensation has increased
• More interested in creating stockholder value
• CEO option grants increased x7 from 1980 – 1994
• Equity compensation = 50% in 1994, <20% in 1980
• Boards are more active
Lasting Results from 1980s Takeovers
www.edbodmer.com [email protected] Apr 19, 202389
LBO Modelling Issues
• Perspective of Alternative Parties
• Cash Flow Waterfall
• Model the default points on alternative instruments
• Model the IRR on cash flows received by different instruments
• Complex Interest Structures with Payment in Kind and multiple interest rates
• Sources and Uses of Funds
• Pro-Forma Analysis
• IRR on Alternative Financial Instruments
www.edbodmer.com [email protected] Apr 19, 202390
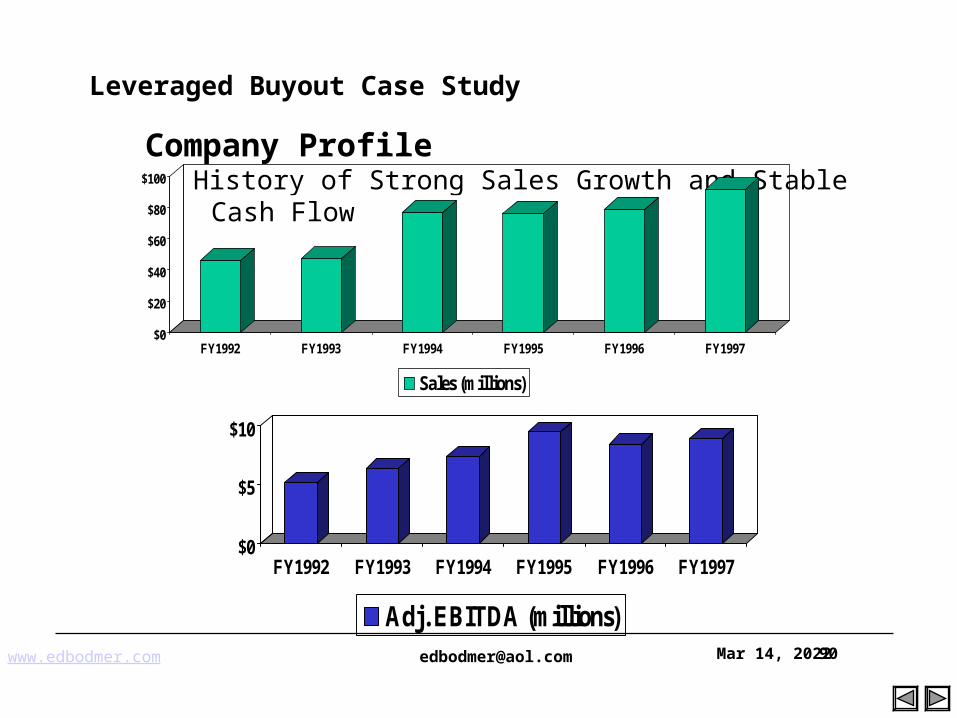
Company ProfileHistory of Strong Sales Growth and Stable Cash Flow
$0
$20
$40
$60
$80
$100
FY1992 FY1993 FY1994 FY1995 FY1996 FY1997
Sales (millions)
$0
$5
$10
FY1992 FY1993 FY1994 FY1995 FY1996 FY1997
Adj. EBITDA (millions)
Leveraged Buyout Case Study
www.edbodmer.com [email protected] Apr 19, 202391
Leveraged Buyout Case Study
Key Investment Considerations:
Superior Consolidation Platform
Technical Marketing Strategy
Strategically Positioned for Continued Growth
Strong Management Team
Diversified Customer and Supplier Base
www.edbodmer.com [email protected] Apr 19, 202392
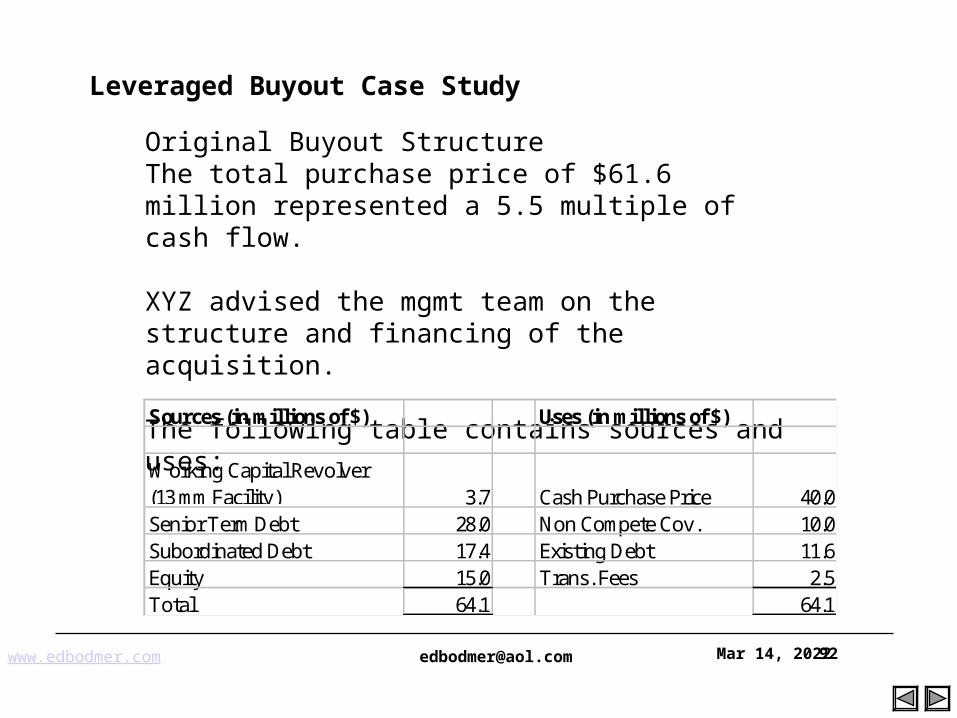
Original Buyout StructureThe total purchase price of $61.6 million represented a 5.5 multiple of cash flow.
XYZ advised the mgmt team on the structure and financing of the acquisition.
The following table contains sources and uses:
Sources (in millions of $) Uses (in millions of $)
Working Capital Revolver (13 mm Facility) 3.7 Cash Purchase Price 40.0Senior Term Debt 28.0 Non Compete Cov. 10.0Subordinated Debt 17.4 Existing Debt 11.6Equity 15.0 Trans. Fees 2.5Total 64.1 64.1
Leveraged Buyout Case Study
www.edbodmer.com [email protected] Apr 19, 202393
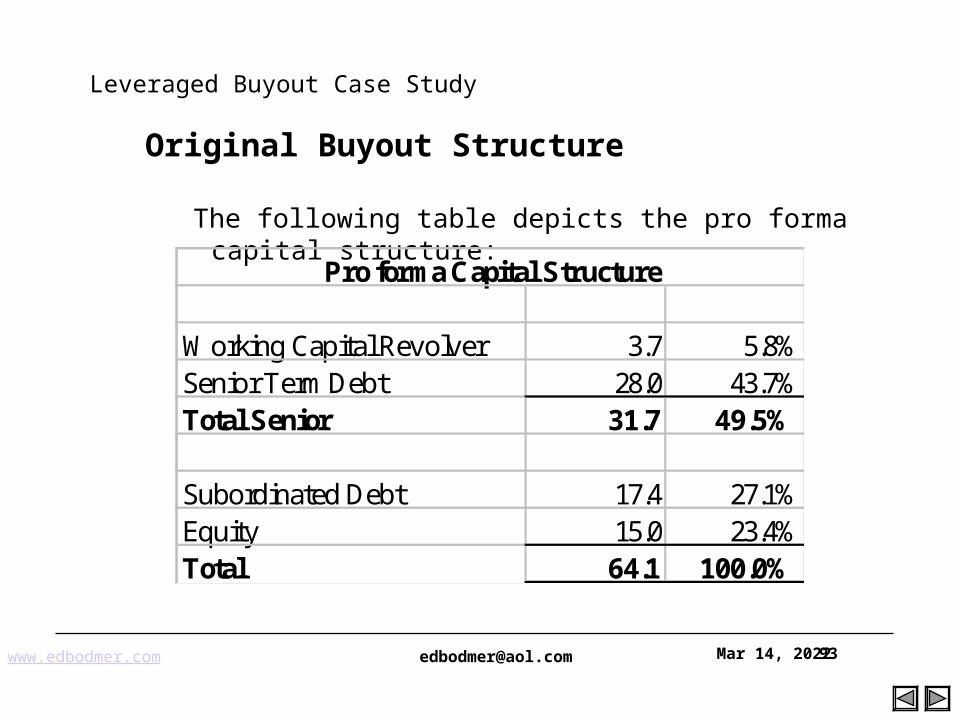
Leveraged Buyout Case Study
Original Buyout Structure
The following table depicts the pro forma capital structure:
Pro forma Capital Structure
Working Capital Revolver 3.7 5.8%Senior Term Debt 28.0 43.7%Total Senior 31.7 49.5%
Subordinated Debt 17.4 27.1%Equity 15.0 23.4%Total 64.1 100.0%
www.edbodmer.com [email protected] Apr 19, 202394
Leveraged Buyout Case Study
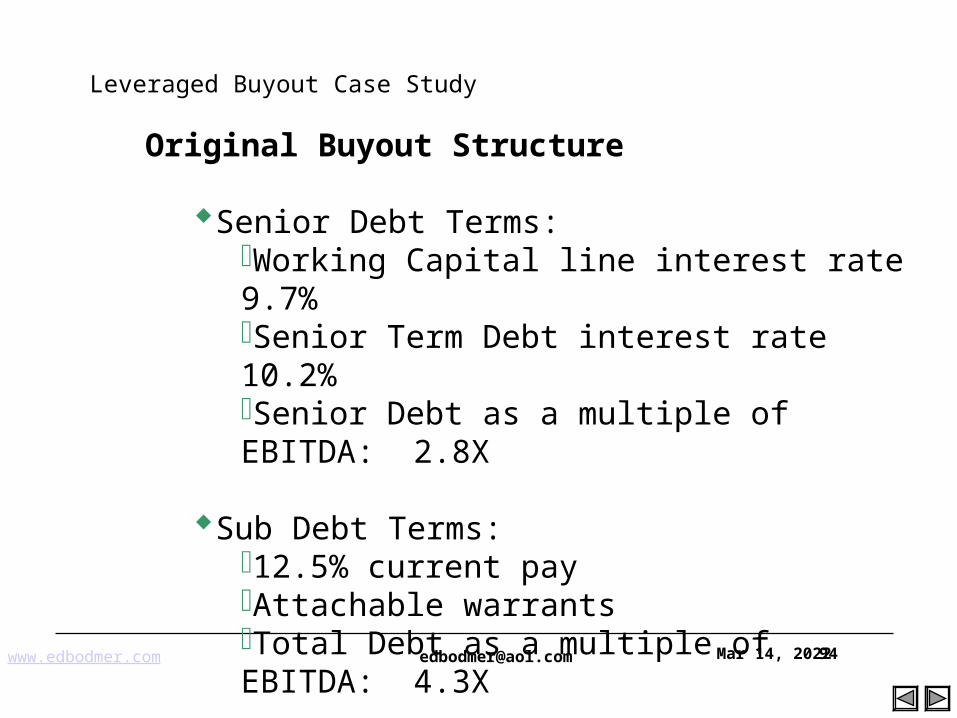
Original Buyout Structure
Senior Debt Terms:Working Capital line interest rate 9.7%Senior Term Debt interest rate 10.2%Senior Debt as a multiple of EBITDA: 2.8X
Sub Debt Terms:12.5% current payAttachable warrantsTotal Debt as a multiple of EBITDA: 4.3X
www.edbodmer.com [email protected] Apr 19, 202395
Leveraged Buyout Case Study
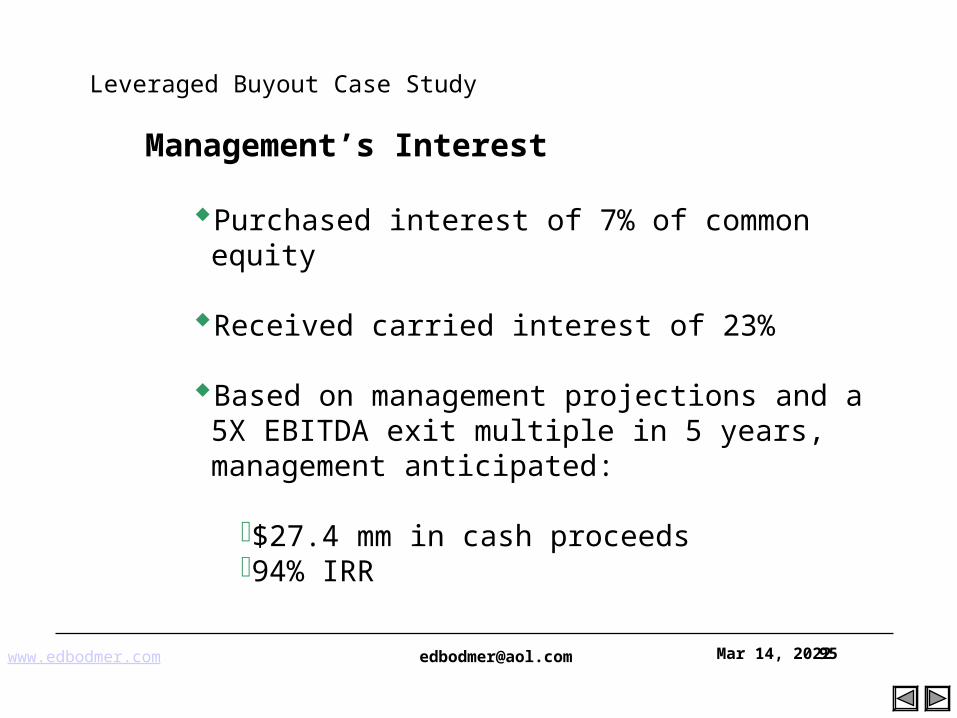
Management’s Interest
Purchased interest of 7% of common equity
Received carried interest of 23%
Based on management projections and a 5X EBITDA exit multiple in 5 years, management anticipated:
$27.4 mm in cash proceeds94% IRR
www.edbodmer.com [email protected] Apr 19, 202396
Leveraged Buyout Case Study
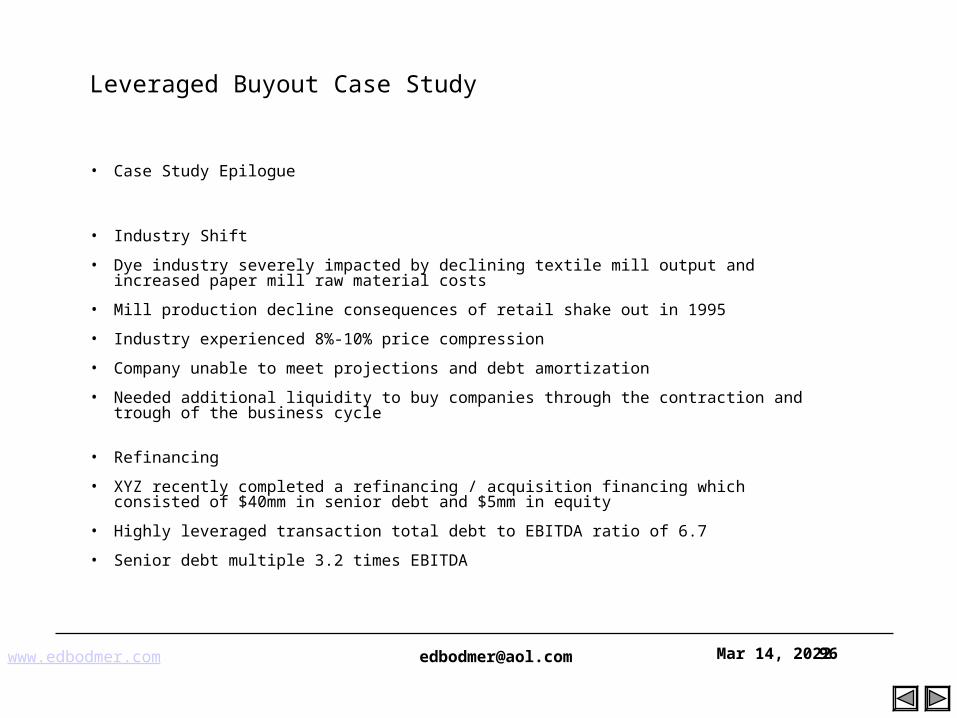
• Case Study Epilogue
• Industry Shift
• Dye industry severely impacted by declining textile mill output and increased paper mill raw material costs
• Mill production decline consequences of retail shake out in 1995
• Industry experienced 8%-10% price compression
• Company unable to meet projections and debt amortization
• Needed additional liquidity to buy companies through the contraction and trough of the business cycle
• Refinancing
• XYZ recently completed a refinancing / acquisition financing which consisted of $40mm in senior debt and $5mm in equity
• Highly leveraged transaction total debt to EBITDA ratio of 6.7
• Senior debt multiple 3.2 times EBITDA
www.edbodmer.com [email protected] Apr 19, 202397
Project Dye
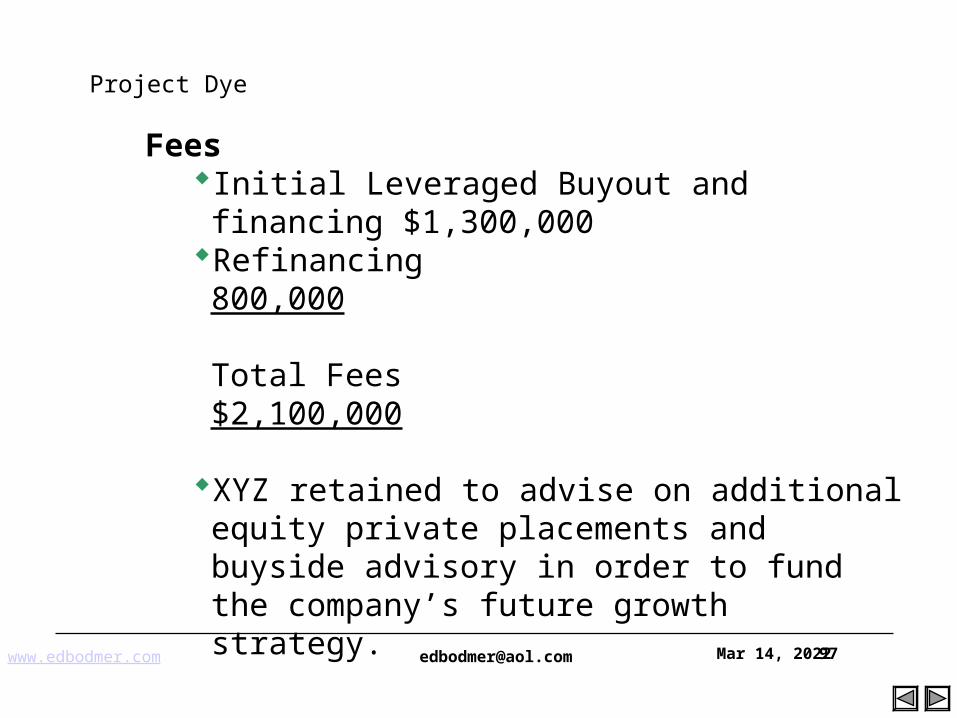
FeesInitial Leveraged Buyout and financing
$1,300,000Refinancing 800,000
Total Fees $2,100,000
XYZ retained to advise on additional equity private placements and buyside advisory in order to fund the company’s future growth strategy.
www.edbodmer.com [email protected] Apr 19, 202398
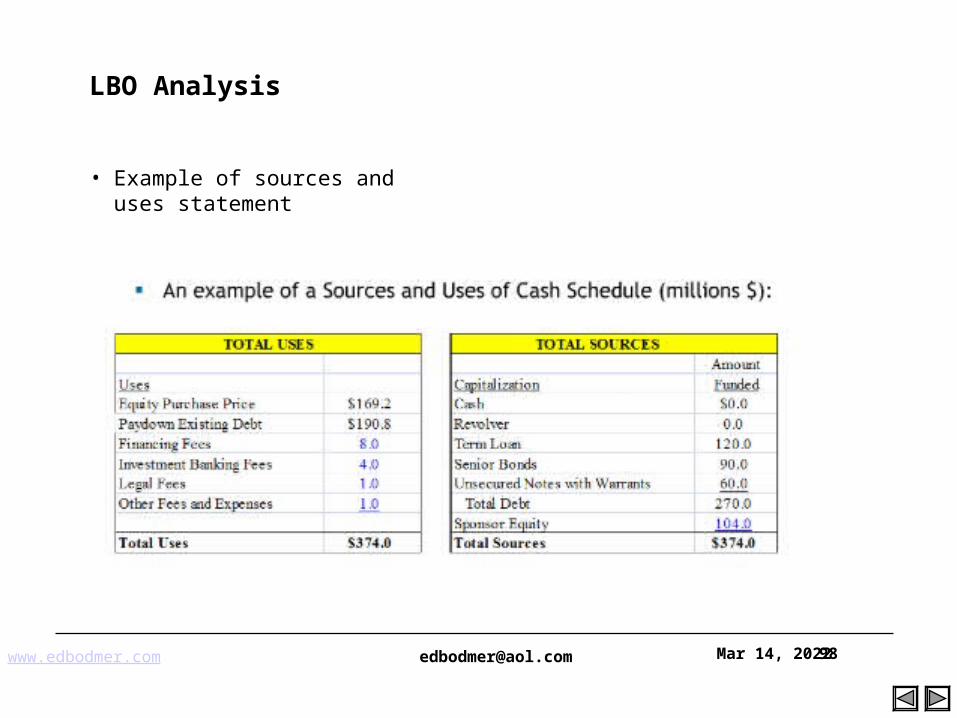
LBO Analysis
• Example of sources and uses statement