Embed Size (px)
DESCRIPTION
Basic template of Apple's LBO
Citation preview
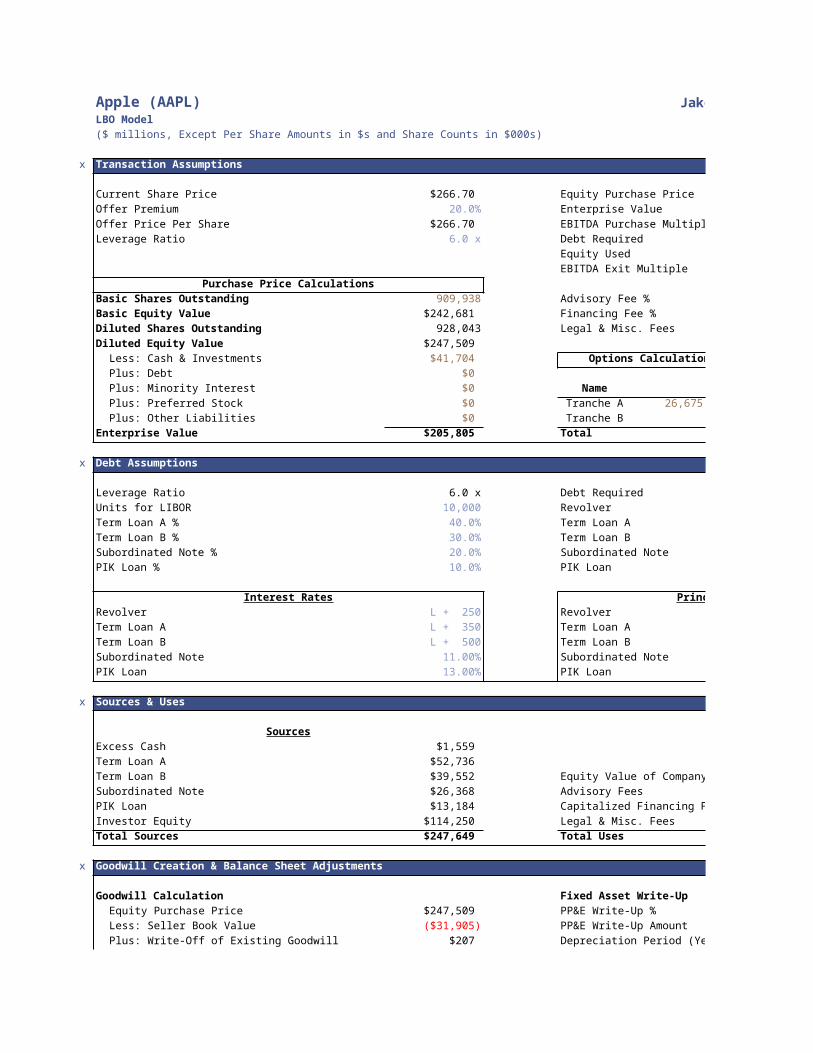
Apple (AAPL)LBO Model
($ millions, Except Per Share Amounts in $s and Share Counts in $000s)
x Transaction Assumptions
Current Share Price $266.70 Equity Purchase Price
Offer Premium 20.0% Enterprise Value
Offer Price Per Share $266.70 EBITDA Purchase Multiple
Leverage Ratio 6.0 x Debt Required
Equity Used
EBITDA Exit Multiple
Purchase Price Calculations
Basic Shares Outstanding 909,938 Advisory Fee %
Basic Equity Value $242,681 Financing Fee %
Diluted Shares Outstanding 928,043 Legal & Misc. Fees
Diluted Equity Value $247,509
Less: Cash & Investments $41,704 Options Calculations - Purchase Price
Plus: Debt $0
Plus: Minority Interest $0 Name
Plus: Preferred Stock $0 Tranche A 26,675 $85.69
Plus: Other Liabilities $0 Tranche B
Enterprise Value $205,805 Total
x Debt Assumptions
Leverage Ratio 6.0 x Debt Required
Units for LIBOR 10,000 Revolver
Term Loan A % 40.0% Term Loan A
Term Loan B % 30.0% Term Loan B
Subordinated Note % 20.0% Subordinated Note
PIK Loan % 10.0% PIK Loan
Interest Rates Principal Repayment %
Revolver L + 250 Revolver
Term Loan A L + 350 Term Loan A
Term Loan B L + 500 Term Loan B
Subordinated Note 11.00% Subordinated Note
PIK Loan 13.00% PIK Loan
x Sources & Uses
Sources Uses
Excess Cash $1,559
Term Loan A $52,736
Term Loan B $39,552 Equity Value of Company
Subordinated Note $26,368 Advisory Fees
PIK Loan $13,184 Capitalized Financing Fees
Investor Equity $114,250 Legal & Misc. Fees
Total Sources $247,649 Total Uses
x Goodwill Creation & Balance Sheet Adjustments
Goodwill Calculation Fixed Asset Write-Up
Equity Purchase Price $247,509 PP&E Write-Up %
Less: Seller Book Value ($31,905) PP&E Write-Up Amount
Plus: Write-Off of Existing Goodwill $207 Depreciation Period (Years)
Jake Dalpiaz | [email protected]
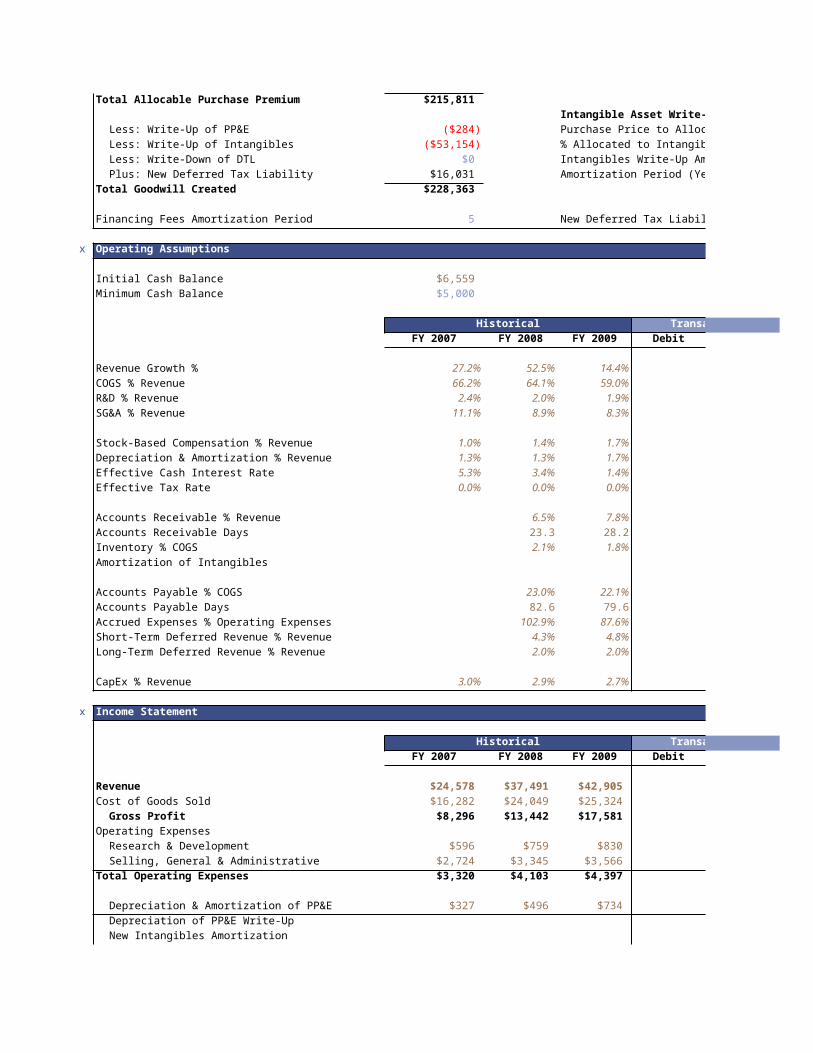
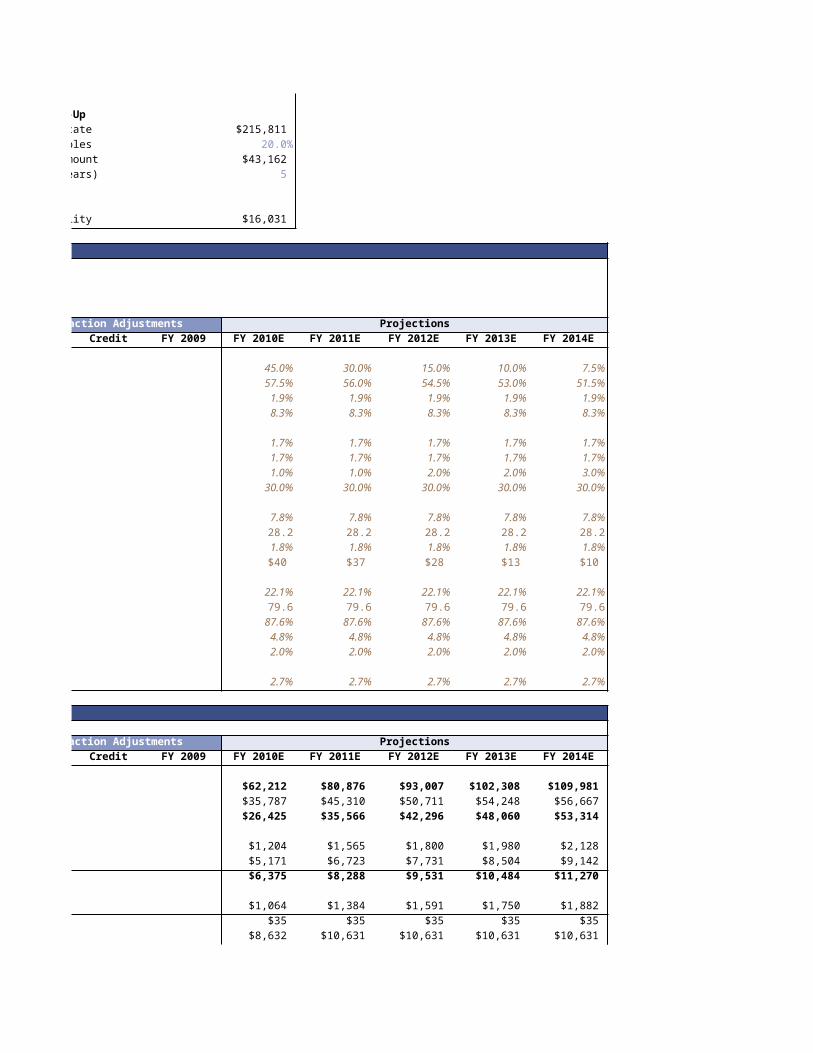
Total Allocable Purchase Premium $215,811
Intangible Asset Write-Up
Less: Write-Up of PP&E ($284) Purchase Price to Allocate
Less: Write-Up of Intangibles ($53,154) % Allocated to Intangibles
Less: Write-Down of DTL $0 Intangibles Write-Up Amount
Plus: New Deferred Tax Liability $16,031 Amortization Period (Years)
Total Goodwill Created $228,363
Financing Fees Amortization Period 5 New Deferred Tax Liability
x Operating Assumptions
Initial Cash Balance $6,559
Minimum Cash Balance $5,000
Historical Transaction Adjustments
FY 2007 FY 2008 FY 2009 Debit Credit
Revenue Growth % 27.2% 52.5% 14.4%
COGS % Revenue 66.2% 64.1% 59.0%
R&D % Revenue 2.4% 2.0% 1.9%
SG&A % Revenue 11.1% 8.9% 8.3%
Stock-Based Compensation % Revenue 1.0% 1.4% 1.7%
Depreciation & Amortization % Revenue 1.3% 1.3% 1.7%
Effective Cash Interest Rate 5.3% 3.4% 1.4%
Effective Tax Rate 0.0% 0.0% 0.0%
Accounts Receivable % Revenue 6.5% 7.8%
Accounts Receivable Days 23.3 28.2
Inventory % COGS 2.1% 1.8%
Amortization of Intangibles
Accounts Payable % COGS 23.0% 22.1%
Accounts Payable Days 82.6 79.6
Accrued Expenses % Operating Expenses 102.9% 87.6%
Short-Term Deferred Revenue % Revenue 4.3% 4.8%
Long-Term Deferred Revenue % Revenue 2.0% 2.0%
CapEx % Revenue 3.0% 2.9% 2.7%
x Income Statement
Historical Transaction Adjustments
FY 2007 FY 2008 FY 2009 Debit Credit
Revenue $24,578 $37,491 $42,905
Cost of Goods Sold $16,282 $24,049 $25,324
Gross Profit $8,296 $13,442 $17,581
Operating Expenses
Research & Development $596 $759 $830
Selling, General & Administrative $2,724 $3,345 $3,566
Total Operating Expenses $3,320 $4,103 $4,397
Depreciation & Amortization of PP&E $327 $496 $734
Depreciation of PP&E Write-Up
New Intangibles Amortization
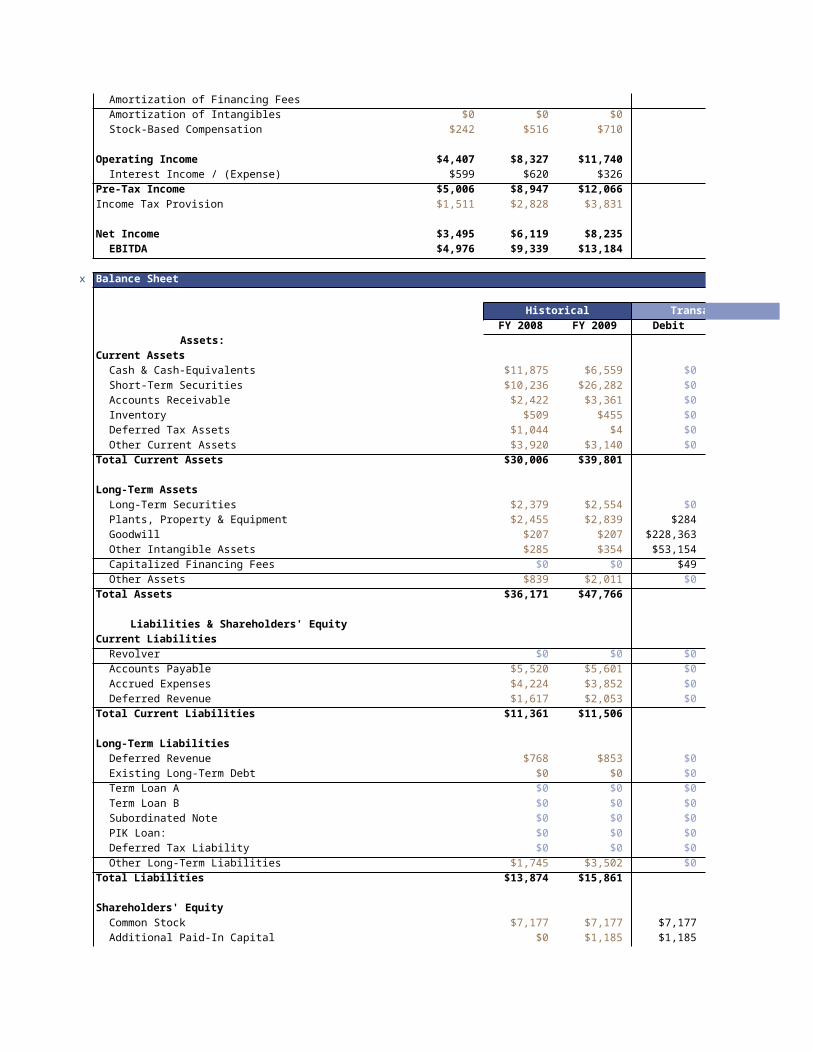
Amortization of Financing Fees
Amortization of Intangibles $0 $0 $0
Stock-Based Compensation $242 $516 $710
Operating Income $4,407 $8,327 $11,740
Interest Income / (Expense) $599 $620 $326
Pre-Tax Income $5,006 $8,947 $12,066
Income Tax Provision $1,511 $2,828 $3,831
Net Income $3,495 $6,119 $8,235
EBITDA $4,976 $9,339 $13,184
x Balance Sheet
Historical Transaction Adjustments
FY 2008 FY 2009 Debit Credit
Assets:
Current Assets
Cash & Cash-Equivalents $11,875 $6,559 $0 $1,559
Short-Term Securities $10,236 $26,282 $0 $0
Accounts Receivable $2,422 $3,361 $0 $0
Inventory $509 $455 $0 $0
Deferred Tax Assets $1,044 $4 $0 $0
Other Current Assets $3,920 $3,140 $0 $0
Total Current Assets $30,006 $39,801
Long-Term Assets
Long-Term Securities $2,379 $2,554 $0 $0
Plants, Property & Equipment $2,455 $2,839 $284 $0
Goodwill $207 $207 $228,363 $207
Other Intangible Assets $285 $354 $53,154 $0
Capitalized Financing Fees $0 $0 $49 $0
Other Assets $839 $2,011 $0 $0
Total Assets $36,171 $47,766
Liabilities & Shareholders' Equity
Current Liabilities
Revolver $0 $0 $0 $0
Accounts Payable $5,520 $5,601 $0 $0
Accrued Expenses $4,224 $3,852 $0 $0
Deferred Revenue $1,617 $2,053 $0 $0
Total Current Liabilities $11,361 $11,506
Long-Term Liabilities
Deferred Revenue $768 $853 $0 $0
Existing Long-Term Debt $0 $0 $0 $0
Term Loan A $0 $0 $0 $52,736
Term Loan B $0 $0 $0 $39,552
Subordinated Note $0 $0 $0 $26,368
PIK Loan: $0 $0 $0 $13,184
Deferred Tax Liability $0 $0 $0 $16,031
Other Long-Term Liabilities $1,745 $3,502 $0 $0
Total Liabilities $13,874 $15,861
Shareholders' Equity
Common Stock $7,177 $7,177 $7,177 $0
Additional Paid-In Capital $0 $1,185 $1,185 $0
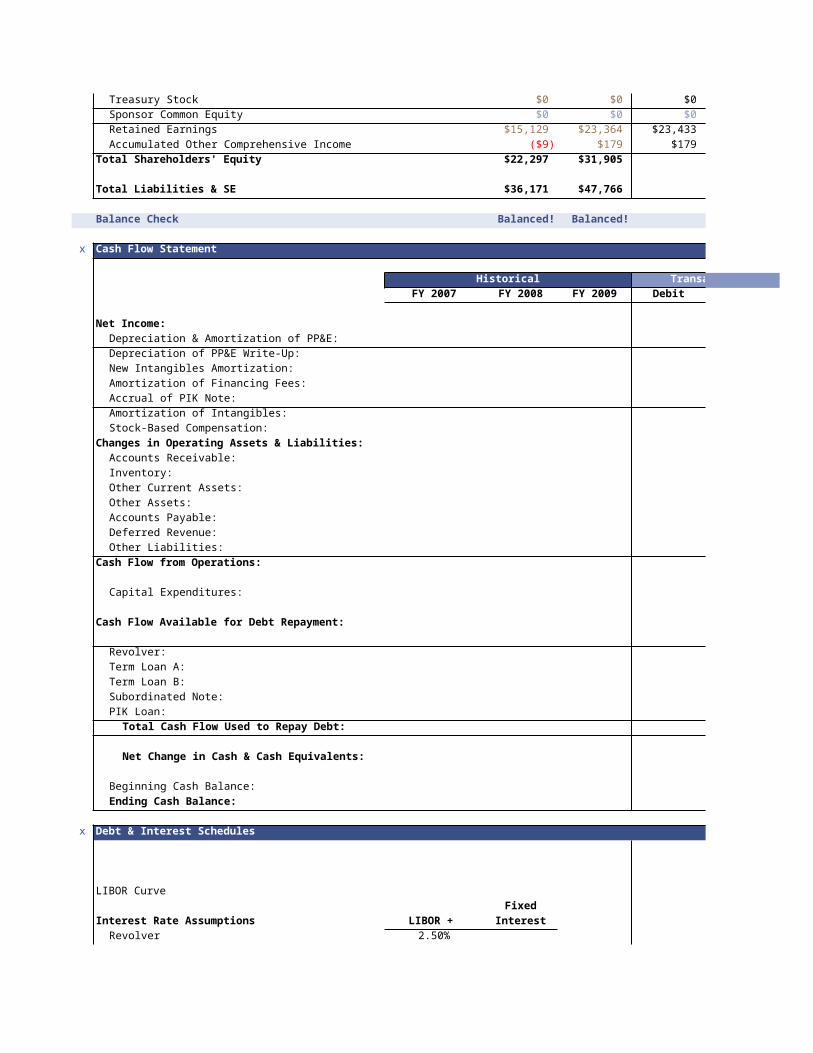
Treasury Stock $0 $0 $0 $0
Sponsor Common Equity $0 $0 $0 $216,923
Retained Earnings $15,129 $23,364 $23,433 $0
Accumulated Other Comprehensive Income ($9) $179 $179 $0
Total Shareholders' Equity $22,297 $31,905
Total Liabilities & SE $36,171 $47,766
Balance Check Balanced! Balanced!
x Cash Flow Statement
Historical Transaction Adjustments
FY 2007 FY 2008 FY 2009 Debit Credit
Net Income:
Depreciation & Amortization of PP&E:
Depreciation of PP&E Write-Up:
New Intangibles Amortization:
Amortization of Financing Fees:
Accrual of PIK Note:
Amortization of Intangibles:
Stock-Based Compensation:
Changes in Operating Assets & Liabilities:
Accounts Receivable:
Inventory:
Other Current Assets:
Other Assets:
Accounts Payable:
Deferred Revenue:
Other Liabilities:
Cash Flow from Operations:
Capital Expenditures:
Cash Flow Available for Debt Repayment:
Revolver:
Term Loan A:
Term Loan B:
Subordinated Note:
PIK Loan:
Total Cash Flow Used to Repay Debt:
Net Change in Cash & Cash Equivalents:
Beginning Cash Balance:
Ending Cash Balance:
x Debt & Interest Schedules
LIBOR Curve
Fixed
Interest Rate Assumptions LIBOR + Interest
Revolver 2.50%
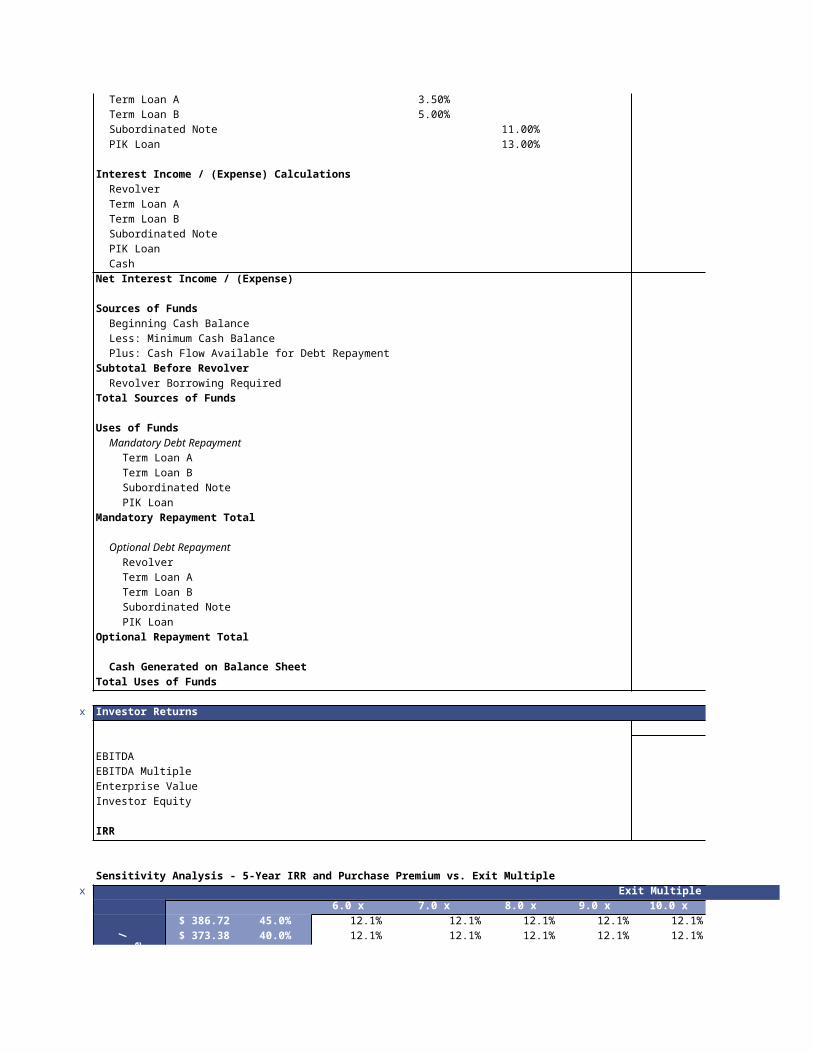
Term Loan A 3.50%
Term Loan B 5.00%
Subordinated Note 11.00%
PIK Loan 13.00%
Interest Income / (Expense) Calculations
Revolver
Term Loan A
Term Loan B
Subordinated Note
PIK Loan
Cash
Net Interest Income / (Expense)
Sources of Funds
Beginning Cash Balance
Less: Minimum Cash Balance
Plus: Cash Flow Available for Debt Repayment
Subtotal Before Revolver
Revolver Borrowing Required
Total Sources of Funds
Uses of Funds
Mandatory Debt Repayment
Term Loan A
Term Loan B
Subordinated Note
PIK Loan
Mandatory Repayment Total
Optional Debt Repayment
Revolver
Term Loan A
Term Loan B
Subordinated Note
PIK Loan
Optional Repayment Total
Cash Generated on Balance Sheet
Total Uses of Funds
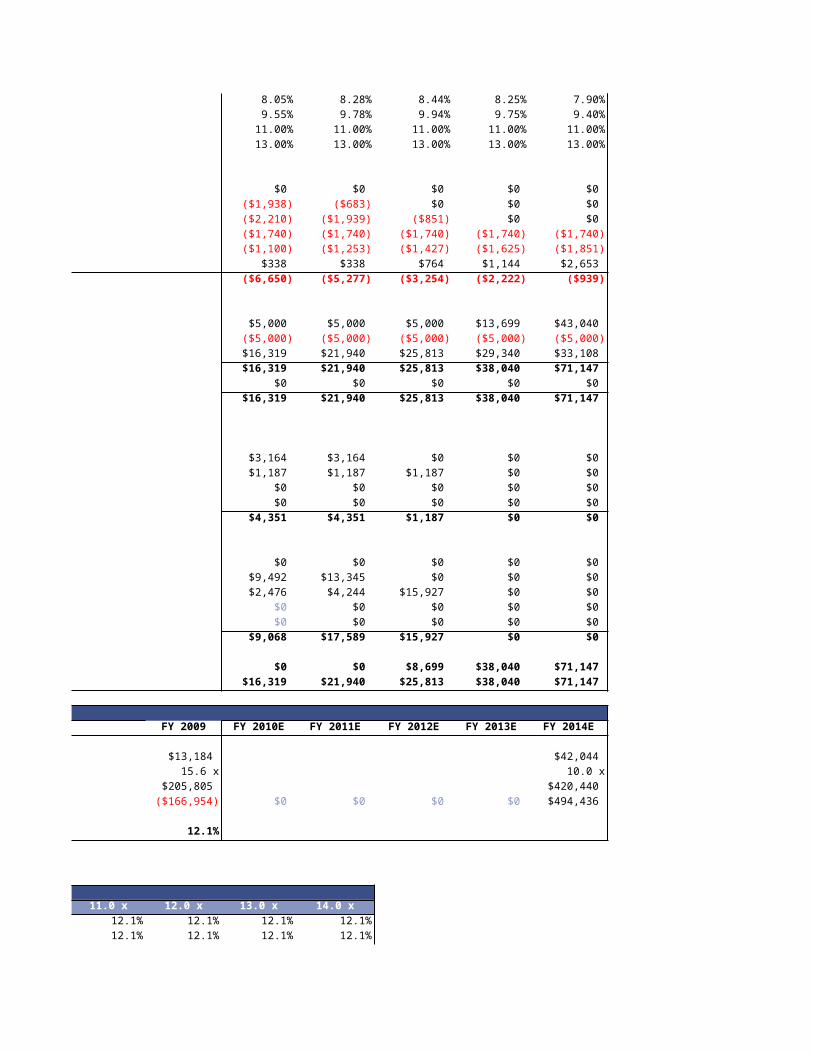
x Investor Returns
EBITDA
EBITDA Multiple
Enterprise Value
Investor Equity
IRR
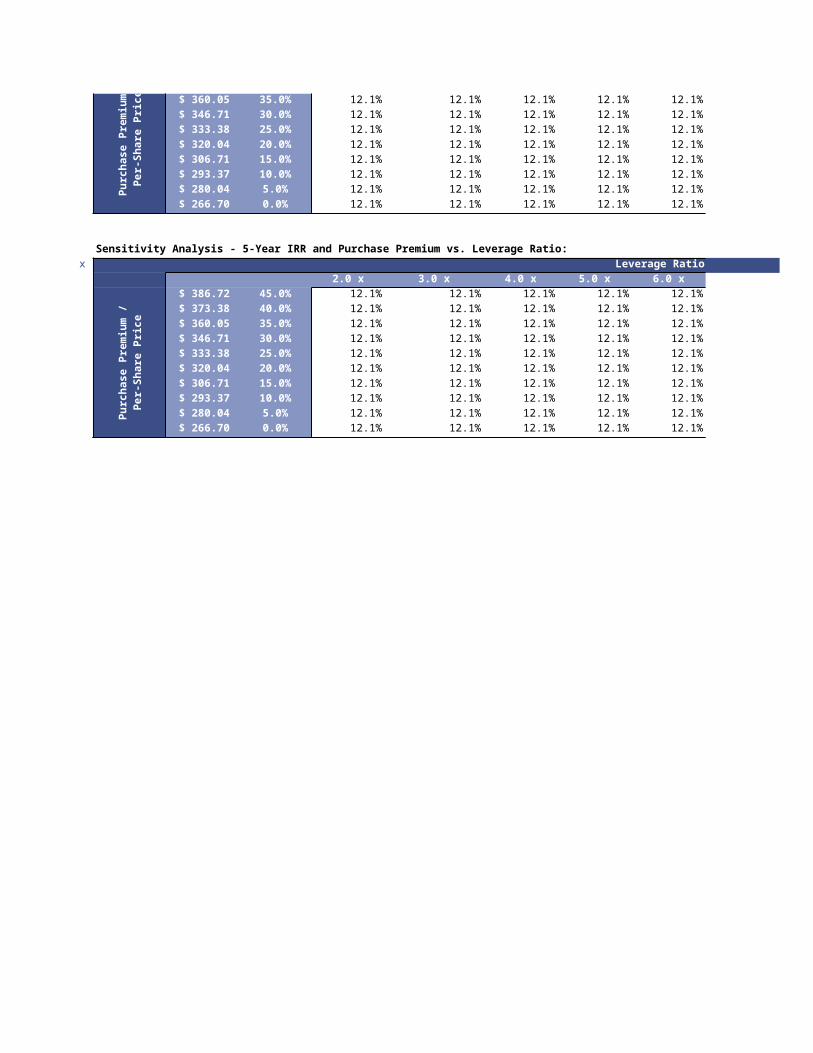
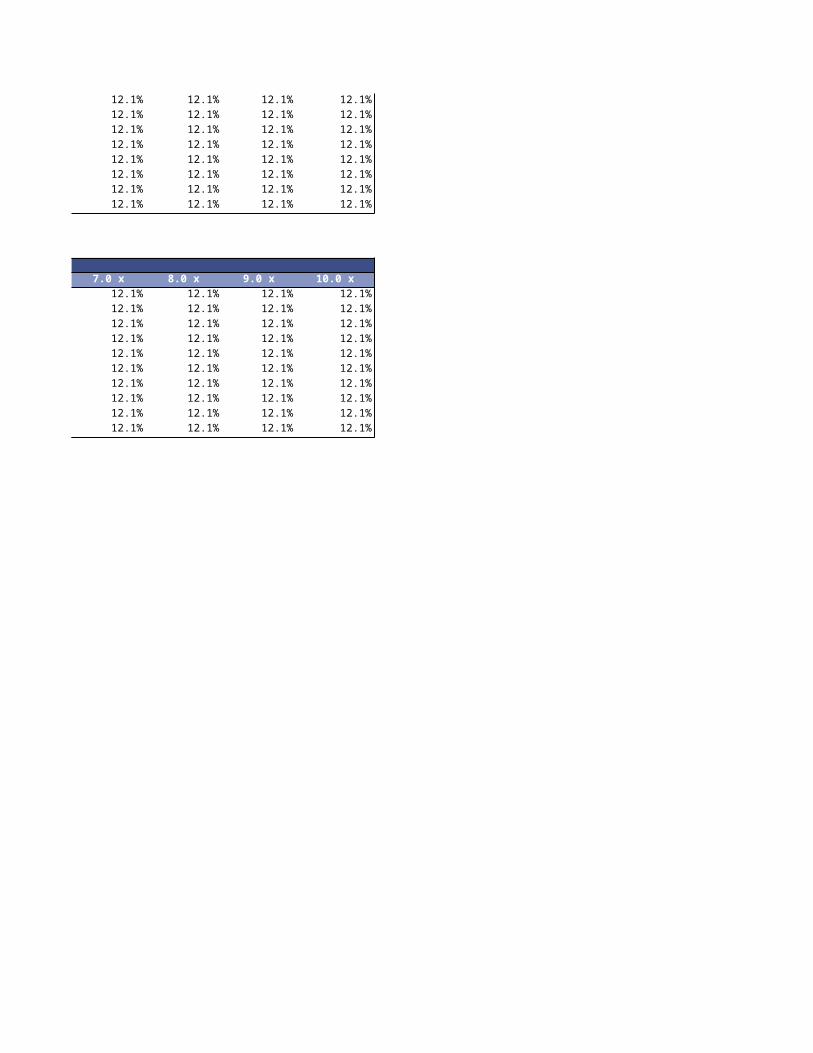
Sensitivity Analysis - 5-Year IRR and Purchase Premium vs. Exit Multiple
x Exit Multiple
12.1% 6.0 x 7.0 x 8.0 x 9.0 x 10.0 x 11.0 x
$ 386.72 45.0% 12.1% 12.1% 12.1% 12.1% 12.1% 12.1%
$ 373.38 40.0% 12.1% 12.1% 12.1% 12.1% 12.1% 12.1%
Pu
rch
ase
Pre
miu
m /
Per
-S
har
e P
rice
$ 360.05 35.0% 12.1% 12.1% 12.1% 12.1% 12.1% 12.1%
$ 346.71 30.0% 12.1% 12.1% 12.1% 12.1% 12.1% 12.1%
$ 333.38 25.0% 12.1% 12.1% 12.1% 12.1% 12.1% 12.1%
$ 320.04 20.0% 12.1% 12.1% 12.1% 12.1% 12.1% 12.1%
$ 306.71 15.0% 12.1% 12.1% 12.1% 12.1% 12.1% 12.1%
$ 293.37 10.0% 12.1% 12.1% 12.1% 12.1% 12.1% 12.1%
$ 280.04 5.0% 12.1% 12.1% 12.1% 12.1% 12.1% 12.1%
$ 266.70 0.0% 12.1% 12.1% 12.1% 12.1% 12.1% 12.1%
Sensitivity Analysis - 5-Year IRR and Purchase Premium vs. Leverage Ratio:
x Leverage Ratio
12.1% 2.0 x 3.0 x 4.0 x 5.0 x 6.0 x 7.0 x
$ 386.72 45.0% 12.1% 12.1% 12.1% 12.1% 12.1% 12.1%
$ 373.38 40.0% 12.1% 12.1% 12.1% 12.1% 12.1% 12.1%
$ 360.05 35.0% 12.1% 12.1% 12.1% 12.1% 12.1% 12.1%
$ 346.71 30.0% 12.1% 12.1% 12.1% 12.1% 12.1% 12.1%
$ 333.38 25.0% 12.1% 12.1% 12.1% 12.1% 12.1% 12.1%
$ 320.04 20.0% 12.1% 12.1% 12.1% 12.1% 12.1% 12.1%
$ 306.71 15.0% 12.1% 12.1% 12.1% 12.1% 12.1% 12.1%
$ 293.37 10.0% 12.1% 12.1% 12.1% 12.1% 12.1% 12.1%
$ 280.04 5.0% 12.1% 12.1% 12.1% 12.1% 12.1% 12.1%
$ 266.70 0.0% 12.1% 12.1% 12.1% 12.1% 12.1% 12.1%
Pu
rch
ase
Pre
miu
m /
Per
-S
har
e P
rice
Pu
rch
ase
Pre
miu
m /
Per
-S
har
e P
rice
$247,509
$205,805
15.6 x
$92,288
$115,669
10.0 x
0.02%
0.06%
$10
Options Calculations - Purchase Price
18,104
18,104
$92,288
$2,000
$36,915
$27,686
$18,458
$9,229
Principal Repayment %
NA
10.0%
5.0%
0.0%
0.0%
Uses
$247,509
$50
$57
$10
$247,625
10.0%
$284
8
Jake Dalpiaz | [email protected]
www.stayingsharpe.com
$215,811
20.0%
$43,162
5
$16,031
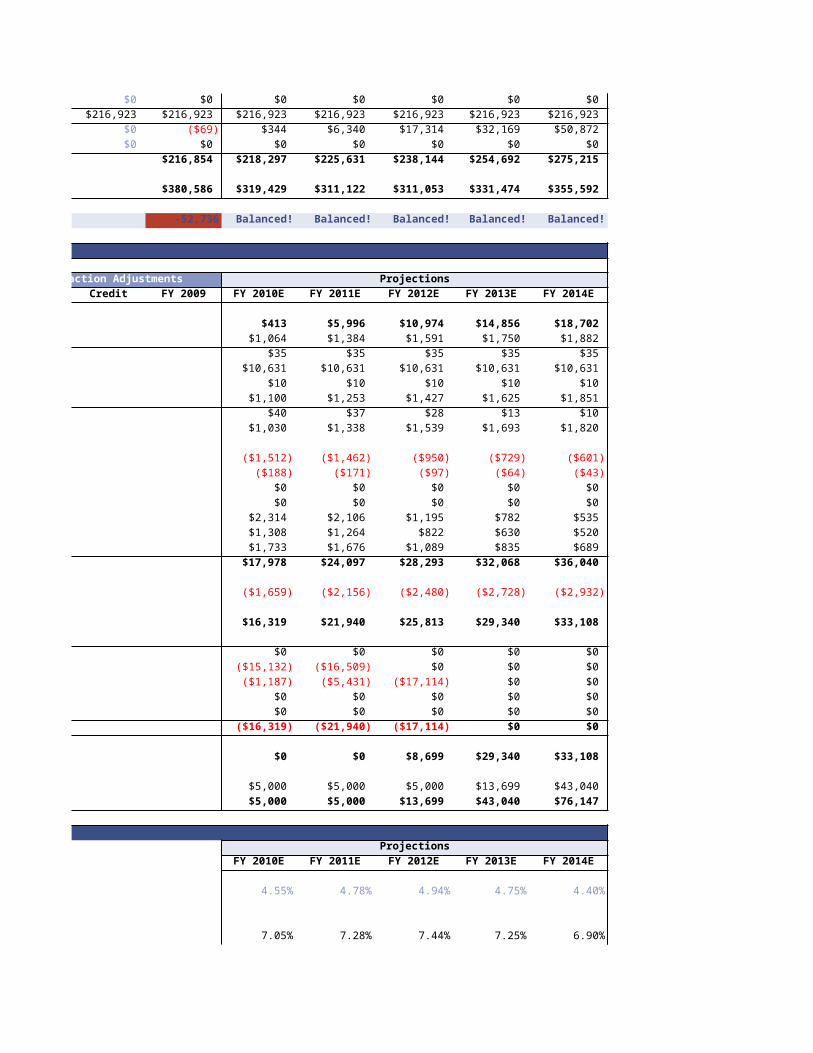
Transaction Adjustments Projections
FY 2009 FY 2010E FY 2011E FY 2012E FY 2013E FY 2014E
45.0% 30.0% 15.0% 10.0% 7.5%
57.5% 56.0% 54.5% 53.0% 51.5%
1.9% 1.9% 1.9% 1.9% 1.9%
8.3% 8.3% 8.3% 8.3% 8.3%
1.7% 1.7% 1.7% 1.7% 1.7%
1.7% 1.7% 1.7% 1.7% 1.7%
1.0% 1.0% 2.0% 2.0% 3.0%
30.0% 30.0% 30.0% 30.0% 30.0%
7.8% 7.8% 7.8% 7.8% 7.8%
28.2 28.2 28.2 28.2 28.2
1.8% 1.8% 1.8% 1.8% 1.8%
$40 $37 $28 $13 $10
22.1% 22.1% 22.1% 22.1% 22.1%
79.6 79.6 79.6 79.6 79.6
87.6% 87.6% 87.6% 87.6% 87.6%
4.8% 4.8% 4.8% 4.8% 4.8%
2.0% 2.0% 2.0% 2.0% 2.0%
2.7% 2.7% 2.7% 2.7% 2.7%
Transaction Adjustments Projections
FY 2009 FY 2010E FY 2011E FY 2012E FY 2013E FY 2014E
$62,212 $80,876 $93,007 $102,308 $109,981
$35,787 $45,310 $50,711 $54,248 $56,667
$26,425 $35,566 $42,296 $48,060 $53,314
$1,204 $1,565 $1,800 $1,980 $2,128
$5,171 $6,723 $7,731 $8,504 $9,142
$6,375 $8,288 $9,531 $10,484 $11,270
$1,064 $1,384 $1,591 $1,750 $1,882
$35 $35 $35 $35 $35
$8,632 $10,631 $10,631 $10,631 $10,631
$11 $10 $10 $10 $10
$40 $37 $28 $13 $10
$1,030 $1,338 $1,539 $1,693 $1,820
$9,237 $13,843 $18,931 $23,444 $27,656
($6,650) ($5,277) ($3,254) ($2,222) ($939)
$591 $8,566 $15,677 $21,222 $26,718
$177 $2,570 $4,703 $6,367 $8,015
$413 $5,996 $10,974 $14,856 $18,702
$20,050 $27,278 $32,765 $37,576 $42,044
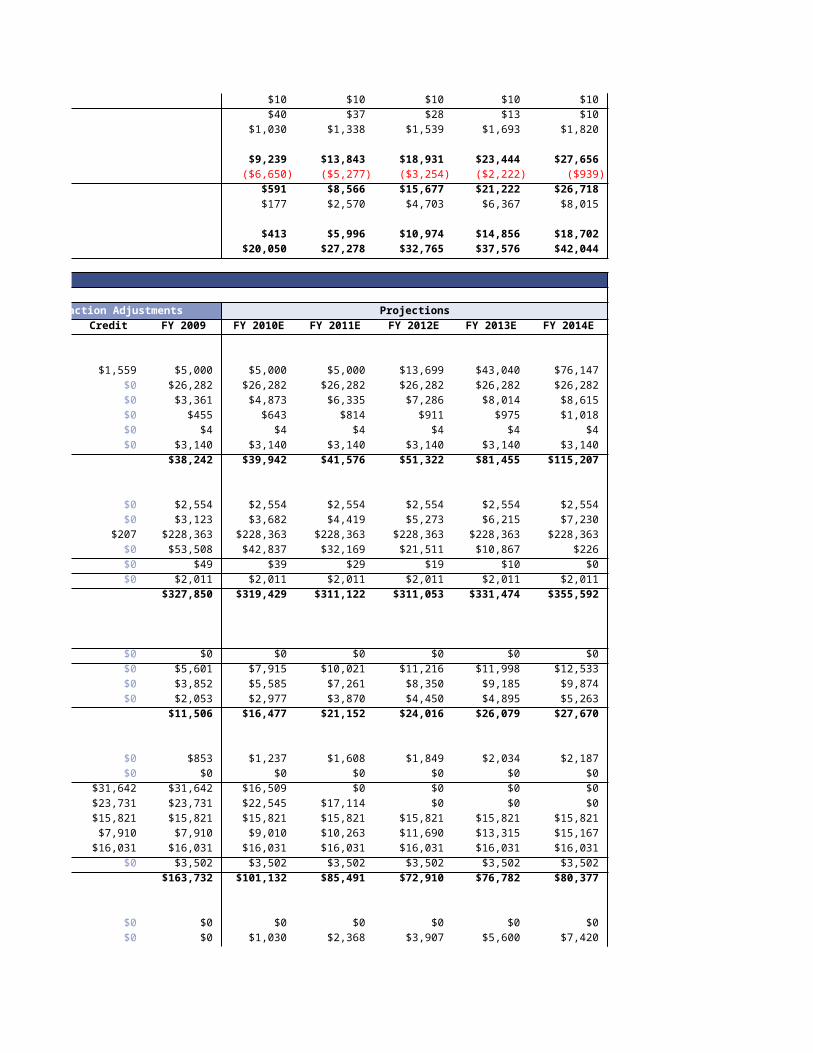
Transaction Adjustments Projections
FY 2009 FY 2010E FY 2011E FY 2012E FY 2013E FY 2014E
$5,000 $5,000 $5,000 $13,699 $43,040 $76,147
$26,282 $26,282 $26,282 $26,282 $26,282 $26,282
$3,361 $4,873 $6,335 $7,286 $8,014 $8,615
$455 $643 $814 $911 $975 $1,018
$4 $4 $4 $4 $4 $4
$3,140 $3,140 $3,140 $3,140 $3,140 $3,140
$38,242 $39,942 $41,576 $51,322 $81,455 $115,207
$2,554 $2,554 $2,554 $2,554 $2,554 $2,554
$3,123 $3,682 $4,419 $5,273 $6,215 $7,230
$228,363 $228,363 $228,363 $228,363 $228,363 $228,363
$53,508 $42,837 $32,169 $21,511 $10,867 $226
$49 $39 $29 $19 $10 $0
$2,011 $2,011 $2,011 $2,011 $2,011 $2,011
$327,850 $319,429 $311,122 $311,053 $331,474 $355,592
$0 $0 $0 $0 $0 $0
$5,601 $7,915 $10,021 $11,216 $11,998 $12,533
$3,852 $5,585 $7,261 $8,350 $9,185 $9,874
$2,053 $2,977 $3,870 $4,450 $4,895 $5,263
$11,506 $16,477 $21,152 $24,016 $26,079 $27,670
$853 $1,237 $1,608 $1,849 $2,034 $2,187
$0 $0 $0 $0 $0 $0
$36,915 $16,509 $0 $0 $0 $0
$27,686 $22,545 $17,114 $0 $0 $0
$18,458 $15,821 $15,821 $15,821 $15,821 $15,821
$9,229 $9,010 $10,263 $11,690 $13,315 $15,167
$16,031 $16,031 $16,031 $16,031 $16,031 $16,031
$3,502 $3,502 $3,502 $3,502 $3,502 $3,502
$163,732 $101,132 $85,491 $72,910 $76,782 $80,377
$0 $0 $0 $0 $0 $0
$0 $1,030 $2,368 $3,907 $5,600 $7,420
$0 $0 $0 $0 $0 $0
$216,923 $216,923 $216,923 $216,923 $216,923 $216,923
($69) $344 $6,340 $17,314 $32,169 $50,872
$0 $0 $0 $0 $0 $0
$216,854 $218,297 $225,631 $238,144 $254,692 $275,215
$380,586 $319,429 $311,122 $311,053 $331,474 $355,592
-52,736 Balanced! Balanced! Balanced! Balanced! Balanced!
Transaction Adjustments Projections
FY 2009 FY 2010E FY 2011E FY 2012E FY 2013E FY 2014E
$413 $5,996 $10,974 $14,856 $18,702
$1,064 $1,384 $1,591 $1,750 $1,882
$35 $35 $35 $35 $35
$10,631 $10,631 $10,631 $10,631 $10,631
$10 $10 $10 $10 $10
$1,100 $1,253 $1,427 $1,625 $1,851
$40 $37 $28 $13 $10
$1,030 $1,338 $1,539 $1,693 $1,820
($1,512) ($1,462) ($950) ($729) ($601)
($188) ($171) ($97) ($64) ($43)
$0 $0 $0 $0 $0
$0 $0 $0 $0 $0
$2,314 $2,106 $1,195 $782 $535
$1,308 $1,264 $822 $630 $520
$1,733 $1,676 $1,089 $835 $689
$17,978 $24,097 $28,293 $32,068 $36,040
($1,659) ($2,156) ($2,480) ($2,728) ($2,932)
$16,319 $21,940 $25,813 $29,340 $33,108
$0 $0 $0 $0 $0
($15,132) ($16,509) $0 $0 $0
($1,187) ($5,431) ($17,114) $0 $0
$0 $0 $0 $0 $0
$0 $0 $0 $0 $0
($16,319) ($21,940) ($17,114) $0 $0
$0 $0 $8,699 $29,340 $33,108
$5,000 $5,000 $5,000 $13,699 $43,040
$5,000 $5,000 $13,699 $43,040 $76,147
Projections
FY 2010E FY 2011E FY 2012E FY 2013E FY 2014E
4.55% 4.78% 4.94% 4.75% 4.40%
7.05% 7.28% 7.44% 7.25% 6.90%
8.05% 8.28% 8.44% 8.25% 7.90%
9.55% 9.78% 9.94% 9.75% 9.40%
11.00% 11.00% 11.00% 11.00% 11.00%
13.00% 13.00% 13.00% 13.00% 13.00%
$0 $0 $0 $0 $0
($1,938) ($683) $0 $0 $0
($2,210) ($1,939) ($851) $0 $0
($1,740) ($1,740) ($1,740) ($1,740) ($1,740)
($1,100) ($1,253) ($1,427) ($1,625) ($1,851)
$338 $338 $764 $1,144 $2,653
($6,650) ($5,277) ($3,254) ($2,222) ($939)
$5,000 $5,000 $5,000 $13,699 $43,040
($5,000) ($5,000) ($5,000) ($5,000) ($5,000)
$16,319 $21,940 $25,813 $29,340 $33,108
$16,319 $21,940 $25,813 $38,040 $71,147
$0 $0 $0 $0 $0
$16,319 $21,940 $25,813 $38,040 $71,147
$3,692 $3,164 $0 $0 $0
$1,384 $1,187 $1,187 $0 $0
$0 $0 $0 $0 $0
$0 $0 $0 $0 $0
$5,076 $4,351 $1,187 $0 $0
$0 $0 $0 $0 $0
$11,243 $13,345 $0 $0 $0
$0 $4,244 $15,927 $0 $0
$0 $0 $0 $0 $0
$0 $0 $0 $0 $0
$9,068 $17,589 $15,927 $0 $0
$0 $0 $8,699 $38,040 $71,147
$16,319 $21,940 $25,813 $38,040 $71,147
FY 2009 FY 2010E FY 2011E FY 2012E FY 2013E FY 2014E
$13,184 $42,044
15.6 x 10.0 x
$205,805 $420,440
($253,716) $0 $0 $0 $0 $494,436
12.1%
Exit Multiple
12.0 x 13.0 x 14.0 x
12.1% 12.1% 12.1%
12.1% 12.1% 12.1%
12.1% 12.1% 12.1%
12.1% 12.1% 12.1%
12.1% 12.1% 12.1%
12.1% 12.1% 12.1%
12.1% 12.1% 12.1%
12.1% 12.1% 12.1%
12.1% 12.1% 12.1%
12.1% 12.1% 12.1%
Leverage Ratio
8.0 x 9.0 x 10.0 x
12.1% 12.1% 12.1%
12.1% 12.1% 12.1%
12.1% 12.1% 12.1%
12.1% 12.1% 12.1%
12.1% 12.1% 12.1%
12.1% 12.1% 12.1%
12.1% 12.1% 12.1%
12.1% 12.1% 12.1%
12.1% 12.1% 12.1%
12.1% 12.1% 12.1%
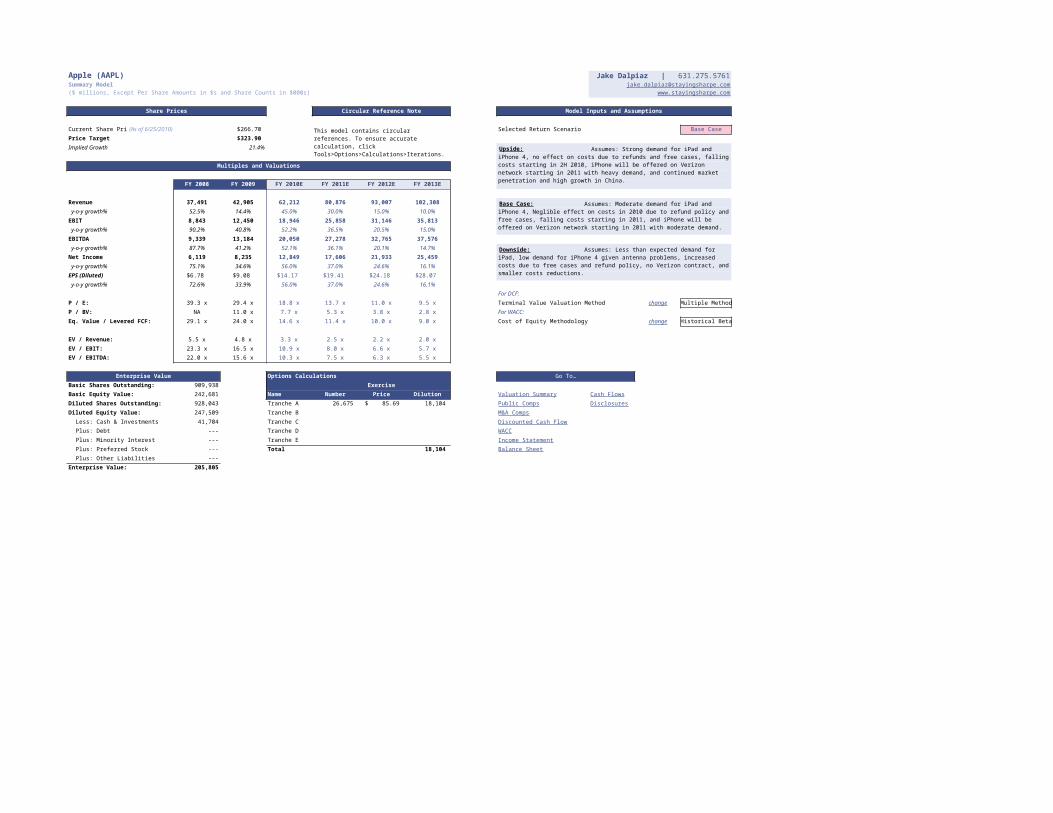
Apple (AAPL)Summary Model
($ millions, Except Per Share Amounts in $s and Share Counts in $000s)
Share Prices Circular Reference Note Model Inputs and Assumptions
Current Share Price (As of 6/25/2010) $266.70 Selected Return Scenario Base Case
Price Target $323.90
Implied Growth 21.4%
Multiples and Valuations
FY 2008 FY 2009 FY 2010E FY 2011E FY 2012E FY 2013E
Revenue 37,491 42,905 62,212 80,876 93,007 102,308
y-o-y growth% 52.5% 14.4% 45.0% 30.0% 15.0% 10.0%
EBIT 8,843 12,450 18,946 25,858 31,146 35,813
y-o-y growth% 90.2% 40.8% 52.2% 36.5% 20.5% 15.0%
EBITDA 9,339 13,184 20,050 27,278 32,765 37,576
y-o-y growth% 87.7% 41.2% 52.1% 36.1% 20.1% 14.7%
Net Income 6,119 8,235 12,849 17,606 21,933 25,459
y-o-y growth% 75.1% 34.6% 56.0% 37.0% 24.6% 16.1%
EPS (Diluted) $6.78 $9.08 $14.17 $19.41 $24.18 $28.07
y-o-y growth% 72.6% 33.9% 56.0% 37.0% 24.6% 16.1%
For DCF:
P / E: 39.3 x 29.4 x 18.8 x 13.7 x 11.0 x 9.5 x Terminal Value Valuation Method Multiple Method
P / BV: NA 11.0 x 7.7 x 5.3 x 3.8 x 2.8 x For WACC:
Eq. Value / Levered FCF: 29.1 x 24.0 x 14.6 x 11.4 x 10.0 x 9.0 x Cost of Equity Methodology Historical Beta
EV / Revenue: 5.5 x 4.8 x 3.3 x 2.5 x 2.2 x 2.0 x
EV / EBIT: 23.3 x 16.5 x 10.9 x 8.0 x 6.6 x 5.7 x
EV / EBITDA: 22.0 x 15.6 x 10.3 x 7.5 x 6.3 x 5.5 x
Enterprise Value Options Calculations Go To…
Basic Shares Outstanding: 909,938 Exercise
Basic Equity Value: 242,681 Name Number Price Dilution
Diluted Shares Outstanding: 928,043 Tranche A 26,675 $ 85.69 18,104
Diluted Equity Value: 247,509 Tranche B
Less: Cash & Investments 41,704 Tranche C
Plus: Debt --- Tranche D
Plus: Minority Interest --- Tranche E
Plus: Preferred Stock --- Total 18,104
Plus: Other Liabilities ---
Enterprise Value: 205,805
Jake Dalpiaz | [email protected]
www.stayingsharpe.com
This model contains circular references. To ensure accurate calculation, click Tools>Options>Calculations>Iterations.
Assumes: Strong demand for iPad and iPhone 4, no effect on costs due to refunds and free cases, falling costs starting in 2H 2010, iPhone will be offered on Verizon network starting in 2011 with heavy demand, and continued market penetration and high growth in China.
Assumes: Moderate demand for iPad and iPhone 4, Neglible effect on costs in 2010 due to refund policy and free cases, falling costs starting in 2011, and iPhone will be offered on Verizon network starting in 2011 with moderate demand.
Assumes: Less than expected demand for iPad, low demand for iPhone 4 given antenna problems, increased costs due to free cases and refund policy, no Verizon contract, and smaller costs reductions.
change
change
Valuation Summary Cash Flows
Public Comps Disclosures
M&A Comps
Discounted Cash Flow
WACC
Income Statement
Balance Sheet
Upside:
Base Case:
Downside:
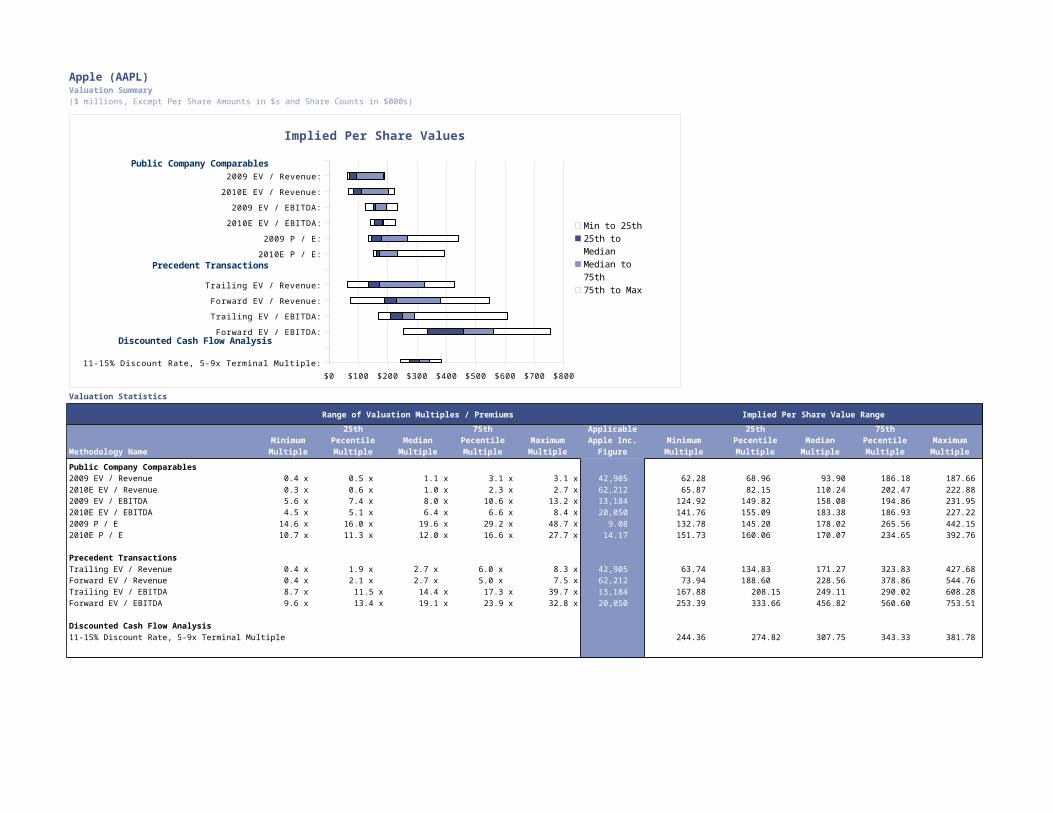
Apple (AAPL)Valuation Summary($ millions, Except Per Share Amounts in $s and Share Counts in $000s)
Valuation Statistics
Range of Valuation Multiples / Premiums Implied Per Share Value Range
25th 75th Applicable 25th 75thMinimum Pecentile Median Pecentile Maximum Apple Inc. Minimum Pecentile Median Pecentile Maximum
Methodology Name Multiple Multiple Multiple Multiple Multiple Figure Multiple Multiple Multiple Multiple Multiple
Public Company Comparables2009 EV / Revenue 0.4 x 0.5 x 1.1 x 3.1 x 3.1 x 42,905 62.28 68.96 93.90 186.18 187.66 2010E EV / Revenue 0.3 x 0.6 x 1.0 x 2.3 x 2.7 x 62,212 65.87 82.15 110.24 202.47 222.88 2009 EV / EBITDA 5.6 x 7.4 x 8.0 x 10.6 x 13.2 x 13,184 124.92 149.82 158.08 194.86 231.95 2010E EV / EBITDA 4.5 x 5.1 x 6.4 x 6.6 x 8.4 x 20,050 141.76 155.09 183.38 186.93 227.22 2009 P / E 14.6 x 16.0 x 19.6 x 29.2 x 48.7 x 9.08 132.78 145.20 178.02 265.56 442.15 2010E P / E 10.7 x 11.3 x 12.0 x 16.6 x 27.7 x 14.17 151.73 160.06 170.07 234.65 392.76
Precedent TransactionsTrailing EV / Revenue 0.4 x 1.9 x 2.7 x 6.0 x 8.3 x 42,905 63.74 134.83 171.27 323.83 427.68 Forward EV / Revenue 0.4 x 2.1 x 2.7 x 5.0 x 7.5 x 62,212 73.94 188.60 228.56 378.86 544.76 Trailing EV / EBITDA 8.7 x 11.5 x 14.4 x 17.3 x 39.7 x 13,184 167.88 208.15 249.11 290.02 608.28 Forward EV / EBITDA 9.6 x 13.4 x 19.1 x 23.9 x 32.8 x 20,050 253.39 333.66 456.82 560.60 753.51
Discounted Cash Flow Analysis11-15% Discount Rate, 5-9x Terminal Multiple 244.36 274.82 307.75 343.33 381.78
11-15% Discount Rate, 5-9x Terminal Multiple:
Forward EV / EBITDA:
Trailing EV / EBITDA:
Forward EV / Revenue:
Trailing EV / Revenue:
2010E P / E:
2009 P / E:
2010E EV / EBITDA:
2009 EV / EBITDA:
2010E EV / Revenue:
2009 EV / Revenue:
$0 $100 $200 $300 $400 $500 $600 $700 $800
Implied Per Share Values
Min to 25th
25th to Median
Median to 75th
75th to Max
Public Company Comparables
Precedent Transactions
Discounted Cash Flow Analysis
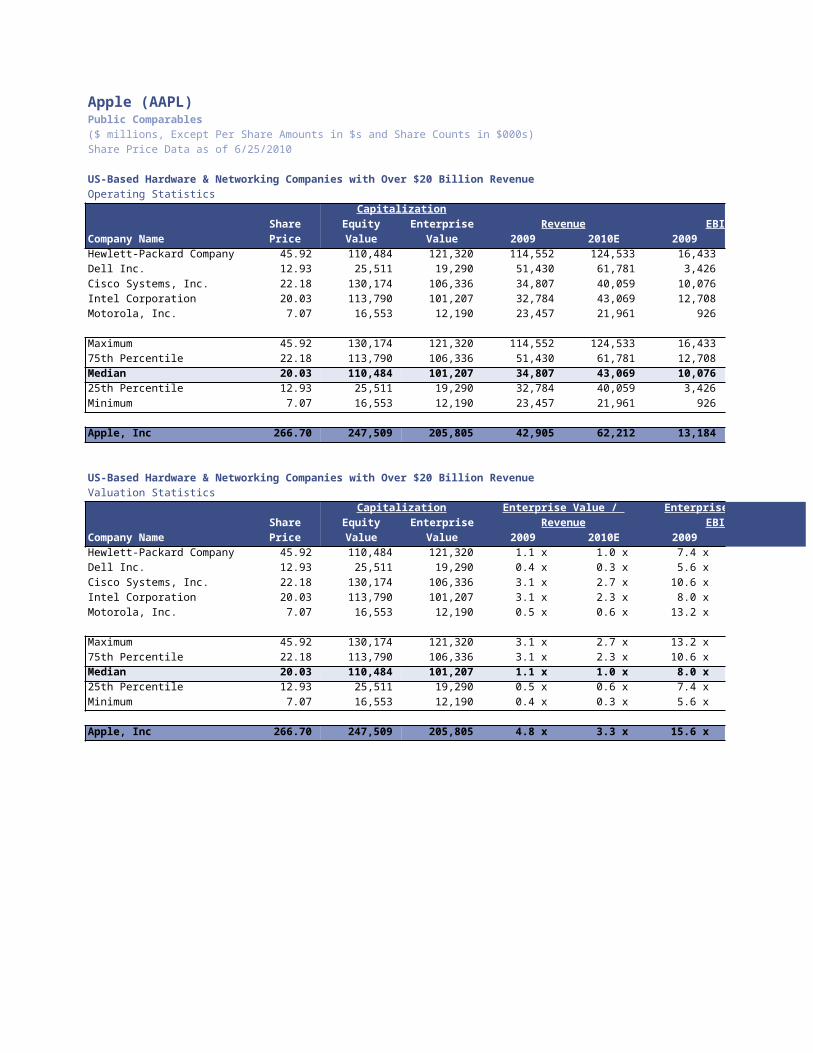
Apple (AAPL)Public Comparables
($ millions, Except Per Share Amounts in $s and Share Counts in $000s)
Share Price Data as of 6/25/2010
US-Based Hardware & Networking Companies with Over $20 Billion Revenue
Operating Statistics
Capitalization
Share Equity Enterprise Revenue EBITDA
Company Name Price Value Value 2009 2010E 2009
Hewlett-Packard Company 45.92 110,484 121,320 114,552 124,533 16,433
Dell Inc. 12.93 25,511 19,290 51,430 61,781 3,426
Cisco Systems, Inc. 22.18 130,174 106,336 34,807 40,059 10,076
Intel Corporation 20.03 113,790 101,207 32,784 43,069 12,708
Motorola, Inc. 7.07 16,553 12,190 23,457 21,961 926
Maximum 45.92 130,174 121,320 114,552 124,533 16,433
75th Percentile 22.18 113,790 106,336 51,430 61,781 12,708
Median 20.03 110,484 101,207 34,807 43,069 10,076
25th Percentile 12.93 25,511 19,290 32,784 40,059 3,426
Minimum 7.07 16,553 12,190 23,457 21,961 926
Apple, Inc 266.70 247,509 205,805 42,905 62,212 13,184
US-Based Hardware & Networking Companies with Over $20 Billion Revenue
Valuation Statistics
Capitalization Enterprise Value / Enterprise Value /
Share Equity Enterprise Revenue EBITDA
Company Name Price Value Value 2009 2010E 2009
Hewlett-Packard Company 45.92 110,484 121,320 1.1 x 1.0 x 7.4 x
Dell Inc. 12.93 25,511 19,290 0.4 x 0.3 x 5.6 x
Cisco Systems, Inc. 22.18 130,174 106,336 3.1 x 2.7 x 10.6 x
Intel Corporation 20.03 113,790 101,207 3.1 x 2.3 x 8.0 x
Motorola, Inc. 7.07 16,553 12,190 0.5 x 0.6 x 13.2 x
Maximum 45.92 130,174 121,320 3.1 x 2.7 x 13.2 x
75th Percentile 22.18 113,790 106,336 3.1 x 2.3 x 10.6 x
Median 20.03 110,484 101,207 1.1 x 1.0 x 8.0 x
25th Percentile 12.93 25,511 19,290 0.5 x 0.6 x 7.4 x
Minimum 7.07 16,553 12,190 0.4 x 0.3 x 5.6 x
Apple, Inc 266.70 247,509 205,805 4.8 x 3.3 x 15.6 x

6782
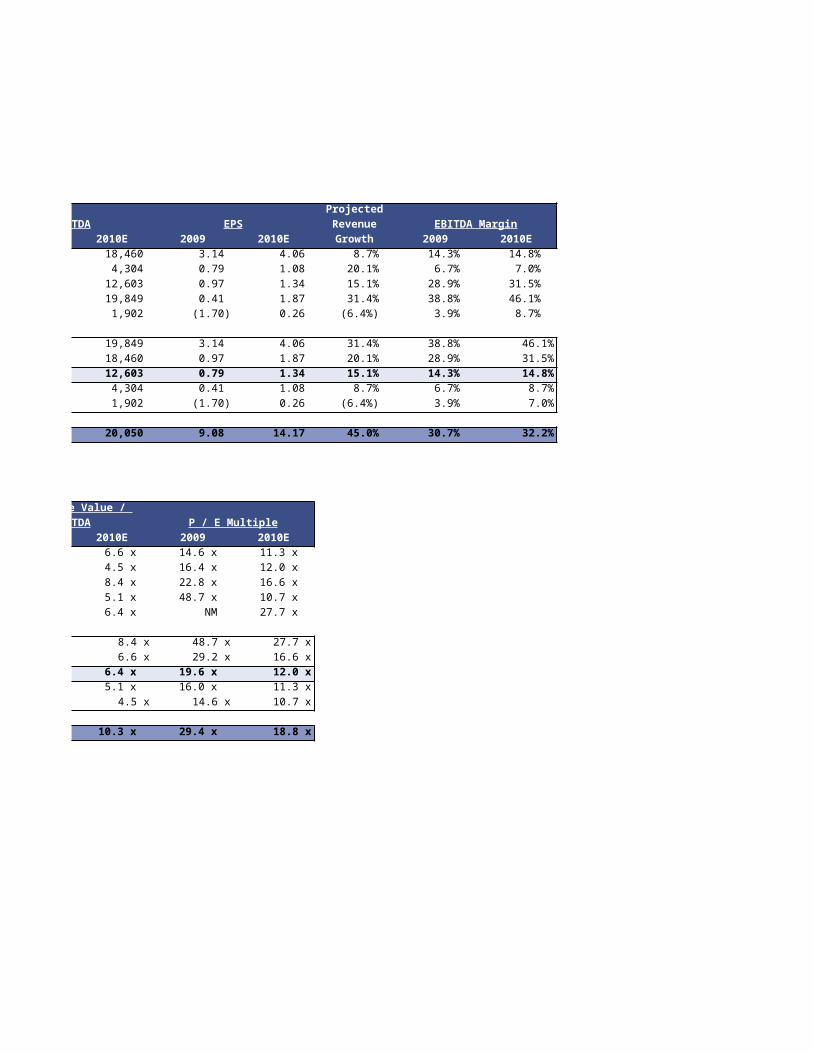
Projected
EBITDA EPS Revenue EBITDA Margin
2010E 2009 2010E Growth 2009 2010E
18,460 3.14 4.06 8.7% 14.3% 14.8%
4,304 0.79 1.08 20.1% 6.7% 7.0%
12,603 0.97 1.34 15.1% 28.9% 31.5%
19,849 0.41 1.87 31.4% 38.8% 46.1%
1,902 (1.70) 0.26 (6.4%) 3.9% 8.7%
19,849 3.14 4.06 31.4% 38.8% 46.1%
18,460 0.97 1.87 20.1% 28.9% 31.5%
12,603 0.79 1.34 15.1% 14.3% 14.8%
4,304 0.41 1.08 8.7% 6.7% 8.7%
1,902 (1.70) 0.26 (6.4%) 3.9% 7.0%
20,050 9.08 14.17 45.0% 30.7% 32.2%
Enterprise Value /
EBITDA P / E Multiple
2010E 2009 2010E
6.6 x 14.6 x 11.3 x
4.5 x 16.4 x 12.0 x
8.4 x 22.8 x 16.6 x
5.1 x 48.7 x 10.7 x
6.4 x NM 27.7 x
8.4 x 48.7 x 27.7 x
6.6 x 29.2 x 16.6 x
6.4 x 19.6 x 12.0 x
5.1 x 16.0 x 11.3 x
4.5 x 14.6 x 10.7 x
10.3 x 29.4 x 18.8 x
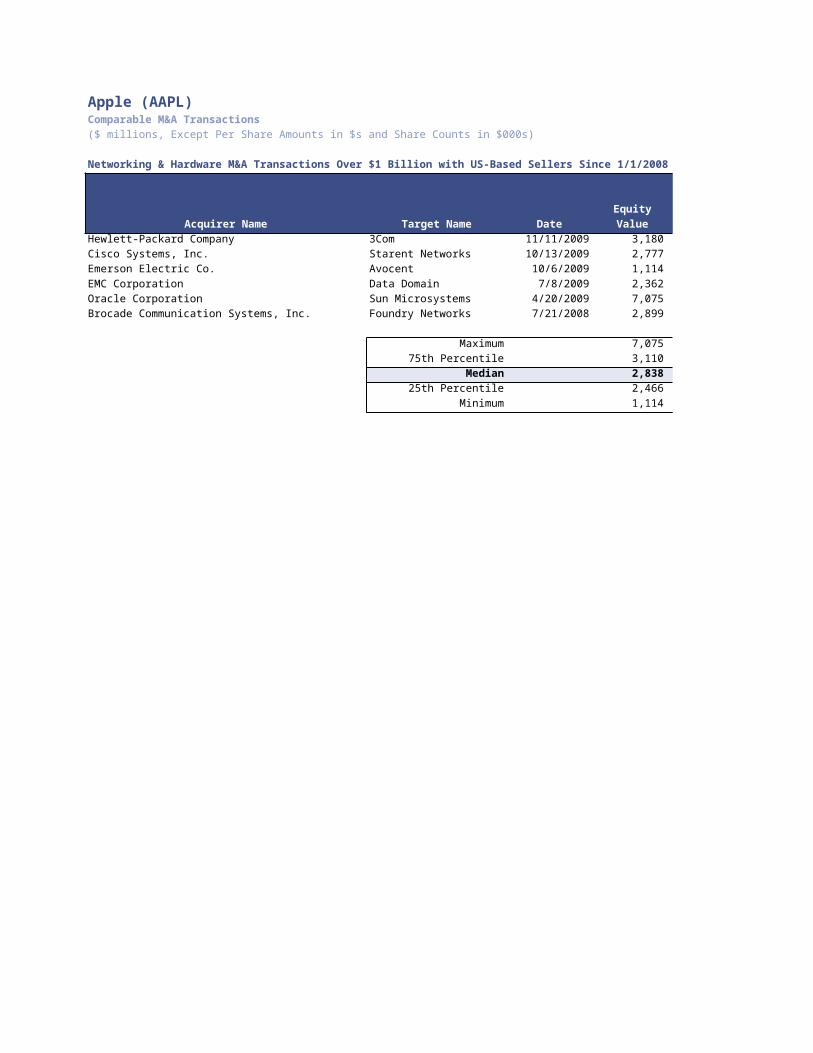
Apple (AAPL)Comparable M&A Transactions
($ millions, Except Per Share Amounts in $s and Share Counts in $000s)
Networking & Hardware M&A Transactions Over $1 Billion with US-Based Sellers Since 1/1/2008
Equity Enterprise
Acquirer Name Target Name Date Value Value
Hewlett-Packard Company 3Com 11/11/2009 3,180 2,714
Cisco Systems, Inc. Starent Networks 10/13/2009 2,777 2,386
Emerson Electric Co. Avocent 10/6/2009 1,114 1,147
EMC Corporation Data Domain 7/8/2009 2,362 2,085
Oracle Corporation Sun Microsystems 4/20/2009 7,075 5,392
Brocade Communication Systems, Inc. Foundry Networks 7/21/2008 2,899 2,063
Maximum 7,075 5,392
75th Percentile 3,110 2,632
Median 2,838 2,235
25th Percentile 2,466 2,068
Minimum 1,114 1,147
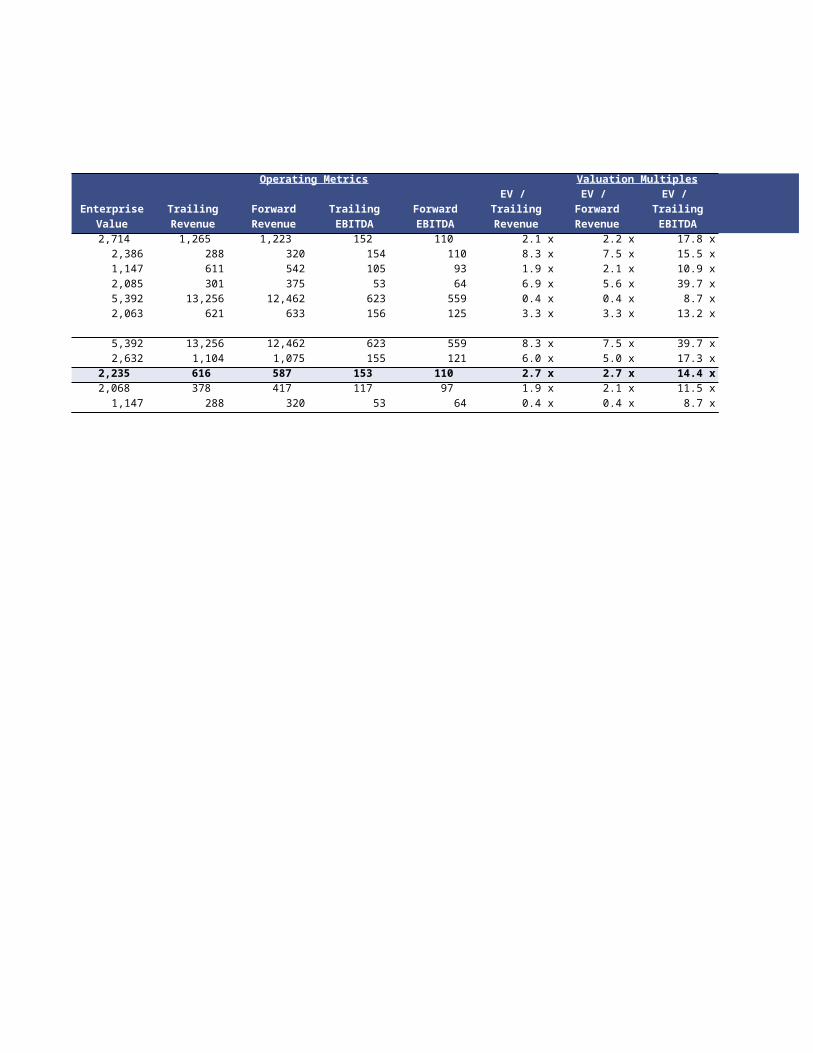
Operating Metrics Valuation Multiples
EV / EV / EV / EV /
Trailing Forward Trailing Forward Trailing Forward Trailing Forward
Revenue Revenue EBITDA EBITDA Revenue Revenue EBITDA EBITDA
1,265 1,223 152 110 2.1 x 2.2 x 17.8 x 24.6 x
288 320 154 110 8.3 x 7.5 x 15.5 x 21.6 x
611 542 105 93 1.9 x 2.1 x 10.9 x 12.3 x
301 375 53 64 6.9 x 5.6 x 39.7 x 32.8 x
13,256 12,462 623 559 0.4 x 0.4 x 8.7 x 9.6 x
621 633 156 125 3.3 x 3.3 x 13.2 x 16.5 x
13,256 12,462 623 559 8.3 x 7.5 x 39.7 x 32.8 x
1,104 1,075 155 121 6.0 x 5.0 x 17.3 x 23.9 x
616 587 153 110 2.7 x 2.7 x 14.4 x 19.1 x
378 417 117 97 1.9 x 2.1 x 11.5 x 13.4 x
288 320 53 64 0.4 x 0.4 x 8.7 x 9.6 x

Apple (AAPL)Discounted Cash Flow Analysis
($ millions, Except Per Share Amounts in $s and Share Counts in $000s)
Cash Flow Projections FY 2010E FY 2011E FY 2012E FY 2013E FY 2014E DCF Assumptions & Output
Revenue 62,212 80,876 93,007 102,308 109,981 Choose TV Valuation Method:
EBITDA 20,050 27,278 32,765 37,576 42,044 Discount Rate:
Operating Income 17,916 24,519 29,607 34,120 38,332
Terminal EBITDA Multiple:
Less: Taxes (5,375) (7,356) (8,882) (10,236) (11,500) Terminal Growth Rate:
Terminal Value:
Plus: Depreciation 1,064 1,384 1,591 1,750 1,882
Plus: Amortization 40 37 28 13 10 PV of Terminal Value:
Plus: Stock-Based Compensation 1,030 1,338 1,539 1,693 1,820 Sum of PV of Cash Flows:
Enterprise Value:
Less: Increase in Working Capital 3,655 3,413 2,058 1,455 1,099
Less: Capital Expenditures (1,659) (2,156) (2,480) (2,728) (2,932) Terminal Value % EV:
Unlevered Free Cash Flow 16,671 21,179 23,461 26,067 28,711 Enterprise Value:
Present Value of Free Cash Flow 15,796 18,015 17,916 17,870 17,670 Balance Sheet Adjustment:
Implied Equity Value:
Normal Discount Period: 1.000 2.000 3.000 4.000 5.000
Mid-Year Discount: 0.500 1.500 2.500 3.500 4.500 Implied Price Per Share:
Free Cash Flow Growth Rate: 27.0% 10.8% 11.1% 10.1% Implied Growth
Net Present Value Sensitivity - Terminal Growth Rates
Discount Rate
$ 323.90 10.0% 11.0% 12.0% 13.0% 14.0% 15.0% 16.0%
0.0% 338.95 328.01 317.62 307.75 298.35 289.40 280.89
1.0% 338.95 328.01 317.62 307.75 298.35 289.40 280.89
2.0% 338.95 328.01 317.62 307.75 298.35 289.40 280.89
3.0% 338.95 328.01 317.62 307.75 298.35 289.40 280.89
4.0% 338.95 328.01 317.62 307.75 298.35 289.40 280.89
5.0% 338.95 328.01 317.62 307.75 298.35 289.40 280.89
Net Present Value Sensitivity - Terminal EBITDA Multiples
Discount Rate
$ 323.90 10.0% 11.0% 12.0% 13.0% 14.0% 15.0% 16.0%
4.0 x 254.56 247.36 240.50 233.98 227.76 221.83 216.18
5.0 x 282.69 274.24 266.21 258.57 251.29 244.36 237.75
6.0 x 310.82 301.13 291.92 283.16 274.82 266.88 259.32
7.0 x 338.95 328.01 317.62 307.75 298.35 289.40 280.89
8.0 x 367.08 354.90 343.33 332.33 321.88 311.93 302.46
9.0 x 395.21 381.78 369.04 356.92 345.41 334.45 324.03
Ter
min
al G
row
th
Rat
eT
erm
inal
EB
ITD
A
Mu
ltip
le
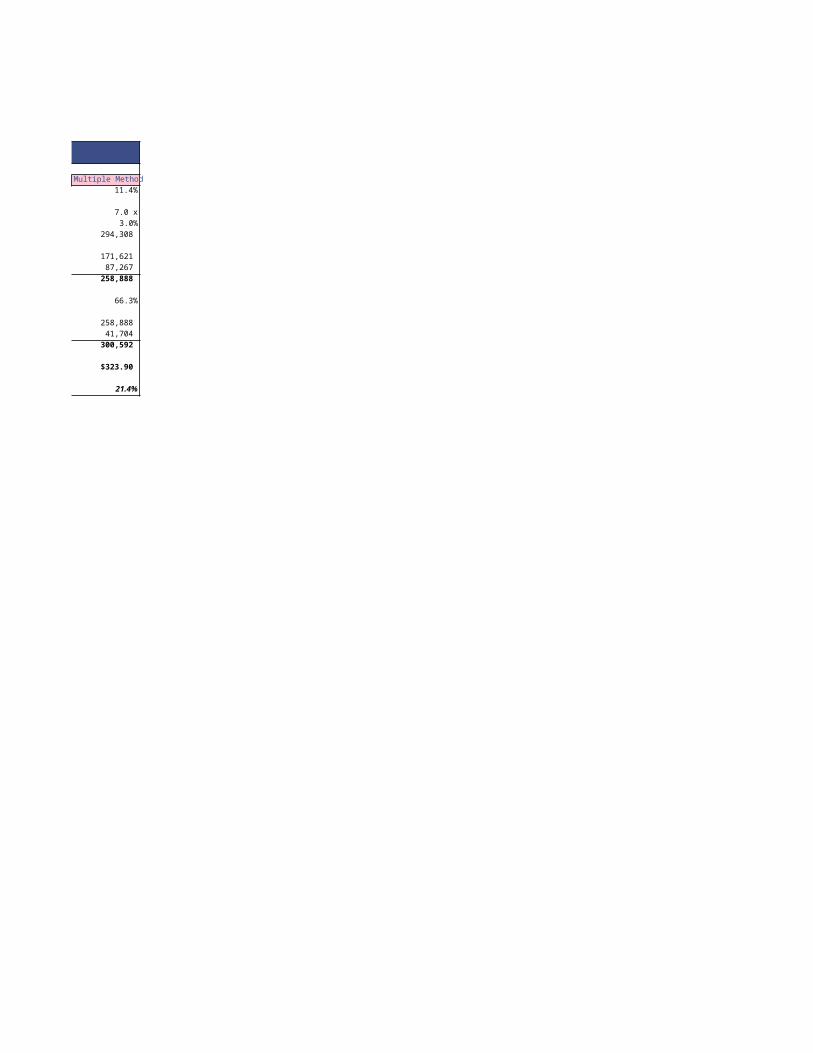
Multiple Method
11.4%
7.0 x
3.0%
294,308
171,621
87,267
258,888
66.3%
258,888
41,704
300,592
$323.90
21.4%
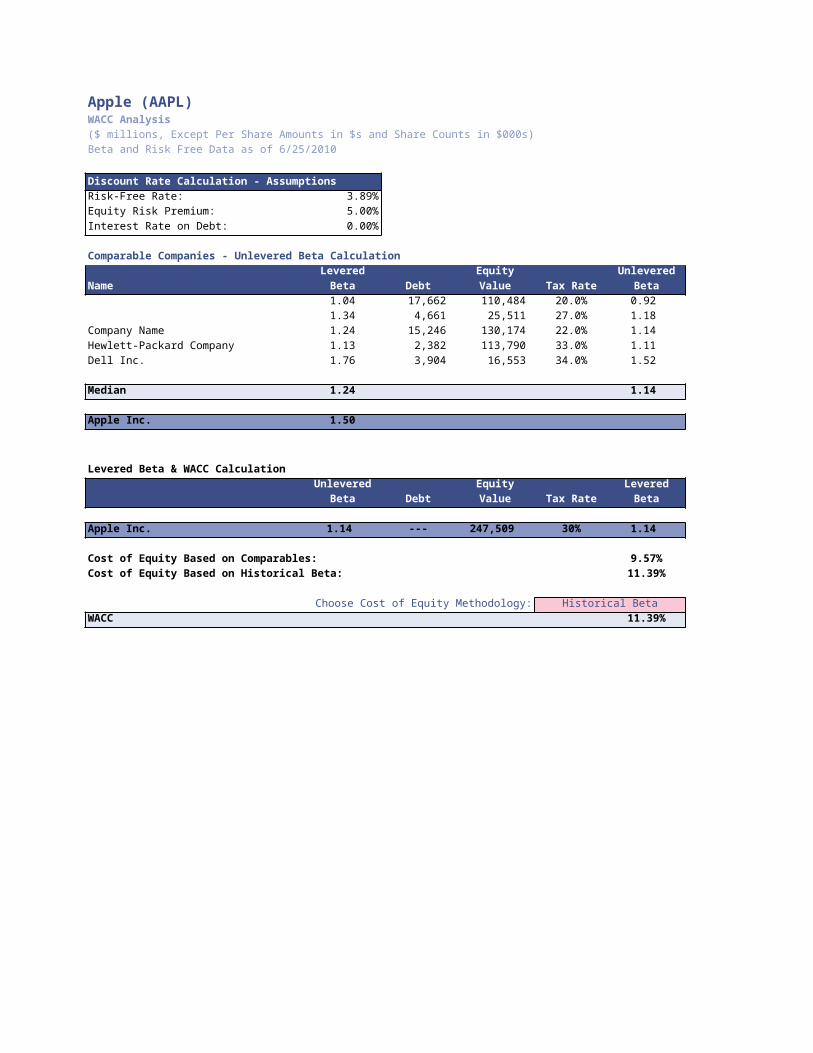
Apple (AAPL)WACC Analysis
($ millions, Except Per Share Amounts in $s and Share Counts in $000s)
Beta and Risk Free Data as of 6/25/2010
Discount Rate Calculation - Assumptions
Risk-Free Rate: 3.89%
Equity Risk Premium: 5.00%
Interest Rate on Debt: 0.00%
Comparable Companies - Unlevered Beta Calculation
Levered Equity Unlevered
Name Beta Debt Value Tax Rate Beta
1.04 17,662 110,484 20.0% 0.92
1.34 4,661 25,511 27.0% 1.18
Company Name 1.24 15,246 130,174 22.0% 1.14
Hewlett-Packard Company 1.13 2,382 113,790 33.0% 1.11
Dell Inc. 1.76 3,904 16,553 34.0% 1.52
Median 1.24 1.14
Apple Inc. 1.50
Levered Beta & WACC Calculation
Unlevered Equity Levered
Beta Debt Value Tax Rate Beta
Apple Inc. 1.14 --- 247,509 30% 1.14
Cost of Equity Based on Comparables: 9.57%
Cost of Equity Based on Historical Beta: 11.39%
Choose Cost of Equity Methodology: Historical Beta
WACC 11.39%
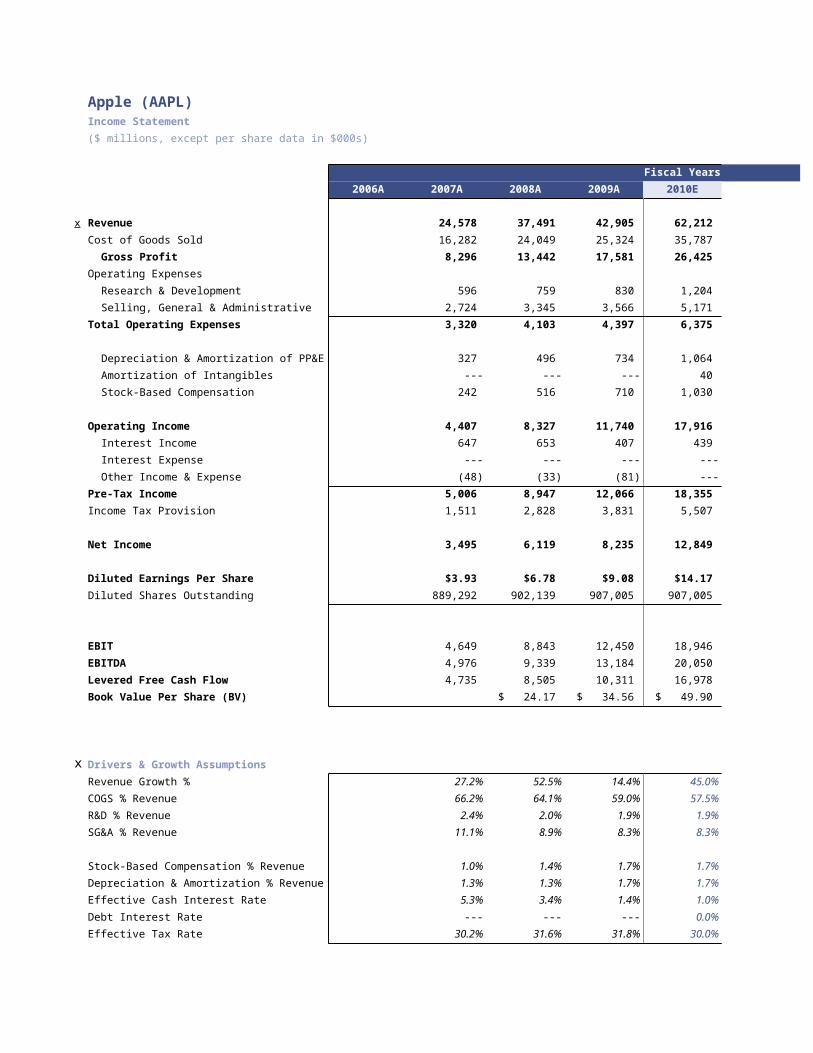
Apple (AAPL)Income Statement
($ millions, except per share data in $000s)
Fiscal Years
2006A 2007A 2008A 2009A 2010E
x Revenue 24,578 37,491 42,905 62,212
Cost of Goods Sold 16,282 24,049 25,324 35,787
Gross Profit 8,296 13,442 17,581 26,425
Operating Expenses
Research & Development 596 759 830 1,204
Selling, General & Administrative 2,724 3,345 3,566 5,171
Total Operating Expenses 3,320 4,103 4,397 6,375
Depreciation & Amortization of PP&E 327 496 734 1,064
Amortization of Intangibles --- --- --- 40
Stock-Based Compensation 242 516 710 1,030
Operating Income 4,407 8,327 11,740 17,916
Interest Income 647 653 407 439
Interest Expense --- --- --- ---
Other Income & Expense (48) (33) (81) ---
Pre-Tax Income 5,006 8,947 12,066 18,355
Income Tax Provision 1,511 2,828 3,831 5,507
Net Income 3,495 6,119 8,235 12,849
Diluted Earnings Per Share $3.93 $6.78 $9.08 $14.17
Diluted Shares Outstanding 889,292 902,139 907,005 907,005
EBIT 4,649 8,843 12,450 18,946
EBITDA 4,976 9,339 13,184 20,050
Levered Free Cash Flow 4,735 8,505 10,311 16,978
Book Value Per Share (BV) $ 24.17 $ 34.56 $ 49.90
x Drivers & Growth Assumptions
Revenue Growth % 27.2% 52.5% 14.4% 45.0%
COGS % Revenue 66.2% 64.1% 59.0% 57.5%
R&D % Revenue 2.4% 2.0% 1.9% 1.9%
SG&A % Revenue 11.1% 8.9% 8.3% 8.3%
Stock-Based Compensation % Revenue 1.0% 1.4% 1.7% 1.7%
Depreciation & Amortization % Revenue 1.3% 1.3% 1.7% 1.7%
Effective Cash Interest Rate 5.3% 3.4% 1.4% 1.0%
Debt Interest Rate --- --- --- 0.0%
Effective Tax Rate 30.2% 31.6% 31.8% 30.0%
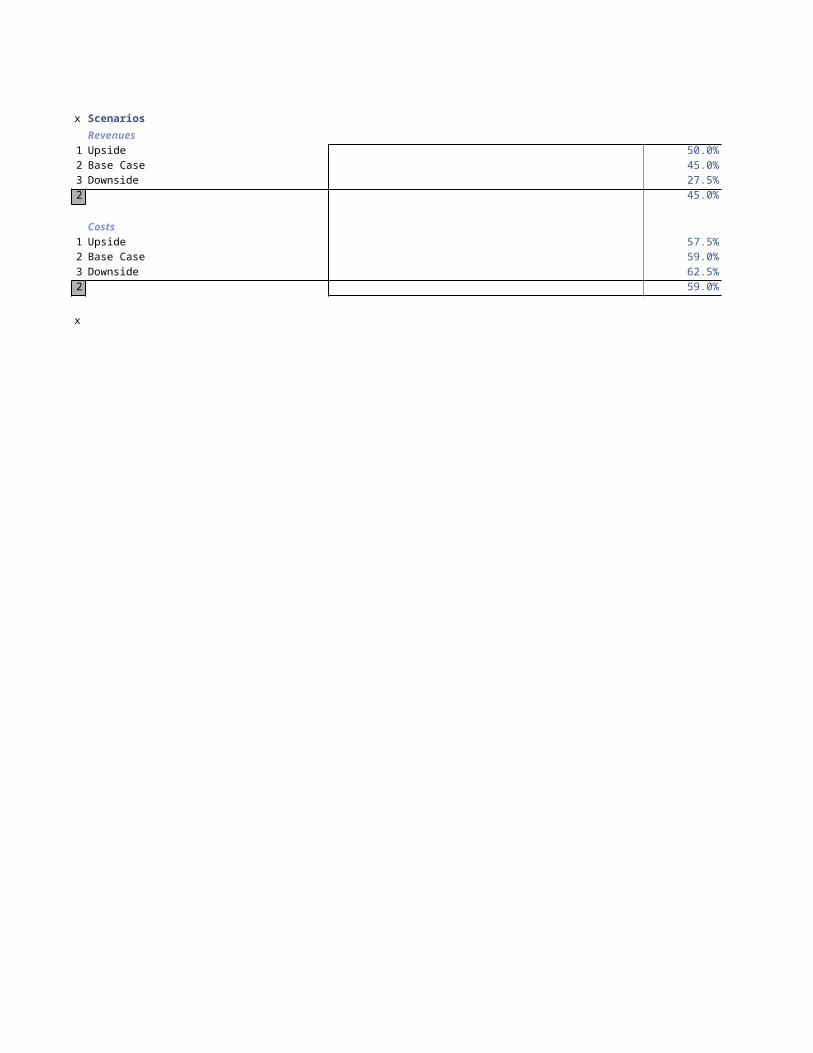
x Scenarios
Revenues
1 Upside 50.0%
2 Base Case 45.0%
3 Downside 27.5%
2 45.0%
Costs
1 Upside 57.5%
2 Base Case 59.0%
3 Downside 62.5%
2 59.0%
x
Fiscal Years
2011E 2012E 2013E 2014E
80,876 93,007 102,308 109,981
45,310 50,711 54,248 56,667
35,566 42,296 48,060 53,314
1,565 1,800 1,980 2,128
6,723 7,731 8,504 9,142
8,288 9,531 10,484 11,270
1,384 1,591 1,750 1,882
37 28 13 10
1,338 1,539 1,693 1,820
24,519 29,607 34,120 38,332
632 1,727 2,250 4,265
--- --- --- ---
--- --- --- ---
25,151 31,333 36,370 42,597
7,545 9,400 10,911 12,779
17,606 21,933 25,459 29,818
$19.41 $24.18 $28.07 $32.88
907,005 907,005 907,005 907,005
25,858 31,146 35,813 40,152
27,278 32,765 37,576 42,044
21,621 24,670 27,642 31,696
$ 70.83 $ 96.74 $ 126.69 $ 161.58
30.0% 15.0% 10.0% 7.5%
56.0% 54.5% 53.0% 51.5%
1.9% 1.9% 1.9% 1.9%
8.3% 8.3% 8.3% 8.3%
1.7% 1.7% 1.7% 1.7%
1.7% 1.7% 1.7% 1.7%
1.0% 2.0% 2.0% 3.0%
0.0% 0.0% 0.0% 0.0%
30.0% 30.0% 30.0% 30.0%
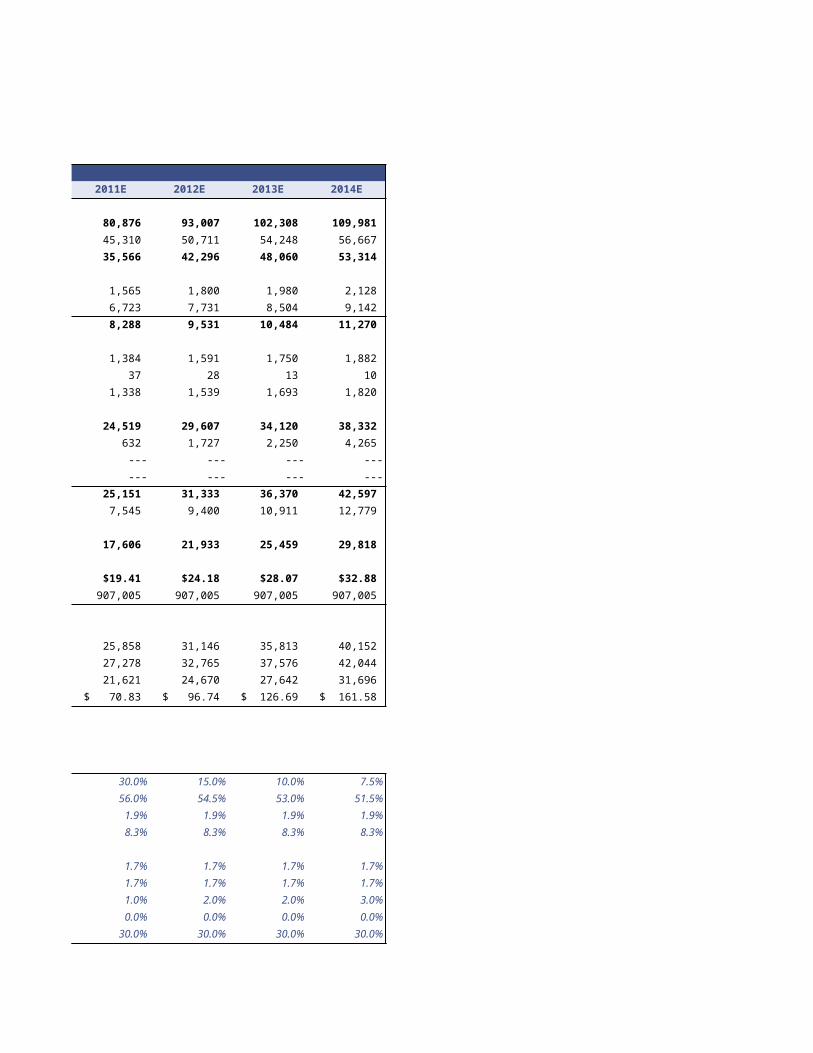
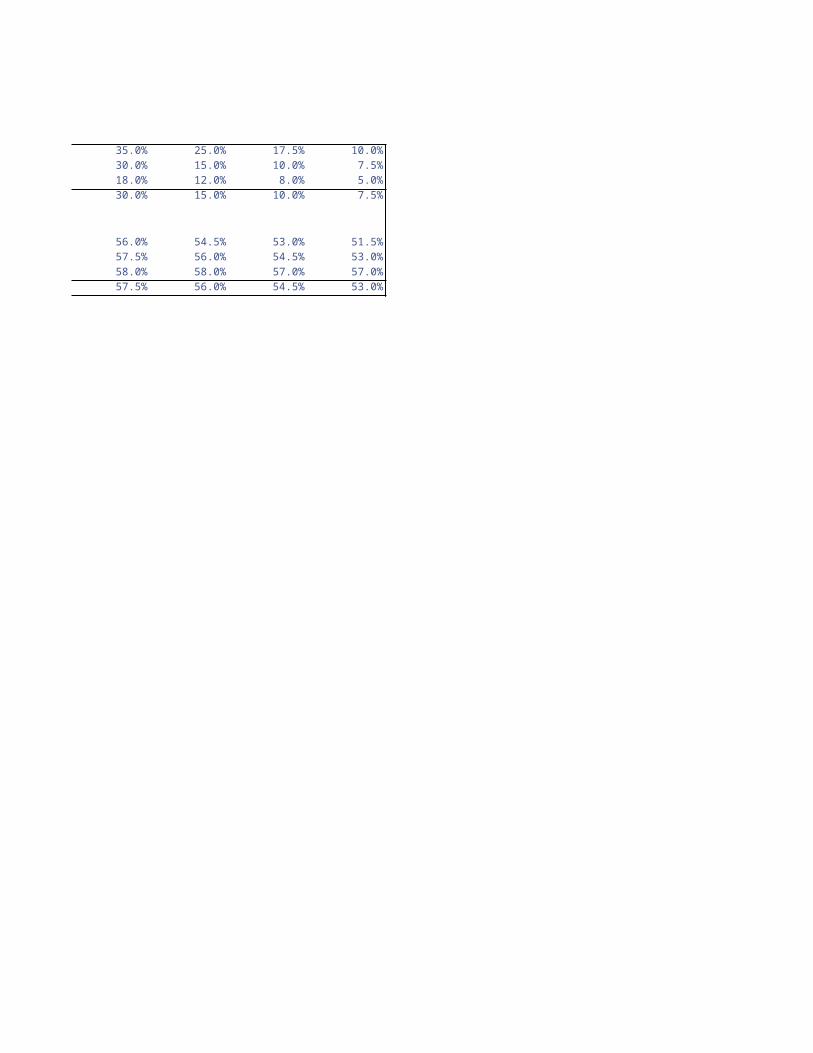
35.0% 25.0% 17.5% 10.0%
30.0% 15.0% 10.0% 7.5%
18.0% 12.0% 8.0% 5.0%
30.0% 15.0% 10.0% 7.5%
56.0% 54.5% 53.0% 51.5%
57.5% 56.0% 54.5% 53.0%
58.0% 58.0% 57.0% 57.0%
57.5% 56.0% 54.5% 53.0%
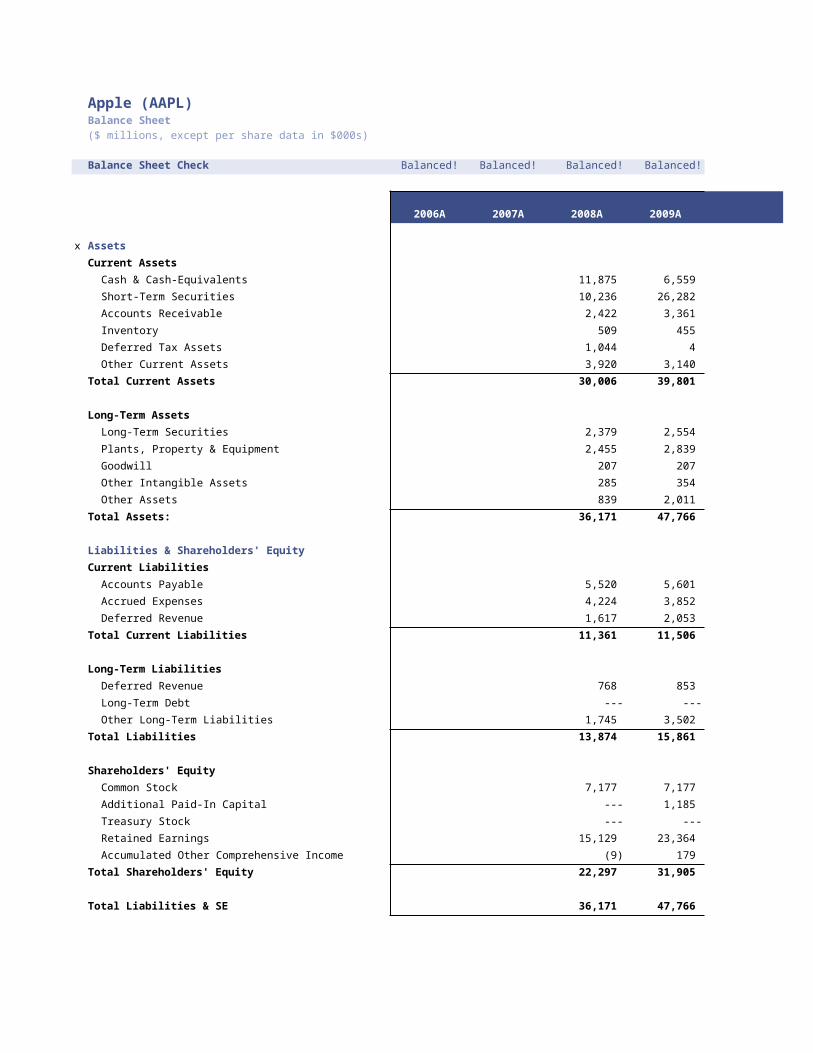
Apple (AAPL)Balance Sheet
($ millions, except per share data in $000s)
Balance Sheet Check Balanced! Balanced! Balanced! Balanced! Balanced!
Fiscal Years
2006A 2007A 2008A 2009A 2010E
x Assets
Current Assets
Cash & Cash-Equivalents 11,875 6,559 23,537
Short-Term Securities 10,236 26,282 26,282
Accounts Receivable 2,422 3,361 4,873
Inventory 509 455 643
Deferred Tax Assets 1,044 4 4
Other Current Assets 3,920 3,140 3,140
Total Current Assets 30,006 39,801 58,480
Long-Term Assets
Long-Term Securities 2,379 2,554 2,554
Plants, Property & Equipment 2,455 2,839 3,434
Goodwill 207 207 207
Other Intangible Assets 285 354 314
Other Assets 839 2,011 2,011
Total Assets: 36,171 47,766 66,999
Liabilities & Shareholders' Equity
Current Liabilities
Accounts Payable 5,520 5,601 7,915
Accrued Expenses 4,224 3,852 5,585
Deferred Revenue 1,617 2,053 2,977
Total Current Liabilities 11,361 11,506 16,477
Long-Term Liabilities
Deferred Revenue 768 853 1,237
Long-Term Debt --- --- ---
Other Long-Term Liabilities 1,745 3,502 3,502
Total Liabilities 13,874 15,861 21,216
Shareholders' Equity
Common Stock 7,177 7,177 7,177
Additional Paid-In Capital --- 1,185 2,215
Treasury Stock --- --- ---
Retained Earnings 15,129 23,364 36,213
Accumulated Other Comprehensive Income (9) 179 179
Total Shareholders' Equity 22,297 31,905 45,783
Total Liabilities & SE 36,171 47,766 66,999
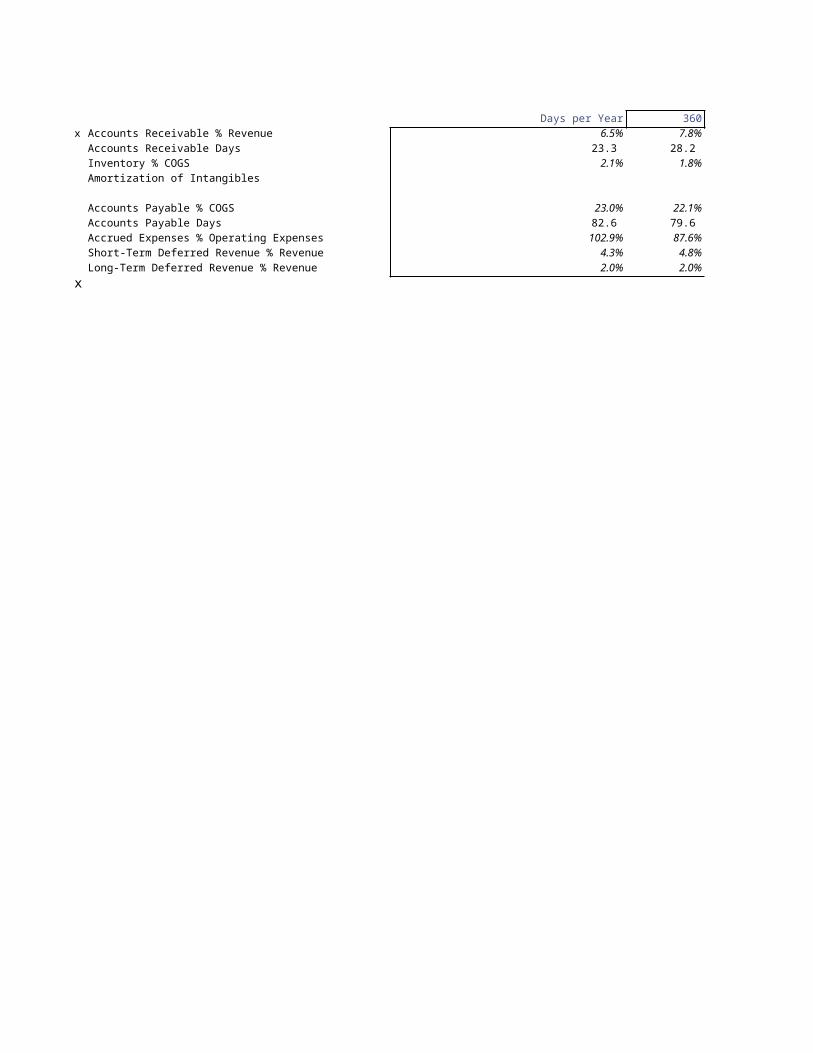
Days per Year 360
x Accounts Receivable % Revenue 6.5% 7.8% 7.8%
Accounts Receivable Days 23.3 28.2 28.2
Inventory % COGS 2.1% 1.8% 1.8%
Amortization of Intangibles
Accounts Payable % COGS 23.0% 22.1% 22.1%
Accounts Payable Days 82.6 79.6 79.6
Accrued Expenses % Operating Expenses 102.9% 87.6% 87.6%
Short-Term Deferred Revenue % Revenue 4.3% 4.8% 4.8%
Long-Term Deferred Revenue % Revenue 2.0% 2.0% 2.0%
x
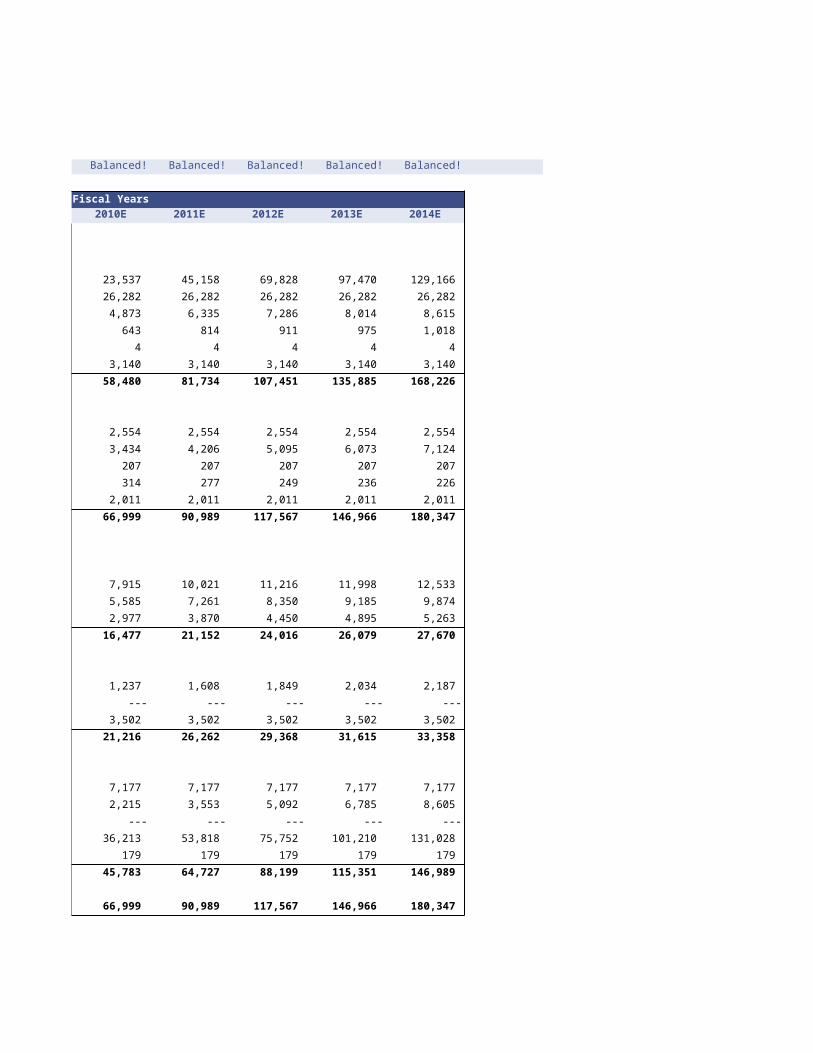
Balanced! Balanced! Balanced! Balanced!
Fiscal Years
2011E 2012E 2013E 2014E
45,158 69,828 97,470 129,166
26,282 26,282 26,282 26,282
6,335 7,286 8,014 8,615
814 911 975 1,018
4 4 4 4
3,140 3,140 3,140 3,140
81,734 107,451 135,885 168,226
2,554 2,554 2,554 2,554
4,206 5,095 6,073 7,124
207 207 207 207
277 249 236 226
2,011 2,011 2,011 2,011
90,989 117,567 146,966 180,347
10,021 11,216 11,998 12,533
7,261 8,350 9,185 9,874
3,870 4,450 4,895 5,263
21,152 24,016 26,079 27,670
1,608 1,849 2,034 2,187
--- --- --- ---
3,502 3,502 3,502 3,502
26,262 29,368 31,615 33,358
7,177 7,177 7,177 7,177
3,553 5,092 6,785 8,605
--- --- --- ---
53,818 75,752 101,210 131,028
179 179 179 179
64,727 88,199 115,351 146,989
90,989 117,567 146,966 180,347
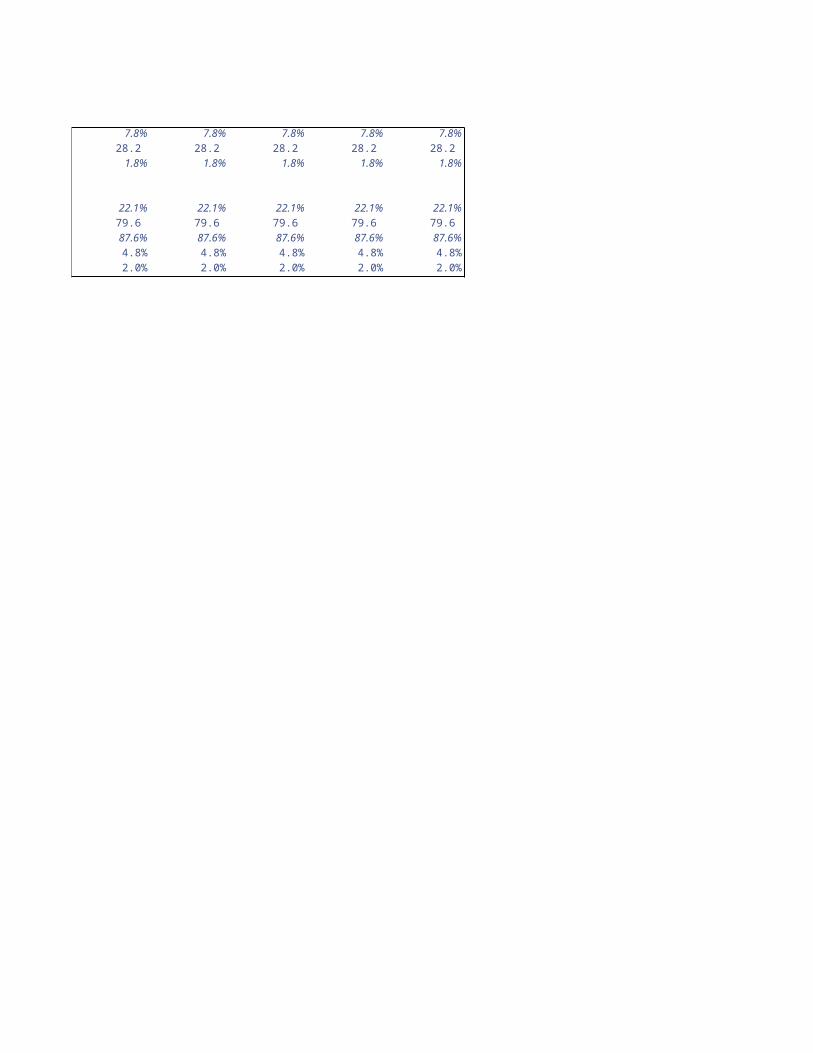
7.8% 7.8% 7.8% 7.8%
28.2 28.2 28.2 28.2
1.8% 1.8% 1.8% 1.8%
22.1% 22.1% 22.1% 22.1%
79.6 79.6 79.6 79.6
87.6% 87.6% 87.6% 87.6%
4.8% 4.8% 4.8% 4.8%
2.0% 2.0% 2.0% 2.0%
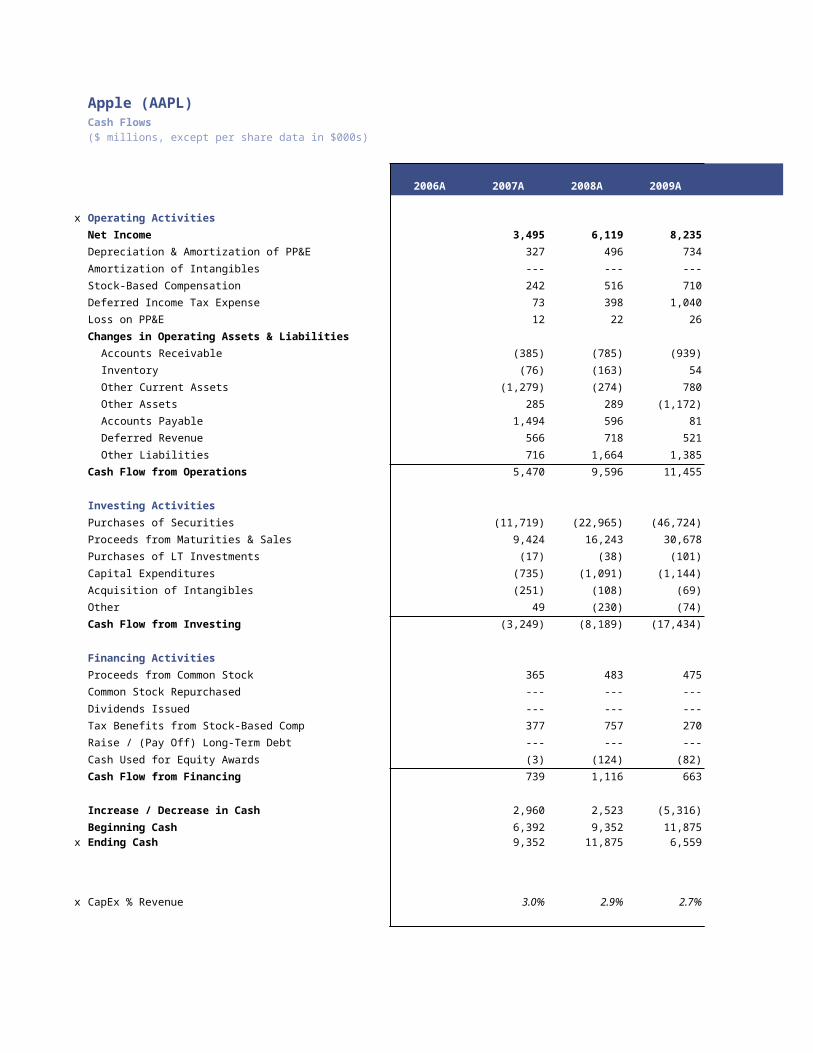
Apple (AAPL)Cash Flows
($ millions, except per share data in $000s)
Fiscal Years
2006A 2007A 2008A 2009A 2010E
x Operating Activities
Net Income 3,495 6,119 8,235 12,849
Depreciation & Amortization of PP&E 327 496 734 1,064
Amortization of Intangibles --- --- --- 40
Stock-Based Compensation 242 516 710 1,030
Deferred Income Tax Expense 73 398 1,040 ---
Loss on PP&E 12 22 26 ---
Changes in Operating Assets & Liabilities
Accounts Receivable (385) (785) (939) (1,512)
Inventory (76) (163) 54 (188)
Other Current Assets (1,279) (274) 780 ---
Other Assets 285 289 (1,172) ---
Accounts Payable 1,494 596 81 2,314
Deferred Revenue 566 718 521 1,308
Other Liabilities 716 1,664 1,385 1,733
Cash Flow from Operations 5,470 9,596 11,455 18,637
Investing Activities
Purchases of Securities (11,719) (22,965) (46,724) ---
Proceeds from Maturities & Sales 9,424 16,243 30,678 ---
Purchases of LT Investments (17) (38) (101) ---
Capital Expenditures (735) (1,091) (1,144) (1,659)
Acquisition of Intangibles (251) (108) (69) ---
Other 49 (230) (74) ---
Cash Flow from Investing (3,249) (8,189) (17,434) (1,659)
Financing Activities
Proceeds from Common Stock 365 483 475 ---
Common Stock Repurchased --- --- --- ---
Dividends Issued --- --- --- ---
Tax Benefits from Stock-Based Comp 377 757 270 ---
Raise / (Pay Off) Long-Term Debt --- --- --- ---
Cash Used for Equity Awards (3) (124) (82) ---
Cash Flow from Financing 739 1,116 663 ---
Increase / Decrease in Cash 2,960 2,523 (5,316) 16,978
Beginning Cash 6,392 9,352 11,875 6,559
x Ending Cash 9,352 11,875 6,559 23,537
x CapEx % Revenue 3.0% 2.9% 2.7% 2.7%
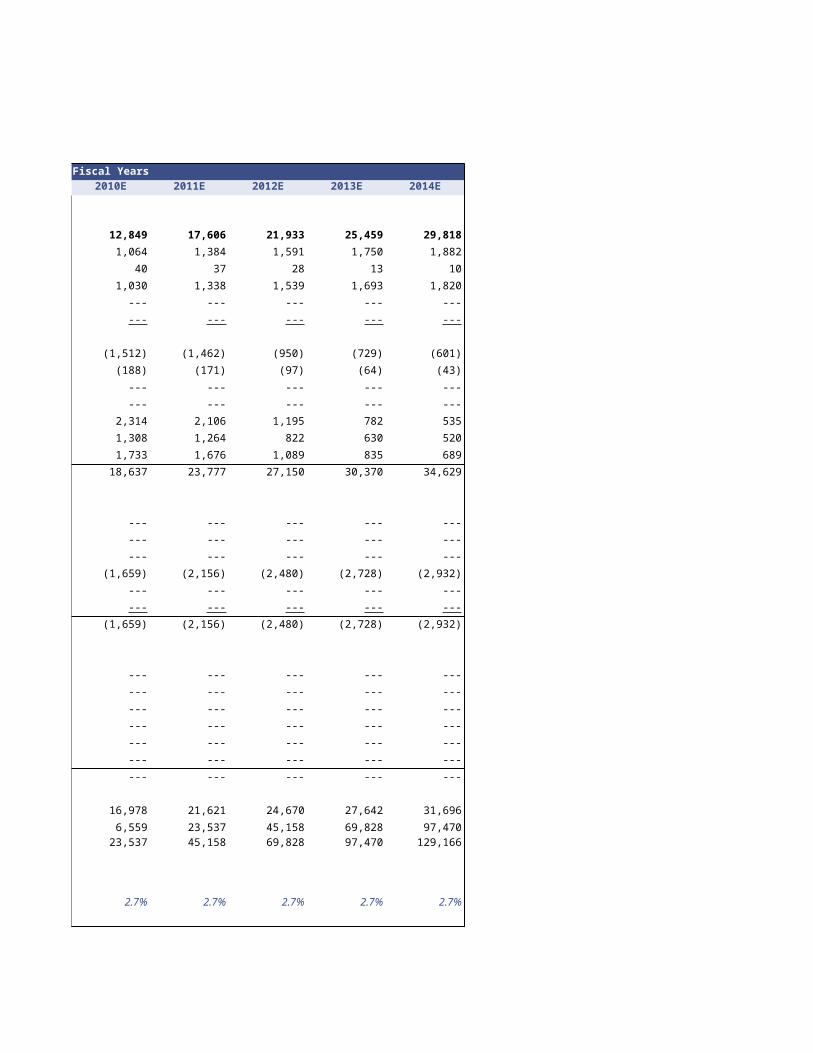
Fiscal Years
2011E 2012E 2013E 2014E
17,606 21,933 25,459 29,818
1,384 1,591 1,750 1,882
37 28 13 10
1,338 1,539 1,693 1,820
--- --- --- ---
--- --- --- ---
(1,462) (950) (729) (601)
(171) (97) (64) (43)
--- --- --- ---
--- --- --- ---
2,106 1,195 782 535
1,264 822 630 520
1,676 1,089 835 689
23,777 27,150 30,370 34,629
--- --- --- ---
--- --- --- ---
--- --- --- ---
(2,156) (2,480) (2,728) (2,932)
--- --- --- ---
--- --- --- ---
(2,156) (2,480) (2,728) (2,932)
--- --- --- ---
--- --- --- ---
--- --- --- ---
--- --- --- ---
--- --- --- ---
--- --- --- ---
--- --- --- ---
21,621 24,670 27,642 31,696
23,537 45,158 69,828 97,470
45,158 69,828 97,470 129,166
2.7% 2.7% 2.7% 2.7%
Apple (AAPL)Disclosures
The author of www.stayingsharpe.com ("the site") is not a registered investment advisor.
The material in this model should not be viewed as an offer to sell or buy securities. Investments in the securities mentioned in this model may lose value. The author of the site is not liable for any losses or entitled to any gains incurred on securities discussed in this model.
The author of this site does not receive compensation for any of the research in this model.
The author is not an investor in any of the securities named in this model.