Embed Size (px)
Citation preview

American Economic Journal: Applied Economics 2018, 10(4): 196–221 https://doi.org/10.1257/app.20170042
196
Mentors or Teachers? Microenterprise Training in Kenya†
By Wyatt Brooks, Kevin Donovan, and Terence R. Johnson*
We use a randomized controlled trial to demonstrate that inexperienced female microenterprise owners in a Kenyan slum benefit from mentorship by an experienced entrepreneur in the same community. Mentorship increases profits by 20 percent on average with initially large effects that fade as matches dissolve. We conduct a formal business education intervention, which has no effect on profits despite changes in business practice. Our results demonstrate that missing information is a salient barrier to profitability, but the type of information matters: access to the localized, specific knowledge of mentors increases profit while abstract, general information from the class does not. (JEL D83, J16, L25, L26, O14, O15)
In urban areas of developing countries, microenterprises are ubiquitous, and a large fraction of the workforce is engaged in entrepreneurship.1 Many of these very
small firms generate low profit and have few or no employees. Understanding the reason that these firms have low profits and why they generate so little employment is key for designing policy to improve the welfare of the urban poor. One possibility is that microenterprise owners lack what Bloom and Van Reenen (2007) and Bruhn, Karlan, and Schoar (2010) refer to as managerial capital. That is, they lack the skill or know-how to run a business, which limits their profitability and operational scale.
If this lack of information or managerial capital is a serious impediment to growth, business training classes offer an appealing solution: a well-designed business training curriculum may increase business profit and may be scalable and easily
1 According to Gollin (2008), developing countries have substantially higher rates of entrepreneurship than rich countries. The proportion of workers that identify as entrepreneurs is 75.3 percent in Nigeria, 74.5 in Bangladesh, and 50.4 in Guatemala. This compares to 8.2 percent in the United States and 10.6 percent in the United Kingdom.
* Brooks: University of Notre Dame, 3060 Jenkins Nanovic Halls, Notre Dame, IN 46556 (email: [email protected]); Donovan: Yale School of Management, 165 Whitney Avenue, New Haven, CT 06511 (email: [email protected]); Johnson: University of Notre Dame, 3060 Jenkins Nanovic Halls, Notre Dame, IN 46556 (email: [email protected]). Thanks to conference and seminar participants at Arizona State, Notre Dame, the World Bank, York University, the Chicago Fed Development Workshop, Development Day (Michigan), the Econometric Society NASM (Penn), IGC Growth Week at LSE, the NBER Summer Institute (Productivity, Entrepreneurship, and Development), NEUDC (MIT), the World Bank ABCDE for comments and insights, especially Nick Bloom, Paco Buera, Bill Evans, Xavi Giné, Joe Kaboski, Molly Lipscomb, David McKenzie, Ezra Oberfield, and Chris Woodruff. This paper also benefitted substantially from discussions by Paulo Bastos, Jing Cai, and Dan Keniston, along with comments and suggestions from two anonymous referees. We thank the Ford Family Program and the Helen Kellogg Institute for International Studies for financial support, including Bob Dowd and Dennis Haraszko for their help coordinating the project, and Lawrence Itela, Jackline Aridi, and Maurice Sikenyi for their excellent work managing the project in Dandora. Brian Mukhaya provided outstanding research assistance. This research was conducted under University of Notre Dame IRB protocol 14-05-1801.
† Go to https://doi.org/10.1257/app.20170042 to visit the article page for additional materials and author disclosure statement(s) or to comment in the online discussion forum.

VOL. 10 NO. 4 197BROOKS ET AL.: MENTORS OR TEACHERS?
portable across environments. However, as summarized by McKenzie and Woodruff (2014) and Blattman and Ralston (2015), where formal business classes have been offered to entrepreneurs, they have had limited impact. One possible interpretation of these results is that, in fact, a lack of information or business knowledge is not an explanation for the lack of profitability in these small firms.
In this paper, we provide evidence that a lack of information is a salient limitation for the operators of microenterprises even in an environment in which classes have no significant effect on profits. Our insight is that a distinction must be made between the abstract principles commonly taught in formal business classes (such as bookkeeping, marketing, managing costs, and selection of product lines) and market-specific, localized information (such as what location has the highest demand, what supplier sells at the lowest cost, or what products can be sold for the greatest profit). We show that the local expertise provided by a mentor can signifi-cantly benefit young entrepreneurs, even when formal classes fail to do so.
We use a randomized controlled trial to evaluate the effects of two different types of business training: formal business classes and mentorship from a successful entrepreneur in the same community. We randomly assign young and inexperienced microenterprise owners into three groups. The first group receives one-to-one matching with a mentor from the same community and that operates in the same industry, the second group receives formal business classes, and the third group receives neither. Mentors are drawn from the set of successful business owners within the same community.2 Rather than direct the content of mentor-mentee interactions, we allow the mentors to relay whatever information they believe will be beneficial to their mentees. The business classes are conducted by instructors from a local university and cover general business topics such as accounting, marketing, cost control, and business planning.
We find that mentorship is effective at increasing profit among young microenterprises. Over the 17 months following treatment, weekly profits are on average 20 percent higher among the mentor treatment than the control, but the effect fades over time as mentor-mentee matches dissolve. We find changes in business practice from mentorship that are consistent with our interpretation that mentees are gaining local, market-specific information from their mentors. Mentees are more likely to have switched suppliers in the aftermath of the treatment, which generates greater profitability per unit sold. We find that this increase in profitability is driven by lower costs rather than greater revenue or a more profitable product mix. We find little evidence of changes in firm quality (customer relations, marketing, produc-tion quality, etc.) for the mentor treatment.3 We further exploit a discontinuity in our mentor selection procedure and find no statistically significant effects on profit, suggesting that the effect on mentees is not coming at the expense of mentor profit.
These benefits from mentorship are obtained even though we find muted results from formal business training. Our results relating to formal business
2 Our mentor selection procedure is based on age and experience thresholds, as well as a profit cutoff. This procedure is detailed in Section IIIA.
3 Interventions that do find these changes either concurrently increase demand (Atkin, Khandelwal, and Osman 2017; Hardy and McCasland 2016) or focus on larger firms (Bloom et al. 2013).

198 AMERICAN ECONOMIC JOURNAL: APPLIED ECONOMICS OCTOBER 2018
classes are consistent with the large and growing literature studying their effects. Formal business training generates no statistically significant change in profit relative to the control, which is in line with studies summarized in McKenzie and Woodruff (2014) and Blattman and Ralston (2015). However, we do find short-run changes in business practices.4 The lack of profit increase coupled with a short-run change in business practices is consistent with previous work on microenter-prise training, including Bruhn and Zia (2013) and Giné and Mansuri (2018). These results demonstrate that the mentorship treatment impact is not simply driven by an initial absolute lack of knowledge relative to contexts previously studied, but that mentorship is effective even in circumstances where classroom study has the same effects as found previously.5
We finally turn to understanding the dynamics of the treatment effect. The vanishing effect seems at odds with a basic human capital accumulation story in which mentors augment or accelerate the process by which mentees acquire managerial capital, following Becker (1964). Instead, it appears that mentors provide a flow benefit to mentees in the short run, which does not lead to per-manent changes in firm productivity. These stylized facts more closely resemble the model of Garicano and Rossi-Hansberg (2006), where agents vary in their knowledge of how to solve specific problems. The set of problems that arise in the operation of the entrepreneur’s business is constantly evolving, such as the loss of suppliers, the need to change locations, or changing demand for products. In Garicano and Rossi-Hansberg (2006), lower level workers within an organization can seek help from their managers when they lack the knowledge to solve their problem. In a microenterprise, no such manager exists, but when the entrepreneur has access to a mentor, she is able to draw on her mentor’s knowledge. Hence, men-torship improves profits by helping to solve the constantly evolving set of problems that entrepreneurs face, which is a flow information benefit. When the mentorship relationship dissolves, the entrepreneur is no better off than she was before she had a mentor.
To provide evidence for this interpretation, we utilize data on the topics discussed in mentee-mentor meetings. We show that the issues faced by small businesses vary substantially and there is little autocorrelation in problems faced over time. When we ask business owners to define the three largest difficulties facing their business, 93 percent of the control group provides a different list just seven months after initially responding at baseline, while 79 percent add at least one new major constraint. The average control owner no longer mentions 59 percent of the problems mentioned at baseline seven months earlier. Consistent with these results, we find no relationship between critical issues facing mentee businesses at baseline and the topics discussed with mentors. Moreover, the likelihood of a mentor-mentee pair talking about the same topics two waves in a row is only 10 percent. These results provide evidence that the problems microenterprises face change constantly.
4 We interpret this as evidence against the possibility that these classes were of categorically lower quality than classes studied in the previous literature on formal business training.
5 It is worth emphasizing that our goal is not to make the mentorship and class treatments as similar as possible. Instead, we want to show that interacting with a successful business has a positive effect and that a standard training intervention generates similar results to the literature within the same population.

VOL. 10 NO. 4 199BROOKS ET AL.: MENTORS OR TEACHERS?
While the topics discussed with mentors have an immediate effect of limiting the impact of current shocks faced by the business, they provide less help with future and as of yet un-encountered problems.
We further exploit variation in outcomes between mentees who continue to meet with mentors and those who do not.6 Despite nearly identical average profits at baseline, those who continue to meet with their mentors twelve months after the official end of the treatment period are on average 55 percent more profitable than those who are no longer meeting. This result could be explained by survivorship bias if matches with future benefits are the only ones that continue. We provide evidence that works against this explanation by showing that continued meeting cannot be predicted by previous changes in profit. Nearly 70 percent of matches were ended by the mentor as opposed to the mentee, which limits the effect of mentee selection. Our interpretation is that mentees benefit from mentorship, and matches typically end only when mentors lose interest. This again suggests that our positive treatment effects are driven by the flow of information from mentor to mentee, but that the benefit of the information is short-lived.
Related Literature.—The literature on increasing managerial capital in microen-terprises and small firms has overwhelmingly focused on in-class training. McKenzie and Woodruff (2014) provide an excellent and comprehensive review of previous studies. The overriding theme of this research is that business practices do change but translate into little impact on revenue and profit (for example, Bruhn and Zia 2013 and Giné and Mansuri 2018), despite billions of dollars spent by governments and international organizations. Our in-class training intervention is consistent with these results. The mentorship intervention, however, overcomes two issues in this literature. First, in-class training requires diagnosing what skills the entrepreneurs are missing and then designing a curriculum to effectively address those deficien-cies. This has proved difficult in part because of the large number of different con-straints facing microenterprises (Bruhn, Karlan, and Schoar 2018; Karlan, Knight, and Udry 2015). Our intervention allows each mentor-mentee pair to diagnose and discuss information or skills they believe to be most useful. Second, diagnosing the key constraints or problems facing businesses is expensive. Classroom train-ing usually can cost over US$100 per student (Blattman and Ralston 2015), while more personalized consultants can cost as much as US$11,000, as in the case of Bruhn, Karlan, and Schoar (2018). Our mentors were paid US$9.83 for one month of meetings; yet despite this, 45 percent were still meeting 17 months after the offi-cial treatment period when they were being paid nothing. Our training class cost approximately US$40 per student.
Our solution to these issues—leveraging the skill of other individuals facing the same local economic conditions— is closely related to work on the transmission of knowledge through networks. Foster and Rosenzweig (1995), Munshi (2004), Bandiera and Rasul (2006), and Conley and Udry (2010) all document social learning in various contexts, while BenYishay and Mobarak (2018) and Beaman et al. (2015)
6 Meeting of mentors and mentees after the treatment period was not incentivized. We discuss the persistence of mentor-mentee relationships in Section IVC.
200 AMERICAN ECONOMIC JOURNAL: APPLIED ECONOMICS OCTOBER 2018
experimentally vary the entry point of information and track its impact through existing networks. While these papers all show the importance of existing networks for information and technology flow, much less is known about the impact of (poten-tially) learning from an exogenously selected partner. More closely related to our exercise are Atkin, Khandelwal, and Osman (2017), who study this in the context of supplier-customer relationships by randomly allocating new foreign rug orders to small Egyptian rug makers, and Cai and Szeidl (2018), who study the creation of randomly formed business groups in China. Interestingly, despite the fact that they focus on much larger firms, we find many of the same channels. However, they find more persistent effects, highlighting potentially important differences among firms of different scale.
Last, our results highlight a particular micro-foundation for distortions to managerial capital accumulation, albeit in a relatively specialized setting. Bhattacharya, Guner, and Ventura (2013) and Da-Rocha, Mendes Tavares, and Restuccia (2017) show that frictions limiting managerial capital accumulation can have an important aggregate effect in the context of policy distortion models developed in Restuccia and Rogerson (2008) and Hsieh and Klenow (2009). Our results suggest a link between these distortion models and recent work by Lucas (2009), Lucas and Moll (2014), and Perla and Tonetti (2014) in which growth is generated through spillovers from other firms.
I. Microenterprise Characteristics in Dandora, Kenya
Dandora is a dense, urban slum to the northeast of Nairobi. It is approximately four square kilometers and, as of the 2009 census, contained 151,046 residents. To assess the business characteristics in the area, we conducted a street-level survey of 3,290 randomly selected business.7 Table 1 provides summary statistics for business. Column 2 also includes the same information for “young” firms with owners under 40 years old and less than five years of experience, as we eventually draw our sam-ple from this group. These businesses make up 43 percent of all businesses sur-veyed. The rest of the businesses—those with owners older than 40 or more than 5 years of experience—we classify as “experienced.”
The average business in our survey has a profit of 15,084 Kenyan shillings (Ksh), or US$145, in the previous month. However, while the average young owner earns 13,431 Ksh, the average experienced owner earns 21 percent more profit per month or 16,316 Ksh. Figure 1 plots the distribution of the natural logarithm of profit for young and experienced enterprises.
This result is driven by selection. However, despite the substantial difference in profit, there is not much difference in observable formal business practices. They are equally likely to offer credit to customers, have a bank account, have taken a loan
7 Our sampling procedure was intended to reduce convenience sampling and worked as follows. We generated 200 points randomly throughout Dandora and then gave each enumerator a list of randomly selected numbers. Starting from a randomly selected point, they were instructed to count businesses until they reached a number on their list and survey the business owner of that establishment.

VOL. 10 NO. 4 201BROOKS ET AL.: MENTORS OR TEACHERS?
at some point in the past, or engage in formal accounting or advertising. Moreover, they are roughly equally educated.
We focus on female microenterprise owners, as they make up 71 percent of inexperienced owners. As Figure 2, panel A shows, they are less profitable than their male counterparts at every business experience level. Interestingly, this percentage difference in profits is roughly constant over the first 15 years of the firms’ operating lives (Figure 2, panel B).
Table 1—Baseline Characteristics
Overall (3,290) Young firms (1,405) (1) (2)
Panel A. Firm scale Profit (last month) 15,084 13,431Firm age 5.6 2.1Has employees? 0.21 0.18Number of employees (if n > 0) 1.8 1.5
Panel B. Business practices Offer credit 0.67 0.69 Have bank account 0.36 0.30Taken loan 0.21 0.15Practice accounting 0.11 0.12Advertise 0.10 0.09
Panel C. OwnerAge 34.0 28.9Female 0.65 0.71Secondary education 0.58 0.58
Notes: Trimmed profit drops the top and bottom 1 percent of answers. Here, 3,171 establish-ments answered about profit.
Figure 1. log Profit Distribution for Young and Experienced Enterprises
0
0.1
0.2
0.3
0.4
0.5
Den
sity
4 6 8 10 12 14log monthly pro�t (Ksh)
Experienced
Young

202 AMERICAN ECONOMIC JOURNAL: APPLIED ECONOMICS OCTOBER 2018
II. Experimental Design
We use the baseline survey discussed in Section I to construct our experimental sample. We restricted our sample to business owners who are under 40 years old and have been running a business for less than 5 years. This includes 1,094 business own-ers, 787 of whom were operated by females.8 Out of these 787 female entrepreneurs,
8 To the best of our knowledge, all of these factors have been used to select population in other studies of class-room training, except for age (and experience, which is naturally correlated). McKenzie and Woodruff (2014) pro-vide a detailed breakdown of the selection procedures used in other microenterprise training papers. Of the RCTs surveyed in that paper, the average age is 38 years old, while ours is 29. This is roughly the tenth percentile of papers they survey, so indeed, our average age is toward the low end. However, given that we find very similar results to the majority of the class training literature, it is difficult to imagine that our results are driven by age selection.
Figure 2. Gender Differences over the Life Cycle
10,000
20,000
30,000M
onth
ly p
ro�t
(Ksh
)
0−1 1−5 5−10 10−15 15−20 >20
Business experience (years)
Panel A. Average life-cycle pro�t
MaleFemale
1
1.25
1.5
1.75
2
2.25
Mon
thly
pro
�t (n
orm
aliz
ed)
0−1 1−5 5−10 10−15 15−20 >20
Business experience (years)
Panel B. Average life-cycle pro�t growth
MaleFemale
VOL. 10 NO. 4 203BROOKS ET AL.: MENTORS OR TEACHERS?
we contacted 723 to participate in the study after dropping some with a high fraction of missing baseline data or extreme outliers in the baseline. Of these, 538 (68 per-cent) accepted our invitation to participate in the program without knowing which treatment group would be assigned to them. The time commitment was emphasized to participants, including attendance at an in-person orientation, multiple meet-ings where they would receive business advice, and the follow-up surveys over the telephone. Of the 538 individuals, 372 attended orientation (69 percent of 538, or 51 percent of the original 723). Randomization took place among these 538 indi-viduals, and no one was given any indication of their assigned group until arrival at orientation. All groups received a cash payment of 4,800 Ksh (US$48) to encourage participation, which is equal to approximately two weeks of average profit. The classroom treatment also received one month of business classes. The mentor group received the cash payment and assignment to a mentor drawn from local, successful business owners. Of the original 372 individuals at orientation, 369 business owners answered at least one posttreatment survey.9
The business classes were conducted by faculty from Strathmore University, a leading university in Kenya that is located in Nairobi. The classes have been used as part of a small- and medium-size business training program by the Strathmore University School of Management and Commerce. The instructors are all experienced in teaching this course, which they believe to be the best curriculum available to teach microenterprise owners. The treatment consisted of four two-hour classes that covered marketing, accounting, cost control, and business planning. These topics are similar to programs used in other studies.10 Classes were offered six times over the course of the week at a local hall in Dandora to accommodate individual schedules.
Individuals assigned to the mentor treatment were matched with a mentor drawn from a set of successful, local female business owners (mentor selection is detailed in the next subsection). Once the pool of mentors was chosen, mentees were matched based on narrowly defined business sectors. For example, we match perishable food sellers with perishable food sellers, tailors with other tailors, and so on. Conditional on matching business sectors, mentors were randomly assigned. Mentees were required to meet with the mentor each week at the mentor’s business, which was designed to minimize the cost to the mentors. The meetings, however, were relatively unstructured. We put no constraint on minimum meeting time nor the topics that must be discussed. To facilitate discussion, participants were given optional prompts, including “what were some of the challenges the mentee faced this week?” and “what was a time the mentor faced a similar challenge, and how did she respond to it?”
The treatment was completed at the end of November 2014. To understand the dynamics of the response across different treatment arms, we conducted six fol-low-up surveys in the middle of December 2014 (preceding the Christmas holiday) and then in the last week of January, February, March, June, and November of 2015
9 Online Appendix D provides a detailed breakdown of the business types included in this sample and a comparison to the overall composition of the baseline businesses surveyed.
10 We find similar results to previous formal training research using other training programs, suggesting that there is nothing specifically different about our class design that generates our results.
204 AMERICAN ECONOMIC JOURNAL: APPLIED ECONOMICS OCTOBER 2018
and a much shorter follow-up in April 2016. The last two surveys contained a lon-ger set of follow-ups with more detailed business practice questions. Throughout the rest of the paper, these surveys will be numbered by the months since treat-ment, so that the surveys will be numbered by the months since baseline as t ∈ {1, 2, 3, 4, 7, 12, 17} .
A. Mentor Selection
The pool of mentors was selected from our baseline survey. We first constrained our sample to female business owners who were over 40 years old and had been oper-ating the same business for at least 5 years. This left 366 individuals. We then sorted based on profit after controlling for sector-specific differences and recruited mentors until we had enough to link each mentee to a mentor in the same tightly defined busi-ness sector. Mentors were offered 1,000 shillings (US$9.83) to participate, which is equivalent to approximately two days of profit for the average firm in this group. We also told both mentors and mentees that meetings would take place at the mentor’s business to minimize inconvenience to the mentor and maintain some similarity with the travel requirement of the class treatment. These incentives were sufficient to gen-erate high take-up, as 95 percent accepted our invitation to take part in the program.11
B. Sample Size and Balance across Survey Waves
Of the 372 individuals who attended orientation, 369 (99 percent) answered at least one follow-up. Table 2 provides the baseline balance test.
The response rates by wave were 352 (95 percent of 372), 318 (85 percent), 319 (86 percent), 323 (87 percent), and 325 (87 percent). In total, 4 individuals completed exactly 1 follow-up, 6 completed 2, 21 completed 3, 41 completed 4, and 108 completed 5, and 194 completed all 6. In online Appendix A, we provide survey round-specific balance tests. There is no evidence that attrition generates any observable differences across the groups. We further provide the correlation coefficients of baseline observables with the number of surveys answered in online Appendix A. A few observables are correlated with answering surveys. However, the differences are small, and we find little difference in estimation results with or without controlling for baseline factors.12
C. Take-up of Treatments
Attendance at the business class was recorded, and the average person in the classroom treatment attended 3.1 out of four classes. One person attended no classes,
11 See online Appendix C for more details. Note that this procedure is used to construct the regression discontinuity control group as well, so they were also offered the same cash incentives to facilitate comparibility.
12 To give some examples, manufacturing business owners answer 6.8 surveys on average, compared to 6.0 for the rest. Restaurants answer 5.7 surveys, compared to 6.1 surveys for non-restaurants. The other two observables correlated with answering are firm age and owner age, which are naturally highly correlated. A business owner in the bottom 25 percent of the age distribution answers 6.1 surveys on average, compared to 6.3 in the top 25 percent of the age distribution.

VOL. 10 NO. 4 205BROOKS ET AL.: MENTORS OR TEACHERS?
11 percent attended one of four classes, 17 percent attended two, 32 percent attended three, and 40 percent attended all four. This is broadly in line with attendance in other studies (McKenzie and Woodruff 2014). The mentorship treatment was used by all individuals at least once during the intended treatment period. In the last week of the official treatment, 85 percent had met with their mentor within the past week.
III. Empirical Results: Profitability
We begin by considering the impact of our treatments on business profitability and scale in Section IIIA. We find that mentorship increased average profit relative to control, while in-class training had no statistically significant effect. In Section IIIB we use a regression discontinuity design to show that there is no statistically significant change in profit for mentors. Taken together, we interpret this to mean
Table 2 — Balancing Test at Baseline
Control mean Class— control Mentor— control
(1) (2) (3)Panel A. Firm scale Profit (last month) 10,054 −360.95 −975.25
(1,175.44) (1,186.76)Firm age 2.39 0.19 −0.05
(0.23) (0.23)Has employees? 0.21 −0.06 −0.02
(0.05) (0.05)Number of employees 0.21 −0.05 0.02
(0.06) (0.06)
Panel B. Business practicesOffer credit 0.74 0.00 −0.02
(0.06) (0.06)Have bank account 0.30 −0.03 −0.03
(0.06) (0.06)Taken loan 0.14 −0.03 −0.05
(0.04) (0.04)Practice accounting 0.11 −0.07 0.00
(0.04) (0.04)Advertise 0.07 −0.02 0.04
(0.03) (0.03)
Panel C. Sector Manufacturing 0.04 0.00 −0.03
(0.02) (0.02)Retail 0.69 −0.12 0.03
(0.06) (0.06)Restaurant 0.14 0.06 −0.02
(0.05) (0.05)Other services 0.17 0.06 0.06
(0.05) (0.05)
Panel D. Owner characteristicsAge 29.1 0.87 −0.25
(0.65) (0.64)Secondary education 0.51 −0.04 −0.00
(0.06) (0.06)Observations 119 129 124
Notes: Columns 1–3 are the coefficient estimates from the regression y i = α + γ C i + β M i + ε i , where C i and M i are indicators for the class and mentorship treatments. Column 1 is ̂ α .

206 AMERICAN ECONOMIC JOURNAL: APPLIED ECONOMICS OCTOBER 2018
that entrepreneurs face a constantly evolving set of challenges in the operation of their business that their mentor helps them to solve. This is a flow benefit that mainly accrues to the firm in the short run, and the withdrawal of the mentor leads to its loss.
A. Treatment Impact
We begin by looking at weekly profit for each treatment group. Figure 3 plots the time series of average weekly profit by treatment arm.
The classroom treatment mimics the control group closely throughout the study peri-od.13 The mentor treatment, however, sees a substantial growth in profit relative to both the control and class that first appear in month four and lasts through month seven. This effect fades out by the 12 month follow-up as mentor-mentee matches dissolve, which is discussed in detail in later sections. To make statistical inferences about these effects, we employ a series of regressions. First, following McKenzie (2012), we pool the data and run the ANCOVA regression to measure the average treatment effect:
(1) y it = α + M i β + C i γ + y i0 δ + X i η + θ t + ϵ it .
Here, y it is the outcome for individual i at time t ∈ {1, 2, 3, 4, 7, 12, 17} months since the treatment, while y i0 is the baseline outcome value. Indicator M i = 1 if i is in the mentor group and C i = 1 if i is in the classroom treatment; X i is a vector of baseline controls, including secondary education, log age, and business sector fixed effects, and an indicator for whether the firm employs any workers, while θ t is a time fixed
13 There is an obvious decline in profit from December to January ( t = 1 to t = 2 ) across all groups. This is the seasonal effect of a slowdown in sales after December holidays, which we confirmed with numerous business owners in the study. Note, however, that the positive effect of mentorship is not driven by seasonality, as one can see from the lack of effect at t = 17 .
1,500
2,000
2,500
3,000
3,500
Ave
rage
pro
�t (K
sh)
−2 0 2 4 6 8 10 12 14 16 18
Months since treatment
Control
Class
Mentee
Figure 3. Profit Time Series
VOL. 10 NO. 4 207BROOKS ET AL.: MENTORS OR TEACHERS?
effect. All pooled regressions have standard errors clustered at the individual level. To understand the dynamics of the response, we supplement the pooled regression with wave-by-wave regressions:
(2) y it = α t + M i β t + C i γ t + y i0 δ t + X i η t + ε it for t ≥ 1 .
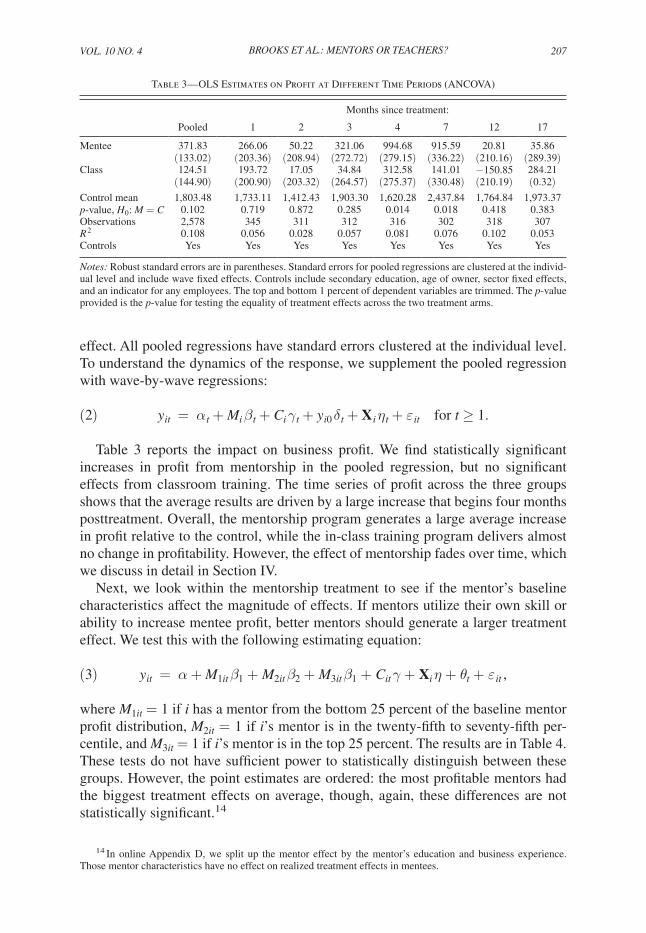
Table 3 reports the impact on business profit. We find statistically significant increases in profit from mentorship in the pooled regression, but no significant effects from classroom training. The time series of profit across the three groups shows that the average results are driven by a large increase that begins four months posttreatment. Overall, the mentorship program generates a large average increase in profit relative to the control, while the in-class training program delivers almost no change in profitability. However, the effect of mentorship fades over time, which we discuss in detail in Section IV.
Next, we look within the mentorship treatment to see if the mentor’s baseline characteristics affect the magnitude of effects. If mentors utilize their own skill or ability to increase mentee profit, better mentors should generate a larger treatment effect. We test this with the following estimating equation:
(3) y it = α + M 1it β 1 + M 2it β 2 + M 3it β 1 + C it γ + X i η + θ t + ε it ,
where M 1it = 1 if i has a mentor from the bottom 25 percent of the baseline mentor profit distribution, M 2it = 1 if i ’s mentor is in the twenty-fifth to seventy-fifth per-centile, and M 3it = 1 if i ’s mentor is in the top 25 percent. The results are in Table 4. These tests do not have sufficient power to statistically distinguish between these groups. However, the point estimates are ordered: the most profitable mentors had the biggest treatment effects on average, though, again, these differences are not statistically significant.14
14 In online Appendix D, we split up the mentor effect by the mentor’s education and business experience. Those mentor characteristics have no effect on realized treatment effects in mentees.
Table 3 — OLS Estimates on Profit at Different Time Periods (ANCOVA)
Months since treatment:
Pooled 1 2 3 4 7 12 17
Mentee 371.83 266.06 50.22 321.06 994.68 915.59 20.81 35.86(133.02) (203.36) (208.94) (272.72) (279.15) (336.22) (210.16) (289.39)
Class 124.51 193.72 17.05 34.84 312.58 141.01 −150.85 284.21(144.90) (200.90) (203.32) (264.57) (275.37) (330.48) (210.19) (0.32)
Control mean 1,803.48 1,733.11 1,412.43 1,903.30 1,620.28 2,437.84 1,764.84 1,973.37p-value, H 0 : M = C 0.102 0.719 0.872 0.285 0.014 0.018 0.418 0.383Observations 2,578 345 311 312 316 302 318 307 R 2 0.108 0.056 0.028 0.057 0.081 0.076 0.102 0.053Controls Yes Yes Yes Yes Yes Yes Yes Yes
Notes: Robust standard errors are in parentheses. Standard errors for pooled regressions are clustered at the individ-ual level and include wave fixed effects. Controls include secondary education, age of owner, sector fixed effects, and an indicator for any employees. The top and bottom 1 percent of dependent variables are trimmed. The p-value provided is the p-value for testing the equality of treatment effects across the two treatment arms.

208 AMERICAN ECONOMIC JOURNAL: APPLIED ECONOMICS OCTOBER 2018
B. Impact on Mentors
The mentorship treatment generates a significant increase in profit for mentees, and we next wish to determine if there is any impact on the mentor. One possibility is that the mentor is an experienced agent who can impart knowledge on a less experienced business without receiving any return benefit from the interaction. This assumption is made in a large body of recent theoretical and quantitative work (e.g., Jovanovic and Rob 1989, Lucas 2009, Lucas and Moll 2014, and Buera and Oberfield 2016). Alternatively, the mentor-mentee relationship may be better described as a collabo-ration or business group, where both sides gain from interacting with the other (e.g., Cai and Szeidl 2018). To distinguish between these two possibilities, we exploit our procedure for selecting mentors and employ a regression discontinuity design.
As discussed above, mentors were paid 1,000 Ksh for their participation. Therefore, when selecting mentors at the beginning of the program, we also contacted the 150 female business owners closest to the cutoff to participate as well. Ninety-five agreed to participate, and they were also paid 1,000 Ksh at the start of the program, so that we can compare the two groups without the effect of the cash transfer as a potential confounding factor. Four months after the treatment, we surveyed all mentors, along with these 95 other non-mentor business owners.15 We then assess the impact of being chosen as a mentor on profit. First, Figure 4 plots profit along with a fitted quadratic and its 95 percent confidence interval. Figure 4, panel A uses the entire sample, while Figure 4, panel B uses the Imbens and Kalyanaraman (2012) proce-dure to choose the optimal bandwidth. Both use 15 bins on either side of the cutoff.
15 Note that this happened to be a wave with large treatment effects for the mentees. A failure to find statistical effects on mentors in a wave where we also failed to find them in mentees would be harder to interpret.
Table 4 —Heterogeneous Mentor Effects from OLS Profit Regression
Months since treatment:
Pooled 1 2 3 4 7 12
Mentee: Low 356.037 235.92 −43.99 232.89 747.57 1,000.83 −18.91(186.90) (256.74) (259.35) (336.44) (360.20) (412.41) (265.46)
Mentee: Medium 461.92 429.69 93.80 596.22 1,151.34 629.19 −108.49(170.93) (270.31) (278.65) (372.14) (370.33) (461.45) (278.64)
Mentee: High 539.42 −88.66 285.35 −117.46 1,317.05 1,338.68 542.90(260.32) (406.72) (450.86) (372.14) (567.77) (666.64) (432.43)
Class 95.27 192.74 14.91 32.28 304.47 140.60 −152.32(142.49) (201.10) (203.85) (264.82) (275.82) (331.04) (211.56)
Control mean 1,803.48 1,733.11 1,412.43 1,903.30 1,620.28 2,437.84 1,764.84p-value, H 0 : M H = M L 0.541 0.457 0.490 0.557 0.355 0.634 0.225p-value, H 0 : M L = C 0.184 0.865 0.817 0.543 0.211 0.033 0.615Observations 1,902 345 315 312 316 302 318 R 2 0.090 0.059 0.003 0.095 0.085 0.079 0.108Controls Yes Yes Yes Yes Yes Yes Yes
Notes: Robust standard errors are in parentheses. Standard errors for pooled regressions are clustered at the individ-ual level and include wave fixed effects. Controls include secondary education, age of owner, sector fixed effects, and an indicator for any employees. The top and bottom 1 percent of dependent variables are trimmed. Low, medium, and high refer to mentees with mentors in the [0, 25), [25, 75), and [75, 100] percentiles of mentor profit. The first p-value is for test of equality of high mentor and low mentor effects, while the second is the p-value for the equality of means of low mentor and class.

VOL. 10 NO. 4 209BROOKS ET AL.: MENTORS OR TEACHERS?
Figure 4 suggests no statistically discernible discontinuity around the cutoff, which we next assess formally. In particular, letting ̄ ε be the cutoff value for mentors, we run the regression
(4) π i = α + τ D i + f ( N i ) + ν i ,
where π i is profit, D i = 1 if individual i was chosen as a mentor ( ̂ ε i ≥ ̄ ε ), f ( N i ) is a flexible function of the normalized running variable N i = ( ̂ ε i − ̄ ε )/ σ ε , and
Panel A. Full sample
−5,000
0
5,000
10,000
15,000
Pro
�t (K
sh)
−2 −1 0 1 2 3
Normalized running variable
n = 172, bins = 15
Panel B. IK optimal bandwidth
−5,000
0
5,000
10,000
15,000
Pro
�t (K
sh)
−1 −0.5 0 0.5 1
Normalized running variable
n = 103, bins = 15
Figure 4. Profit for Mentors and Non-mentors

210 AMERICAN ECONOMIC JOURNAL: APPLIED ECONOMICS OCTOBER 2018
ν i is the error term. The parameter τ captures the causal impact of being chosen as a mentor. We use local linear regressions to estimate the treatment effects on profit and inventory, along with business practices of record keeping and marketing. The results are in Table 5, and we find that being a mentor has no sta-tistically significant effect on profits. Moreover, there is no change in marketing or record-keeping practices. There is some evidence that inventory spending decreases, but it cannot be statistically distinguished from zero. Overall, we find little evidence that mentorship changes either business scale or business practices for the mentors. In online Appendix C, we use the MSE-optimal bandwidth procedure proposed in Calonico, Cattaneo, and Titiunik (2014), along with varying the order of the poly-nomial for f ( ⋅ ) . We find similar results.
IV. Understanding Treatment: Channels and Dynamics
Section III demonstrates two key results. First, mentorship generates a substantial increase in profit while the class does not. Second, the treatment effect has nontrivial dynamics. We find that the changes among the mentorship group primarily relate to market-specific information, not the more general business skills covered in the class. We first show that these results are driven by reductions in costs rather than increases in revenue. We then provide evidence on the mechanism underlying this reduction in cost by showing significant changes in supplier choice and inventory. We then examine the dynamics of the treatment effects by considering the dissolu-tion of matches over time.
A. Effects on Revenue and Costs
The increase in profit in the mentorship treatment could arise from increased revenue, decreased costs, or a combination of both. We first show that neither total revenue nor sale prices of output changed significantly, which suggests that increased profits must result from reduced costs. We verify this by showing that input costs declined significantly for firms in the mentorship treatment. The subsections that follow provide evidence on the mechanism by which costs fell by showing that mentees exhibited significantly different inventory and supplier behavior.
Table 5—Regression Discontinuity Results for Mentor Treatment Effect
Percent of IK optimal bandwidth
Scale Practices
Profit Inventory Marketing Record keeping
100
−503.18 −3,105.87 0.01 0.02(1,321.82) (2,698.11) (0.11) (0.18)
150
300.19 −2,585.22 0.01 0.07(1,407.26) (2,291.34) (0.09) (0.14)
200
322.09 −123.59 0.01 0.10(1,324.17) (1,964.08) (0.08) (0.13)
Treatment average 4,387.34 8,435.79 0.08 0.85Control average 1,794.09 4,039.20 0.13 0.63
Note: Profit and inventory are both trimmed at 1 percent.

VOL. 10 NO. 4 211BROOKS ET AL.: MENTORS OR TEACHERS?
Columns 1 and 2 of Table 6 show the treatment effects on revenue in the classroom and mentorship groups. Both with and without controls, neither group experiences a significant change in revenue.16 The fact that we find no evidence of a change in revenue mitigates the concern that treatment effects on mentees spilled over to the control group through competition. If mentorship caused mentees to increase sales and gain market share, that would negatively impact competing firms in the control group and bias our estimated treatment effects upward. Given that there is no evidence of such an effect, we are less concerned about this possibility.
Even though there is no evidence that revenue changed, it is possible that prices rose while quantities declined, perhaps due to increases in quality. To evaluate that possibility, we would like to know if firms raised the price of their output. However, this is difficult to measure in multiproduct firms, since there is no single output price to be measured. Instead, beginning in wave five, we ask firms to identify the product, which accounts for most of their sales and the output price of that product. We then ask if this is their most profitable product, and 92 percent confirm that it is. We then proceed by using the price of their most profitable product for the analysis. We can then see how the price of that product changed over time. This result is given in col-umns 3 and 4 of Table 6. Again, we see no significant effect in either group. Taken together with no evidence of a change in revenue, we interpret this to mean that the most important mechanisms for mentees did not operate through the demand side of the firm’s problem.17
If increased profits for mentees did not arise from increased revenue, it must have come from reduced costs. We verify this by looking at the supply costs paid by firms. The dependent variable in columns 5 and 6 of Table 6 is the supply cost paid for the firm’s most profitable product, defined as in columns 3 and 4. Now, we find that the supply cost in the mentee group falls significantly, while there is no
16 A direct question about total revenue was only posed in waves three through seven, and questions on the input and output prices of the firms’ most profitable products were only posed in waves five through seven, resulting in fewer available observations, as reported in Table 6.
17 As these results suggest, we find no evidence that mentorship relaxes firms’ credit constraints, which would arise if mentors helped mentees secure financing. As shown in the online Appendix, we also find no evidence that mentees made more large investments in their firms than did members of the control group. Only two loans were made from mentors to mentees, both for about US$50.
Table 6—Effects on Revenue, Output Prices, and Supply Costs
Revenue Output price Supply cost
(1) (2) (3) (4) (5) (6)Mentee −95.44 162.77 −3.47 −7.80 −341.73 −326.54
(428.95) (445.52) (70.83) (65.59) (109.88) (110.09)Class −154.88 193.30 9.78 2.29 −104.02 −86.83
(457.90) (440.64) (70.62) (71.26) (136.78) (144.01)Control mean 5,813.7 5,813.7 315.8 315.8 645.1 645.1p-value, H 0 : M = C 0.896 0.944 0.843 0.875 0.016 0.023Observations 1,400 1,398 867 867 821 821 R 2 0.013 0.066 0.001 0.030 0.024 0.035Controls No Yes No Yes No Yes
Note: Standard errors are clustered at the firm level.

212 AMERICAN ECONOMIC JOURNAL: APPLIED ECONOMICS OCTOBER 2018
significant change in the class group. This is consistent with what was suggested by the previous results: profits increased in the mentee group from reduced costs, not from increased revenue.
In the next subsections, we provide evidence on the mechanisms that generate this reduction in costs. We show evidence on supplier churning as a mechanism for reduced costs. We also show that mentors seem to be helpful in giving mentees guidance on how to solve the constantly evolving set of problems that arise in the course of running their businesses.
B. Supplier Churning
To understand why costs declined, we consider the effect of each treatment on product sourcing by studying the propensity of firms to switch to new suppliers. The treatment effects are presented in Table 7 where the outcome variable is an indicator for whether or not the firm switched suppliers between the first and seventh survey wave. First, we note that supplier churning is very high in this environment. In the control group, 62 percent of firms switched suppliers, which suggests that the ability to acquire information about suppliers is salient for these firms. Second, we find a strong effect on the likelihood of switching suppliers in response to the mentorship treatment. Mentees are 19 percentage points ( p = 0.00 ) more likely to switch suppliers than the control group. The class treatment, how-ever, generates both a statistically and economically insignificant effect of −0.00 ( p = 0.98 ). The results suggest that mentorship has the effect of connecting mentees with better suppliers, since we find a greater propensity to switch and lower supply costs for mentees.
All of these results confirm the importance of suppliers and cost as a critical margin changed by interacting with high-quality business owners. In online Appendix D, we include other measures of business scale (employment, wages, hours of operation, etc.) and show that these do not change. The last part of this paper therefore focuses on the dynamics of the treatment effects. We utilize the sep-aration of mentee-mentor pairs, along with the substantial changes in suppliers that occur among the control group, to show that the profit increase is driven by the flow of information, not by permanent changes in practices.
Table 7—Likelihood of Switching Suppliers
Switch suppliers?
Mentee 0.187(0.065)
Class −0.002(0.069)
Control mean 0.617p-value, H 0 : M = C 0.002Observations 304 R 2 0.070Controls Yes
Notes: Robust standard errors are in parentheses. Controls include secondary education, age of owner, sector fixed effects, and an indicator for any employees. The p-values given are for the t-tests comparing the equality of the different treatment effects.
VOL. 10 NO. 4 213BROOKS ET AL.: MENTORS OR TEACHERS?
C. Dynamics of Mentorship Treatment
We have shown that having a mentor increases profit and primarily works through realizing lower costs. However, as previously noted, the treatment effect from mentorship fades out over time. In this section, we use details of the discussion topics from mentee-mentor pairs to probe this result in more detail. We find that businesses face an ever-evolving set of problems, implying that information provided to solve today’s problem may not be the same information required to solve tomorrow’s prob-lem. Moreover, within the mentee group, we also show that the topics of discussion between mentor and mentee have little autocorrelation. Taken together, we interpret this to mean that entrepreneurs face a constantly evolving set of challenges in the operation of their business that their mentor helps them to solve. This result echoes recent work by Bruhn, Karlan, and Schoar (2018), who find substantial heterogeneity across Mexican businesses in the specific constraints limiting growth. In contrast, however, our results show that there is substantial heterogeneity in challenges facing the same business over time.
To further emphasize this result, we utilize the heterogenous length of time that mentees and mentors met. We find little persistence in profit benefits ( relative to control) once a match ends, but high profits for those that continue to meet. Of course, the choice to continue meeting or not is endogenous. However, we show that the results are not driven by low benefits to the mentee, which eliminates one critical form of selection.18 These results are consistent with our interpretation: mentees face a vast array of potential problems that are constantly evolving, which their mentor can help them solve when they are meeting. However, when they have stopped meeting, the mentee faces new problems that the mentor did not previously teach her how to solve, so that she is no better off now in solving the new problem than she would have been without having ever worked with her mentor.
Business Challenges and Mentor Advice.—We begin by using the control group to understand the underlying churn in business problems in Dandora. At both baseline and t = 7 , we asked business owners to identify (up to) the 3 most critical challenges facing their business, from a list of 11 possibilities. The results imply an incredible amount of turnover in critical problems in just seven months. Ninety-two percent of control business owners drop at least one problem from t = 0 to t = 7 while 79 per-cent introduce a new problem at t = 7 . The average control business owner drops 59 percent of baseline problems by t = 7 . Moreover, of those topics mentioned at t = 7 , 53 percent of them were not mentioned at baseline. These results suggest the underlying problems facing Dandoran business owners vary substantially, even over a short time horizon.
This has important implications for the mentee-mentor relationship. If topics covered during meetings are focused on the current issues facing the business, there is a high probability those issues will no longer be critical to profitability once meetings end. Figure 5, panel A plots the fraction of mentee businesses that
18 Nearly 70 percent of matches are ended by the mentor. There are no observables correlated with match dissolution, but we naturally cannot rule out dissolution based on unobservables.

214 AMERICAN ECONOMIC JOURNAL: APPLIED ECONOMICS OCTOBER 2018
discuss each of a variety of topics over the course of their relationship. The different color bars indicate businesses who mention the three most common key problems at baseline—lack of funds, the inability to find inventory or supplies, and customers that do not pay. We see that the topics discussed are remarkably consistent across baseline problems. One possibility is that mentors give advice that is simply orthogonal to contemporaneous business problems. This, however, is inconsistent with the fact that profit increases. Since business problems vary over time, mentors are discussing many different topics with mentees. Indeed, Figure 5, panel B shows that about half of those still meeting at t = 12 discuss at least half of the topics listed, while 20 percent discuss all ten topics.
Finally, Figure 5, panel C plots the persistence of topics across meetings. This figure shows the conditional probability of discussing each topic given that it was discussed at the previous meeting. Since the panel is unbalanced, we do this in two different ways. First, we measure persistence based on two consecutive observations of the same mentee, no matter how many months are between them, which is labeled “ consecutive observations.” Second, we restrict the sample to only those firms that we observe in consecutive waves, and those probabilities are labeled “ consecutive waves.” These results are again consistent with the low autocorrelation of challenges faced by the business. Attracting customers and keeping records are
Panel A. Topics discussed at any point
0 0.2 0.4 0.6 0.8 1
Fraction of businesses
Take out loansLocation
New investmentsHours
Product typesWhere to buy
Product pricingLower cost
Record keepingAttract customers
0
0.2
0.4
0.6
0.8
1
0 1 2 3 4 5 6 7 8 9 10
Number of topics discussed
Panel C. Persistence of discussion topics
0 0.2 0.4 0.6 0.8 1
Fraction of businesses
Take out loansHours
LocationNew investments
Product typesProduct pricing
Where to buyLower cost
Record keepingAttract customers
Consecutive observationsConsecutive waves
All mentees
Inventory/suppliesLack of funds
Customers do not pay
Panel B. CDF of number of topics (if meeting at t = 12)
Figure 5. Mentee-Mentor Discussion Topics

VOL. 10 NO. 4 215BROOKS ET AL.: MENTORS OR TEACHERS?
the most commonly discussed topics overall, but all other topics seem to represent the emerging challenges that the mentees are facing on an ongoing basis.
Taken together, these results suggest that Dandoran business owners face a large number of potential problems. Moreover, mentorship responds to the economic conditions by covering a large number of issues as they arise in mentee businesses. We next turn to the dissolution of mentee-mentor matches to assess how the underlying economic environment affects the dynamics of treatment effects found in Section III.
Evidence from Match Persistence.—If the critical challenges facing microenterprises are constantly varying, the information provided by the mentor may not be useful once new problems are faced in the absence of a mentor. One implication of this is that benefits to mentees should end quickly after matches end. Figure 6 plots the fraction of mentees still meeting with their mentor over the course of the study. All mentees met with their mentor in the official treatment month. This fraction declines over time with 45 percent still meeting after twelve months. No incentives were provided to continue the relationship beyond the treatment period.
Twelve months after the treatment, average profit for those still meeting with their mentor is 2,071 Ksh compared to 1,339 Ksh among those not meeting—a difference of 55 percent (and statistically significant at 0.05). This result holds despite the fact that the two groups on average have nearly identical baseline profit levels. Figure 7 shows the time series of average profit for those meeting and not meeting in each wave. Though we mostly lack power to find significant differences between those meeting and not, the point estimates are of similar magnitudes across the waves that exhibited the largest effects in our main results.
0
0.2
0.4
0.6
0.8
1
Fra
ctio
n st
ill m
eetin
g w
ith m
ento
r
0 2 4 6 8 10 12
Months since treatment
Figure 6. Fraction of Mentees Still Meeting with Mentor

216 AMERICAN ECONOMIC JOURNAL: APPLIED ECONOMICS OCTOBER 2018
Because we did not generate variation in the length of the mentor-mentee relationship with an experiment, we cannot apply a causal interpretation to these findings. We can rule out some of the most obvious confounding factors, such as a lack of interest from mentees, or time series correlation with profit realizations. Nearly 70 percent of mentees claimed that mentors ended the relationship, suggesting strategic exit from the relationship by the mentee is not the main issue. In online Appendix D, we provide additional evidence that continued meetings are not predicted by changes in profits.
However, we are unable to rule out that selection by mentors both drives match dissolution and is correlated with mentor profit. Future studies of mentorship should seek to introduce experimental variation in the duration of mentor-mentee pairings to see if these profit dynamics are caused by differences in the duration of matches.
V. Other Explanations and Discussion
A. Skills Taught in Class
We turn back to studying the business practices covered in the training classes. If the classes simply transferred no skill or knowledge, then it is certainly possible that standard training would have been beneficial had it been successful in chang-ing practices. We refute that argument here and show that our results are consistent with previous work on training classes. In particular, we see changes in underlying business practices covered in class, but they do not translate into increases in profits.
In every survey, we asked about accounting and advertising practices, and Table 8 provides the time series of estimates using regressions (1) and (2). Marketing practices do not change relative to the control for either treatment. Accounting practices do change across treatments, and in fact, we find a significantly larger impact among the class than the mentees. On average, 74 percent of the control does
1,500
2,000
2,500
3,000
3,500
Ave
rage
pro
�t (K
sh)
1 4 8 12
Months since treatment
Mentee (no meet)
Mentee (meet)
Figure 7. Average Profit for Mentees

VOL. 10 NO. 4 217BROOKS ET AL.: MENTORS OR TEACHERS?
some sort of record keeping, compared 86 percent of those who receive in-class training (19 percent increase) and 77 percent of the mentees (7 percent increase). However, this effect is only present in the first four months following the treatment for the class treatment. This is consistent with short-run changes in behavior found in other studies as well (e.g., Karlan, Knight, and Udry 2015) and implies that the in-class training does in fact change behavior without changing business outcomes.
For further evidence that classes change business practices, in our t = 7 and t = 12 surveys, we asked a much longer battery of business practice questions. The ques-tions are primarily drawn from the survey instrument first used in de Mel, McKenzie
Table 8 — OLS Treatment Effects for Business Practices at Different Time Periods
Months since treatment:
Pooled 1 2 3 4 7 12
Panel A. Record keepingMentee 0.072 −0.008 0.119 0.099 0.143 −0.022 0.105
(0.027) (0.054) (0.057) (0.059) (0.061) (0.069) (0.063)Class 0.146 0.198 0.185 0.122 0.308 −0.047 0.098
(0.027) (0.052) (0.057) (0.059) (0.060) (0.067) (0.063)Control mean 0.654 0.719 0.683 0.689 0.561 0.629 0.636p-value, H 0 : M L = C 0.003 0.000 0.238 0.688 0.007 0.710 0.909Observations 1,941 351 317 318 322 308 325 R 2 0.052 0.090 0.099 0.057 0.090 0.062 0.049Controls Yes Yes Yes Yes Yes Yes Yes
Panel B. Marketing/advertisingMentee −0.004 0.003 −0.022 0.077 −0.014 −0.015 −0.058
(0.019) (0.052) (0.048) (0.044) (0.036) (0.055) (0.046)Class −0.014 0.030 −0.050 −0.008 0.007 0.010 −0.086
(0.020) (0.052) (0.047) (0.043) (0.035) (0.053) (0.045)Control mean 0.201 0.202 0.163 0.097 0.075 0.186 0.182p-value, H 0 : M L = C 0.643 0.611 0.541 0.050 0.551 0.634 0.554Observations 1,941 351 317 318 322 308 325 R 2 0.028 0.050 0.040 0.052 0.052 0.056 0.040Controls Yes Yes Yes Yes Yes Yes Yes
Notes: Robust standard errors are in parentheses. Pooled regressions are clustered at the individual level and include wave fixed effects. Controls include secondary education, age of owner, sector fixed effects, and an indicator for any employees.
Table 9 — OLS Treatment Effects on Aggregated Business Practice Measures Used in McKenzie and Woodruff (2017)
Score components
Aggregate Marketing Stock Record keepingz-score z-score z-score z-score
Mentee 0.140 0.006 0.248 0.088(0.098) (0.096) (0.099) (0.095)
Class 0.118 −0.022 0.248 0.063(0.093) (0.096) (0.096) (0.095)
p-value, H 0 : M = C 0.810 0.779 1.000 0.794Observations 633 633 633 633 R 2 0.076 0.059 0.061 0.062Controls Yes Yes Yes Yes
Notes: Robust standard errors are in parentheses. Controls include secondary education, age of owner, sector fixed effects, and an indicator for any employees.

218 AMERICAN ECONOMIC JOURNAL: APPLIED ECONOMICS OCTOBER 2018
and Woodruff (2014), and McKenzie and Woodruff (2017) show that these ques-tions are positively correlated with profit in a number of countries. Table 9 provides four aggregate measures of business practices. The Aggregate score variable is the sum of Marketing score, Stock score, and Record keeping score. Each is presented as a standardized z-score to facilitate comparability, but we present the raw numbers in online Appendix D for disaggregated categories. We combine the two waves of data and run the regression
y it = α + M i β + C i γ + X i η + θ t + ϵ it for t = 7, 12 .
We do find changes associated with the stock score, which includes the likelihood of haggling with suppliers, whether or not the business owner compares suppliers, and how often she runs out of stock. This is consistent with the importance of suppliers and cost for generating changes in profit. Interestingly, however, we find similar effects between the class and mentorship group. The difference is that this information does not translate into profitability among the training class. Taken together, the results highlight the fact that the class was indeed successful in generating changes in behavior, but that they did not translate into increased profit. Moreover, they demonstrate that the mentorship treatment impact is not simply driven by an initial absolute lack of knowledge relative to places previously studied, but that mentorship is effective even in circumstances where classroom study has the same effects as found previously.
B. Other Possible Channels
We compute the treatment impact on a number of other results and find no effect. These include measures of business scale, borrowing, changing of product mix, and business exit. The results are available in online Appendix D. A last and related possibility is that mentors provided monetary help to the mentees. While interesting in its own right, it suggests constraints other than local information driving the results. Qualitatively, when asked about the most important benefit of having a mentor, only six percent mentioned anything related to financial help or transfers. More objectively, only 2 percent reported receiving any financial help from their mentor at any point between t = 1 and t = 12 . Financial transfers do not seem to be critical in increasing mentee profit.
VI. Conclusion
The prevalence of small, unprofitable businesses in developing countries presents a persistent and difficult problem. To investigate whether local expertise and business experience can benefit these entrepreneurs relative to a class, we conduct a randomized controlled trial in which all subjects receive a cash grant, some subjects are enrolled in a business course, some receive an experienced mentor, and some receive neither. Our results show that interacting with a successful, local business owner generates a 20 percent increase in profit, but that the effect fades over time, while the class generates no change in profit. We use the dynamics of the response
VOL. 10 NO. 4 219BROOKS ET AL.: MENTORS OR TEACHERS?
to show that the result is driven by the dissolution of matches over time, as those that still meet earn higher profit. We argue that the reason for the treatment effect and its amelioration is that the value of information and supplier relationships are short-lived and access to more experienced mentors who have a better understanding of the local market has substantial advantages. This also implies a rationale for the lack of success of formal training classes (at least in terms of higher profit). Most current training programs are designed to be easily portable and replicable, and therefore do not focus on the local information we have shown to be important.
While we view the results as an important first step, there is more work implied by these results. One important question implied by these results is based on the fact that mentorship varies both the teacher (local instead of outsider) and the method (one-on-one instead of group) of training. While evidence suggests the former is important, we cannot all together rule out the role of the latter. Further refinement of this mentorship program will provide more detailed policy prescriptions. This further experimentation is facilitated by the high cost effectiveness relative to classroom training. Per dollar spent, the mentorship treatment increased profit by US$1.63, while the class increased profit by US$0.30. This is driven by both the higher benefits and 20 percent lower cost compared to the class treatment. These calculations are discussed further in online Appendix E.
This paper joins a recent literature that shows specific and individualized interaction with peer groups, consultants, and mentors can be harnessed to improve business outcomes. Still unknown is how the scale of the business determines which type of interaction is most effective. While Bloom et al. (2013) find that professional consultants have positive effects on large businesses in India, Karlan, Knight, and Udry (2015) find no increase in profit from a similar intervention targeting micro-enterprises in Ghana. We use mentors from the same community and find positive effects on microenterprises in Kenya. Cai and Szeidl (2018) show that peer groups have a positive effect on medium-scale businesses in China. Further research should focus on how the effectiveness of these different types of arrangements interacts with firm scale.
REFERENCES
Atkin, David, Amit K. Khandelwal, and Adam Osman. 2017. “Exporting and Firm Performance: Evi-dence from a Randomized Experiment.” Quarterly Journal of Economics 132 (2): 551–615.
Bandiera, Oriana, and Imran Rasul. 2006. “Social Networks and Technology Adoption in Northern Mozambique.” Economic Journal 116 (514): 869–902.
Beaman, Lori, Ariel BenYishay, Jeremy Magruder, and Ahmed Mushfiq Mobarak. 2015. “Can Net-work Theory-based Targeting Increase Technology Adoption?” http://faculty.wcas.northwestern.edu/~lab823/MNW_june15.pdf.
Becker, Gary S. 1964. Human Capital: A Theoretical and Empirical Analysis, with Special Reference to Education. Chicago: University of Chicago Press.
BenYishay, Ariel, and A. Mushfiq Mobarak. 2018. http://faculty.som.yale.edu/MushfiqMobarak/papers/MalawiAg.pdf.
Bhattacharya, Dhritiman, Nezih Guner, and Gustavo Ventura. 2013. “Distortions, endogenous mana-gerial skills and productivity differences.” Review of Economic Dynamics 16 (1): 11–25.
Blattman, Christopher, and Laura Ralston. 2015. “Generating employment in poor and fragile states: Evidence from labor market and entrepreneurship programs.” https://www.povertyactionlab.org/sites/default/files/publications/Blattman_Employment%20Lit%20Review.pdf.

220 AMERICAN ECONOMIC JOURNAL: APPLIED ECONOMICS OCTOBER 2018
Bloom, Nicholas, Benn Eifert, Aprajit Mahajan, David McKenzie, and John Roberts. 2013. “Does Management Matter? Evidence from India.” Quarterly Journal of Economics 128 (1): 1–51.
Bloom, Nicholas, and John Van Reenen. 2007. “Measuring and Explaining Management Practices Across Firms and Countries.” Quarterly Journal of Economics 122 (4): 1351–1408.
Brooks, Wyatt, Kevin Donovan, and Terence R. Johnson. 2018. “Mentors or Teachers? Microenter-prise Training in Kenya: Dataset.” American Economic Journal: Applied Economics. https://doi.org/10.1257/app.20170042.
Bruhn, Miriam, Dean Karlan, and Antoinette Schoar. 2010. “What Capital Is Missing in Developing Countries?” American Economic Review 100 (2): 629–33.
Bruhn, Miriam, Dean Karlan, and Antoinette Schoar. 2018. “The Impact of Consulting Services and Small and Medium Enterprises: Evidence from a Randomized Trial in Mexico.” Journal of Politi-cal Economy 126 (2): 635–87.
Bruhn, Miriam, and Bilall Zia. 2013. “Stimulating managerial capital in emerging markets: The impact of business training for young entrepreneurs.” Journal of Development Effectiveness 5 (2): 232–66.
Buera, Francisco J., and Ezra Oberfield. 2016. “The Global Diffusion of Ideas.” National Bureau of Economic Research (NBER) Working Paper 21844.
Cai, Jing, and Adam Szeidl. 2018. “Interfirm Relationships and Business Performance.” Quarterly Journal of Economics 113 (3): 1229–82.
Calonico, Sebastian, Matias D. Cattaneo, and Rocio Titiunik. 2014. “Robust Nonparametric Confi-dence Intervals for Regression-Discontinuity Designs.” Econometrica 82 (6): 2295–2326.
Conley, Timothy G., and Christopher R. Udry. 2010. “Learning about a New Technology: Pineapple in Ghana.” American Economic Review 100 (1): 35–69.
Da-Rocha, José-María, Marina Mendes Tavares, and Diego Restuccia. 2017. “Policy Distortions and Aggregate Productivity with Endogenous Establishment-Level Productivity.” National Bureau of Economic Research (NBER) Working Paper 23339.
de Mel, Suresh, David McKenzie, and Christopher Woodruff. 2014. “Business training and female enterprise start-up, growth, and dynamics: Experimental Evidence from Sri Lanka.” Journal of Development Economics 106: 199–210.
Foster, Andrew D., and Mark R. Rosenzweig. 1995. “Learning by Doing and Learning from Others: Human Capital and Technical Change in Agriculture.” Journal of Political Economy 103 (6): 1176–1209.
Garicano, Luis, and Esteban Rossi-Hansberg. 2006. “Organization and Inequality in a Knowledge Economy.” Quarterly Journal of Economics 121 (4): 1383–1435.
Giné, Xavier, and Ghazala Mansuri. 2018. “Money or Management? A Field Experi-ment on Constraints to Entrepreneurship in Rural Pakistan.” https://drive.google.com/file/d/0B1pYd9GqkTWjMmlPMENVQnVRRTQ/view.
Gollin, Douglas. 2008. “Nobody’s business but my own: Self-employment and small enterprise in eco-nomic development.” Journal of Monetary Economics 55 (2): 219–33.
Hardy, Morgan, and Jamie McCasland. 2016. “It Takes Two: Experimental Evidence on the Determinants of Technology Diffusion.” https://assets.publishing.service.gov.uk/media/5873a45840f0b60e4c000127/Hardy_It_Takes_Two_Working_Paper.pdf.
Hsieh, Chang-Tai, and Peter J. Klenow. 2009. “Misallocation and Manufacturing TFP in China and India.” Quarterly Journal of Economics 124 (4): 1403–48.
Imbens, Guido, and Karthik Kalyanaraman. 2012. “Optimal Bandwidth Choice for the Regression Discontinuity Estimator.” Review of Economic Studies 79 (3): 933–59.
Jovanovic, Boyan, and Rafael Rob. 1989. “The Growth and Diffusion of Knowledge.” Review of Eco-nomic Studies 56 (4): 569–82.
Karlan, Dean, Ryan Knight, and Christopher Udry. 2015. “Consulting and Capital Experiments with Microenterprise Tailors in Ghana.” Journal of Economic Behavior and Organization 118: 281–302.
Lucas, Robert E., Jr. 2009. “Ideas and Growth.” Economica 76 (301): 1–19.Lucas, Robert E., Jr., and Benjamin Moll. 2014. “Knowledge Growth and the Allocation of Time.”
Journal of Political Economy 122 (1): 1–51.McKenzie, David. 2012. “Beyond baseline and follow-up: The case for more T in experiments.” Jour-
nal of Development Economics 99 (2): 210–21.McKenzie, David, and Christopher Woodruff. 2014. “What are we Learning from Business Training
and Entrepreneurship Evaluations around the Developing World?” World Bank Research Observer 29 (1): 48–82.
McKenzie, David, and Christopher Woodruff. 2017. “Business Practices in Small Firms in Developing Countries.” Management Science 63 (9): 2967–81.

VOL. 10 NO. 4 221BROOKS ET AL.: MENTORS OR TEACHERS?
Munshi, Kaivan. 2004. “Social learning in a heterogeneous population: Technology diffusion in the Indian Green Revolution.” Journal of Development Economics 73 (1): 185–213.
Perla, Jesse, and Christopher Tonetti. 2014. “Equilibrium Imitation and Growth.” Journal of Political Economy 122 (1): 52–76.
Restuccia, Diego, and Richard Rogerson. 2008. “Policy distortions and aggregate productivity with heterogeneous establishments.” Review of Economic Dynamics 11 (4): 707–20.