Embed Size (px)
Citation preview
East Tennessee State UniversityDigital Commons @ East
Tennessee State University
Electronic Theses and Dissertations Student Works
12-2007
Mentoring At-Risk Youth: A Case Study of anIntervention for Academic Achievement withMiddle School Aged Students.Kellie Carter JohnsonEast Tennessee State University
Follow this and additional works at: https://dc.etsu.edu/etd
Part of the Educational Sociology Commons
This Dissertation - Open Access is brought to you for free and open access by the Student Works at Digital Commons @ East Tennessee StateUniversity. It has been accepted for inclusion in Electronic Theses and Dissertations by an authorized administrator of Digital Commons @ EastTennessee State University. For more information, please contact [email protected].
Recommended CitationJohnson, Kellie Carter, "Mentoring At-Risk Youth: A Case Study of an Intervention for Academic Achievement with Middle SchoolAged Students." (2007). Electronic Theses and Dissertations. Paper 2070. https://dc.etsu.edu/etd/2070

Mentoring At-risk Youth:
A Case Study of an Intervention for Academic Achievement
With Middle School Aged Students
__________________
A dissertation
presented to
the faculty of the Department of Educational Leadership and Policy Analysis
East Tennessee State University
In partial fulfillment
of the requirements for the degree
Doctor of Education in Educational Leadership and Policy Analysis
__________________
by
Kellie Carter Johnson
December 2006
__________________
Dr. Terry Tollefson, Chair
Dr. Glenn Bettis
Dr. Jim Lampley
Dr. Patricia Robertson
Keywords: Mentoring, At-risk students, Academic Achievement, Middle School, LISTEN

2
ABSTRACT
Mentoring At-risk Youth:
A Case Study of an Intervention for Academic Achievement with
Middle School Aged Students
by
Kellie Carter Johnson
Students without caring, positive role models often make poor decisions. School
personnel are aware of the need to help these students be productive members of society;
therefore, they examine strategies and reforms to reach them. A mentoring program is
one such intervention that is gaining in popularity.
This research study examined a mentoring program entitled the LISTEN (Linking
Individual Students To Educational Needs) Mentoring Program that I developed in 2003.
For the purposes of this research, the mentoring program was developed and
implemented in one middle school in Northeast Tennessee. The goal of the LISTEN
mentoring program was to identify at-risk students and provide them with positive adult
role models, who were not necessarily their classroom teachers. The mentors worked
with the students to assist in developing positive behaviors and better decision making
skills.
The implementation of LISTEN was assessed throughout this study. The second
component of the investigation focused on program perceptions by teachers and students.

3
The final component of this research centered on recommendations for improving the
program and enhancing the program’s components for further development.
This experimental study analyzed archival data from 2004-2005 to determine the effects
of the LISTEN mentoring program on identified at-risk students in grades 6 through 8 in
a Northeast Tennessee middle school. Specifically, the study investigated the effects of a
mentor program on students’ grade-point average, discipline referrals, and attendance
records.
Findings indicated that there were significant differences in students’ grade-point
averages, school attendance, and discipline referrals from 1 school year to the next
among students who participated in the LISTEN mentor program. Students’ grade-point
averages increased significantly from 2003-2004 to 2004-2005 for 5 of the 6 six-week
grading periods and for the entire year. Mean numbers of student discipline referrals and
days absent decreased significantly for 5 of the 6 six-week grading periods from 2003-
2004 to 2004-2005 and for the entire year. Contrary to typical at-risk behavior, this study
showed that 54 of the original 57 participants returned to the school in the 2004-2005
school year, while only 3 students transferred to other schools.

4
DEDICATION
This work is dedicated to my respected mom and dad, Dinah and Greg, my dear
husband, Matthew, my faithful sister, Alison, my life, Jacob. They loved, encouraged,
and believed in me, even when I doubted myself.
5
ACKNOWLEDGEMENTS
I express my sincere gratitude to members of my dissertation committee for their
guidance, countless hours of time, and insights to help focus my efforts. A special
appreciation is expressed to Dr. Tollefson for his patience and support. He has been a
true mentor to me throughout this process. Gratitude is also given to Dr. Lampley for his
assistance with the statistical analysis, Dr. Bettis for his continual support, and Dr.
Robertson for her dedication to the counseling field. Genuine appreciation is expressed
to Dr. Carolyn McPherson and the faculty of John Sevier Middle School. Without their
support, encouragement, and dedication to students’ success, this study could not have
been completed. A special thank you is expressed to Dr. Joyce Duncan for her myriad
hours of editing. Appreciation is given to teachers and students whose cooperation
throughout this study and data collection was irreplaceable.
Words cannot express my gratitude for my biggest supporter and motivator, my
mom. My mother’s countless hours of editing and proofreading have enabled me to
reach this goal in my professional career. Without her commitment, patience, and above
all, her love, this study could not have been completed. She is a true martyr who has put
my needs above her own. I am truly blessed to call her my mom.

6
CONTENTS
Page
ABSTRACT....................................................................................................................2 DEDICATION................................................................................................................4
ACKNOWLEDGEMENTS.............................................................................................5
1. INTRODUCTION............................................................................................... 10 Statement of the Problem....................................................................................... 14 Research Questions................................................................................................ 15 Significance of the Study....................................................................................... 16 Limitations and Delimitations................................................................................ 17 Definition of Terms ............................................................................................... 17 Overview of the Study ........................................................................................... 18 2. REVIEW OF THE LITERATURE........................................................................... 20 Rationale ............................................................................................................... 20 Defining At-risk Students ..................................................................................... 21 The Need for Intervention...................................................................................... 28 Mentoring and Education....................................................................................... 30 Mentoring Roles and Functioning .......................................................................... 33 Mentoring.............................................................................................................. 34 Summary of Literature........................................................................................... 40 3. METHODOLOGY.................................................................................................. 42
Population and Sample .............................................................................................. 44

7
Research Questions ................................................................................................... 44
Phases ....................................................................................................................... 45
Phase I: Comprehensive Review of Data ............................................................... 45
Phase II: Data Analysis .......................................................................................... 46
General Null Hypothesis ........................................................................................... 46
Procedures................................................................................................................. 47
Chapter Review......................................................................................................... 48
4. DATA ANALYSIS .................................................................................................. 49
Null Hypotheses ........................................................................................................ 49
Research Design....................................................................................................... 50
Summary of Findings ............................................................................................... 51
Summary.................................................................................................................. 61
5. SUMMARY, ANALYSIS, AND RECOMMENDATIONS FOR PRACTICE AND
FUTURE STUDY ................................................................................................... 63
Summary of Findings ............................................................................................... 63
Analysis ................................................................................................................... 64
Conclusion ............................................................................................................... 68
Recommendations for Improving Practice and Future Studies .................................. 70
REFERENCES............................................................................................................. 73
APPENDICES ............................................................................................................. 78
Appendix A: Consent Letters to Director of Schools and School Principal............... 78
Appendix B: Grade-point Averages: 6 Week and End-of-the-Year Mean................ 80
Appendix C: Discipline Referrals: 6 Week and End-of-the-Year Mean.................... 83

8
Appendix D: Attendance Rates: 6 Week and End-of-the-Year Mean ....................... 85
VITA............................................................................................................................ 89
9
LIST OF FIGURES
Figure Page
1. Gender Breakdown of Participant Group ............................................................. 50
2. Grade Level Breakdown of Participant Group...................................................... 50
3. Means of Participants’ Grade-Point Averages ...................................................... 53
4. Means of Participants’ Discipline Referral Rates ................................................. 56
5. Means of Participants’ Attendance Rates ............................................................. 59

10
CHAPTER 1
INTRODUCTION
“Ask not what your country can do for you, ask what you can do for your
country” (as cited in Sizer, 1962). In the early 1960s, President John F. Kennedy
expressed those words to the American people in an attempt to renew the spirit of
volunteerism in the United States. In the beginning of the 21st century, President George
W. Bush advocated that volunteers become active in the lives of all children. In his drive
to empower the American people and give back control that was perceived as lost due to
terrorists’ attacks, Bush suggested that mentoring America’s youth at an early age was
one way the country could respond to the attack on the World Trade Center on September
11, 2001 (Powell, 2002). Even before President Bush’s plea, former President Bill
Clinton and former Secretary of State Colin Powell requested that the nation become
involved in community volunteer work, especially mentoring. Both political figures
helped to found a national mentoring program in 1997. Their goal was to get Americans
to volunteer their time for the country’s youth who were identified as at-risk or on the
margins of society (Powell).
Throughout past years, a variety of interventions were developed to assist at-risk
students who were below average in educational skills. In addition to academic skills, at-
risk children were often deficient in social skills and emotional development (Carter,
2004). Frequently, at-risk children lacked basic support from parents and guardians and,
in some cases, they lived in environments where basic needs, such as food, shelter, and
love, were not available. Because of their home circumstances, such students could be
ill-equipped to cope with social and emotional situations that might be presented on a

11
daily basis (Carter). According to Daloz (2004), many researchers contended that if a
child were partnered with a caring and compe10t adult in a one-on-one setting, the
mentor would be able to assist that student in meeting the challenges and tasks with
which he or she is confronted.
Often, in educational settings, classroom teachers had numerous students who
were identified as being at risk. These at-risk children needed additional support and
time to achieve success within the school setting; however, teachers were often limited in
the amount of time that they could dedicate to an individual child’s accomplishment
(Coppock, 2005). Thus, a smaller, more individualized setting might prove to be more
beneficial in aiding students in academic achievement (Coppock). Such an environment
could enable students to ask for help without fear of teasing or being insulted by their
peers.
Many Americans did not have family support systems and the youth from those
families were “falling through the cracks” because of that deficiency (Chrisco, 1998).
According to Bennett (2003), research showed that the amount of time parents spent with
their children declined significantly since the 1970s. The author also reported that
parents, who used to spend 2 to 2.5 quality hours with their children per day in the 1970s,
spend only a half hour to an hour of quality time with their children at the time of this
study. By the end of the twentieth century, single-parent families had increased
dramatically, causing more mothers to enter the workforce in order to earn financial
support for their children. Bennett determined that “the number of children in the United
States living in poverty and being raised by single mothers who earned an average yearly
income of $20,982 reached 13.7 million as of 1989” (p. 24). In 2000, twenty-seven

12
percent of all children born in the United States had single parents (Floyd, 2003). Often
labeled as at-risk, dysfunctional, or disruptive, many of these children from single parent
households joined a growing number of students who were not responding to traditional
programs (Floyd).
According to Gray and Gray (1995), mentorship was demonstrated as successful
in providing training and role models for individuals who were new to organizations and
in assisting those who were experiencing difficulty. In most settings, mentoring was
viewed as a close one-to-one relationship in which an advocate helped guide a protégé
through a developmental process, whether that process was the transition from childhood
to adulthood or from student to professional (Brzoska, Jones, McHaffy, Millar, &
Mychals, 1997).
During data collection in the archival portions of this study, mentors were used to
assist middle school at-risk children in improving their academic performance and social
development. Characteristics that classified children as at risk often varied from study to
study; however, the primary factors were students with low socioeconomic status,
students failing one or more grade levels, and students with frequent truancy and
incidents of misbehavior. Hunt and Holt (2003) stated, “At risk can be defined as any
young person having a negative attitude about school, poor attendance, and poor
academic achievement” (p. 312). Poor academic performance, for the purposes of this
study, was indicated by consistently receiving low grades and/or low standardized test
scores. Such a student had typically been held back for one or more grade levels.
Frymier and Gansneder (2001) contended, “Children are at-risk if they are likely
to fail – either in school or in life” (p. 81). They concluded that children became at risk
13
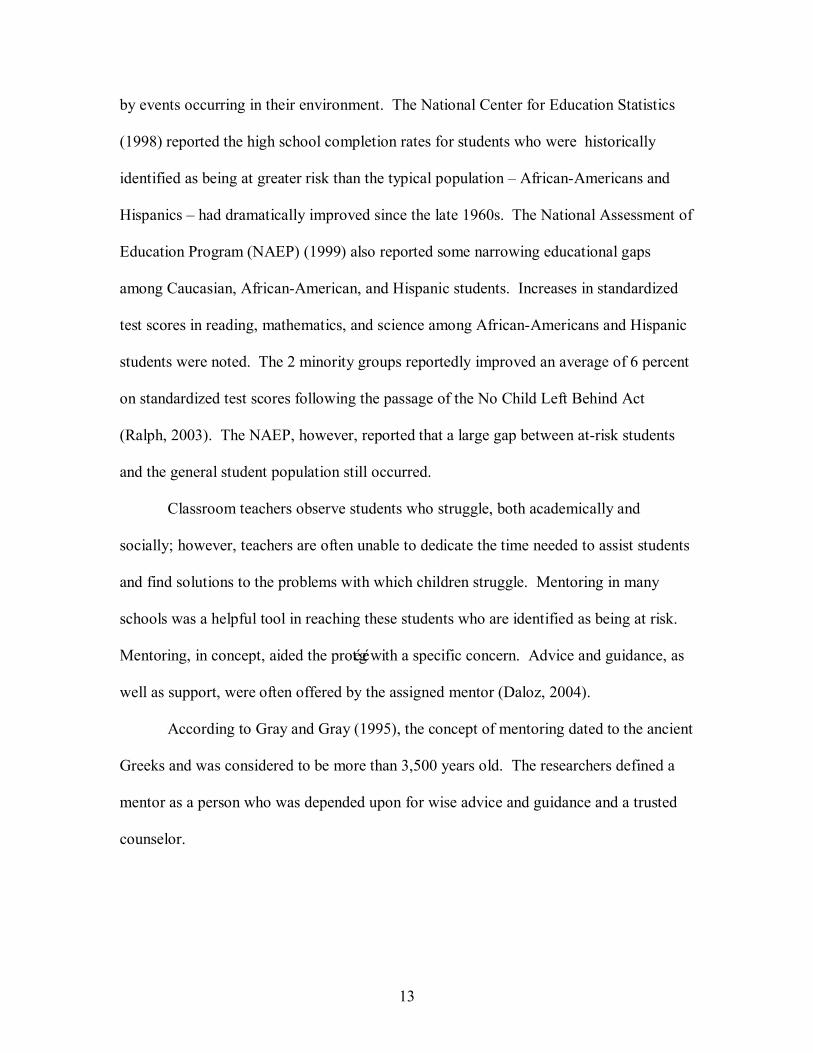
by events occurring in their environment. The National Center for Education Statistics
(1998) reported the high school completion rates for students who were historically
identified as being at greater risk than the typical population – African-Americans and
Hispanics – had dramatically improved since the late 1960s. The National Assessment of
Education Program (NAEP) (1999) also reported some narrowing educational gaps
among Caucasian, African-American, and Hispanic students. Increases in standardized
test scores in reading, mathematics, and science among African-Americans and Hispanic
students were noted. The 2 minority groups reportedly improved an average of 6 percent
on standardized test scores following the passage of the No Child Left Behind Act
(Ralph, 2003). The NAEP, however, reported that a large gap between at-risk students
and the general student population still occurred.
Classroom teachers observe students who struggle, both academically and
socially; however, teachers are often unable to dedicate the time needed to assist students
and find solutions to the problems with which children struggle. Mentoring in many
schools was a helpful tool in reaching these students who are identified as being at risk.
Mentoring, in concept, aided the protégé with a specific concern. Advice and guidance, as
well as support, were often offered by the assigned mentor (Daloz, 2004).
According to Gray and Gray (1995), the concept of mentoring dated to the ancient
Greeks and was considered to be more than 3,500 years old. The researchers defined a
mentor as a person who was depended upon for wise advice and guidance and a trusted
counselor.
14
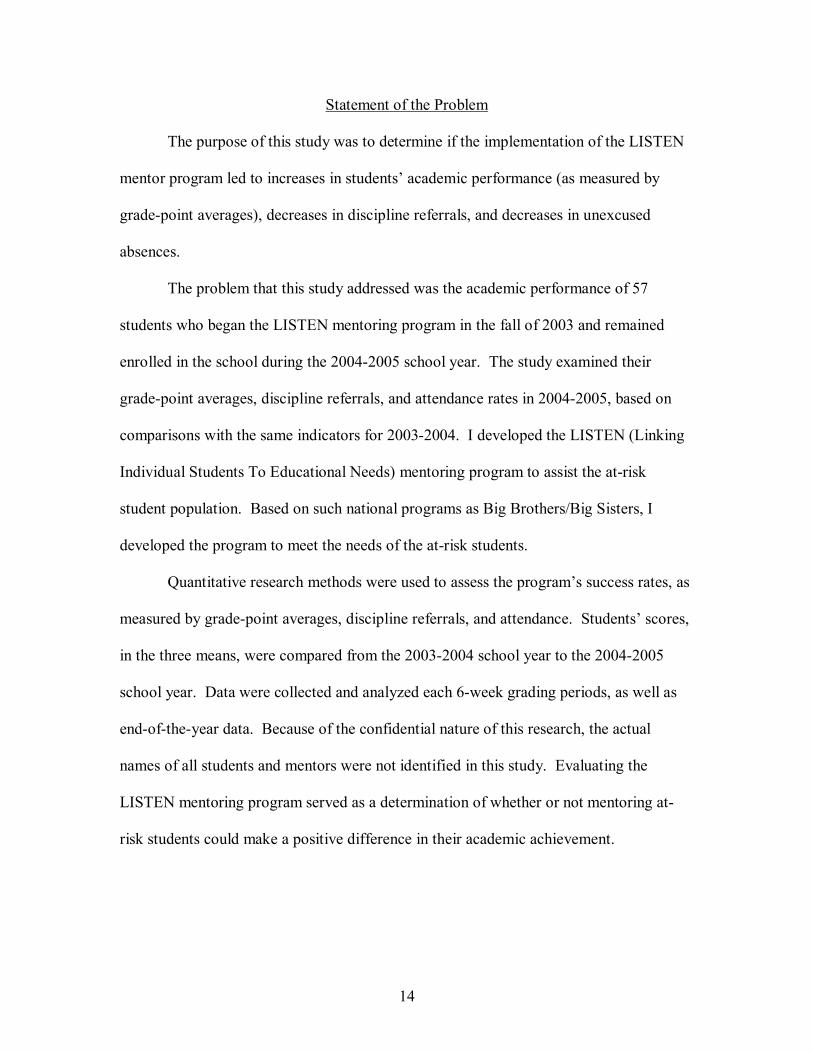
Statement of the Problem
The purpose of this study was to determine if the implementation of the LISTEN
mentor program led to increases in students’ academic performance (as measured by
grade-point averages), decreases in discipline referrals, and decreases in unexcused
absences.
The problem that this study addressed was the academic performance of 57
students who began the LISTEN mentoring program in the fall of 2003 and remained
enrolled in the school during the 2004-2005 school year. The study examined their
grade-point averages, discipline referrals, and attendance rates in 2004-2005, based on
comparisons with the same indicators for 2003-2004. I developed the LISTEN (Linking
Individual Students To Educational Needs) mentoring program to assist the at-risk
student population. Based on such national programs as Big Brothers/Big Sisters, I
developed the program to meet the needs of the at-risk students.
Quantitative research methods were used to assess the program’s success rates, as
measured by grade-point averages, discipline referrals, and attendance. Students’ scores,
in the three means, were compared from the 2003-2004 school year to the 2004-2005
school year. Data were collected and analyzed each 6-week grading periods, as well as
end-of-the-year data. Because of the confidential nature of this research, the actual
names of all students and mentors were not identified in this study. Evaluating the
LISTEN mentoring program served as a determination of whether or not mentoring at-
risk students could make a positive difference in their academic achievement.

15
Research Questions
Through quantitative analysis, the grade-point averages, discipline records, and
attendance data of 54 students at an East Tennessee middle school who participated in the
LISTEN mentor program were analyzed and compared using archival data from both the
2003-2004 and 2004-2005 school years. To complete the study of the success or failure
of this mentoring program, post-program surveys were gathered and analyzed during the
fall of 2005. As part of the quantitative research, the following research questions were
employed as the focus of that investigation:
1. What changes from the 2003-2004 year, if any, did the 54 LISTEN students who
completed the 2004-2005 school year show in their grade-point averages for the
entire academic year?
2. What changes from the 2003-2004 year, if any, did the 54 LISTEN students who
completed the 2004-2005 school year show in their grade-point averages for each
of the 6-week grading periods?
3. What changes from the 2003-2004 year, if any, did the 54 LISTEN students who
completed the 2004-2005 school year show in their discipline referrals for the
entire academic year?
4. What changes from the 2003-2004 year, if any, did the 54 LISTEN students who
completed the 2004-2005 school year show in their discipline referrals for each of
the 6-week grading periods?

16
5. What changes from the 2003-2004 year, if any, did the 54 LISTEN students who
completed the 2004-2005 school year show in their school attendance for the
entire academic year?
6. What changes from the 2003-2004 year, if any, did the 54 LISTEN students who
completed the 2004-2005 school year show in their school attendance for each of
the 6-week grading periods?
Significance of the Study
“Every student needs at least one thoughtful adult who has the time and takes the
trouble to talk with the student about academic matters, personal problems, and the
importance of performing well in middle school” (Jackson, 2000, p. 105). Many
schools were faced with a growing number of at-risk students who enter the corridor
each morning. As school leaders, principals should anticipate and plan according to
these concerns. Some principals turned to proactive programs, such as mentoring, to
develop appropriate plans in working with at-risk youth (Krivacska, 2003). Daloz
(2004) reported that mentoring provided at-risk students with a positive and
influential adult in their lives. According to Gray and Gray (1995), mentoring
allowed individuals the opportunity to receive the benefit of guidance and counseling
from an older, caring adult.
For practical purposes, analysis of data from this research study could enable
school leaders to employ better intervention strategies for dealing with at-risk youth.
More specifically, school leaders might obtain a more wide-ranging understanding of

17
the positive, and perhaps life-changing, effects that mentoring could have on at-risk
students during the critical ages of adolescence.
Limitations and Delimitations
This study was delimited to 57 students in a middle school in East Tennessee.
The community of children participating in the mentor program represented varying
demographic backgrounds. Using archival data, observations for an entire school
year were recorded and analyzed. Archival data, regarding grade-point averages,
discipline referrals, and attendance for each 6-week grading period and at the end of
the school year, were gathered for the 2003-2004 and 2004-2005 academic years.
Definitions of Terms
The following definitions were applied to this particular research study.
At-risk student. A student who demonstrates behaviors that hinder academic
success: poor grade-point average (failed one or more school years), excessive
absences (more than 10 unexcused absences throughout the previous school year),
chronic discipline referrals (10 or more discipline referrals to the main office) in one
school year (Schorr, 2000).
Linking Individual Success to Educational Needs (LISTEN) Mentor Program. In
2003, I developed this mentoring program to provide additional support for identified
at-risk students. I partnered each of the 57 participants with different mentors. The
mentors were not the students’ teachers. Employed professional educators served as

18
volunteers to mentor identified at-risk students and to promote educational
development, academic success, and growth throughout the school year.
Mentor. The mentor could be a classroom teacher, principal, school counselor,
librarian, custodian, or other paid faculty member. For this study, students were
partnered with professionals who were not their individual classroom teachers.
Mentoring. “A one-to-one, teacher-student relationship occurring during regular
school hours, using specific mentoring behaviors for the purposes of improving
student academic success, decreasing referrals, increasing attendance, and improving
the quality of student-adult relationships” (Alkin & Ellet, 2004, p. 24).
Middle School. “A school, by design, that houses students in grades 6, 7, and 8,
primarily aged 11-14” (Hurt & Holt, 2003, p. 64).
Site Coordinator. “The individual at the site who is viewed as being a positive
role model among all those involved in the mentoring program” (Jacobi, 2001, p. 38).
The site coordinator is responsible for collaborating on all mentoring activities,
administrating LISTEN strategies, and keeping records on mentors and at-risk
students (Jacobi). The site coordinator was also the link to gathering data within the
school setting. The coordinator was responsible for administering all surveys to
participants during both pre- and post-mentor implementation.
Overview of the Study
This study employed archival data collected from an experimental mentoring
program at a middle school and used post-study analyses to assess changes produced by
that program. Chapter 1 presented the introduction to the problem. It also included a
19
discussion of the significance of the study, the limitations of the study, the definitions of
terms, and the overview of the study. A review of the literature is provided in Chapter 2,
including description of the evolution of mentoring programs in public education and the
historical success of these programs. Chapter 3 contains a description of the
methodology employed in the study. A comprehensive description of the research
findings is presented in Chapter 4. Finally, Chapter 5 provides a summary of the
findings, conclusions, and recommendations for further research and improvement of
practice.

20
CHAPTER 2
REVIEW OF LITERATURE
Rationale
LISTEN was created in 2003 at a Northeast Tennessee middle school. The
program was developed following examination of results from national mentoring
programs and other alternative approaches to assist identified at-risk youth. The program
was designed to partner an employed professional with a student to provide additional
support with academic success outside the regular classroom setting.
This particular study focused mainly on the mentor-student relationship and the
perceived impact on student learning. The students were purposefully selected to
participate in the program that produced the archival data as was the information gathered
during the post-program data collection procedures. Students chosen for the mentor
program had previously been identified as being at risk. Each of the students had
previously failed one or more school years, had more than 10 discipline referrals within
one school year, or had missed more than 10 unexcused days of school in a school year.
In past studies, most research on mentors focused primarily on mentoring students in
elementary schools (Daloz, 2004). Daloz analyzed the responses from elementary
children when they had been partnered with caring, professional mentors. He examined
the benefits of mentoring on the learning environment as well as on their home life.
Much less research was conducted on understanding the impact of mentoring programs
among middle school age children; however, the literature not only addressed theoretical
influences and research studies of mentor programs, but it also disclosed the po10tial
success of established intervention plans. Finally, the literature stressed that mentoring

21
programs had the capacity to benefit all participants, regardless of socioeconomic status,
gender, race, or academic achievement (Sparzo, 2003).
Defining At-risk Students
Each year, teachers have students in their classrooms who require additional time,
support, and motivation to be successful. Educators categorized this group of students as
being at-risk. A possible definition of at-risk students was that they are persons who are
unlikely to graduate from school (Slavin & Madden, 2004). Frymier and Gansneder
(2001) stated that students who were labeled at risk had traumatic experiences, such as
abuse, poverty, and lack of parental guidance, as young children. Children were
considered at risk if they were likely to fail, either in school or in life.
In 2000, a study, conducted by Frymier and Gansneder (2001) observed and
evaluated at-risk youth. They collected data from 276 schools throughout the United
States, with 22,018 students as subjects of the research. Data were collected, using 45
previously identified risk factors, on the following population: 6,173 fourth graders,
7,762 seventh graders, 7,417 high school sophomores, and 676 other students who
attended city schools in the greater New York City area. Twenty-nine percent of the
22,018 students in the study were considered “seriously at risk”; however, the
percentages were possibly underestimated because of the nature of the data collection in
which participants were interviewed. One out of eight of the students reported having
negative self-esteem and lack of interest in school. The study reported a link between a
student’s self-esteem and success at school.

22
According to Slavin and Madden (2004), a student who attended school regularly,
who experienced academic success, and who did not get into behavioral trouble probably
would not drop out of school. Magdol (2004) also reported that the unemployment rates
for high school dropouts were much higher than those for high school graduates. Hunt
and Holt (2003) found that the average earnings for high school dropouts were
significantly lower than those of students who had completed high school. In 2001, for
example, individuals who had completed high school made an average income of
$19,560; whereas, those who had dropped out of school had an average income of only
$12,349 (Hunt & Holt). The graduation rate directly affected the economy, poverty, and
crime rates in the country.
According to Slavin and Madden (2004), defining at-risk students could be
somewhat challenging. They defined at-risk characteristics as: retention in grade level,
poor attendance, behavioral problems, low socioeconomic status or poverty, violence,
low achievement, substance abuse, and teenage pregnancy. These identified factors were
closely associated with dropping out of school.
Dropping out not only means earning less, but also dropouts have poorer reading skills, have trouble finding well-paid and steady jobs, have a harder time obtaining further education, have higher rates of unemployment, mortality, suicide, and admission to mental hospitals. (Coppock, 2005, p. 516) According to Slavin and Madden (2004), researchers found that by the time
students were in the third grade teachers could reliably predict which students would
ultimately drop out before graduation.
Students face a variety of situations everyday that may put them at-risk. Each day in this country:
• 27 children die because of poverty • 13 million children live in poverty • 9 children are shot to death

23
• 2,740 teenagers get pregnant • 1,293 teenagers have babies • 676 babies are born without adequate prenatal care • 3,288 children run away from home In the past 10 years, poverty has gripped our country producing frigh10ing numbers – but behind those numbers are people, especially children who have been put at-risk. (Liechty, 1991, p. 174)
At-risk students demonstrated characteristics that varied in degree and
significance. Goodlad (2004), in A Place Called School, observed 38 institutions and
concluded that public schools needed restructuring. He stated that educators needed to
understand and work with the students who were identified as at risk. In his study,
Goodlad reported that schools were not operated much differently in 1994 than they had
been in 1959. The environment, communities, and technology changed with time;
however, schools had not changed and had not accommodated their teaching to the
twenty-first century.
Low achievement, disciplinary problems, truancy, and school failure continued to
keep an at-risk student from achieving success.
The major problem of the schools is a problem of failure. Too much of our present educational system emphasizes failure, and too many children who at10d school are failing. Very few children come to school as failures, none come labeled failures; it is our schools and schools alone which pin the label of failure on children. (Glasser, 1996, p. 68)
Goodlad (2004) concluded that family environment, including socioeconomic
status, played a key role in students’ academic achievement and performance. At-risk
students, therefore, were at risk for dropping out of school prior to high school
graduation, especially those who came from poverty-stricken living environments (Jenks
& Meyer, 2005). Many homes had little or no financial support and some parents had
insufficient knowledge to encourage their children to succeed. Thus, school personnel

24
ultimately had to take responsibility for their students’ success. Some students began
school at a disadvantage when their parents or guardians placed minimal value on
education. In a 1993 case study, Freedman (1993) found circumstances, such as negative
attitudes toward school, students’ perceptions about teachers, and perceptions about
school achievement, were associated with student success in school. Students who were
failing one or more subjects considered school to be a place of dread and disliked
attending. On the other hand, students who enjoyed school were typically successful.
When at-risk students dropped out of high school or were retained at existing
grade levels, the causes were typically a culmination of many factors, including family,
student, and school characteristics. “Social bonding, described as an outcome in which
students are committed, attached, involved, has been identified by Hirschi as an
important component for at-risk students” (as cited in Jameson, 2003 p. 54). Students
who felt a true bond and attachment to the school they attended daily believed in the
legitimacy of education. In order to connect with at-risk students successfully, it was
critical for a school leader to appropriately identify students in need.
According to Jackson (2005), alienation from school administration, classmates,
and teachers was also a common characteristic of at-risk youth. Jackson found at-risk
adolescents had greater feelings of alienation, marginalization, powerlessness, and overall
negative attitudes. Students who were identified as being at risk tended to lack problem-
solving skills and were often unable to see cause and effect relationships between their
actions and the consequences. Because of this inability, Jackson acknowledged that their
decisions affected their behavior, causing them to blame others for their perceived

25
inadequacy. “Feelings of disconnection also were associated with low academic
performance and attendance rates” (Jackson, p. 157)
Wehlage (1997) noted that a disproportionate number of at-risk students were
male, older than average for their respective grade levels, and members of racial or ethnic
minorities. In his numerous studies, Wehlage additionally discovered that many at-risk
youth had scored 50% lower than other children in their same grade levels on nationally
standardized tests. At-risk adolescents were reported to have accumulated more
discipline referrals than the average child, were non-participants in extra-curricular
activities, and were assessed as having read less and having completed less work in
school. When they were interviewed, at-risk students expressed their opinion that they
were unpopular or different from their peers. In addition, one third of all students
identified in Wehlage’s research were achieving below grade level. Wehlage concluded
that “at-risk children in schools present a unique problem for both present and future
generations” (p. 68).
Schools that had chosen not to address the concern of at-risk students were likely
creating detrimental situations the future regarded as both the educational environment
and the communities in which the students lived (Sparzo, 2003). In the past, schools
were designed and organized to teach every child in the same way and educators assumed
that all children came to school with the same purpose and preparation (Sparzo).
According to Goodlad (2004), students who did not fit the typical model often
experienced negative consequences, including truancy, inappropriate behavior, lack of
re10tion, and school criticism. Because of ongoing rejection in other areas of their lives,
at-risk youth expected schools to be unresponsive, disconnected, and unrelated to their

26
needs or desires. Goodlad described schools as “teacher-centered, textbook-dominated,
restrictive, impersonal, and rigid” (Goodlad, p. 54). In this strict environment, at-risk
adolescents were lost in everyday routines. Because those children felt disconnected in
the schools they attended, some contemplated dropping out of school prior to graduation,
while others did more than contemplate.
According to Ghory and Sinclair (1997), nearly one million adolescents, the
equivalent of 20,000 school busloads, withdrew from school during 1997. Children who
did not receive the basic fundamental needs were not able to function in the classroom as
well as those students who did not need to worry about food, shelter, or other basic needs.
Maslow (1978) contended that until basic needs were met and satisfied, higher cognitive
processes of syntheses and evaluation would not follow. Piaget (1969) expressed the
basic concepts that learning must be appropriate to each stage of development in a child’s
life. Children who were identified as being at risk did not have the same physical, mental,
or academic development as that of typical children.
Cavazos (1999) offered that at-risk children characteristically had not received the
support needed to be successful in school. Cavazos also determined that for each 100
children born: 20 were born out of wedlock; 13 were the offspring of teenage mothers;
12 were products of parents who were divorced before the child was 18; 15 were raised in
households where no parent was employed; and 15 resided in households where the total
income was below the poverty level. Before the adulthood of these 100 children, 25 of
the families were on welfare. Boyer (1987) stated categorically in his study that poverty
and schooling were connected. He predicted that by the year 2010 as many as 33% of
young people would be disadvantaged and at risk.

27
In addition to Boyer’s findings about future generations of at-risk students,
Toepher (1996) also suggested several possible demographic changes in the ethnic make-
up of the United States.
By the year 2010 one of every three Americans will be Hispanic. Between July 1, 1980 and July 1, 1988 Eurocentric, Caucasian Americans increased by 6%; African Americans increased by 13%; Native Americans, Eskimos, and Aleutians increased by 19%; Hispanic Americans increased by 34%; and Asian and Pacific Islander Americans increased by 70%. Non-white students now comprise 30% of the American Youth. They will increase to 38% of the youth population in 15 years. It is projected that by 2040 the majority of American youth will be people of color. (1996, p. 212) Education had been and continued to be impacted by the rapid movement of
ethnic diversity in the country. It should be the responsibility of schools to meet the
needs of all students and the various environments from which they enter the learning
arena.
School communities whose population are not yet culturally, ethnically, and racially diverse need to sensitize their students to the meaning of these demographic changes among Americans. That involves preparing them to deal with people unlike themselves ethnically and culturally as they experience local shifts in population or as they move into diverse communities (Toepher, 1996, p. 81).
In addition to changes in ethnic demographics, Toepher (1996) discovered a
disproportionate percentage of people living in poverty. He found that, in 1988, 10.5% of
Caucasian Americans lived in poverty, compared with 31.8% of African Americans and
20.0% of persons of other races. He said, “Changes in social, economic, and political life
are threa10ing our children and challenging our democratic way of life” (p.54).
Students from single-parent homes had a higher dropout rate than those from two-
parent homes; children living in poverty had a much higher dropout rate than other
children; Hispanic and African American students had a disproportional higher dropout
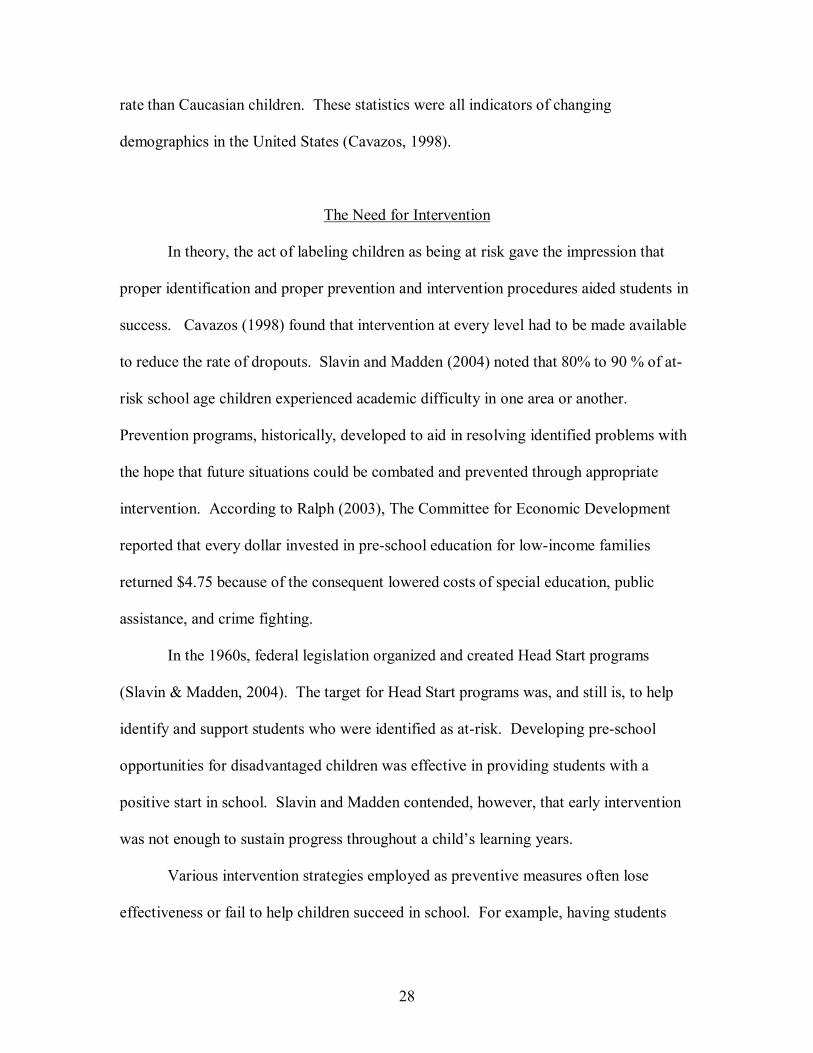
28
rate than Caucasian children. These statistics were all indicators of changing
demographics in the United States (Cavazos, 1998).
The Need for Intervention
In theory, the act of labeling children as being at risk gave the impression that
proper identification and proper prevention and intervention procedures aided students in
success. Cavazos (1998) found that intervention at every level had to be made available
to reduce the rate of dropouts. Slavin and Madden (2004) noted that 80% to 90 % of at-
risk school age children experienced academic difficulty in one area or another.
Prevention programs, historically, developed to aid in resolving identified problems with
the hope that future situations could be combated and prevented through appropriate
intervention. According to Ralph (2003), The Committee for Economic Development
reported that every dollar invested in pre-school education for low-income families
returned $4.75 because of the consequent lowered costs of special education, public
assistance, and crime fighting.
In the 1960s, federal legislation organized and created Head Start programs
(Slavin & Madden, 2004). The target for Head Start programs was, and still is, to help
identify and support students who were identified as at-risk. Developing pre-school
opportunities for disadvantaged children was effective in providing students with a
positive start in school. Slavin and Madden contended, however, that early intervention
was not enough to sustain progress throughout a child’s learning years.
Various intervention strategies employed as preventive measures often lose
effectiveness or fail to help children succeed in school. For example, having students
29
repeat a grade, although immensely popular, was an ineffective intervention strategy
(Slavin & Madden, 2004). Another widely used strategy for intervention was the so-
called pull-out program, delivered under Title 1 and provided to schools with a 51% or
higher free and reduced lunch rate, which attempted to keep at-risk students from falling
further behind their classmates. Other programs were largely limited in early grades
(Carter, 2004).
In 2002, it became evident that the number of at-risk students was increasing. As
individuals developed more awareness of this group, researchers and educators gained
increased knowledge of the factors related to being identified as at-risk. As a result of
this knowledge and after examining the effects of Head Start and Chapter 1 programs,
educators were closer to understanding the effective programs and relationships that help
at-risk youth succeed (Blumenfeld, 2003).
Slavin and Madden (2004), based on their research abstract the effectiveness of
intervention programs that assisted at-risk students, encouraged comprehensive, one-on-
one approaches. Tutoring and counseling relationships, although not always optimal,
were included in these approaches; however, finding professional tutors who could target
at-risk students was often a difficult and overwhelming task. As a rule, teachers and
parents did not pursue tutoring because of the amount of time involved and the financial
obligation (Slavin & Madden). Moreover, the identified at-risk youth themselves usually
did not have the means or the drive to pursue help outside of school.
In addition to tutoring, counselor-student relationships were not always available
(Rogers, 2002). While beneficial, counselors were accessible on a limited basis. Many
school systems hired only one counselor for as many as 500 students. This ratio was both
30
impossible and unrealistic. Rogers (2002) contended that although the relationship
between counselor and student could be advantageous for at-risk students, the ratio of
students to counselors was a challenge in promoting change within the school setting.
As in this research study, mentoring, another identified strategy, was defined as
an educator working with an at-risk student in a one-on-one setting, outside of the
traditional classroom, on a consistent basis, using prevention and intervention strategies
of linking and coordinating at-risk students with school personnel and related school
resources. “The mentor advised and counseled students, assisted with diagnosing and
evaluating, collaborated with families and schools, and clarified goals for academic
success.” (Aarkin & Shollar, 2002, pg. 223) The mentor helped the student improve both
academically and socially in the school setting.
Mentoring and Education
Mentoring was not a novel strategy in working with at-risk youth (Johnson &
Sullivan, 1995). “People from Colin Powell to local urban school district officials have
issued persis10t calls for mentoring programs to address complex youth needs” (Bein,
1999, p. 142).
According to mentor advocate Riley (1998), effective mentoring programs steered
teenagers away from trouble, gave extra encouragement to students, and provided a role
model for more positive types of behaviors. Riley found that students who had mentors,
such as Big Brothers/Big Sisters, increased participants’ grade-point averages by .37
points. Riley also reported that students’ attendance rates increased by 5%. Mentoring
was often viewed as a beneficial and cost-effective approach to assisting a targeted

31
number of students. According to Becker, President George Bush, Senior stated in 1989
that mentoring was one of the best ways to help those youth at-risk.
As a means of sharing real-life experiences and knowledge, mentoring became
popular in both the business and education fields. The most common characteristic of a
mentoring program was the one-on-one relationship between an older adult and a
younger person. According to Lund (2002), the purpose of this relationship was to
provide guidance, pass on knowledge, share experience, provide a background for more
sound judgment, and establish friendship.
Schools throughout the nation are engaged in programs that use adults from the community to help at-risk youth make steady progress through the middle and secondary grades and complete high school. 2 general approaches, mentoring and advocacy are widely used as promising mechanisms to provide sustained goal-directed support for students. (McPartland & Nettles, 1991, p. 175)
Mentors, for the purposes of this study, were classroom teachers, school
counselors, administrators, custodians, librarians, teaching assistants, retired teachers, and
cafeteria employees. It was hoped that a positive, caring adult could offer an at-risk
student substantial emotional, material, and instructional support that would supplement
the many needs not met by the student’s family or through traditional education.
“Mentoring is often a delicate balancing act between 2 people from different worlds and a
few of these match-ups work out very well” (Lund, 2002, p. 251).
The number of mentoring programs greatly increased during the 1990s (Floyd,
2003). Because of the testimonials from adult mentors and youth mentees, who benefited
from the relationship, mentoring experienced a renewed level of popularity. Appearing
inexpensive, effective, and simple, mentor programs were encouraged and used by
businesses, communities, and schools alike (Lund, 2002). In addition, the media paid
32
attention to at-risk students who were helped by a mentor relationship. Newspapers,
journals, and television gave credit to mentors or advocates for motivating achievement
in at-risk youth.
On the other hand, in spite of the attention these programs received, the research
on the effects of mentoring was limited and sometimes negative. Becker (2004), for
example, warned, “Do not be misled into thinking that mentoring is inexpensive, easy, or
a panacea. It is not”(p. 128).
Bernard (2005) identified several reasons for the recurrence of mentoring as a
popular intervention. According to Bernard, “mentoring is the ability to meet the very
diverse needs of individuals and groups, to work across socioeconomic boundaries, to
work across political boundaries, and to lead itself to very different programs, structures,
and missions” (p. 74). In addition, Freedman (1993) added,
At one level, mentoring speaks to the American traditions of individual achievement, progress and optimism. It is connected to an improved workforce and economic competitiveness … at the same time, mentoring has another, more subtle allure. This aspect speaks to yearning for community lost, to a time of greater civility and responsibility for strangers. (p. 47)
Mentoring was organized in a variety of ways. Mentoring programs were
developed to meet the different needs of participants. Becker (2004) identified six
general types of mentoring programs:
1. Intensive, community-based programs, such as Big Brothers, Big Sisters or Partners, Inc., all of which accept youth from a wide variety of sources and recruit volunteers from anywhere in the community;
2. School-based programs, such as classroom-sponsored or district-sponsored efforts in which the youth are identified by the school system, and mentors are recruited specifically to assist the mentee with school performance or related issues;
3. Court-based programs, such as Volunteers in Probation, in which mentors assist professional probation officers with excessive caseloads. Efforts emphasize mentee completion of a problem plan and the development of skills and a lifestyle that prevents recidivism;

33
4. Career or hobby-based programs, such as professional or union-sponsored efforts in which a more advanced or accomplished individual assists a less experienced person in developing specific skills. The journeyman-apprentice relationship of the plumbing trade, for instance, is based upon mentoring;
5. Campus-based programs such as Campus Compact’s Campus Partners in Learning, which are supported by colleges and universities and emphasize the community service aspects of the mentoring experience;
6. Church-based programs that recruit mentors from the congregation of religious community, and provide services to community youth, special populations, or as part of the ministry. Church programs range from minimal expectations to highly in10sive involvement. (p. 412)
According to McHale (2000),
10 forms of mentoring included: mentoring in the business community, career mentoring within specific groups as professionals or businesses, mentoring situations that demand special training, mentoring within educational settings, language-culture-gender or ethnic group mentoring, special needs or focus groups, group mentoring, youth-to-youth mentoring, and cross-age intergenerational mentoring. (p. 321)
Over time, mentoring programs varied in structure and guidelines. Each
intervention had its own purpose and resources. Mentoring activities might have been
casual or structured with procedures for staffing, activities, goals, and monitoring
procedures (Lund, 2002).
Mentoring Roles and Functioning
Mentors provided a supporting relationship for at-risk adolescents. A mentor
played several roles, many overlapping, as the supportive relationship developed
(Flaxman, 1998).
A mentor has been likened to a coach, sponsor, guide, advocate and role model; a mentee to a novice, apprentice, student, discipline, or learner. However we view mentoring, it is clearly defined more by the functions it serves and the character of the relationship than by the personality of the mentor or mentee. At its simplest, mentors support, guide, and shape young adults as they go through

34
difficult periods, enter new arenas, or undertake important tasks. (Flaxman, 1998, p.165)
In many instances, the mentor met the basic needs of the recipients. According to
Flaxman (1998), mentoring could have occurred, whether naturally or planned. Planned
mentoring saw a tremendous growth in popularity during the 1990s and was viewed as
especially beneficial to at-risk youth (Bernard, 2005).
The first step in partnering youth with beneficial adults was recruiting the right
adults to work with the students (Flaxman, 1998). For the purposes of this study,
partnering was carried out through a variety of methods, including advertising,
promotion, word-of-mouth, memoranda, and training sessions. Although many planned
mentoring programs used volunteer mentors, other programs offered enticements. In a
school setting this included professional development opportunities, career ladder
funding, or trade-off days.
Mentoring
Further research supported the implementation of mentoring programs as
po10tially successful approaches to meet students’ individual needs (Smink, 2000).
Research indicated that students achieved better grades, established obtainable goals and
aspirations, and enhanced their self-esteem when partnered with caring, supportive
adults. Students who had mentoring figures in their lives were able to achieve their goals
at more successful rates and to complete high school at 16% higher rates than those at-
risk students without mentors (Lee, 2001).
In a 1997 study, Flaxman (1998) used both pre- and post-measures to discuss two
mentoring program evaluations used for a control group and an experimental group. The
35
researcher discovered that after participants were exposed to caring mentors, they were
more likely to graduate from high school and have higher educational goals than the
control group (Flaxman). The key to this program was the amount of time being invested
in the student. “Actively pursuing and maintaining the relationship by the mentor
resulted in enduring and successful matches” (Flaxman, p. 63). In addition, this study
included weekly reports to both the parents and the program coordinator on how the
match was developing.
Clasen and Clasen (1997) described mentoring as a very personal, one-on-one
relationship that was an effective way of helping at-risk youth because it encouraged and
guided personal growth and development in an individual. The researchers stated that
“whether by peers, college students or caring adults, one-on-one mentoring addresses the
major need of at-risk students; the need to build self-confidence and see the connection to
a positive future” (Clasen & Clasen, p. 288). Clasen and Clasen investigated many
diverse forms of mentoring to examine the benefits of a caring adult being partnered with
an identified at-risk student.
Flaxman (1998) termed the developmental stages of adolescence dramatic times
of physical change, emotional dissonance, and identity crises. Furthermore, adolescence
was noted as a time in which all children, particularly at-risk youth, could benefit from a
supportive, caring adult. Flaxman stated, “earlier social learning, identification and
personal endowment place limits on the adolescent identify, but because it is a social
formulation, opportunities offered by the environment offer a second chance for new
social learning’s and internal identification” (p. 54).
36
Social roles were less congruent and more confusing for socially and
economically disadvantaged youth, who were often from an urban and minority
background (Flaxman, 1998). This identity conflict could make the transition from
childhood to adulthood even more stressful and confusing.
Some successful adults were considered to be at risk at one time, but they had
caring, supportive mentors who provided opportunities and experiences. Such
opportunities offered through association with exceptional role models contributed to
their success but, unfortunately, such opportunities were not made available for the
benefit of all at-risk youth. Mentoring, for these reasons, could have offered a crucial
element to programs that targeted at-risk students (US Department of Education, 1999).
According to the research of Freedman (1993), although same-gender and same-
ethnic group mentoring was not necessarily required to produce good matches, some
mentoring programs attempted to provide mentoring between people with similar social
backgrounds. According to Clasen and Clasen (1997), the most successful mentoring
happened when the mentor and mentee were closely matched in social class, gender, and
race. Freedman reported that in effective mentoring matches, individuals generally were
similar in socioeconomic, racial, and gender backgrounds.
Trust, sensitive support, consistent and timely contacts, and other appropriate
resources were just some of the critical aspects of a viable mentor/mentee relationship
found by Ascher (1998). Jacobi (2001), on the other hand, offered little evidence linking
mentoring directly to academic outcomes in her research done on university students and
academic performance. Her study was not focused on adolescent at-risk students but
rather on students at the University of Arizona in 1999. Two hundred twenty-five
37
participants were involved in the study. During the length of 1 academic year, each
participant was partnered with a university professional. The lack of direct positive
evidence could be attributed to failure to control for outside influences or additional
aspects of a program that could explain the outcomes.
The psychological perspective of the mentoring relationship could enhance
learning and social competence. Mentors who had successful interpersonal skills and
who could initiate and cement the relationship in its early stages had a better chance of
success (Flaxman, 1998). Interpersonal attraction further influenced the ways in which
the mentor fulfilled the youth’s needs. Flaxman’s research examined various types of
mentor relationships, indicated by the mentor’s care-taking style, such as business and
professional mentors, not just school setting mentors. There were five care-taking mentor
styles for youth identified by Flaxman:
1. The Nurturer. These mentors demonstrate a natural ability to offer help,
attention, and support.
2. The Trainer. Trainers naturally provide skills, shape behaviors, and
restrain the youth from dangerous or socially undesirable behaviors.
3. The Controller. These mentors reward, punish, correct, and tend to
dominate.
4. The Socializer. These mentors strive to become the youth’s friend.
5. The Provider. Provider make it possible for youth to access
opportunities, thus providing the youth with concrete assistance.
(Flaxman, 1998, pg. 91)

38
Discussion from various sources evaluated the effectiveness of mentors with at-risk
youth. Although the literature about mentoring was diverse, little research reached a
consensus about the specific behaviors required to be an effective mentor. Descriptions
of mentoring behaviors in different studies included: linking the mentee to others,
diagnosing a mentee’s background and evaluating progress, counseling and guiding,
clarifying goals and setting tasks for changes, being an advocate, reviewing academic and
social progress, protecting mentee confidentiality, raising mentee self-esteem, listening,
encouraging, planning and structuring mentoring sessions, tutoring, providing frank
feedback, and acting as a role model (Rhodes, 1997). Rhodes concluded that mentors
were successful in aiding the lives of at-risk youth and he encouraged mentors to promote
the well-being of individuals. Rhodes further stated that mentors:
1. should believe they can make a difference and instill hope for the future; 2. restore a human-centered base for establishing a connection with a student; 3. work in collaboration with others: parents, tutors, teachers, and counselor to open
doors for students; and 4. enable students to grow emotionally, socially, and academically. (p. 68) Mentors were described as being involved. Chrisco (1998) explained, in a follow-up
analysis to Rhodes’research, that human beings were forever in pursuit of relationships.
When these relationships happen between two people, they feel less isolated, and when
they have problems it is easier if someone is there to help them work through their
problems. Lowney (1996) studied the effects of mentors on at-risk families in an inner-
city New York community and proposed that effective mentors were people-oriented,
patient, and perceptive. They listened to what a person said and watched for physical
signs, such as body language, which indicated what problems existed or were developing.
39
After examining the relationship between high school students and professional
mentors, Ascher (1998) listed three important characteristics that defined a mentoring
relationship. The first characteristic was that the mentor played both instrumental and
psycho-social roles. The instrumental role was one in which the mentor opened doors
for the youth, served as an advocate, helped to change social circumstances, shared
concrete resources, and offered suggestions for problem solving. The psycho-social role
was less the teacher and advocate and more a counselor and role model who offered the
youth emotional support, confirmation, acceptance, understanding, and assistance in
resolving the contradictions between his or her life and mainstream society (Lowney,
1996).
A second important element in the definition of a mentor or of a mentoring
relationship was that the mentor viewed his or her own role as something extraordinary.
Lund (2002) made this point in explaining the difference between Big Brothers/Big
Sisters and a mentor based on his conversation with participants who served in both
capacities.
A Big Sister’s agenda is to be that: a warm, encouraging older friend, who is there to help, in ways the child wants and needs, including to offer academic help, though often it is a relaxed being together, maybe a trip downtown, or athletics. A mentor is someone who does not only want a kid to be a friend, but to look up to her, and want to take her advice, and learn from her, and follow her lead down various paths…A Big Sister is supportive; a mentor is a guide…mentoring is more ambitious…Mentor have got to lift eyes up, before kids will follow mentor’s lead. (Lund, 2002, p. 148)
The third important element in defining a mentoring relationship was that a mentor
should be someone the youth considered as such. Gordon (1993) contended that the
appropriate definition was the one held by an individual mentee and that if he or she
40
considered someone a mentor, that person was. The literature on mentoring frequently
examined the quality of relationships, and whether “primary” or “secondary”
relationships were established, whether effective or ineffective mentoring took place, and
whether relationships were sustained or not (Styles & Morrow, 1992). All mentoring
programs had their share of failures: youth who simply did not connect with the adult.
Summary of Literature
At-risk students pose many problems for society, for schools, and for themselves.
Those considered to be at risk failed in school and in society or were products of a poor,
minority, or urban background. These individuals were exposed to a variety of
environmental and educational experiences. American society and American schools, in
particular, were faced with the enormous task of helping these youth.
Mentoring is a phenomenon that has a long history, existing for thousands of
years. It worked in the form of empowerment and academic achievement, provided
intervention to the at-risk population, and was effective in its delivery and
implementation (Daloz, 2004). The outcome of this comparison of the two groups of
students, both from archival data and from post-program interpretation, can be extremely
beneficial in determining where future emphasis should be placed in guiding at-risk
youth. The goal was to modify behavior through modeling, guiding, and educating at-
risk youth to increase their capacity for academic achievement.
A review of the literature was provided in Chapter 2, including description of
the evolution of mentoring programs in public education and the historical success of
these programs. Chapter 3 contains a description of the methodology employed in the

41
study. A comprehensive description of the research findings is presented in Chapter 4.
Finally, Chapter 5 provides a summary of the findings, conclusions, and
recommendations for further research and improvement of practice.

42
CHAPTER 3
METHODOLOGY
The purpose of this study was to examine and evaluate the use of a novel
mentoring program for at-risk middle school-aged students. By using archival data from
the 2003-2004 and 2004-2005 school years, data were analyzed for student achievement.
Specific attention was given to students’ academic changes from 1 school year to the next
including grade-point average, daily attendance, and discipline referrals.
Although the majority of previous research studies have evaluated the
effectiveness of elementary and high school program for students partnered with mentors,
many questions of similar programs still exist for middle school children. This study
attempted to determine if partnering each at-risk student with a caring, supportive adult
would be beneficial for academic success. Using archival data, the variables used in the
study would be directly and indirectly linked in various ways to school achievement.
Because of the demonstrated importance of at-risk factors, such as socioeconomic status
or family composition, a purposeful selection (participants had to meet one of the
following criteria to be selected for the mentoring program students who failed one or
more school years, obtained 10 or more discipline referrals in one school year, and had
10 or more unexcused absences in one year) of students who characteristically
demonstrated at-risk behaviors was used in compiling the archival data. This chapter
includes information about the research design, the target population and sample,
instrumentation, procedures, and data analysis that will be used in the research project.
The LISTEN mentor program was developed to assist in reducing the academic
gap between at-risk students and average students in Northeast Tennessee and
43
implemented in 2003 at a Northeast Tennessee middle school. Results of this study
indicated that among the at-risk population, achievement levels were low, whereas
absenteeism, discipline referrals, and undesirable conduct were high (TN Department of
Education, 2004). During the period from 1995-2005, the ethnic mix in East Tennessee
altered so that the surrounding community went from serving 82% Caucasian students to
serving 69% Caucasian youth.
Using a variety of formats, mentorship programs were implemented throughout
the nation’s schools to attack the problems of at-risk students (TN Department of
Education, 2004). The LISTEN mentor program, although novel, was designed based on
such formats. When the program was initiated, the primary goal was to establish
relationships between identified at-risk students and professional educators. By placing
emphasis on study habits, interpersonal relationships, problem solving techniques, and
communication skills and by encouraging positive behaviors, mentors provided the
support and guidance needed for student success, according to the archival data.
It was presumed that mentor programs, such as LISTEN, would result in a
positive experience, not only for the mentee but also for the mentor. For the purposes of
this research, students’ grade-point averages, discipline referrals, and attendance rates
were examined during archival research collection. The archival data were analyzed at
the end of each 6-week grading periods and at the end-of-the-year. The analyses of such
periods provided information about the effectiveness of mentoring on school success.
Students’ grade-point averages, absenteeism rates, and discipline referrals were analyzed
seven times throughout the school year.
44
Populations and Samples
The study originally included 57 students for study participation, however, three
students transferred schools between the two school years. This left the study
participation to 54 students. Through quantitative analysis, 54 students at an East
Tennessee middle school participated in the LISTEN Mentor Program.
Research Questions
Through quantitative analysis, the grade-point average, discipline rate and
attendance of 54 students at an East Tennessee middle school who were involved in the
LISTEN mentor program were analyzed and compared using archival data from both the
2003-2004 and 2004-2005 school years. To complete the study of the success or failure
of this mentoring program, data were gathered and compared during the fall of 2005.
As part of the quantitative research, the following research questions were employed
as the focus of that investigation:
1. What changes from the 2003-2004 year, if any, did the 54 LISTEN students who
completed the 2004-2005 school year show in their grade-point averages for the
entire academic year?
2. What changes from the 2003-2004 year, if any, did the 54 LISTEN students who
completed the 2004-2005 school year show in their grade-point averages for each
of the 6-week grading periods?

45
3. What changes from the 2003-2004 year, if any, did the 54 LISTEN students who
completed the 2004-2005 school year show in their discipline referrals for the
entire academic year?
4. What changes from the 2003-2004 year, if any, did the 54 LISTEN students who
completed the 2004-2005 school year show in their discipline referrals for each of
the 6-week grading periods?
5. What changes from the 2003-2004 year, if any, did the 54 LISTEN students who
completed the 2004-2005 school year show in their school attendance for the
entire academic year?
6. What changes from the 2003-2004 year, if any, did the 54 LISTEN students who
completed the 2004-2005 school year show in their school attendance for each of
the 6-week grading periods?
Phases of the Study
Phase I: Comprehensive Review of Data
To conduct a successful descriptive analysis of frequencies, information from the
surveys was entered into Statistical Package of the Social Science (SPSS). Data analysis
was presented throughout the research study and can be found in its entirety in the
Appendices. The following types of quantitative data were gathered to measure
academic improvement and achievement gains: grade-point average, school attendance,
and discipline referrals. A baseline and follow-up measurements were taken for each
data type. Using the school system’s computer software, School Administration Student
Information (SASI), grade-point averages, attendance rates, and discipline referrals were
46
collected and analyzed. LISTEN mentor program targeted 54 students during the 2004-
2005 school year.
Phase II: Data Analysis
Data were compiled, organized, and reviewed for descriptive statistical analysis.
Careful attention was given to protect the confidentiality of participants included in the
research study.
General Null Hypotheses
For research purposes, this study observed possible discrepancies between an at-
risk group of students on the variables of academic achievement, attendance, and
discipline referrals for the duration of two school years based on archival data collected
during those years. The following null hypotheses were selected as the focus of the
investigation:
Ho1: There is no difference between the mean GPA of students in the pre-intervention
year (2003-2004) and the same students’ mean GPA in the intervention year (2004-
2005) for the entire year.
Ho1: 1-6. There is no difference between the mean GPA of the students in the pre-
intervention year (2003-2004) and the intervention year (2004-2005) for each of the 6-
week grading periods.
Ho2: There is no difference between the mean number of discipline referrals of students
in the pre-intervention year (2003-2004) and the same students’ mean number of
discipline referrals for the entire year.

47
Ho2: 1-6. There is no difference between the mean number of discipline referrals of
students in the pre-intervention year (2003-2004) and the same students’ mean number
of discipline referrals in the intervention year (2004-2005) for each of the 6-week
grading periods.
Ho3: There is no difference between the mean number of days absent of students in the
pre-intervention year (2003-2004) and the same students’ mean number of days absent
in the intervention year (2004-2005) for the entire year.
Ho3: 1-6. There is no difference between the mean number of days absent for students in
the pre-intervention year (2003-2004) and the same students’ mean number of days
absent in the intervention year for each of the 6-week grading periods.
Procedures
For purposes of this study, three measures of academic achievement were
analyzed to determine growth. The students’ grade-point averages reflected their
academic progress; the number of absences reflected the measurement of attendance; and
the number of discipline referrals reflected student conduct. These three areas of
measurement were collected at the conclusion of each of the 6-week grading period and
again at the ending of each school year. Grade-point averages, attendance, and student
discipline referrals were measured using data from the school district’s student
information database.
Using SASI, the school district’s computerized database, archival student grade-
point averages were obtained. Grade-point averages were calculated by adding the
students’ individual class grades and dividing by the total number of classes for a final
48
average. Grade points were assigned as follows: A=4; B=3; C=2; D=1; F=0. Student
progress and failure standards are often determined by students’ grade-point averages.
In addition to students’ grade-point average, SASI was used to analyze the
students’ archival attendance records by calculating the total days of student absences.
According to Turner (2000), students who attended school between 85% and 100 % of
the time passed standardized tests in reading and math at a much higher rate than students
who attended less than 85% of the time. Research such as Turner’s supports the strong
connection between attendance and student achievement. The students’ absences from
school were entered daily into the computerized data system, SASI. Counted attendance
was based on how many days a student was absent during the school year.
Student conduct was measured using discipline referrals. Using SASI, discipline
referral records were used to determine which students had discipline referrals and how
many discipline referrals those students were given throughout the course of a school
year.
Chapter Review
The purpose of the study was to examine the use of the LISTEN mentoring
program for at-risk students in a Northeast Tennessee middle school, using archival data.
Specific attention was given to academic differences from 1 school year to the next,
including grade-point average, daily attendance, and discipline referrals. The following
chapters examine and review the collected data and analyze the findings using the
computer program SPSS to improve practice and recommendations for further study.

49
CHAPTER 4
DATA ANALYSIS
This chapter presents the analysis of research data obtained from the 54 LISTEN
participants attending John Sevier Middle School in Kingsport City School System. The
students’ grade-point averages, daily absenteeism, and discipline referrals were
calculated at the end of each 6-week grading period for a period of 2 academic years, as
well at the ending of both school years.
Null Hypotheses
For the purposes of this study, the following null hypotheses were tested:
Ho1: There is no difference between the mean GPA of students in the pre-intervention
year (2003-2004) and the same students’ mean GPA in the intervention year (2004-
2005) for the entire year.
Ho1: 1-6. There is no difference between the mean GPA of the students in the pre-
intervention year (2003-2004) and the intervention year (2004-2005) for each of the 6-
week grading periods.
Ho2: There is no difference between the mean number of discipline referrals of students
in the pre-intervention year (2003-2004) and the same students’ mean number of
discipline referrals in the intervention year (2004-2005) for the entire year.
Ho2: 1-6. There is no difference between the mean number of discipline referrals of
students in the pre-intervention year (2003-2004) and the same students’ mean number

50
of discipline referrals in the intervention year (2004-2005) for each of the 6-week
grading periods.
Ho3: There is no difference between the mean number of days absent of students in the
pre-intervention year (2003-2004) and the same students’ mean number of days absent
in the intervention year (2004-2005) for the entire year.
Ho3: 1-6. There is no difference between the mean number of days absent for students in
the pre-intervention year (2003-2004) and the same students’ mean number of days
absent in the intervention year for each of the 6-week grading periods
Research Design
For the purposes of this study, one group of students was used to examine the
effects of mentoring in middle school. The study examined the students’ academic
performance during the 2003-2004 school year and compared the same students’
performances during the 2004-2005 school year. Data were collected and compared for
the year and at the end of each 6-week grading period. The initial group was consisted of
57 students eligible for the LISTEN mentoring program in 2003-2004. Three students
transferred to other schools; therefore, the study group consisted of the remaining 54
students. As illustrated in Figures 1 and 2 below, the study population included 64%
male and 36% female in each group. The breakdown of the grade levels was as follows:
21% 6th grade; 42% seventh grade; and 37% eighth grade.
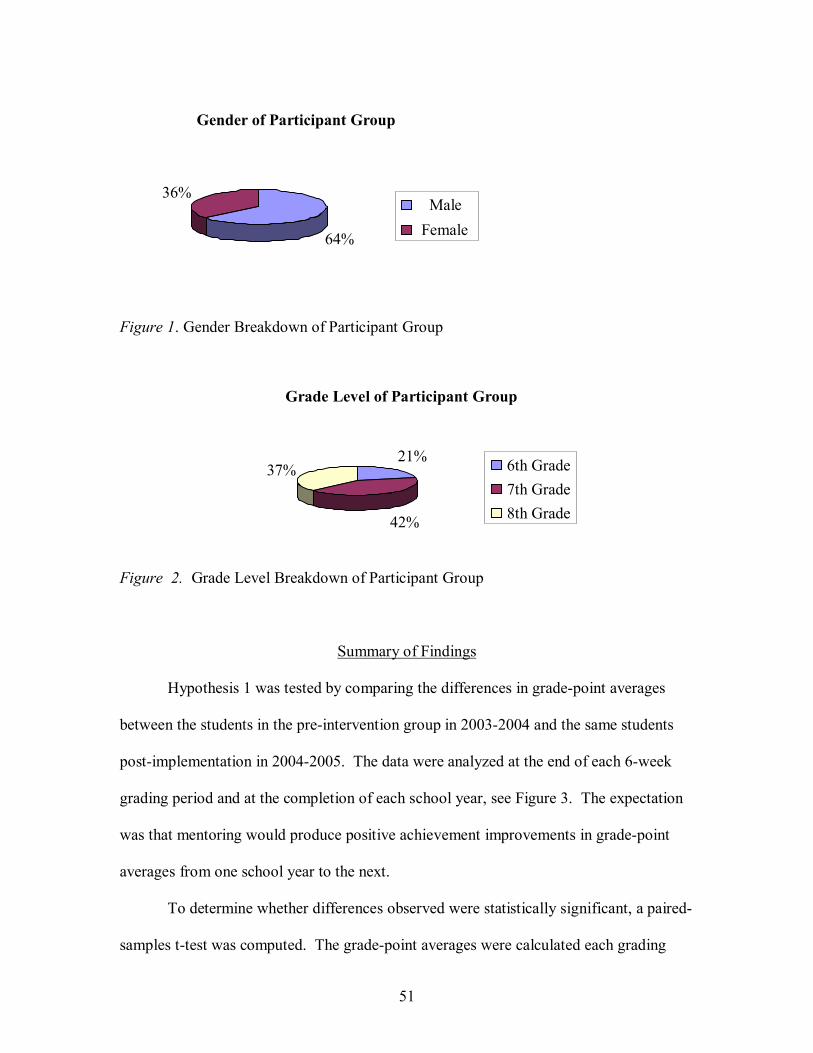
51
Figure 1. Gender Breakdown of Participant Group
Figure 2. Grade Level Breakdown of Participant Group
Summary of Findings
Hypothesis 1 was tested by comparing the differences in grade-point averages
between the students in the pre-intervention group in 2003-2004 and the same students
post-implementation in 2004-2005. The data were analyzed at the end of each 6-week
grading period and at the completion of each school year, see Figure 3. The expectation
was that mentoring would produce positive achievement improvements in grade-point
averages from one school year to the next.
To determine whether differences observed were statistically significant, a paired-
samples t-test was computed. The grade-point averages were calculated each grading
Gender of Participant Group
36%
64%
Male Female
Grade Level of Participant Group
21%
42%
37% 6th Grade7th Grade8th Grade

52
period during the school year. The participants’ grade-point averages in the 2004-2005
school were compared to their grades from the 2003-2004 school year. Appendix B
presents the grade-point averages of LISTEN participants.
Results of the t-test revealed that the mean grade-point average for the end-of-
year report for 2004-2005 (M = 2.12, SD = 2.83) was significantly greater than the mean
grade-point averages in 2003-2004 (M = 1.42, SD = 2.62), t(53) = 2.28, p < .01, Table 1.
There was a moderate standardized effect size index (η2 = .57). The 95% confidence
interval for the mean difference between the 2 ratings was 1.87 to 2.94. Fifty-one of the
54 students improved their grades from 2003-2004 to 2004-2005 school year. Ho1 was
rejected for the academic year.
Results of the t-test revealed that the mean grade-point average for the first 6-
week period of 2004-2005 (M = 1.13, SD = 1.83) was not significantly greater than the
mean grade-point averages in first 6-week 2003-2004 (M = 1.10, SD = 1.21), t(53) = .08,
p =1.01. Although no statistically significant difference was found in the participants’
grade-point averages, 26 of the 54 students improved their grades from 2003-2004 to
2004-2005 school year during the first 6-week grading period. Ho1:1 was retained for the
first 6-week grading period.
Results of the t-test revealed that the mean grade-point average for the second 6-
week period of 2004-2005 (M = 1.34, SD = 1.93) was significantly greater than the mean
grade-point averages in second 6-week 2003-2004 (M = 1.15, SD = 1.25), t(53) = 2.32, p
< .01. There was a high standardized effect size index (η2 = .83). The 95% confidence
interval for the mean grade-point average between the 2 years was .32 and 2.41. Forty-
four participants improved their grades from the 2003-2004 to the 2004-2005 school year

53
during the second 6-week grading period. Ho1:2was rejected for the second 6-week
grading period.
Results of the t-test revealed that the mean grade-point average for the third 6-
week period of 2004-2005 (M = 1.55, SD = 1.32) was significantly greater than the mean
grade-point averages in third 6-week 2003-2004 (M = 1.11, SD = 1.30), t(53) = 2.44, p <
.01. There was a high standardized effect size index (η2= .79). The 95% confidence
interval for the mean difference between the 2 school years was .76 to 1.13.
Improvement occurred with 47 of the 54 students from 2003-2004 to 2004-2005 school
year during the third 6-week grading period. Ho1:3 was rejected for the third 6-week
grading period.
Results of the t-test revealed that the mean grade-point average for the fourth 6-
week period of 2004-2005 (M = 1.18, SD = 1.39) was significantly greater than the mean
grade-point averages in fourth 6-week 2003-2004 (M = 1.09, SD = 1.87), t(53) = 2.98, p
< .01. There was a medium standardized effect size index (η2 .64). The 95% confidence
interval for the mean difference between the 2 years was .57 and 2.75. Forty-eight of the
participants improved their grades from 2003-2004 to 2004-2005 school year during the
fourth 6-week grading period. Ho1:4 was rejected for the fourth 6-week grading period.
Results of the t-test revealed that the mean grade-point average for the fifth 6-
week period of 2004-2005 (M = 2.08, SD = 2.44) was significantly greater than the mean
grade-point averages in fifth 6-week 2003-2004 (M = 1.87, SD = 2.32), t(53) = 3.01, p <
.01. There was a medium standardized effect size index (η2= .61). The 95% confidence
interval for the mean difference between the 2 years was .85 and 2.02. Most of the
students, 51 of the 54, improved their grades from the 2003-2004 to the 2004-2005

54
school year during the fifth 6-week grading period. Ho1:5 was rejected for the fifth 6-
week grading period.
Results of the t-test revealed that the mean grade-point average for the sixth 6-
week period of 2004-2005 (M = 2.54, SD = 1.67) was significantly greater than the mean
grade-point averages in sixth 6-week 2003-2004 (M = 1.62, SD = 1.98), t(53) = 2.98, p <
.07. There was a low standardized effect size index (η2 = .32). The 95% confidence
interval for the mean difference between the 2 ratings was .98 to 2.46. An impressive 53
of the 54 students improved their grades from the 2003-2004 to the 2004-2005 school
year during the final grading period. Ho1:6 was rejected for the sixth 6-week grading
period.
Figure 3. Means of participants’ grade-point averages.
Hypothesis 2 tested the differences in discipline referrals of the 54 students in the
pre-intervention group in 2003-2004 and the same students’ post-implementation in
2004-2005, see Figure 4. To determine whether differences observed were statistically
significant, a paired-samples t-test was computed. The discipline referrals were tallied
each grading period during the school year. The participants’ discipline referrals in the
0.00.51.01.52.02.53.0
1 2 3 4 5 6
6-Week Grading Period
GPA 2004
2005

55
2004-2005 school were compared to their discipline from the 2003-2004 school year.
Appendix C presents the discipline referrals of LISTEN participants.
Results of the t-test revealed that the mean discipline referrals for the end-of-year
report for 2004-2005 (M = 19.35, SD = 11.83) was significantly lower than the mean
discipline referrals in 2003-2004 (M = 35.09, SD = 19.99), t(53) = 7.32, p < .01, Table 1.
There was a low standardized effect size index (η2 = .21). The 95% confidence interval
for the mean difference between the two ratings was 11.43 to 20.05. Most of the
participants, 51 of the 54 students, had fewer discipline referrals from the 2003-2004 to
the 2004-2005 school year. Ho2 was rejected for the entire academic year.
Results of the t-test revealed that the mean discipline referrals for the first 6 week
period of 2004-2005 (M = 3.81, SD = 2.83) was significantly different from the mean
discipline referrals in first 6 week 2004-2005 (M = 5.11, SD = 3.81), t(53) = 2.25, p < .01.
The 95% confidence interval for the mean difference between the two years was .14 to
2.45. There was a high standardized effect size index (η2 = .97). While no statistical
significant difference was found in the participants’ discipline referrals, 31 of the 54
students had fewer discipline infractions from 2003-2004 to 2004-2005 school year
during the first 6-week grading period. Ho2:1 was retained for the first 6-week grading
period.
Results of the t-test revealed that the mean discipline referrals for the second 6-
week period of 2004-2005 (M = 3.22, SD = 3.10) was significantly lower than the mean
discipline referrals in second 6-week 2003-2004 (M = 4.54, SD = 3.72), t(53) = 2.72, p <
.01. The 95% confidence interval for the mean difference between the two years was .35
to 2.28. There was a high standardized effect size index (η2 = .82). Forty-five students

56
had fewer discipline infractions from 2003-2004 to 2004-2005 school year during the
second 6-week grading period. Ho2:2 was rejected for the second 6-week grading period.
Results of the t-test revealed that the mean discipline referrals for the third 6-
week period 2004-2005 (M = 4.70, SD = 4.19) was significantly lower than the mean
discipline referrals in third 6-week 2003-2004 (M = 6.65, SD = 4.50), t(53) = 2.93, p <
.01. There was a moderately high standardized effect size index (η2= .75). The 95%
confidence interval for the mean difference between the two years was .35 to 2.28.
Forty-six of the 54 students had fewer discipline infractions from the 2003-2004 to the
2004-2005 school year during the third 6-week grading period. Ho2:3 was rejected for the
third 6-week grading period.
Results of the t-test revealed that the mean discipline referrals for the fourth 6-
week 2004-2005 (M = 4.57, SD = 3.70) was significantly lower than the mean discipline
referrals in fourth 6-week 2003-2004 (M = 5.94, SD = 3.85), t(53) = 2.50, p < .01. There
was a medium standardized effect size index (η2 = .69). The 95% confidence interval for
the mean difference between the two years was .27 to 2.47. Many of the participants, 44,
had fewer discipline infractions from 2003-2004 to 2004-2005 school year during the
fourth 6-week grading period. Ho2:4 was rejected for the fourth 6-week grading period.
Results of the t-test revealed that the mean discipline referrals for the fifth 6-week
period of 2004-2005 (M = 3.63, SD = 3.58) was significantly lower than the mean
discipline referrals in fifth 6-week 2003-2004 (M = 6.24, SD = 6.29), t(53) = 2.59, p <
.01. There was a moderate standardized effect size index (η2 = .51). The 95%
confidence interval for the mean difference between the two ratings was .59 to 4.64. A
statistical significant difference was found in the participants’ discipline referrals, 50 of
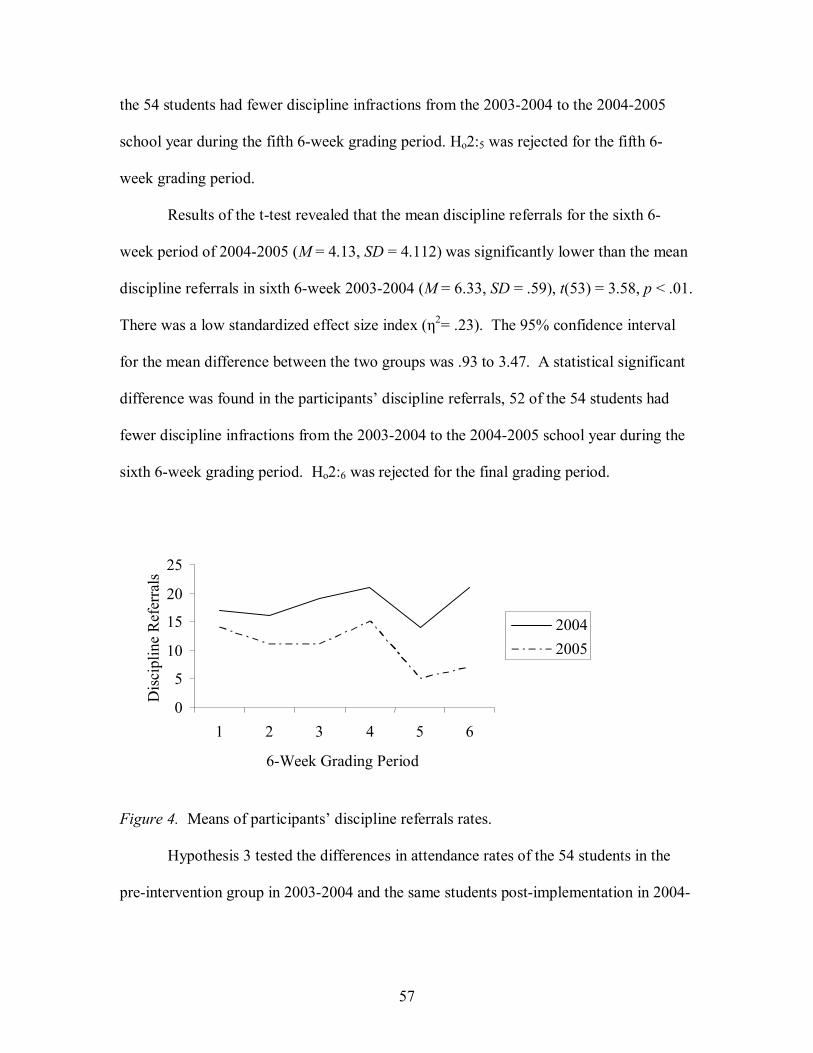
57
the 54 students had fewer discipline infractions from the 2003-2004 to the 2004-2005
school year during the fifth 6-week grading period. Ho2:5 was rejected for the fifth 6-
week grading period.
Results of the t-test revealed that the mean discipline referrals for the sixth 6-
week period of 2004-2005 (M = 4.13, SD = 4.112) was significantly lower than the mean
discipline referrals in sixth 6-week 2003-2004 (M = 6.33, SD = .59), t(53) = 3.58, p < .01.
There was a low standardized effect size index (η2= .23). The 95% confidence interval
for the mean difference between the two groups was .93 to 3.47. A statistical significant
difference was found in the participants’ discipline referrals, 52 of the 54 students had
fewer discipline infractions from the 2003-2004 to the 2004-2005 school year during the
sixth 6-week grading period. Ho2:6 was rejected for the final grading period.
Figure 4. Means of participants’ discipline referrals rates.
Hypothesis 3 tested the differences in attendance rates of the 54 students in the
pre-intervention group in 2003-2004 and the same students post-implementation in 2004-
0
5
10
15
20
25
1 2 3 4 5 6
6-Week Grading Period
Dis
cipl
ine
Ref
erra
ls
20042005

58
2005, see Figure 5. The expectation was that mentoring would decrease absences in
participants from one school year to the next.
To determine whether differences observed were statistically significant, a paired-
samples t-test was computed. The absenteeism records for students were tallied each
grading period during the school year. The participants’ attendance in the 2004-2005
school year were compared to their attendance from the 2003-2004 school year.
Appendix D presents the discipline referrals of LISTEN participants.
Results of the t-test revealed that the mean days absent for the end-of-year for
2004-2005 (M = 26.83, SD = 15.07) was significantly lower than the mean days absent in
2003-2004 (M = 37.20, SD = 17.98), t(53) = 5.49, p < .01, Table 1. There was a
moderate standardized effect size index (η2 = .68). The 95% confidence interval for the
mean difference between two years was 6.54 to 14.21. A significant 52 of the 54
students improved their attendance from 2003-2004 to 2004-2005 school year. Ho3 was
rejected for the academic school year.
Results of the t-test revealed that the mean days absent for the first 6-week 2004-
2005 (M = 5.69, SD = 4.91) was significantly different from the mean days absent in the
first 6-week 2003-2004 (M = 6.85, SD = 3.91), t(53) = 2.06, p < .01. There was a high
standardized effect size index (η2=.98). The 95% confidence interval for the mean
difference between two years was .03 to 2.31. A statistical significant difference was
found in the participants’ mean days absent, 19 of the 54 students had fewer absences in
the 2004-2005 to than in the 2003-2004 school year during the first 6-week grading
period. Ho3:1 was rejected for the first 6-week grading period.

59
Results of the t-test revealed that the mean days absent for the second 6-week
2004-2005 (M = 4.70, SD = 4.19) was significantly greater than the mean days absent in
the second 6-week 2003-2004 (M = 6.65, SD = 4.49), t(53) = 2.93, p < .01. There was a
high standardized effect size index (η2= .83). The 95% confidence interval for the mean
difference between two years was .61 to 3.28. Twenty-seven of the 54 students had
fewer absences in the 2004-2005 school year than in the 2003-2004 school year during
the second 6-week grading period. Ho3:2 was rejected for the second 6-week grading
period.
Results of the t-test revealed that the mean days absent for the third 6-week 2004-
2005 (M = 4.59, SD = 4.97) was not significantly greater than the mean days absent in the
third 6-week 2003-2004 (M = 5.46, SD = 2.88), t(53) = 1.62, p =.11. The 95%
confidence interval for the mean difference between two years was -.23 to 2.16. Many
of the participants, 34 had fewer absences from 2004-2005 to 2003-2004 school year
during the third 6-week grading period. Ho3:3 was rejected for the third 6-week grading
period.
Results of the t-test revealed that the mean days absent for the fourth 6-week
2004-2005 (M = 4.57, SD = 3.70) was significantly greater than the mean days absent in
the fourth 6-week 2003-2004 (M =5.94, SD = 3.85), t(53) = 2.50, p < .01. There was a
medium standardized effect size index (η2 = .68). The 95% confidence interval for the
mean difference between 2 years was .27 to 2.47. Fewer absences occurred in 34 of the
54 students from 2003-2004 to 2004-2005 school year during the fourth 6-week grading
period. Ho3:4 was rejected for the fourth 6-week grading period.
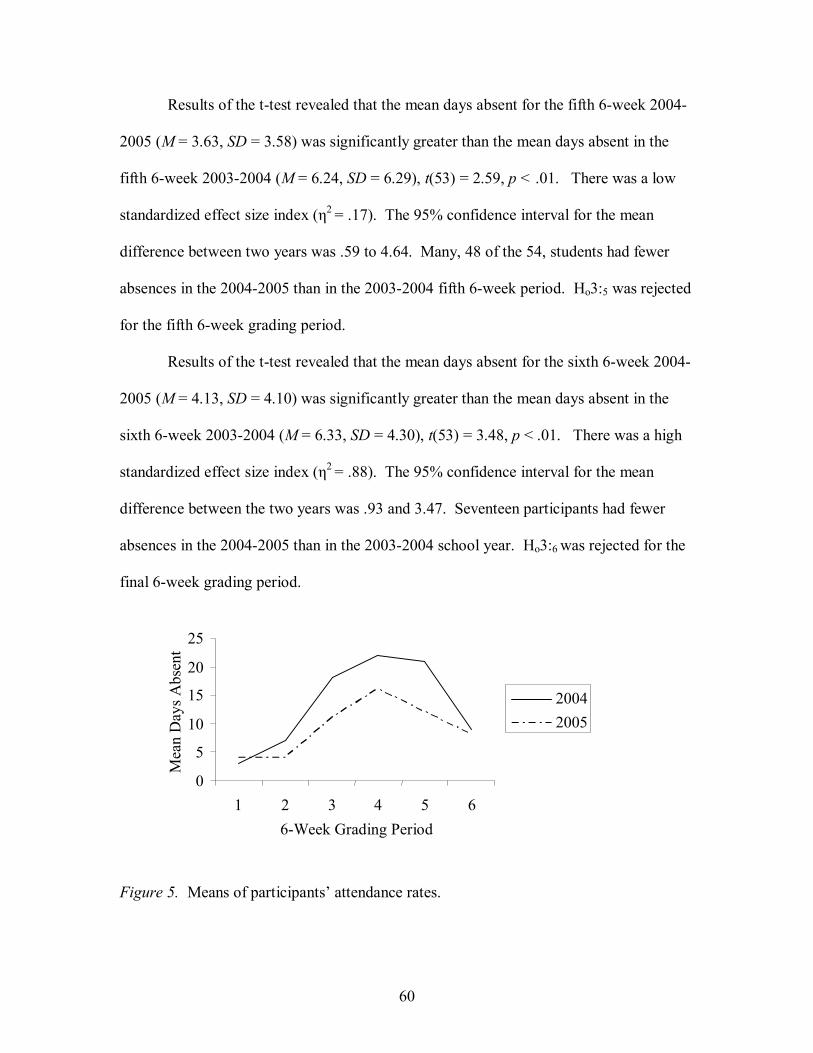
60
Results of the t-test revealed that the mean days absent for the fifth 6-week 2004-
2005 (M = 3.63, SD = 3.58) was significantly greater than the mean days absent in the
fifth 6-week 2003-2004 (M = 6.24, SD = 6.29), t(53) = 2.59, p < .01. There was a low
standardized effect size index (η2 = .17). The 95% confidence interval for the mean
difference between two years was .59 to 4.64. Many, 48 of the 54, students had fewer
absences in the 2004-2005 than in the 2003-2004 fifth 6-week period. Ho3:5 was rejected
for the fifth 6-week grading period.
Results of the t-test revealed that the mean days absent for the sixth 6-week 2004-
2005 (M = 4.13, SD = 4.10) was significantly greater than the mean days absent in the
sixth 6-week 2003-2004 (M = 6.33, SD = 4.30), t(53) = 3.48, p < .01. There was a high
standardized effect size index (η2 = .88). The 95% confidence interval for the mean
difference between the two years was .93 and 3.47. Seventeen participants had fewer
absences in the 2004-2005 than in the 2003-2004 school year. Ho3:6 was rejected for the
final 6-week grading period.
Figure 5. Means of participants’ attendance rates.
0
5
10
15
20
25
1 2 3 4 5 66-Week Grading Period
Mea
n D
ays A
bsen
t
20042005

61
Table 1 summarized the data analysis of each of the 3 areas in which the study
examined academic growth from 1 school year to the next.
Table 1
End-of-the-Year Participant Data Summary
Academic Achievement n Mean SD 2003-2004 GPA* 54 1.42 2.62 2004-2005 GPA** 54 2.12 2.83 2003-2004 Discipline 54 35.09 19.99 2004-2005 Discipline 54 19.35 11.83 2003-2004 Attendance 54 37.20 17.98 2004-2005 Attendance 54 26.83 15.07 ______ * In each case 2003-2004 was the pre-LISTEN year. ** In each case 2004-2005 was the LISTEN school year.
Summary
A statistical significant difference was found in the participants’ academic
performance between the pre-LISTEN year (2003-2004) and the LISTEN year (2004-
2005). Participants had significant gains during the second, third, fourth, fifth, and sixth
6-week grading period in grade-point average. Students had significantly lower
discipline referrals during all 6-week grading periods. Participants had significantly
fewer absences during the first, second, fourth, fifth, and sixth 6-week grading periods.
Participants experienced significant gains at the end-of-year data collection in all areas.
Fifty-one of the 54 students improved their grade-point average; 50 of the 54 students
improved their discipline records; and attendance was improved in 52 of the 54

62
participants. The LISTEN mentor program seemed to have a significant positive impact
in all three areas.
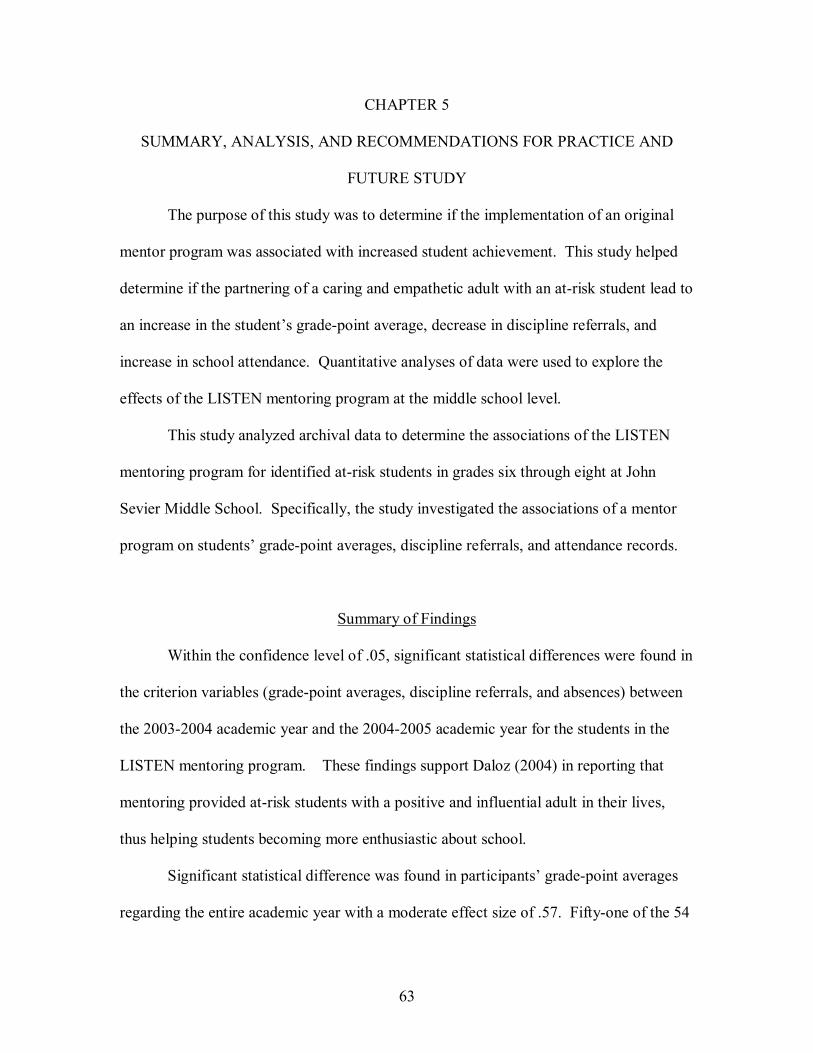
63
CHAPTER 5
SUMMARY, ANALYSIS, AND RECOMMENDATIONS FOR PRACTICE AND
FUTURE STUDY
The purpose of this study was to determine if the implementation of an original
mentor program was associated with increased student achievement. This study helped
determine if the partnering of a caring and empathetic adult with an at-risk student lead to
an increase in the student’s grade-point average, decrease in discipline referrals, and
increase in school attendance. Quantitative analyses of data were used to explore the
effects of the LISTEN mentoring program at the middle school level.
This study analyzed archival data to determine the associations of the LISTEN
mentoring program for identified at-risk students in grades six through eight at John
Sevier Middle School. Specifically, the study investigated the associations of a mentor
program on students’ grade-point averages, discipline referrals, and attendance records.
Summary of Findings
Within the confidence level of .05, significant statistical differences were found in
the criterion variables (grade-point averages, discipline referrals, and absences) between
the 2003-2004 academic year and the 2004-2005 academic year for the students in the
LISTEN mentoring program. These findings support Daloz (2004) in reporting that
mentoring provided at-risk students with a positive and influential adult in their lives,
thus helping students becoming more enthusiastic about school.
Significant statistical difference was found in participants’ grade-point averages
regarding the entire academic year with a moderate effect size of .57. Fifty-one of the 54
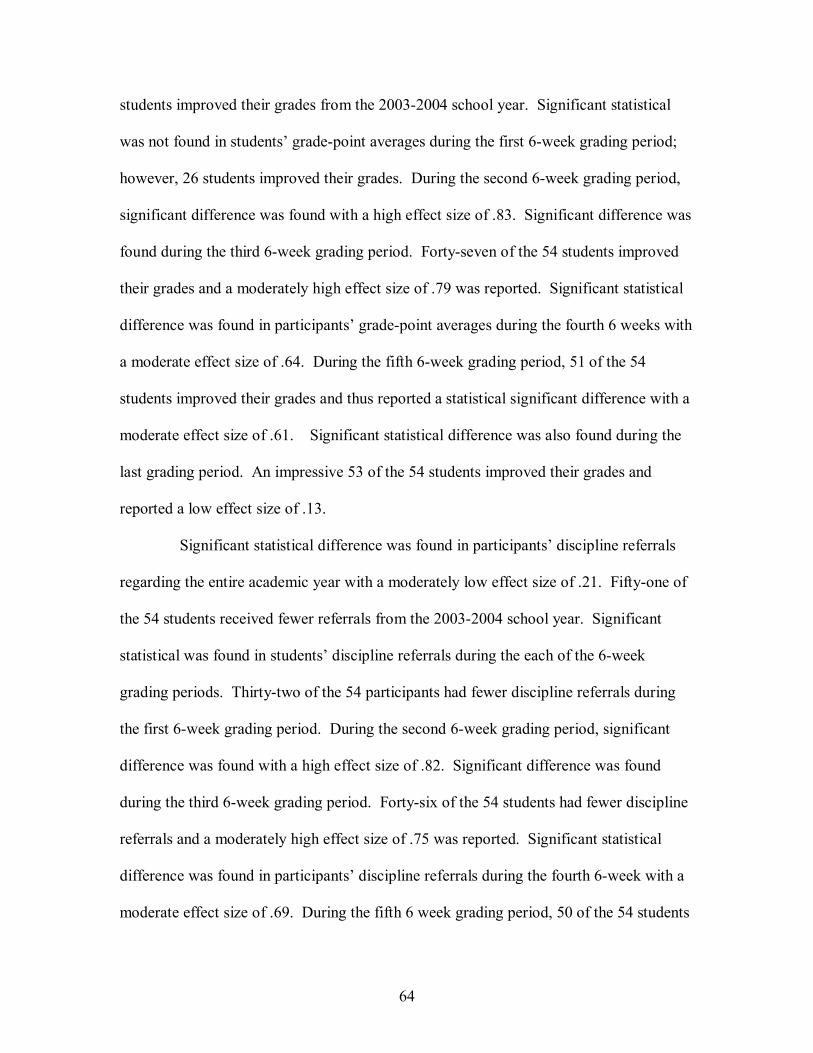
64
students improved their grades from the 2003-2004 school year. Significant statistical
was not found in students’ grade-point averages during the first 6-week grading period;
however, 26 students improved their grades. During the second 6-week grading period,
significant difference was found with a high effect size of .83. Significant difference was
found during the third 6-week grading period. Forty-seven of the 54 students improved
their grades and a moderately high effect size of .79 was reported. Significant statistical
difference was found in participants’ grade-point averages during the fourth 6 weeks with
a moderate effect size of .64. During the fifth 6-week grading period, 51 of the 54
students improved their grades and thus reported a statistical significant difference with a
moderate effect size of .61. Significant statistical difference was also found during the
last grading period. An impressive 53 of the 54 students improved their grades and
reported a low effect size of .13.
Significant statistical difference was found in participants’ discipline referrals
regarding the entire academic year with a moderately low effect size of .21. Fifty-one of
the 54 students received fewer referrals from the 2003-2004 school year. Significant
statistical was found in students’ discipline referrals during the each of the 6-week
grading periods. Thirty-two of the 54 participants had fewer discipline referrals during
the first 6-week grading period. During the second 6-week grading period, significant
difference was found with a high effect size of .82. Significant difference was found
during the third 6-week grading period. Forty-six of the 54 students had fewer discipline
referrals and a moderately high effect size of .75 was reported. Significant statistical
difference was found in participants’ discipline referrals during the fourth 6-week with a
moderate effect size of .69. During the fifth 6 week grading period, 50 of the 54 students
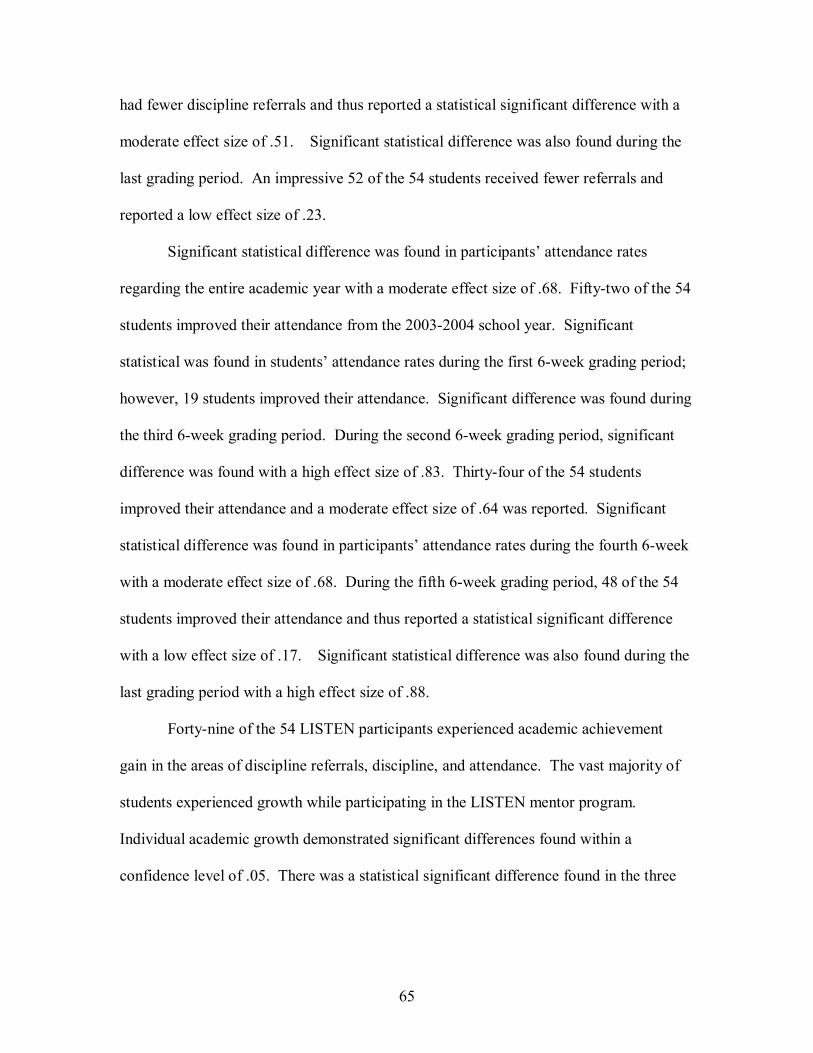
65
had fewer discipline referrals and thus reported a statistical significant difference with a
moderate effect size of .51. Significant statistical difference was also found during the
last grading period. An impressive 52 of the 54 students received fewer referrals and
reported a low effect size of .23.
Significant statistical difference was found in participants’ attendance rates
regarding the entire academic year with a moderate effect size of .68. Fifty-two of the 54
students improved their attendance from the 2003-2004 school year. Significant
statistical was found in students’ attendance rates during the first 6-week grading period;
however, 19 students improved their attendance. Significant difference was found during
the third 6-week grading period. During the second 6-week grading period, significant
difference was found with a high effect size of .83. Thirty-four of the 54 students
improved their attendance and a moderate effect size of .64 was reported. Significant
statistical difference was found in participants’ attendance rates during the fourth 6-week
with a moderate effect size of .68. During the fifth 6-week grading period, 48 of the 54
students improved their attendance and thus reported a statistical significant difference
with a low effect size of .17. Significant statistical difference was also found during the
last grading period with a high effect size of .88.
Forty-nine of the 54 LISTEN participants experienced academic achievement
gain in the areas of discipline referrals, discipline, and attendance. The vast majority of
students experienced growth while participating in the LISTEN mentor program.
Individual academic growth demonstrated significant differences found within a
confidence level of .05. There was a statistical significant difference found in the three

66
variables (grade-point average, discipline referrals, attendance rates) of the LISTEN
Mentor Program.
Using a paired samples t-test, Ho1, Ho2, and Ho3 were rejected. Ho1:2, Ho1:3,
Ho1:4, Ho1:5, Ho1:6, Ho2:1, Ho2:2, Ho2:3, Ho2:4, Ho2:5, Ho2:6, Ho3:1, Ho3:2, Ho3:4, Ho3:5, Ho3: 6
were rejected. Ho1:1 and Ho3:3 were retained.
Analysis
A significant amount of writing related to at-risk students and mentor program
was revealed in the Review of the Literature. Mentoring, in definition, was not a novel
strategy in working with at-risk youth. Although little research had been done to assist
schools with helping at-risk students succeed academically, mentoring had become much
more popular (Johnson & Sullivan, 1995). With significant difference found in all three
areas (grade-point average, discipline, and attendance) for the entire academic year, the
LISTEN mentor program seemed to have a significant impact on student achievement
and academic success.
According to Riley (1998), effective mentoring programs had steered teenagers
away from trouble, gave extra encouragement to students, and provided a role model for
more positive types of behaviors. Riley found that students who had mentors, such as
Big Brothers/Big Sisters, had increased their discipline referrals by .37 points. Riley also
reported that students attendance rates increased by 5%. Significant differences were
reported with grade-point average, discipline, and attendance; thus the LISTEN mentor
program provided the positive support system for at-risk students. Students’ grade-point

67
averages were statistically significant with a moderate effect size of .57 and a moderate
effect size of .68 for students’ mean days of absences in this study.
Mentoring was often viewed as a beneficial and cost-effective approach to
assisting a targeted number of students. According to Becker (2004), President George
Bush, Senior stated in 1989 that mentoring was one of the best ways to help those youth
at-risk. Previous research supported and encouraged the development of mentor
programs for at-risk students. With a significant difference found in grade-point average,
discipline, and attendance in regards to the entire academic year, the research obtained in
this study supported recent documented research.
As a means of sharing real-life experiences and knowledge, mentoring was
popular in both the business and education fields. The most common characteristic of a
mentoring program was the one-on-one relationship between an older and a younger
person. According to Lund (2002), the purpose of this relationship was to provide
guidance, pass on knowledge, share experience, provide a background for more sound
judgment, and establish friendship. Based on the findings of this study, it was
determined that a mentor relationship with a caring adult produced a significant impact
on a child’s success in school. Using the findings of this study, statistical significance
found in all three variables regarding the school year as a whole, school principals may
better engage at-risk students in a more appropriate, positive learning opportunities.
Schools throughout the nation are engaged in programs that use adults from the community to help at-risk youth make steady progress through the middle and thirdary grades and complete high school. 2 general approaches, mentoring and advocacy are widely used as promising mechanisms to provide sustained goal-directed support for students. (McPartland & Nettles, 1991, p. 175.)

68
Mentors, for the purposes of this study, were classroom teachers, school
counselors, administrators, custodians, librarians, teaching assistants, retired
teachers, and cafeteria employees. Research indicated that a positive, caring adult
could offer an at-risk student substantial emotional, material, and instructional
support that would supplement the many needs not met by the student’s family or
through traditional education (McPartland & Nettles, 1991). “Mentoring is often
a delicate balancing act between 2 people from different worlds and a few of these
match-ups work out very well” (Lund, 2002, p. 251).
Conclusion
It is no secret that school leaders perceive an ever-growing population of students
who are at risk of dropping out of school due to a variety of behavioral, environmental,
cultural, social-economical, and attitudinal issues. Increasingly popular interventions for
these at-risk students have become school-based mentoring programs. A wide-range of
mentoring programs have been implemented and created to support the identified group
of students needing additional assistance. The school-based support provided by the
LISTEN mentor program gives at-risk students a positive role model to whom they can
turn for advice and direction. There are many factors that help, or hinder, the success of
any mentor program including, but not limited to, mentor recruitment and training,
collaboration with the instructional staff, the ratio of mentors to mentees, the structure of
the mentor program, the curriculum of the program, accurate assessment of the program’s
effect on students, communication between all participants, and collaboration with other

69
school-based efforts to help at-risk students. Effective mentoring has much to offer at-
risk adolescents.
While analysis of future impact of the LISTEN mentor program has not been
determined, many studies have indicated that programs such as this mentor program
benefited not only students and school in that they attended, but also the local economy.
According to Slavin & Madden (2004), a student who attended school regularly, had
experienced academic success, and did not get into trouble, behaviorally, probably would
not drop out of school. Although various means were used, the rate of high school
completion was the most commonly cited indicator for academic achievement (Magdol,
2004). Magdol also reported that the unemployment rates for high school dropouts were
much higher than those for high school graduates. Hunt and Holt (2003) conveyed that
the average earnings for high school dropouts were significantly lower than those of
students who completed high school. Individuals who completed high school made an
average income in 2001 of $19,560; whereas, those who dropped out of school had an
average income of only $12,349. The welfare dependency rates and criminal behavior
incidences of dropouts were much higher than those of high school graduates, as well
(Hunt & Holt). Thus, the graduation rate directly affected the economy, poverty, and
crime rates in the country.
Research indicated that students achieved better grades, established obtainable
goals and aspirations, and enhanced their self-esteem when partnered with caring,
supportive adults. According to Lee (2001), students who had mentoring figures in their
lives were able to achieve their goals at more successful rates and complete high school
at 16% higher rates than those at-risk students without mentors.
70
Recommendations for Improving Practice and Future Studies
Upon completion of this study, the findings indicated that further research on
mentoring be undertaken. The literature contained many testimonials on the merits of
mentoring and recommended its many benefits. However, much of that research was
inconclusive and findings were often linked to environmental diversity. Experimental
research in the field of mentoring was scarce and required further investigation. The
effects of mentoring at-risk students had much to be discovered and examined. The
severity of offenses, although not considered in this project, might present a topic for
further study.
While previous research supported the implementation of mentor program, further
research was suggested to examine the quality relationship between the mentor and
student. To better understand the outcome of this research project, future research could
be undertaken on the teachers’ preparation prior to their role as mentors. According to
feedback provided by the mentors in this study, further training and resources need to be
made available. An important drawback of this research project was that the study group
was limited to a small number of participants. It would important for future research to
include a larger, less homogenous population.
Because of the determination that 49 of the 54 participants achieved academic
achievement in areas of discipline referrals, discipline, and attendance, the question of
mentor effectiveness was raised. There might be a relationship between the success of
mentor relationships and the benefits of mentoring. Participants partnered with an
inappropriate or unqualified mentor might not benefit from the implementation of a
mentoring program. It is recommended that further research be completed to understand
71
the preparation of mentors and their ability to build rapport with the student with whom
they work.
While this study carefully analyzed the behaviors exhibited in the literature as
successful for mentors, questions remained about what facilitated successful mentoring,
for example: 1) was time a factor; 2)were certain criteria for selecting mentors critical to
the process; 3) were certain processes used by mentors more important than others; 4)
were some strategies more effective for mentors to use to work best with their student;
and 5) was there a specific model that would insure greater success for the mentoring
process.
Future studies should include a more thorough investigation concerning the
quality of the implementation of a mentor program. Site visits and training among
schools that were identified as implementing or partially implementing mentor programs
could further determine what attributes of mentoring were being used by mentors most
frequently with reported success. Studies could be conducted to determine if the most
successful implementation strategies could also be found in non-implementing schools.
Subsequently, there could be an investigation to determine if a relationship existed
between the implementation of particular strategies and students’ attitudes toward school.
Further investigation concerning the possible association between implementing
mentor program and academic achievement in various subject areas should be conducted
employing the following questions:
1. Did the implementation of a mentor program change at-risk students’ behavior in a
positive manner? To what ex10t was this behavior changed?

72
2. What practices within the LISTEN mentor program were most advantageous to at-
risk students and what were the least beneficial to those students?
3. How could the structure of the LISTEN mentor program be modified to give at-risk
students the greatest possible support? Was there a student-to-mentor ratio or a
minimum number of contact minutes between student-and-mentor that provided at-
risk students with the needed support?
73
REFERENCES
Aarkin, M., & Shollar, B. (2002). The tutor book. New York: Longman. Alkin, M., & Ellet, F. (2004). Evaluation models: International encyclopedia of
education. New York: Pergamon Press. Ascher, C. (1998). The mentoring of disadvantaged youth. New York: ERIC
Clearinghouse on Urban Education. Becker, J. (2004). Mentoring high-risk kids. Minneapolis, MN: Johnson Institute-
QVS. Bein, A. (1999). School social worker involvement in mentoring programs. School
Social Work in Education, 2, 413-420. Bennett, C. (2003). A case study of a high school advisor/mentoring program.
Unpublished doctoral dissertation, Illinois State University, Normal, IL. Bernard, B. (2005). Mentoring programs for urban youth: Handle with care.
Portland, OR: Western Regional Center for Drug-Free Schools and Communities. Blumenfeld, S. (2003). How to tutor. New Rochelle, NY: Arlington House. Boyer, E. (1987). Early schooling and the nation’s future. Educational Leadership,
44, 4-6. Brzoska, T., Jones, J., McHaffy, J., Millar, K., & Mychals, J. (1997). Mentor
handbook. Minneapolis, MN: Johnson Institute QVS.
Carter, L. (2004). The sustaining effects study of compensatory and elementary education. Educational Researcher, 13(7), 4-13.
Cavazos, L. (1999). Special report: Building bridges for at-risk children, Principal,
5, 6-10. Chrisco, L. (1998). Peer assistance works. Educational Leadership, 46(8), 31-34. Clasen, J., & Clasen, J. (1997). Is mentoring necessary? Training and Development
Journal, 39(4), 36-39. Coles, R. (2003). The call of service: A witness to idealism. New York:
Houghton Mifflin.
74
Committee of Economic Development. Research and Policy Committee (1999). Children in need. New York: Harcourt.
Coppock, M. (2005). Mentoring at-risk Hispanic students in self-esteem, academic
growth, and citizenship. Equity and Excellence in Education, 28, 19-23. Daloz, H. (2004). Why mentoring works. New York: Houghton Mifflin. Flaxman, E. (Ed.) (1998). Youth mentoring: Programs and practices. Urban
Diversity Series No. 97, Columbia University. ERIC Clearinghouse on Urban Education, New York.
Floyd, N. (Ed.). (2003). Mentoring, educational research guide, Number 7.
Washington, DC: Office of Educational Research and Improvement. Freedman, M. (1993). Partners in growth: Elder mentors and at-risk youth.
Philadelphia: Public/Private Ventures. Frymier, J., & Gansneder, B. (2001). The Phi Delta Kappa study of student at-risk.
Phi Delta Kappan, 71, 142. Ghory, W., & Sinclair, R. (1997). The reality of marginality: Current state of
affairs for marginal students. Washington, DC: Paper presented at the annual meeting of the American Educational Research Association, April, 20-24.
Glasser, W. (1996). Schools without failures. New York: Harper and Row. Goodlad, J. (2004). A place called school. New York: McGraw-Hill. Gordon, C. (1993). Toward a conceptual framework of the mentor/mentoree
relationship. PhD dissertation. Boston University, School of Education. Gray, W., & Gray, M. (1995). Mentoring: An annotated bibliography of important
references. Vancouver, BC: International Center for Mentoring. Greene, J. (2003). At-risk students in the fast lanes: Let them through. Exceptional
Children, 58, 390-391. Hunt, T., & Holt, J. (2003). Today’s schools. New York: Harcourt. Jackson, A. (2005). Turning points 2000: Educating adolescents in the twenty-first
century. A report of the Carnegie Corporation. New York: Teacher College Press, Columbia University.
Jacobi, E. (2001, Winter). Mentoring and undergraduate academic success: A
literature review. Review of Educational Research, 61, 505-532.

75
Jameson, K. (2003). A Change. Educational Leadership, 741, 147-149. Jenks, D., & Meyers, J. (2005). Schools and business: A new partnership. Paris:
Organization for Economic Co-operation and Development. Johnson, A., & Sullivan, J. (1995). Mentoring program practices and effectiveness.
New Directions for Adult Education, No.66. San Francisco: Jossey- Bass.
Krivacska, J. (2003). The school psychologist and program development of
disaffected/disruptive students. Paper presented at the annual meeting of the National Association of School Psychologists, New Orleans, LA, March.
Lee, E. (2001). The learning brain. San Diego, CA: Turning Point. Liechty, S. (1991). Meeting the needs of at-risk students. Keynote address delivered
at the Institute for Educational Leadership, College of Education, University of Northern Iowa.
Lowney, R. (1996). Mentor teachers: The California model. Phi Delta Kappa
Fastback Series, 16,247-266. Mazlow, A. (1978). Maslow on management. New York: John Wiley & Sons. McHale, G. (2000). Turning points: A white paper on the course of mentoring.
Proceedings of the National Mentoring Conference of Project Literacy. Washington, DC: National Educational Association.
McPartland, J., & Nettles, S. (1991). Using community adults as advocates or
mentors for at-risk middle school students: A two-year evaluation of Project RAISE. Baltimore, MD: Center for Research on Effective Schooling for Disadvantaged Students, John Hopkins University.
National Assessment of Educational Programs (1999). A blueprint for success:
Operation rescue. Washington, DC: Author. (ERIC Document Reproduction Service No. ED 274-093..
National Center for Educational Statistics. (1998). Dropout rate in the United States:
1997. Washington, DC: US Department of Education: Office of Educational Research and Improvement.
Piaget, J. (1969). The psychology of a child. Paris: The University Press of Paris,
France.

76
Powell, C. (2002). At-risk: A view of “social advantage.” Educational Leadership, 44(6), 47-49.
Ralph, J. (2003). Improving education for the disadvantaged: “Do we know whom
to help?”. Phi Delta Kappan, 20, 395-401. Rhodes, D. (1997). Operation rescue: Reaching at-risk students through teacher
iInitiatives. Washington, DC: Paper presented at the annual meeting of the American Research Association, April, Washington, DC.
Riley, R. (1998). Goals 2000: Reforming education to improve student
achievement. Washington, DC: Department of Education. Rogers, C. (2002). Nondirective teaching. Columbus, OH: Charles E. Merrill. Rogers, J. (1969). The professional altruist. The emergence of social work as a
career: 1880-1930. New York: Atheneum. Schorr, L. (2000). Common purpose: Strengthening families and neighborhoods to
rebuild America. New York: Doubleday. Sizer, T. (1962). One nation under god. Newsweek, 25(1), 62-74. Slavin, R, & Madden, N. (2004). Students at-risk of school failure: The problem of
its dimensions. Johns Hopkins University, Center for Research on Elementary and Middle Schools. Boston: Allyn and Bacon.
Smink, J. (2000). Mentoring programs for at-risk youth: A dropout prevention
research report. Clemson, SC: National Dropout Prevention Center. (ERIC Document Reproduction Service No. ED 318 931.
Sparzo, F. (2003). Changing behavior: A practical guide for teachers and parents.
Phi Delta Kappa Fastback, 221. TN Department of Education. (2004). Report card 2004. Retrieved November 14,
2004, from http://www.state.tn.us/education/ Turner, G. (2000). Employment and education. Salem: Oregon State Department of
Labor. US Department of Education. (1999). One to one guide for establishing a mentor
program. Washington, DC: GPO. Wehlage, G. (1997). A program model for high at-risk students. Educational
Leadership 44,(6), 70-73.

77
Woods, G. (2001, March). Reducing the dropout rate. Washington, DC: Office of Educational Research and Improvement (O.E.R.I.), US Department of Education.

78
APPENDIX A
Consent Letters to Director of Schools and School Principal Kellie C. Johnson
John Sevier Middle School 1200 Wateree St. Kingsport, TN 37660 March 22, 2005 Dr. Richard Kitzmiller Superin10dent of Schools 1701 East Center Street Kingsport, TN 37664 Dear Dr. Kitzmiller, As a student at East Tennessee State University, I am currently in the process of my dissertation study through the Educational Leadership and Policy Analysis doctoral program. My study will investigate the benefits of mentoring programs for students identified as at-risk at John Sevier Middle School. The study will examine students’ grade-point averages, attendance, and discipline records. I am requesting permission to access and use non-identifiable grade-point averages, attendance records, and discipline reports from the year 2003-2004 and 2004-2005 for the students selected for the study. Random numbers will be used to protect the identity of all participants. In preparation for the study, I will contact the principal of John Sevier Middle School and arrange for the collection of all necessary data with a minimum of disruption. Upon the completion of the mentor program, an original survey will be administered to all participants to gain a better understanding of mentor experience. I believe the results of my study will assist in identifying approaches to work with at-risk students. Thank you for your cooperation. Sincerely, Kellie Carter Johnson Permission is hereby granted to Kellie C. Johnson to access and use grade-point averages, attendance records, and discipline reports for identified students at John Sevier Middle School for 2003-2004 and 2004-2005 school years. Permission is also granted for Kellie C. Johnson to administered a confidential survey of all participants ____________________________________ ________________________ Signature Date
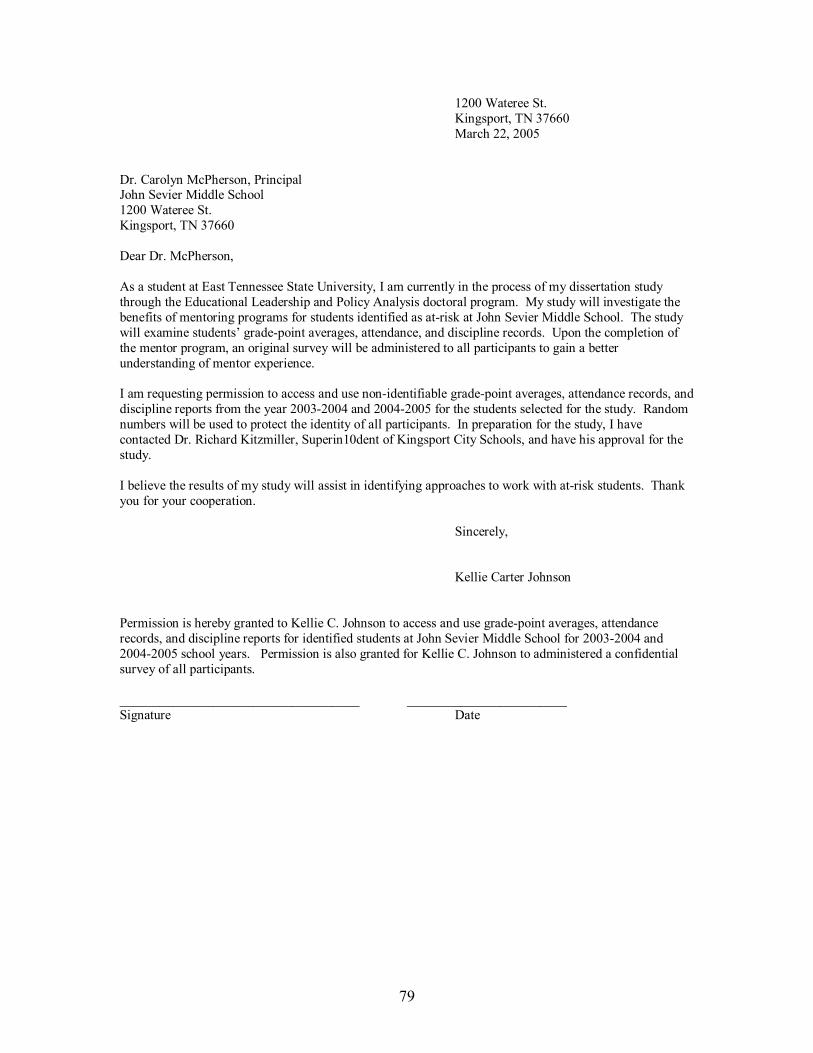
79
1200 Wateree St. Kingsport, TN 37660 March 22, 2005 Dr. Carolyn McPherson, Principal John Sevier Middle School 1200 Wateree St. Kingsport, TN 37660 Dear Dr. McPherson, As a student at East Tennessee State University, I am currently in the process of my dissertation study through the Educational Leadership and Policy Analysis doctoral program. My study will investigate the benefits of mentoring programs for students identified as at-risk at John Sevier Middle School. The study will examine students’ grade-point averages, attendance, and discipline records. Upon the completion of the mentor program, an original survey will be administered to all participants to gain a better understanding of mentor experience. I am requesting permission to access and use non-identifiable grade-point averages, attendance records, and discipline reports from the year 2003-2004 and 2004-2005 for the students selected for the study. Random numbers will be used to protect the identity of all participants. In preparation for the study, I have contacted Dr. Richard Kitzmiller, Superin10dent of Kingsport City Schools, and have his approval for the study. I believe the results of my study will assist in identifying approaches to work with at-risk students. Thank you for your cooperation. Sincerely, Kellie Carter Johnson Permission is hereby granted to Kellie C. Johnson to access and use grade-point averages, attendance records, and discipline reports for identified students at John Sevier Middle School for 2003-2004 and 2004-2005 school years. Permission is also granted for Kellie C. Johnson to administered a confidential survey of all participants. ____________________________________ ________________________ Signature Date
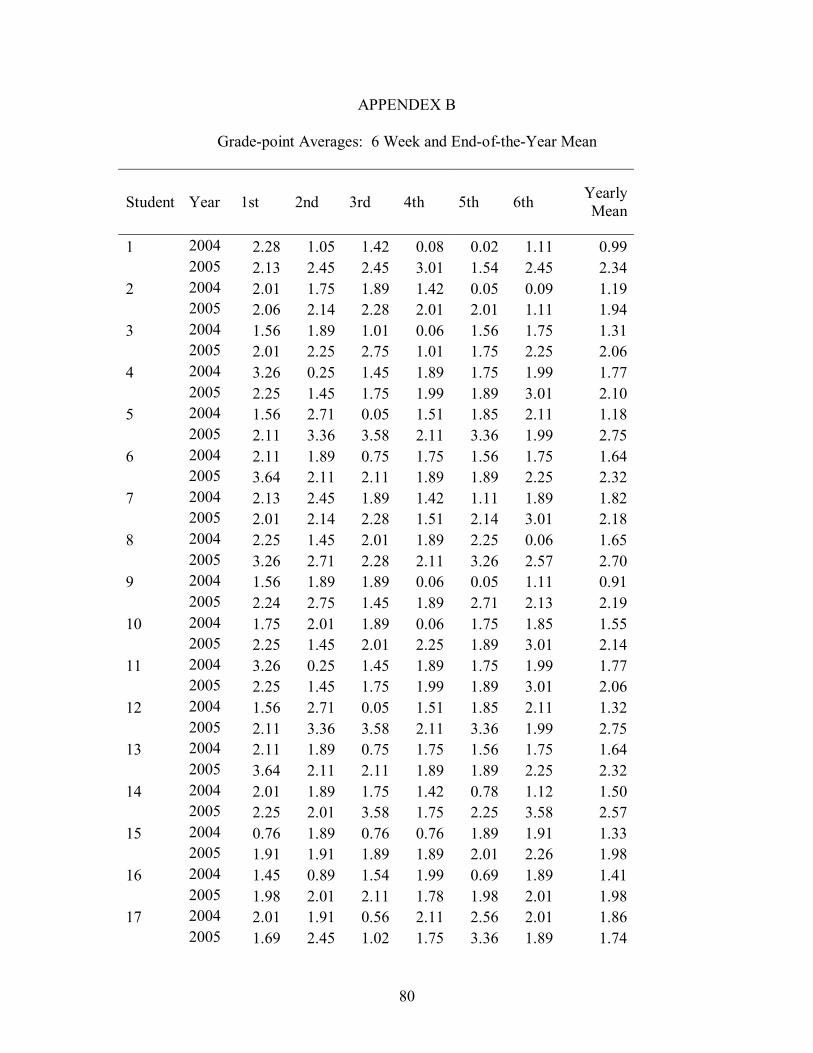
80
APPENDEX B
Grade-point Averages: 6 Week and End-of-the-Year Mean
Student Year 1st 2nd 3rd 4th 5th 6th Yearly Mean
1 2004 2.28 1.05 1.42 0.08 0.02 1.11 0.99 2005 2.13 2.45 2.45 3.01 1.54 2.45 2.34 2 2004 2.01 1.75 1.89 1.42 0.05 0.09 1.19 2005 2.06 2.14 2.28 2.01 2.01 1.11 1.94 3 2004 1.56 1.89 1.01 0.06 1.56 1.75 1.31 2005 2.01 2.25 2.75 1.01 1.75 2.25 2.06 4 2004 3.26 0.25 1.45 1.89 1.75 1.99 1.77 2005 2.25 1.45 1.75 1.99 1.89 3.01 2.10 5 2004 1.56 2.71 0.05 1.51 1.85 2.11 1.18 2005 2.11 3.36 3.58 2.11 3.36 1.99 2.75 6 2004 2.11 1.89 0.75 1.75 1.56 1.75 1.64 2005 3.64 2.11 2.11 1.89 1.89 2.25 2.32 7 2004 2.13 2.45 1.89 1.42 1.11 1.89 1.82 2005 2.01 2.14 2.28 1.51 2.14 3.01 2.18 8 2004 2.25 1.45 2.01 1.89 2.25 0.06 1.65 2005 3.26 2.71 2.28 2.11 3.26 2.57 2.70 9 2004 1.56 1.89 1.89 0.06 0.05 1.11 0.91 2005 2.24 2.75 1.45 1.89 2.71 2.13 2.19 10 2004 1.75 2.01 1.89 0.06 1.75 1.85 1.55 2005 2.25 1.45 2.01 2.25 1.89 3.01 2.14 11 2004 3.26 0.25 1.45 1.89 1.75 1.99 1.77 2005 2.25 1.45 1.75 1.99 1.89 3.01 2.06 12 2004 1.56 2.71 0.05 1.51 1.85 2.11 1.32 2005 2.11 3.36 3.58 2.11 3.36 1.99 2.75 13 2004 2.11 1.89 0.75 1.75 1.56 1.75 1.64 2005 3.64 2.11 2.11 1.89 1.89 2.25 2.32 14 2004 2.01 1.89 1.75 1.42 0.78 1.12 1.50 2005 2.25 2.01 3.58 1.75 2.25 3.58 2.57 15 2004 0.76 1.89 0.76 0.76 1.89 1.91 1.33 2005 1.91 1.91 1.89 1.89 2.01 2.26 1.98 16 2004 1.45 0.89 1.54 1.99 0.69 1.89 1.41 2005 1.98 2.01 2.11 1.78 1.98 2.01 1.98 17 2004 2.01 1.91 0.56 2.11 2.56 2.01 1.86 2005 1.69 2.45 1.02 1.75 3.36 1.89 1.74

81
18 2004 0.89 1.24 0.56 0.89 0.56 1.89 0.86 2005 1.12 1.21 2.01 1.31 1.45 1.76 1.48 19 2004 1.21 1.89 1.75 0.89 0.89 1.76 1.41 2005 1.98 1.75 1.42 2.11 0.89 1.12 1.55 20 2004 0.98 2.25 0.56 0.76 1.12 1.56 1.21 2005 1.51 3.58 2.01 2.11 3.58 3.36 2.69 21 2004 2.89 1.14 1.56 0.56 2.11 1.89 1.60 2005 1.56 2.56 2.31 1.14 1.56 1.76 1.82 22 2004 0.56 0.56 0.89 0.56 0.89 0.72 0.71 2005 1.14 1.01 1.01 1.14 2.01 1.01 1.22 23 2004 1.56 1.24 1.45 2.15 1.76 1.89 1.53 2005 2.11 2.01 3.58 1.89 1.89 2.15 2.27 24 2004 1.54 0.56 1.98 1.24 0.56 1.89 1.29 2005 2.01 2.11 2.25 1.42 1.75 1.89 1.90 25 2004 2.01 1.14 1.75 0.56 1.31 0.89 1.27 2005 1.51 1.21 1.24 0.89 1.75 1.89 1.41 26 2004 1.21 1.89 1.75 0.89 0.89 1.76 1.39 2005 1.98 1.75 1.42 2.11 0.89 1.12 1.54 27 2004 0.98 2.25 0.56 0.76 1.12 1.56 1.20 2005 1.51 3.58 2.01 2.11 3.58 3.36 2.69 28 2004 2.89 1.14 1.56 0.56 2.11 1.89 1.69 2005 1.56 2.56 2.31 1.14 1.56 1.76 1.81 29 2004 2.56 1.14 1.56 2.11 1.42 1.12 1.60 2005 3.36 2.01 1.89 1.42 2.01 2.11 2.13 30 2004 1.89 0.06 1.14 2.28 0.75 1.42 1.25 2005 2.16 2.25 1.21 2.13 2.11 2.01 1.97 31 2004 1.54 1.89 1.89 2.01 1.89 0.06 1.54 2005 0.56 1.99 1.75 2.06 2.28 1.01 1.60 32 2004 0.89 1.51 2.25 1.56 2.01 1.89 1.68 2005 1.98 2.11 3.58 2.01 2.28 1.99 2.32 33 2004 1.14 1.75 1.14 1.42 2.11 1.51 1.51 2005 2.56 1.89 2.56 1.89 1.56 2.11 2.09 34 2004 2.56 1.14 1.56 2.11 1.42 1.12 1.65 2005 3.36 2.01 1.89 1.42 2.01 2.11 2.13 35 2004 2.28 1.05 1.42 0.08 0.02 1.11 0.99 2005 2.13 2.45 2.45 3.01 1.54 2.45 2.34 36 2004 2.01 1.75 1.89 1.42 0.05 0.09 1.19 2005 2.06 2.14 2.28 2.01 2.01 1.11 1.94 37 2004 1.56 1.89 1.01 0.06 1.56 1.75 1.31 2005 2.01 2.25 2.75 1.01 1.75 2.25 2.00 38 2004 3.26 0.25 1.45 1.89 1.75 1.99 1.77
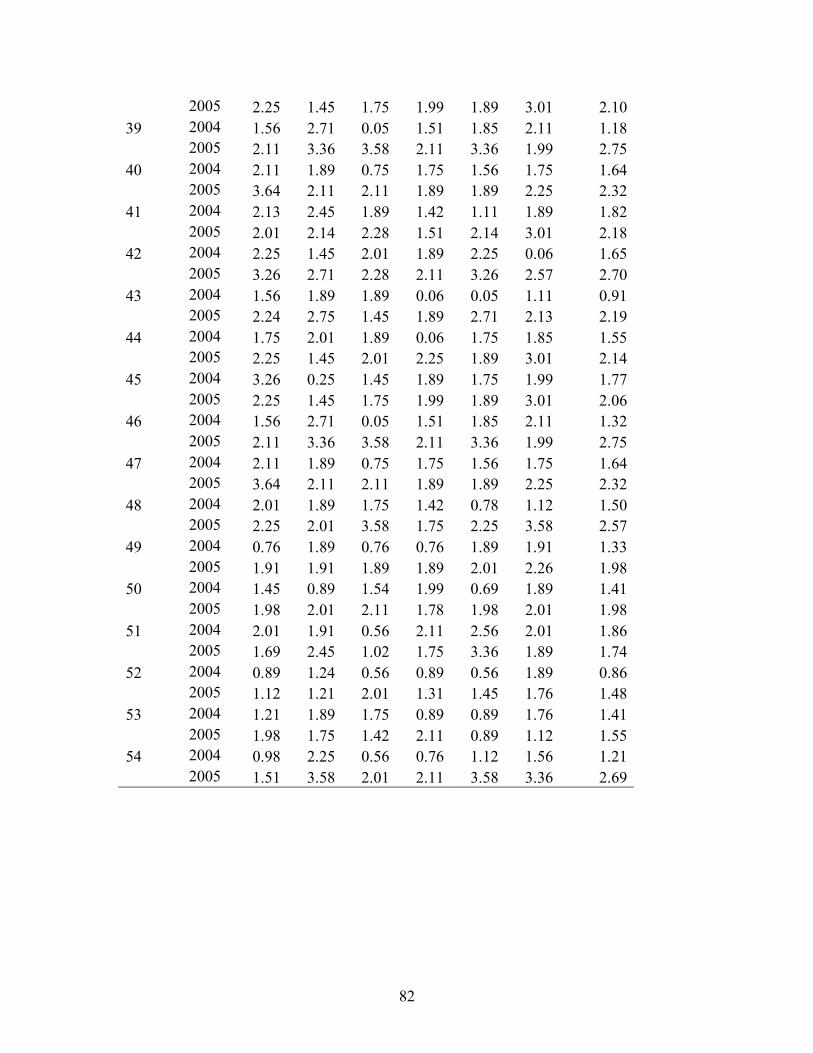
82
2005 2.25 1.45 1.75 1.99 1.89 3.01 2.10 39 2004 1.56 2.71 0.05 1.51 1.85 2.11 1.18 2005 2.11 3.36 3.58 2.11 3.36 1.99 2.75 40 2004 2.11 1.89 0.75 1.75 1.56 1.75 1.64 2005 3.64 2.11 2.11 1.89 1.89 2.25 2.32 41 2004 2.13 2.45 1.89 1.42 1.11 1.89 1.82 2005 2.01 2.14 2.28 1.51 2.14 3.01 2.18 42 2004 2.25 1.45 2.01 1.89 2.25 0.06 1.65 2005 3.26 2.71 2.28 2.11 3.26 2.57 2.70 43 2004 1.56 1.89 1.89 0.06 0.05 1.11 0.91 2005 2.24 2.75 1.45 1.89 2.71 2.13 2.19 44 2004 1.75 2.01 1.89 0.06 1.75 1.85 1.55 2005 2.25 1.45 2.01 2.25 1.89 3.01 2.14 45 2004 3.26 0.25 1.45 1.89 1.75 1.99 1.77 2005 2.25 1.45 1.75 1.99 1.89 3.01 2.06 46 2004 1.56 2.71 0.05 1.51 1.85 2.11 1.32 2005 2.11 3.36 3.58 2.11 3.36 1.99 2.75 47 2004 2.11 1.89 0.75 1.75 1.56 1.75 1.64 2005 3.64 2.11 2.11 1.89 1.89 2.25 2.32 48 2004 2.01 1.89 1.75 1.42 0.78 1.12 1.50 2005 2.25 2.01 3.58 1.75 2.25 3.58 2.57 49 2004 0.76 1.89 0.76 0.76 1.89 1.91 1.33 2005 1.91 1.91 1.89 1.89 2.01 2.26 1.98 50 2004 1.45 0.89 1.54 1.99 0.69 1.89 1.41 2005 1.98 2.01 2.11 1.78 1.98 2.01 1.98 51 2004 2.01 1.91 0.56 2.11 2.56 2.01 1.86 2005 1.69 2.45 1.02 1.75 3.36 1.89 1.74 52 2004 0.89 1.24 0.56 0.89 0.56 1.89 0.86 2005 1.12 1.21 2.01 1.31 1.45 1.76 1.48 53 2004 1.21 1.89 1.75 0.89 0.89 1.76 1.41 2005 1.98 1.75 1.42 2.11 0.89 1.12 1.55 54 2004 0.98 2.25 0.56 0.76 1.12 1.56 1.21 2005 1.51 3.58 2.01 2.11 3.58 3.36 2.69

83
APPENDEX C
Discipline Referrals: 6 Week and End-of-the-Year Mean
Student Year 1st 2nd 3rd 4th 5th 6th Year Total
1 2004 3 4 2 10 9 6 34 2005 2 3 9 7 5 2 28 2 2004 8 11 12 17 15 22 85 2005 5 10 14 10 8 12 59 3 2004 2 3 1 0 0 2 8 2005 0 1 2 0 4 0 7 4 2004 11 14 16 18 19 5 83 2005 4 3 2 1 1 1 12 5 2004 5 6 8 10 7 6 42 2005 5 4 5 4 4 2 24 6 2004 3 4 1 2 5 9 24 2005 2 1 2 1 1 4 11 7 2004 3 2 4 1 5 1 16 2005 6 4 2 0 5 1 18 8 2004 8 10 8 6 7 13 52 2005 3 2 1 4 2 0 12 9 2004 8 8 3 8 6 3 36 2005 1 2 3 4 8 1 19 10 2004 2 2 5 8 9 6 32 2005 9 2 1 0 0 3 15 11 2004 3 7 8 2 4 3 27 2005 7 5 2 1 3 0 18 12 2004 0 8 4 2 1 3 18 2005 2 2 1 1 3 4 13 13 2004 6 3 4 2 8 7 30 2005 3 4 2 9 1 2 21 14 2004 8 9 8 12 14 16 67 2005 5 6 4 8 10 5 38 15 2004 2 9 2 5 4 1 23 2005 8 2 5 2 1 1 19 16 2004 2 9 2 5 4 1 23 2005 6 8 10 1 6 8 39 17 2004 4 2 4 4 1 6 21
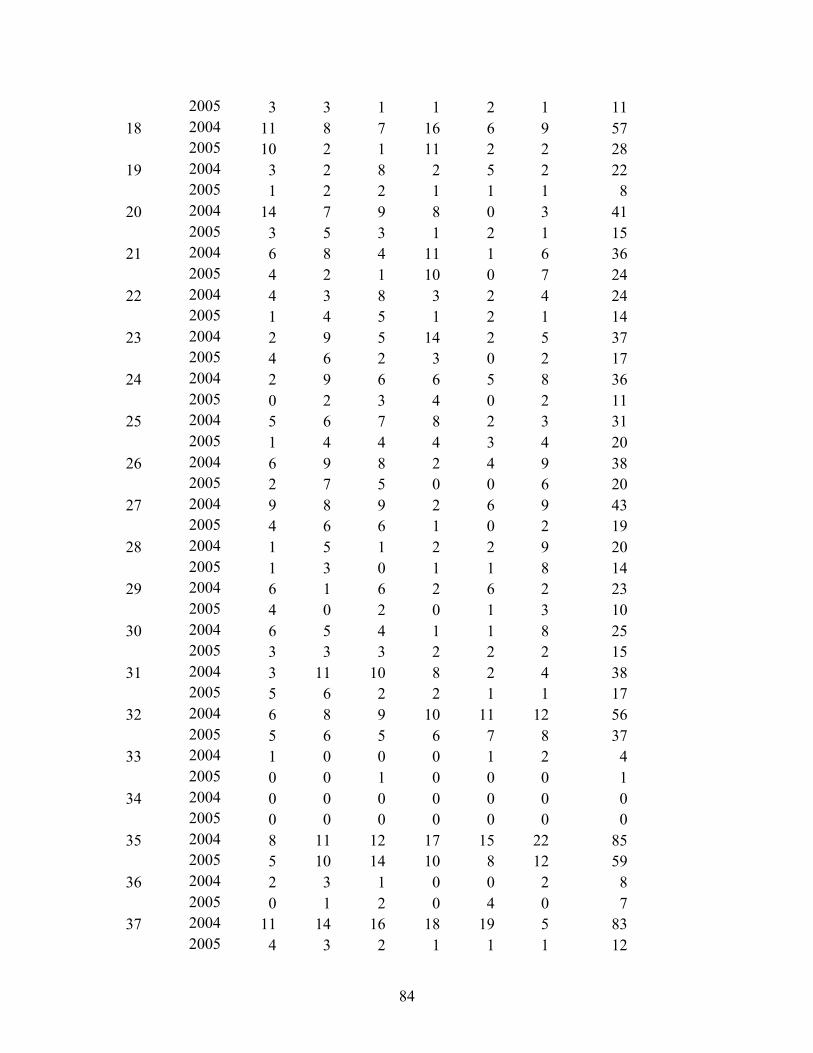
84
2005 3 3 1 1 2 1 11 18 2004 11 8 7 16 6 9 57 2005 10 2 1 11 2 2 28 19 2004 3 2 8 2 5 2 22 2005 1 2 2 1 1 1 8 20 2004 14 7 9 8 0 3 41 2005 3 5 3 1 2 1 15 21 2004 6 8 4 11 1 6 36 2005 4 2 1 10 0 7 24 22 2004 4 3 8 3 2 4 24 2005 1 4 5 1 2 1 14 23 2004 2 9 5 14 2 5 37 2005 4 6 2 3 0 2 17 24 2004 2 9 6 6 5 8 36 2005 0 2 3 4 0 2 11 25 2004 5 6 7 8 2 3 31 2005 1 4 4 4 3 4 20 26 2004 6 9 8 2 4 9 38 2005 2 7 5 0 0 6 20 27 2004 9 8 9 2 6 9 43 2005 4 6 6 1 0 2 19 28 2004 1 5 1 2 2 9 20 2005 1 3 0 1 1 8 14 29 2004 6 1 6 2 6 2 23 2005 4 0 2 0 1 3 10 30 2004 6 5 4 1 1 8 25 2005 3 3 3 2 2 2 15 31 2004 3 11 10 8 2 4 38 2005 5 6 2 2 1 1 17 32 2004 6 8 9 10 11 12 56 2005 5 6 5 6 7 8 37 33 2004 1 0 0 0 1 2 4 2005 0 0 1 0 0 0 1 34 2004 0 0 0 0 0 0 0 2005 0 0 0 0 0 0 0 35 2004 8 11 12 17 15 22 85 2005 5 10 14 10 8 12 59 36 2004 2 3 1 0 0 2 8 2005 0 1 2 0 4 0 7 37 2004 11 14 16 18 19 5 83 2005 4 3 2 1 1 1 12
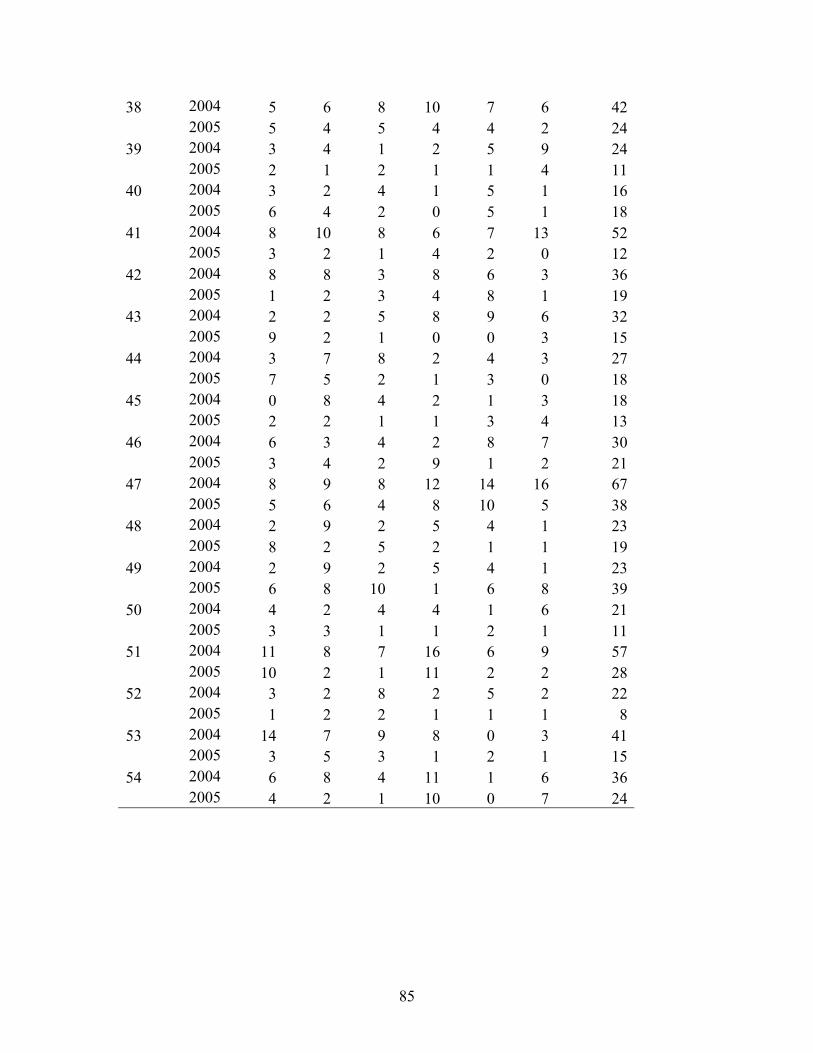
85
38 2004 5 6 8 10 7 6 42 2005 5 4 5 4 4 2 24 39 2004 3 4 1 2 5 9 24 2005 2 1 2 1 1 4 11 40 2004 3 2 4 1 5 1 16 2005 6 4 2 0 5 1 18 41 2004 8 10 8 6 7 13 52 2005 3 2 1 4 2 0 12 42 2004 8 8 3 8 6 3 36 2005 1 2 3 4 8 1 19 43 2004 2 2 5 8 9 6 32 2005 9 2 1 0 0 3 15 44 2004 3 7 8 2 4 3 27 2005 7 5 2 1 3 0 18 45 2004 0 8 4 2 1 3 18 2005 2 2 1 1 3 4 13 46 2004 6 3 4 2 8 7 30 2005 3 4 2 9 1 2 21 47 2004 8 9 8 12 14 16 67 2005 5 6 4 8 10 5 38 48 2004 2 9 2 5 4 1 23 2005 8 2 5 2 1 1 19 49 2004 2 9 2 5 4 1 23 2005 6 8 10 1 6 8 39 50 2004 4 2 4 4 1 6 21 2005 3 3 1 1 2 1 11 51 2004 11 8 7 16 6 9 57 2005 10 2 1 11 2 2 28 52 2004 3 2 8 2 5 2 22 2005 1 2 2 1 1 1 8 53 2004 14 7 9 8 0 3 41 2005 3 5 3 1 2 1 15 54 2004 6 8 4 11 1 6 36 2005 4 2 1 10 0 7 24
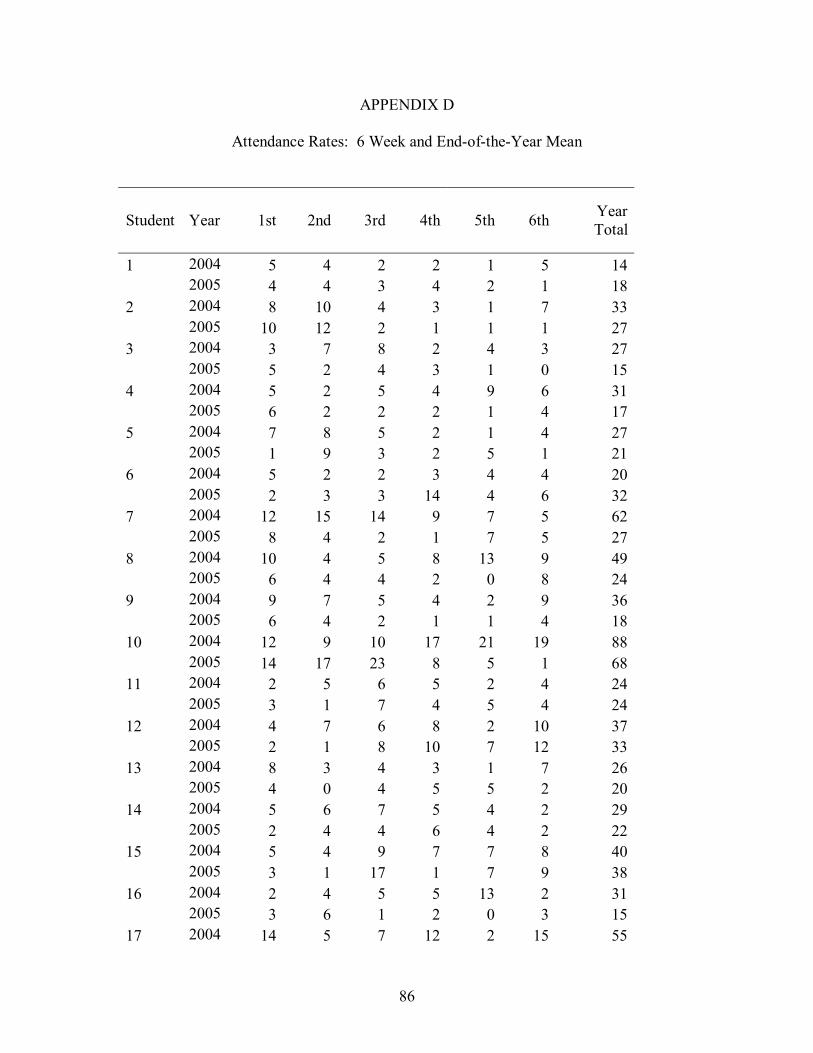
86
APPENDIX D
Attendance Rates: 6 Week and End-of-the-Year Mean
Student Year 1st 2nd 3rd 4th 5th 6th Year Total
1 2004 5 4 2 2 1 5 14 2005 4 4 3 4 2 1 18 2 2004 8 10 4 3 1 7 33 2005 10 12 2 1 1 1 27 3 2004 3 7 8 2 4 3 27 2005 5 2 4 3 1 0 15 4 2004 5 2 5 4 9 6 31 2005 6 2 2 2 1 4 17 5 2004 7 8 5 2 1 4 27 2005 1 9 3 2 5 1 21 6 2004 5 2 2 3 4 4 20 2005 2 3 3 14 4 6 32 7 2004 12 15 14 9 7 5 62 2005 8 4 2 1 7 5 27 8 2004 10 4 5 8 13 9 49 2005 6 4 4 2 0 8 24 9 2004 9 7 5 4 2 9 36 2005 6 4 2 1 1 4 18 10 2004 12 9 10 17 21 19 88 2005 14 17 23 8 5 1 68 11 2004 2 5 6 5 2 4 24 2005 3 1 7 4 5 4 24 12 2004 4 7 6 8 2 10 37 2005 2 1 8 10 7 12 33 13 2004 8 3 4 3 1 7 26 2005 4 0 4 5 5 2 20 14 2004 5 6 7 5 4 2 29 2005 2 4 4 6 4 2 22 15 2004 5 4 9 7 7 8 40 2005 3 1 17 1 7 9 38 16 2004 2 4 5 5 13 2 31 2005 3 6 1 2 0 3 15 17 2004 14 5 7 12 2 15 55
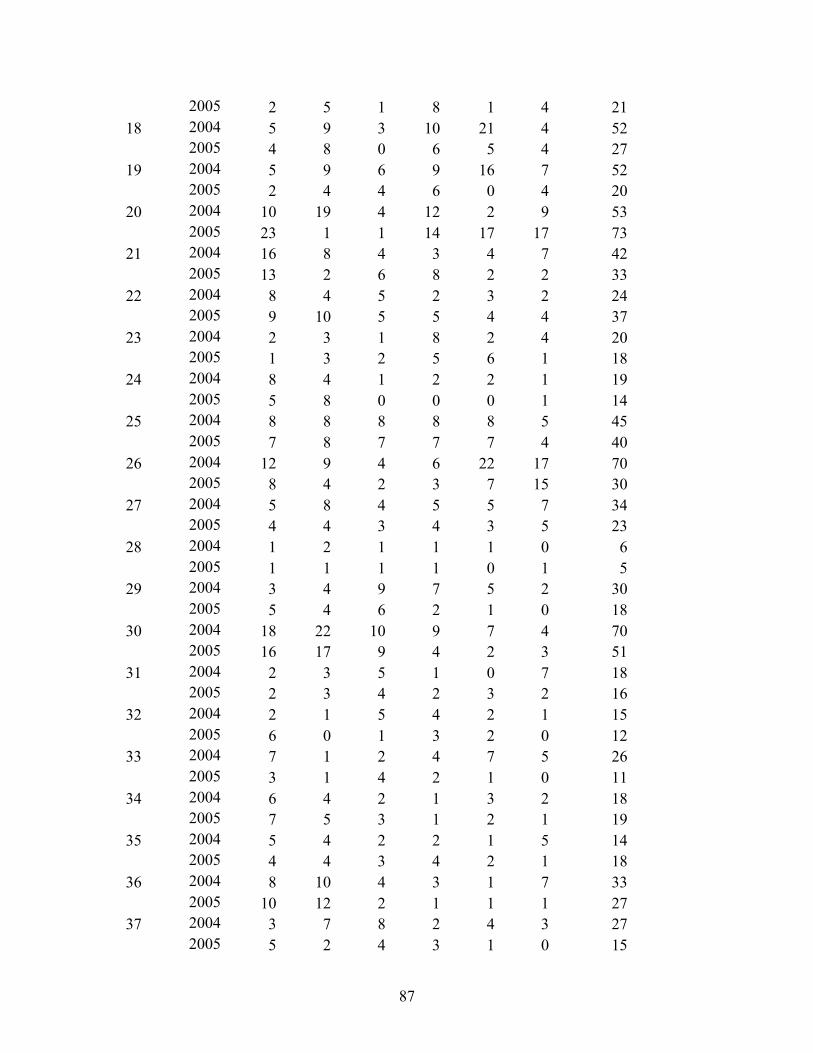
87
2005 2 5 1 8 1 4 21 18 2004 5 9 3 10 21 4 52 2005 4 8 0 6 5 4 27 19 2004 5 9 6 9 16 7 52 2005 2 4 4 6 0 4 20 20 2004 10 19 4 12 2 9 53 2005 23 1 1 14 17 17 73 21 2004 16 8 4 3 4 7 42 2005 13 2 6 8 2 2 33 22 2004 8 4 5 2 3 2 24 2005 9 10 5 5 4 4 37 23 2004 2 3 1 8 2 4 20 2005 1 3 2 5 6 1 18 24 2004 8 4 1 2 2 1 19 2005 5 8 0 0 0 1 14 25 2004 8 8 8 8 8 5 45 2005 7 8 7 7 7 4 40 26 2004 12 9 4 6 22 17 70 2005 8 4 2 3 7 15 30 27 2004 5 8 4 5 5 7 34 2005 4 4 3 4 3 5 23 28 2004 1 2 1 1 1 0 6 2005 1 1 1 1 0 1 5 29 2004 3 4 9 7 5 2 30 2005 5 4 6 2 1 0 18 30 2004 18 22 10 9 7 4 70 2005 16 17 9 4 2 3 51 31 2004 2 3 5 1 0 7 18 2005 2 3 4 2 3 2 16 32 2004 2 1 5 4 2 1 15 2005 6 0 1 3 2 0 12 33 2004 7 1 2 4 7 5 26 2005 3 1 4 2 1 0 11 34 2004 6 4 2 1 3 2 18 2005 7 5 3 1 2 1 19 35 2004 5 4 2 2 1 5 14 2005 4 4 3 4 2 1 18 36 2004 8 10 4 3 1 7 33 2005 10 12 2 1 1 1 27 37 2004 3 7 8 2 4 3 27 2005 5 2 4 3 1 0 15
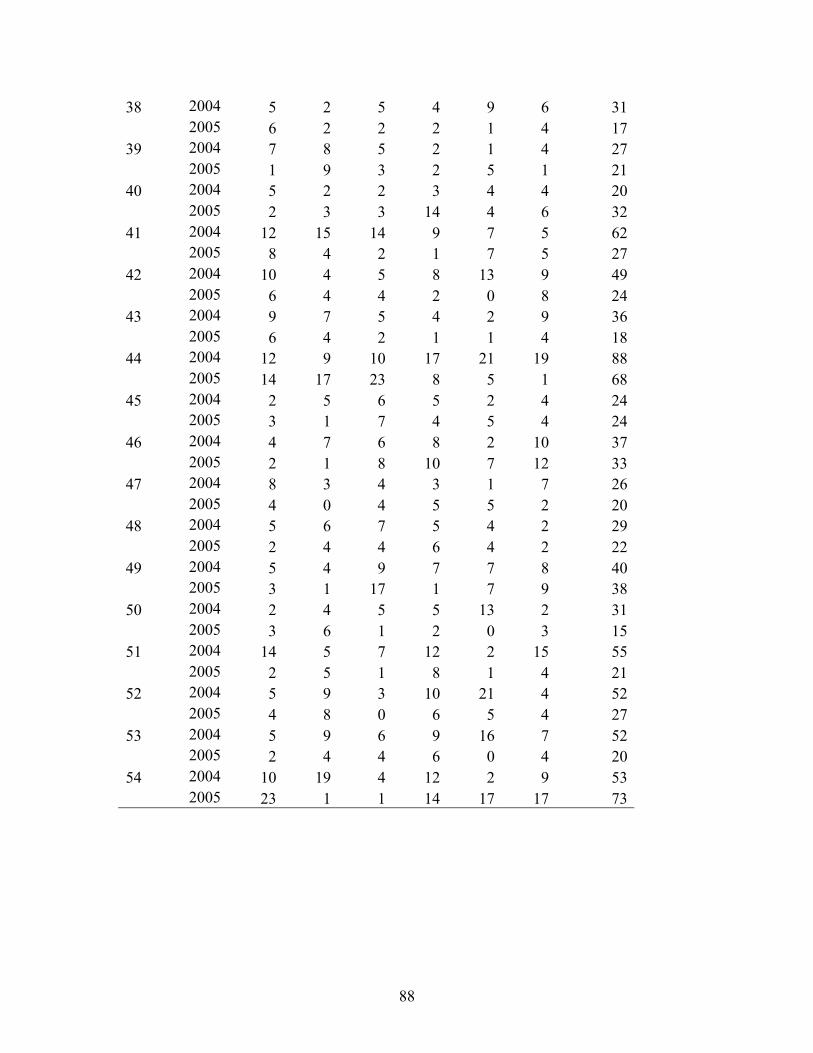
88
38 2004 5 2 5 4 9 6 31 2005 6 2 2 2 1 4 17 39 2004 7 8 5 2 1 4 27 2005 1 9 3 2 5 1 21 40 2004 5 2 2 3 4 4 20 2005 2 3 3 14 4 6 32 41 2004 12 15 14 9 7 5 62 2005 8 4 2 1 7 5 27 42 2004 10 4 5 8 13 9 49 2005 6 4 4 2 0 8 24 43 2004 9 7 5 4 2 9 36 2005 6 4 2 1 1 4 18 44 2004 12 9 10 17 21 19 88 2005 14 17 23 8 5 1 68 45 2004 2 5 6 5 2 4 24 2005 3 1 7 4 5 4 24 46 2004 4 7 6 8 2 10 37 2005 2 1 8 10 7 12 33 47 2004 8 3 4 3 1 7 26 2005 4 0 4 5 5 2 20 48 2004 5 6 7 5 4 2 29 2005 2 4 4 6 4 2 22 49 2004 5 4 9 7 7 8 40 2005 3 1 17 1 7 9 38 50 2004 2 4 5 5 13 2 31 2005 3 6 1 2 0 3 15 51 2004 14 5 7 12 2 15 55 2005 2 5 1 8 1 4 21 52 2004 5 9 3 10 21 4 52 2005 4 8 0 6 5 4 27 53 2004 5 9 6 9 16 7 52 2005 2 4 4 6 0 4 20 54 2004 10 19 4 12 2 9 53 2005 23 1 1 14 17 17 73

89
VITA
KELLIE C. JOHNSON
Personal Data: Date of Birth: June 2, 1978 Place of Birth: Kingsport, Tennessee Marital Status: Married Education: Public Schools, Scott County, Virginia B.A. Early Childhood Education, Virginia Polytechnic Institute and State University, Blacksburg, Virginia 1999 M.A. School Counseling, East Tennessee State University, Johnson City, Tennessee 2001 Ed.D. School Leadership, East Tennessee State University, Johnson City, Tennessee 2006 Professional Experience Graduate Assistant, East Tennessee State University, College of Education, 1999-2001 Teacher, Palmer Center; Kingsport, Tennessee, 2001 School Counselor; Kingsport, Tennessee, 2001-2006 Honors and Awards: Who’s Who in American Colleges Outstanding Education Student, Virginia Polytechnic Institute and State University Magna Cum Laude, Virginia Polytechnic Institute and State University; B.S. Magna Cum Laude, East Tennessee State University; M.A. Magna Cum Laude, East Tennessee State University; Ed.D.