Embed Size (px)
Citation preview

Mental Health Commission2016/17 Annual Report
Page ii Mental Health Commission | 2016/17 Annual Report
Statement of ComplianceHon. Roger Hugh Cook MLADEPUTY PREMIER; MINISTER FOR HEALTH; MENTAL HEALTH
Dear Minister
In accordance with section 63 of the Financial Management Act 2006, I hereby submit for your information and presentation to Parliament, the annual report of the Mental Health Commission for the reporting period ended 30 June 2017.
The annual report has been prepared in accordance with the provisions of the Financial Management Act 2006.
Timothy MarneyCOMMISSIONERMENTAL HEALTH COMMISSION
6 September 2017
This annual report provides a review of the Mental Health Commission’s (hereby referred to as the Commission) operations for the financial year ended 30 June 2017.
The term Aboriginal is used respectfully throughout this report to include both Aboriginal and Torres Strait Islander peoples.
A full copy of this, and earlier annual reports, are available from the Commission’s website at www.mhc.wa.gov.au
To make this annual report as accessible as possible, it is also provided as an interactive online PDF, which has links to other sections within the annual report as well as external links to content on the Commission’s website and other external sites (excluding financial statements from pages 50 to 99). This annual report can also be made available in alternative formats upon request for those with visual or other impairments, including Word, audio, large print and Braille.
This publication may be copied in whole or part, with acknowledgement to the Commission.
© Mental Health Commission, Government of Western Australia. ISSN 2208-4347
OVERVIEW AGENCY PERFORMANCE SIGNIFICANT ISSUESDISCLOSURES AND
LEGAL COMPLIANCEAPPENDICES

Page 1 Mental Health Commission | 2016/17 Annual Report
ContentsStatement of Compliance .....................................................................ii
Overview ................................................................................................ 2
Vision And Mission ............................................................................. 3
Commissioner’s Foreword .................................................................. 4
Executive Summary ............................................................................ 6
Operational Structure .......................................................................... 8
Organisational Structure ................................................................... 10
Agency Performance ...........................................................................13
Performance Summaries – Report On Operations ............................14
Key Achievements .............................................................................19
Significant Issues ................................................................................ 40
Significant Issues Impacting The Commission ..................................41
Disclosures and Legal Compliance ................................................... 43
Certification of Financial Statements ................................................ 44
Independent Auditor’s Report ........................................................... 45
Financial Statements ........................................................................ 50
Key Performance Indicators.............................................................101
Key Effectiveness Indicators .......................................................... 104
Key Efficiency Indicators .................................................................120
Other Legal And Government Policy Requirements
And Financial Disclosures............................................................... 164
Appendices ........................................................................................ 168
Appendix One: Non-Government Organisations Funded
Through Service Agreements 2016/17* .......................................... 169
Glossary Of Service Types: Appendix One .................................... 180
Appendix Two: Board And Committee Remuneration..................... 183
OVERVIEW AGENCY PERFORMANCE SIGNIFICANT ISSUESDISCLOSURES AND
LEGAL COMPLIANCEAPPENDICES

Page 2 Mental Health Commission | 2016/17 Annual Report
AGENCY PERFORMANCE SIGNIFICANT ISSUESDISCLOSURES AND
LEGAL COMPLIANCEAPPENDICESOVERVIEW
Overview

Page 3 Mental Health Commission | 2016/17 Annual Report
Our Vision is to achieve a Western Australian community that experiences minimal alcohol and other drug (AOD)-related harms and optimal mental health.
We do this by being an effective leader of alcohol, drug and mental health commissioning, providing and partnering in the delivery of person-centred and evidence-based:• prevention, promotion and early
intervention programs;• treatment, services and supports;
and• research, policy and system
improvements.
Vision And Mission
Self care
Informal community support
Primary care
Enhanced primary care
Services required
Specialisedcommunity services
Hospitalservices
Co
sts
Low
High
Men
tal I
llnes
s
SE
VE
RE
: 1.2%
Prevention
Po
pul
atio
n re
qui
ring
ser
vice
s
Low
High
Alcohol & O
ther Drugs
WEL
L: 8
2.8%
MIL
D: 9
.4%
MO
DER
ATE
: 4.7
%
SEVE
RE
: 3.1
% WELL: 97.3%
MILD
: 0.8%
SEVERE
: 1.2%
MO
DER
ATE
: 0.7%
Mental Health Commission’s role to provide services in these areas.
AGENCY PERFORMANCE SIGNIFICANT ISSUESDISCLOSURES AND
LEGAL COMPLIANCEAPPENDICESOVERVIEW

Page 4 Mental Health Commission | 2016/17 Annual Report
Commissioner’s ForewordThe Commission delivered a range of initiatives in 2016/17 to enhance the treatment, services and supports to people with mental health and/or AOD issues.
Guided by the Western Australian Mental Health, Alcohol and Other Drug Services Plan 2015-2025: Better Choices. Better Lives, key initiatives included prevention campaigns, increases in hospital and community bed-based services, training and support to frontline workers, and growth in counselling through our helplines.
In 2016/17, we continued integration in addressing mental health and AOD issues, particularly through our prevention, promotion and purchasing activity. With up to 50% of people with mental health issues also experiencing problems with AOD use, an integrated approach within the Commission and across service providers is a major priority.
Prevention Services included:• Strong Spirit Strong Mind Aboriginal Programs;• Alcohol.Think Again and Drug Aware public education campaigns;• Meth Can Take Control and Meth Helpline campaigns;• a number of service and support lines, including the Meth Helpline
(1800 874 878) which was launched on 12 September 2016; and• a range of suicide prevention initiatives, including the establishment of
Suicide Prevention Community Coordinators across the State.
Mental Health and AOD Services initiatives included:• the development, consultation and release of the Commissioning
Framework, which provides the foundation to purchasing services inline with evidence based decision making;
• the first bilateral agreements with the new Health Services Boards.These agreements adhere to the legal framework outlined in theHealth Services Act 2016 and provide a further mechanism to drivechange and improvement in the public mental health system.The Commission continued to ensure that all funding provided by theCommission to Health Service Providers (HSPs) was spent on mentalhealth services, by close monitoring of expenditure through specialpurpose accounts (which under the Financial Management Act 2006are subject to audit by the Auditor General) and improved monitoringof service performance;
• further development of a youth mental health stream in collaborationwith the Department of Health and HSPs, with 12 dedicated youthbeds opened in 2016/17, bringing the total number of public mentalhealth beds for children, adolescents and youth to 39;
• various initiatives to expand AOD prevention, treatment and supportservices to address the use of methamphetamines. The number ofresidential rehabilitation and low medical withdrawal beds increasedby almost 20% in 2016/17, up from 371 to 441;
• planning for the three new step up/step down services in Broome,Bunbury and Karratha. The Rockingham community mental healthstep up/step down service opened in October 2016, with a strongcollaborative approach between the non-government service providerand the South Metropolitan Mental Health Service;
• establishment of the new Methamphetamine Clinic at Next Step Drugand Alcohol Services (Next Step);
AGENCY PERFORMANCE SIGNIFICANT ISSUESDISCLOSURES AND
LEGAL COMPLIANCEAPPENDICESOVERVIEW
Page 5 Mental Health Commission | 2016/17 Annual Report
• development of the Exposure Draft Compulsory Treatment (Alcoholand Other Drugs) Bill 2016 and an associated Summary Model ofService with input from a range of stakeholders. Consultation includedcontribution from the Compulsory Treatment Community AdvisoryGroup and the release of online Discussion and Background Papers inSeptember 2016, for public consultation and feedback; and
• the expansion of the ALIVE program for support services to individualsfollowing discharge from hospital in the North Metropolitan area, and theestablishment of a new ALIVE program in the South Metropolitan area.
This is a sample of our achievements in 2016/17, with a more expansive summary provided in the Key Achievements section at page 19.
Many of our achievements in the 2016/17 financial year were overseen by the former Minister for Mental Health, the Hon. Andrea Mitchell MLA, and I acknowledge her contribution.
The new Minister for Mental Health, the Hon. Roger Hugh Cook MLA, also Deputy Premier and Minister for Health, was sworn in on 17 March 2017. The Parliamentary Secretary to the Deputy Premier, Minister for Health and Mental Health, the Hon. Alanna Therese Clohesy MLC, assumed responsibility for assisting the Minister on that date. We have sought to maximise the benefit of having the portfolios of Health and Mental Health reporting to the same Minister and Parliamentary Secretary. At the same time, the retention of the Mental Health Commission as a separate entity has enabled a continued focus on the commissioning of both government and non-government community-based treatments, services and supports, and the ability for us to continue to build our engagement and empowerment of consumers and carers.
In this regard, the Commission’s Consumer, Family, Carer and Community Paid Partnership Policy was co-designed with consumers and carers and implemented in 2016/17. This co-design approach is also being undertaken in the development of the Commission’s Engagement Framework.
Internally, we worked across the Commission to develop and bring a shared understanding and ownership of our Values and the behaviours that are consistent with them. We further refined our corporate governance, including the introduction of a Reconciliation Committee, as a sub-committee of the Corporate Executive, chaired by myself.
We also focused on achieving internal efficiencies, particularly in our corporate services area, following the amalgamation of the Commission and the Drug and Alcohol Office in 2015/16. With our back office processing functions provided by Health Support Services, we sought to streamline our resourcing of the corporate services functions within the Commission.
I am pleased to present to you this annual report. I thank all those who have worked with us over the past year and I also extend my genuine thanks to everyone at the Commission for their efforts and achievements in 2016/17.
Timothy Marney Mental Health Commissioner
AGENCY PERFORMANCE SIGNIFICANT ISSUESDISCLOSURES AND
LEGAL COMPLIANCEAPPENDICESOVERVIEW

Page 6 Mental Health Commission | 2016/17 Annual Report
Executive Summary2016/17 HighlightsWestern Australian Mental Health, Alcohol and Other Drug Services Plan 2015-2025: Better Choices. Better Lives.
$20.6million
$46.5million
Community Support• establishment of a two-year $282,100 pilot project
purchased to provide support for regionally basedlesbian, gay, bisexual, transgender and intersexyouth
• funding of $192,745 for 10 Aboriginal specific peersupport and mentoring grants
• an additional $47,299 in targeted peer supportsuicide prevention grants for three communityinitiatives
• funding provided to 97 NGO community supportservices. Eg: Even Keel Bipolar Disorder SupportAssociation; Lamp
AGENCY PERFORMANCE SIGNIFICANT ISSUESDISCLOSURES AND
LEGAL COMPLIANCEAPPENDICESOVERVIEW
$OUT $TOTAL
$863.1million
Prevention•
•
•
•
•
•
established network of 10 new Suicide Prevention Community CoordinatorsRegional Men’s Health Initiative to provide suicide prevention education to the farming industryMeth Can Take Control achieved greater awareness in its first year than any previous Drug Aware campaign73% of Western Australians surveyed were aware of national low-risk drinking guidelinesevaluation of Strong Spirit Strong Mind Metro Project campaign found 83% of young Aboriginal people were more aware of AOD harmsfunding provided to 21 NGO community-based prevention services. Eg: Lifeline WA; Act Belong Commit

Page 7 Mental Health Commission | 2016/17 Annual Report
$383.7million
$44.6million
$367.8million
Hospital-Based Services• $330 million in mental health inpatient
services across Western Australia• new contracts established with the five
State Health Service Providers• expansion of existing Next Step Drug and
Alcohol Services clinical liaison inreachmodel into Rockingham Hospital
• 12 youth beds opened, bringing the totalcapacity of youth, child and adolescentbeds across the system to 39
$OUT
AGENCY PERFORMANCE SIGNIFICANT ISSUESDISCLOSURES AND
LEGAL COMPLIANCEAPPENDICES
Community Bed-Based Services•
•
•
•
additional 60 AOD rehabilitation and withdrawal beds establishednew 10 bed community mental health step up/step down service in Rockingham, with 69 admissions since it opened in October 2016Joondalup step up/step down had 312 admissionsprogressed development ofstep up/step down services in Karratha, Bunbury and Broome
Community Treatment•
•
•
•
•
•
•
over 21,550 occasions of service through the Alcohol and Drug Support ServiceAOD treatment services to support the Alcohol Interlock Schemenew Next Step Methamphetamine Clinic establishedexpansion of the ALIVE program to provide services for people at risk of suicideexpansion of Community Alcohol and Drug Services across the State$321 million invested in public mental health non-admitted servicesnew Child, Adolescent and Youth Psychiatrist service in the Kimberley
TU$O
OVERVIEW
Page 8 Mental Health Commission | 2016/17 Annual Report
Operational Structure
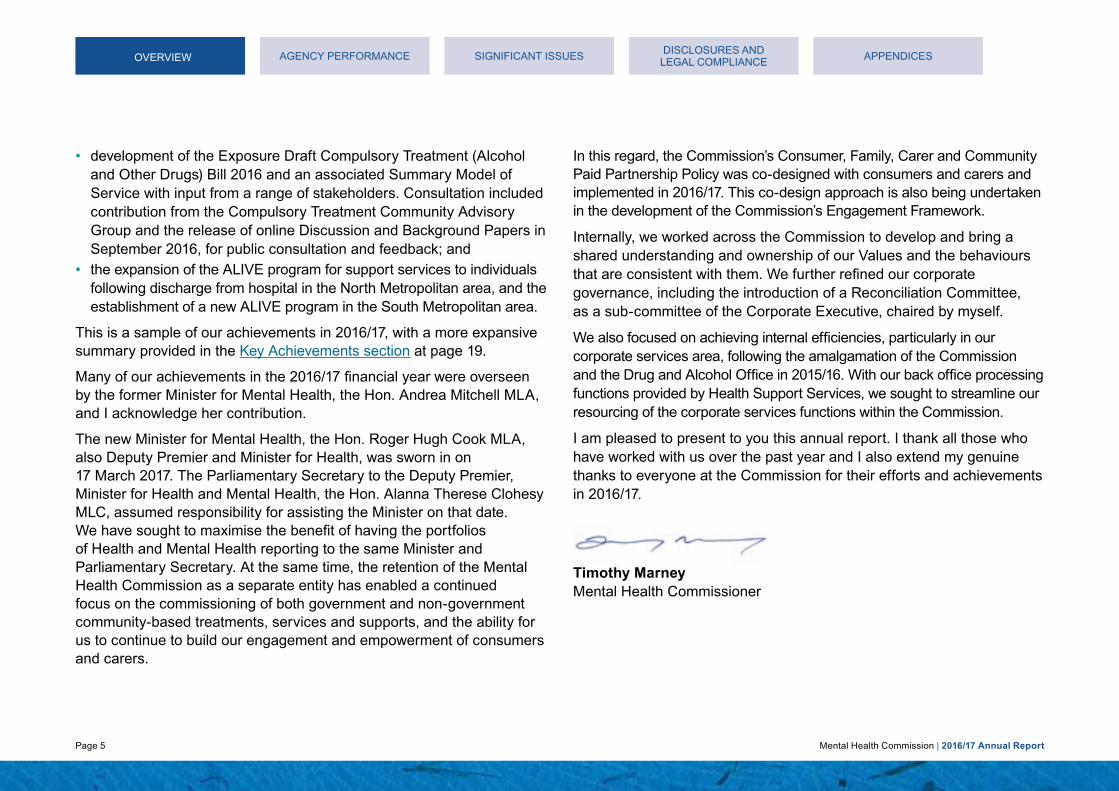
Hon. Roger Hugh Cook MLA
Responsible MinisterThe Commission is responsible to the Minister for Mental Health, the Hon. Roger Hugh Cook MLA, and is the government agency primarily assisting him in the administration of the mental health portfolio. The Minister is supported by the Parliamentary Secretary to the Minister for Mental Health.
Deputy Premier and Minister for Mental Health, the Hon. Roger Hugh Cook MLAHon. Roger Hugh Cook MLA is the Deputy Premier of Western Australia and has oversight of two key portfolios in health and mental health. He has been a member of the Legislative Assembly since 2008, representing the seat of Kwinana. Mr Cook served as Deputy Leader of the Opposition and Shadow Minister for Health from 2008 until March 2017, also having responsibility for other Shadow Ministry roles in Mental Health, Science and Indigenous Affairs. Mr Cook was sworn in as Deputy Premier, Minister for Health and Mental Health on 17 March 2017.
Parliamentary Secretary to the Deputy Premier and Minister for Mental Health, the Hon. Alanna Therese Clohesy MLCHon. Alanna Therese Clohesy MLC is the Parliamentary Secretary to the Deputy Premier and Minister for Mental Health. She has been a member of the Legislative Council since 2013, representing the East Metropolitan Region.
Accountable authorityThe Commission was established by the Governor in Executive Council under section 35 of the Public Sector Management Act 1994. The accountable authority of the Commission is the Mental Health Commissioner, Mr Timothy Marney.
AGENCY PERFORMANCE SIGNIFICANT ISSUESDISCLOSURES AND
LEGAL COMPLIANCEAPPENDICESOVERVIEW

Page 9 Mental Health Commission | 2016/17 Annual Report
Administered legislationThe Commission is the agency principally assisting the Minister for Mental Health in the administration of the Mental Health Act 2014 and the Alcohol and Other Drugs Act 1974.
Other key legislationThe Commission is required to comply with a range of laws including:Auditor General Act 2006Carers Recognition Act 2004Corruption, Crime and Misconduct Act 2003Disability Services Act 1993Equal Opportunity Act 1984Financial Management Act 2006Freedom of Information Act 1992Health and Disability Services (Complaints) Act 1995Health Services Act 2016Industrial Relations Act 1979Minimum Conditions of Employment Act 1993Occupational Safety and Health Act 1984Private Hospitals and Health Services Act 1927Public Interest Disclosure Act 2003Public Sector Management Act 1994Salaries and Allowances Act 1975State Records Act 2000State Superannuation Act 2000State Supply Commission Act 1991Workers’ Compensation and Injury Management Act 1981
AGENCY PERFORMANCE SIGNIFICANT ISSUESDISCLOSURES AND
LEGAL COMPLIANCEAPPENDICESOVERVIEW
Page 10 Mental Health Commission | 2016/17 Annual Report
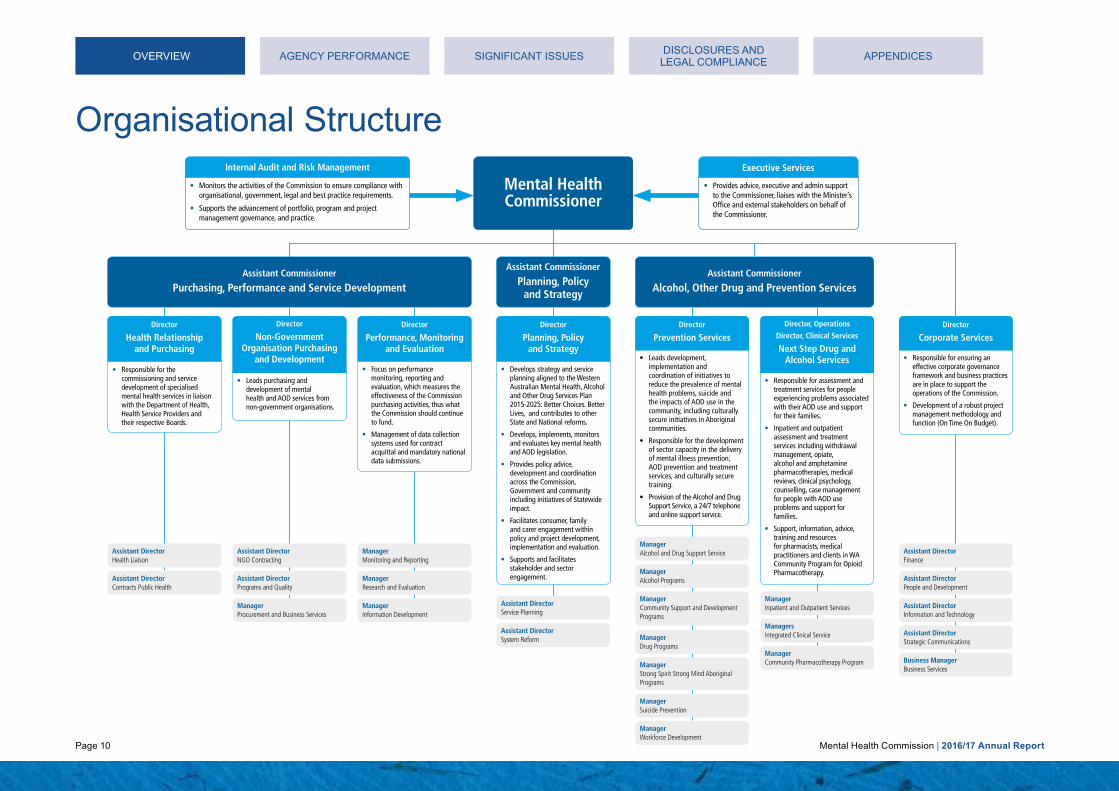
Organisational Structure
Mental Health Commissioner
Assistant Commissioner
Purchasing, Performance and Service DevelopmentAssistant Commissioner
Alcohol, Other Drug and Prevention Services
Director
Non-Government Organisation Purchasing
and Development
Director, OperationsDirector, Clinical Services
Next Step Drug and Alcohol Services
Director
Prevention ServicesDirector
Corporate ServicesDirector
Performance, Monitoring and Evaluation
Director
Planning, Policy and Strategy
Director
Health Relationship and Purchasing
Assistant Commissioner
Planning, Policy and Strategy
• Responsible for the commissioning and service development of specialised mental health services in liaisonwith the Department of Health, Health Service Providers and their respective Boards.
• Leads purchasing and development of mental health and AOD services from non-government organisations.
• Focus on performance monitoring, reporting and evaluation, which measures the effectiveness of the Commission purchasing activities, thus what the Commission should continueto fund.
• Management of data collection systems used for contract acquittal and mandatory national data submissions.
• Develops strategy and service planning aligned to the Western Australian Mental Health, Alcoholand Other Drug Services Plan 2015-2025: Better Choices. Better Lives, and contributes to other State and National reforms.
• Develops, implements, monitors and evaluates key mental healthand AOD legislation.
• Provides policy advice, development and coordination across the Commission, Government and community including initiatives of Statewideimpact.
• Facilitates consumer, family and carer engagement within policy and project development, implementation and evaluation.
• Supports and facilitates stakeholder and sector engagement.
• Leads development, implementation and coordination of initiatives to reduce the prevalence of mental health problems, suicide and the impacts of AOD use in the community, including culturally secure initiatives in Aboriginal communities.
• Responsible for the development of sector capacity in the delivery of mental illness prevention, AOD prevention and treatment services, and culturally secure training.
• Provision of the Alcohol and DrugSupport Service, a 24/7 telephone and online support service.
ManagerAlcohol and Drug Support Service
ManagerSuicide Prevention
ManagerWorkforce Development
ManagerInpatient and Outpatient Services
Assistant DirectorService Planning
Assistant DirectorPrograms and Quality
Assistant DirectorContracts Public Health
ManagerProcurement and Business Services
ManagerMonitoring and Reporting
Assistant DirectorNGO Contracting
Assistant DirectorHealth Liaison
ManagerResearch and Evaluation
ManagerInformation Development
Assistant DirectorSystem Reform
Assistant DirectorFinance
Assistant DirectorPeople and Development
Assistant DirectorInformation and Technology
Assistant DirectorStrategic Communications
Business ManagerBusiness Services
ManagerCommunity Pharmacotherapy Program
ManagersIntegrated Clinical Service
ManagerCommunity Support and Development Programs
ManagerAlcohol Programs
ManagerStrong Spirit Strong Mind Aboriginal Programs
ManagerDrug Programs
• Responsible for assessment and treatment services for people experiencing problems associatedwith their AOD use and support for their families.
• Inpatient and outpatient assessment and treatment services including withdrawal management, opiate, alcohol and amphetamine pharmacotherapies, medical reviews, clinical psychology, counselling, case managementfor people with AOD use problems and support for families.
• Support, information, advice, training and resources for pharmacists, medical practitioners and clients in WA Community Program for Opioid Pharmacotherapy.
• Responsible for ensuring an effective corporate governance framework and business practices are in place to support the operations of the Commission.
• Development of a robust project management methodology and function (On Time On Budget).
Internal Audit and Risk Management
• Monitors the activities of the Commission to ensure compliance with organisational, government, legal and best practice requirements.
• Supports the advancement of portfolio, program and projectmanagement governance, and practice.
Executive Services
• Provides advice, executive and admin support to the Commissioner, liaises with the Minister’sOffice and external stakeholders on behalf of the Commissioner.
AGENCY PERFORMANCE SIGNIFICANT ISSUESDISCLOSURES AND
LEGAL COMPLIANCEAPPENDICESOVERVIEW

Page 11 Mental Health Commission | 2016/17 Annual Report
Commissioner for Mental Health Timothy MarneyMr Marney was appointed as Mental Health Commissioner in February 2014. He joined the Western Australian Department of Treasury in 1993, where he held the position of Under Treasurer from 2005 to 2014. In this role, he gained an in-depth understanding of the health system and health reform initiatives, as well as government procurement policies and practices. As the Mental Health Commissioner, Mr Marney is responsible for planning and commissioning the State’s mental health and AOD services. Mr Marney also has lived experience of mental health issues.
David Axworthy / Julia Knapton (Acting) Assistant Commissioner, Planning, Policy and StrategyThis area develops strategy and service planning aligned to the Western Australian Mental Health, Alcohol and Other Drug Services Plan 2015-2025: Better Choices. Better Lives, and contributes to other State and National strategies and reforms. It develops, implements, monitors and evaluates key mental health and AOD legislation and provides policy advice, development and coordination across the Commission, government and community, including initiatives of Statewide impact. This area also facilitates consumer, family and carer engagement within policy and project development, implementation and evaluation, and supports and facilitates stakeholder and sector engagement.
AGENCY PERFORMANCE SIGNIFICANT ISSUESDISCLOSURES AND
LEGAL COMPLIANCEAPPENDICESOVERVIEW

Page 12 Mental Health Commission | 2016/17 Annual Report
Elaine Paterson Assistant Commissioner, Purchasing, Performance and Service DevelopmentThis area leads the contracts for commissioning and management of services purchased by the Commission. It is fundamental to the development, delivery and quality improvement of services. This area is responsible for contract governance, performance monitoring and evaluation. It drives improved service outcomes with an emphasis on integrated and person-centred approaches.
Sue Jones Assistant Commissioner, Alcohol, Other Drug and Prevention ServicesThis area leads the provision of AOD support services, prevention and clinical services. It shapes the development and delivery of prevention services, and treatment for people experiencing problems with AOD use, and leads the implementation of the suicide prevention strategy – Suicide Prevention 2020: Together we can save lives.
Barry Thomas Director, Corporate ServicesThis area is responsible for ensuring that effective and efficient corporate governance framework and business practices are in place to support the operations of the Commission. This area manages financial and staffing resources to ensure services are provided within budgetary, organisational and legislative constraints and in line with the Vision and Values of the Commission. Corporate services are also provided to the following independent entities – the Mental Health Tribunal, Mental HealthAdvocacy Service and the Office of the ChiefPsychiatrist.
AGENCY PERFORMANCE SIGNIFICANT ISSUESDISCLOSURES AND
LEGAL COMPLIANCEAPPENDICESOVERVIEW

Page 13 Mental Health Commission | 2016/17 Annual Report
Agency Performance
OVERVIEW AGENCY PERFORMANCE SIGNIFICANT ISSUESDISCLOSURES AND
LEGAL COMPLIANCEAPPENDICESAGENCY PERFORMANCE

Page 14 Mental Health Commission | 2016/17 Annual Report
AGENCY PERFORMANCE
Performance Summaries – Report On OperationsSummary of financial performanceThe tables below provide an overview of the Commission’s financial performance. The detailed information and notes are provided in the Financial Statements section from page 50.
FINANCIAL TARGET2016/17
BUDGET $’000
2016/17 ACTUAL
$’000
VARIATION $’000
Total cost of service (expense limit)
865,772 863,107 (2,665)
Net cost of services 683,050 694,582 11,532
Total equity 43,079 47,424 4,345
Net increase/(decrease) in cash held
(6,179) (12) 6,167
STAFFING2016/17
BUDGET2016/17 ACTUAL
VARIATION
Approved full-time equivalent staff level (including independent entities)
304 303 -1
Working cash targets
2016/17 AGREED LIMIT
$’000
2016/17 TARGET / ACTUAL
$’000
VARIATION $’000
Agreed Working Cash Limit (At Budget) 43,264 43,264 N/A
Agreed Working Cash Limit (At Actuals) 43,316 42,951 365
OVERVIEW SIGNIFICANT ISSUESDISCLOSURES AND
LEGAL COMPLIANCEAPPENDICES

Page 15 Mental Health Commission | 2016/17 Annual Report
AGENCY PERFORMANCE
Summary of key effectiveness and efficiency indicatorsThe Commission reports each year on efficiency and effectiveness indicators that contribute to its agency outcomes. A summary of its performance is provided in the table below. More detailed information and analysis of its efficiency and effectiveness indicators are provided in the Key Performance Indicators section from page 101.
KEY EFFECTIVENESS INDICATOR2016/17 TARGET
2016/17 ACTUAL
Outcome 1 – Promote mental health and wellbeing
1.1 Percentage of the Western Australian population with high or very high levels of psychological distress compared to the percentage reported nationally
-1.8% -1.8%
Outcome 2 – Reduced incidence of use and harm associated with AOD use
2.1 Percentage of the Western Australian population aged 14 years and over reporting recent use of illicit drugs and the percentage reporting use of alcohol at risky levels compared to the percentage reported nationally
Illicits +2.0% Alcohol +3.4%
Illicits +2.0% Alcohol +3.4%
2.2 Percentage of correct take out messages for AOD campaigns among target population Alcohol 72.8% Meth 34.6%
Alcohol 39.2% Meth 38.2%
Outcome 3 – Accessible, high quality and appropriate mental health and AOD treatments and supports
3.1 Re-admissions to hospital within 28 days of discharge from acute specialised mental health units (national indicator) ≤ 12.0% 17.1%
3.2 Percentage of contacts with community-based public mental health non-admitted services within seven days post discharge from public mental health inpatient units (national indicator)
≥ 70.0% 64.1%
3.3 Percentage of closed AOD treatment episodes completed as planned ≥ 76.0% 73.5%
3.4 Percentage of non-government organisations contracted to provide mental health services that met the National Standards for Mental Health Services (2010) through independent evaluation
100.0% 77.8%
3.5 Percentage of the population receiving public clinical mental health care (national indicator) ≥ 2.2% 2.3%
OVERVIEW SIGNIFICANT ISSUESDISCLOSURES AND
LEGAL COMPLIANCEAPPENDICES

Page 16 Mental Health Commission | 2016/17 Annual Report
AGENCY PERFORMANCE
KEY EFFICIENCY INDICATOR2016/17 TARGET
2016/17 ACTUAL
Service 1 – Prevention
1.1 Cost per capita to enhance mental health and wellbeing and prevent suicide (illness prevention, promotion and protection activities)
$4.44 $4.10
1.2 Cost per capita of the Western Australian population 14 years and above for initiatives that delay the uptake and reduce the harm associated with alcohol and other drugs
$3.57 $4.78
1.3 Cost per person of AOD campaign target groups who are aware of, and correctly recall, the main campaign messages
Alcohol $0.68 Meth $1.27
Alcohol $0.89 Meth $1.19
Service 2 – Hospital Bed-Based Services
2.1 Average length of stay in purchased acute specialised mental health units < 15.0 days 14.9 days
2.2 Average cost per purchased bedday in acute specialised mental health units $1,441 $1,489
2.3 Average length of stay in purchased sub-acute specialised mental health units < 103.0 days 105.8 days
2.4 Average cost per purchased bedday in sub-acute specialised mental health units $1,383 $1,419
2.5 Average length of stay in purchased hospital in the home mental health units < 22.0 days 23.7 days
2.6 Average cost per purchased bedday in hospital in the home mental health units $1,393 $1,352
2.7 Average length of stay in purchased forensic mental health units < 50.0 days 34.3 days
2.8 Average cost per purchased bedday in forensic mental health units $1,310 $1,338
OVERVIEW SIGNIFICANT ISSUESDISCLOSURES AND
LEGAL COMPLIANCEAPPENDICES

Page 17 Mental Health Commission | 2016/17 Annual Report
AGENCY PERFORMANCE
KEY EFFICIENCY INDICATOR2016/17 TARGET
2016/17 ACTUAL
Service 3 – Community Bed-Based Services
3.1 Average cost per purchased bedday in non-acute (24 hours support) community bed-based services $240 $239
3.2 Average cost per purchased bedday in non-acute (hospital/nursing home) community bed-based units $230 $213
3.3 Average cost per purchased bedday in step-up/step-down community bed-based units $628 $643
3.4 Cost per completed treatment episode in AOD residential rehabilitation services $9,291 $10,140
Service 4 – Community Treatment
4.1 Average cost per purchased treatment day of ambulatory care provided by public clinical mental health services (national indicator)
$491 $470
4.2 Average treatment days per episode of ambulatory care provided by public clinical mental health services (national indicator)
< 5.00 days 4.87 days
4.3 Cost per completed treatment episode in community-based AOD services $1,705 $1,680
Service 5 – Community Support
5.1 Average cost per hour for community support provided to people with mental health problems $130 $144
5.2 Average cost per episode of community support provided for AOD services $9,277 $8,672
5.3 Average cost per package of care provided for the Individualised Community Living Strategy $71,325 $42,150
5.4 Cost per episode of care in safe places for intoxicated people $361 $342
OVERVIEW SIGNIFICANT ISSUESDISCLOSURES AND
LEGAL COMPLIANCEAPPENDICES

Page 18 Mental Health Commission | 2016/17 Annual Report
AGENCY PERFORMANCE
Summary of specialised services and activity contracted by the Commission
$4.10 per capita to enhance mental health and prevent suicide
$4.78 per capita for initiatives that delay uptake and reduce AOD harm
Community Support$46.5 million
Community Treatment$383.7 million
Community Bed-Based Services $44.6 million
Hospital Bed-Based Services$367.8 million
OVERVIEW SIGNIFICANT ISSUESDISCLOSURES AND
LEGAL COMPLIANCEAPPENDICES
Prevention$20.6 million
Mental health community support services
AOD transitional housing and support
Individualised Community Living Strategy
Safe places for intoxicated people
Ambulatory care by public clinical mental health services
AOD community-based services
Non-acute (24 hours support)
Non-acute (hospital/nursing home)
step up/step down
AOD residential rehabilitation
Acute
Sub-acute
Hospital in the Home
Forensic
173,558 hours of support
59 completed treatment episodes
148 packages
182 beds and 18,647 episodes of care
689,616 treatment days
21,307 completed treatment episodes and 8,425 ADSS calls
88,330 beddays
7,990 beddays
7,725 beddays
441 beds and 1,579 closed treatment episodes
621 beds and 200,444 beddays
87 beds and 27,585 beddays
48 beds and 10,555 beddays
37 beds and 11,978 beddays
Page 19 Mental Health Commission | 2016/17 Annual Report
AGENCY PERFORMANCE
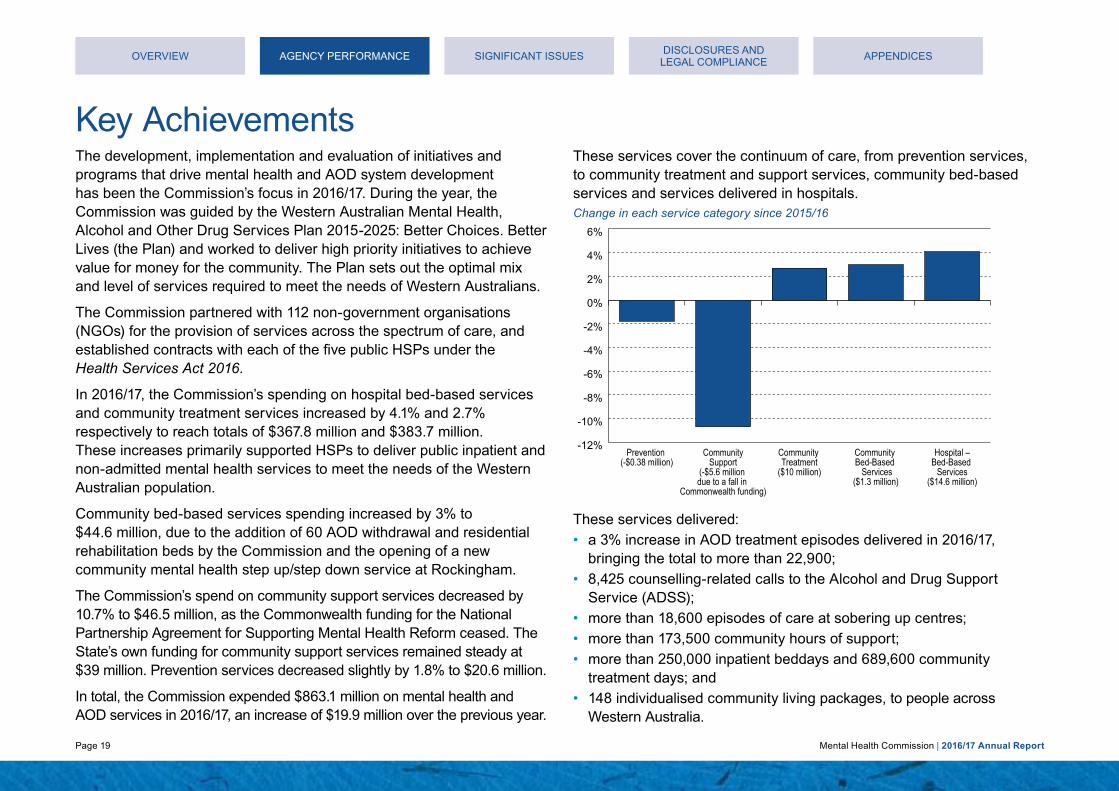
Key AchievementsThe development, implementation and evaluation of initiatives and programs that drive mental health and AOD system development has been the Commission’s focus in 2016/17. During the year, the Commission was guided by the Western Australian Mental Health, Alcohol and Other Drug Services Plan 2015-2025: Better Choices. Better Lives (the Plan) and worked to deliver high priority initiatives to achieve value for money for the community. The Plan sets out the optimal mix and level of services required to meet the needs of Western Australians.
The Commission partnered with 112 non-government organisations (NGOs) for the provision of services across the spectrum of care, and established contracts with each of the five public HSPs under the Health Services Act 2016.
In 2016/17, the Commission’s spending on hospital bed-based services and community treatment services increased by 4.1% and 2.7% respectively to reach totals of $367.8 million and $383.7 million. These increases primarily supported HSPs to deliver public inpatient and non-admitted mental health services to meet the needs of the Western Australian population.
Community bed-based services spending increased by 3% to $44.6 million, due to the addition of 60 AOD withdrawal and residential rehabilitation beds by the Commission and the opening of a new community mental health step up/step down service at Rockingham.
The Commission’s spend on community support services decreased by 10.7% to $46.5 million, as the Commonwealth funding for the National Partnership Agreement for Supporting Mental Health Reform ceased. The State’s own funding for community support services remained steady at $39 million. Prevention services decreased slightly by 1.8% to $20.6 million.
In total, the Commission expended $863.1 million on mental health and AOD services in 2016/17, an increase of $19.9 million over the previous year.
These services cover the continuum of care, from prevention services, to community treatment and support services, community bed-based services and services delivered in hospitals.Change in each service category since 2015/16
-12%
-10%
-8%
-6%
-4%
-2%
0%
2%
4%
6%
Hospital –Bed-Based
Services($14.6 million)
Community Bed-Based Services
($1.3 million)
Community Treatment
($10 million)
CommunitySupport
(-$5.6 million due to a fall in
Commonwealth funding)
Prevention (-$0.38 million)
These services delivered:• a 3% increase in AOD treatment episodes delivered in 2016/17,
bringing the total to more than 22,900;• 8,425 counselling-related calls to the Alcohol and Drug Support
Service (ADSS);• more than 18,600 episodes of care at sobering up centres;• more than 173,500 community hours of support;• more than 250,000 inpatient beddays and 689,600 community
treatment days; and• 148 individualised community living packages, to people across
Western Australia.
OVERVIEW SIGNIFICANT ISSUESDISCLOSURES AND
LEGAL COMPLIANCEAPPENDICES

Page 20 Mental Health Commission | 2016/17 Annual Report
AGENCY PERFORMANCE
PreventionThe Commission invested $20.6 million in prevention services during 2016/17, to assist Western Australians in improving mental health and reducing the risk of mental illness, suicide and AOD related harms.
The Commission established 10 new Suicide Prevention Community Coordinator positions across the State through purchasing from NGOs and the WA Country Health Service (WACHS). These positions act as the central point for communication, to assist services on the ground to work in partnership to improve support and care for those affected by suicide and intentional self-harm.
A new contract was established with the Aboriginal Health Council of Western Australia (AHCWA), the peak body for Aboriginal Medical Services in the State. AHCWA will deliver a social and emotional wellbeing training package for Aboriginal people across Western Australia, incorporating recommendations from the Aboriginal and Torres Strait Islander Suicide Prevention Evaluation Project and the National Aboriginal Torres Strait Islander Suicide Prevention Strategy.
The Commission also contracted the Regional Men’s Health Initiative as part of the Suicide Prevention 2020: Together we can save lives strategy, to provide mental health and wellbeing, and suicide prevention education to men in farming communities across Western Australia.
In 2016/17, the Commission continued to deliver its successful Statewide AOD public education campaigns Drug Aware, Alcohol.Think Again and Strong Spirit Strong Mind Metro Project that prevent and reduce harm attributable to AOD use. The campaigns include public awareness education and training, television advertisements, digital media, radio and outdoor media.
Highlights in 2016/17 included:• the Drug Aware Meth Can Take Control campaign achieved greater
awareness than any previous Drug Aware campaign in its first year,with 53% of the target group aware of the campaign, and 90% ofthose aware correctly understanding the campaign messages.This campaign was recognised at the 2017 Campaign Brief Awards,where its ‘The Law’ video won the 2016 Best Of The Year CreativeAward for the Cinema/Television commercial category;
FOR FREE PROFESSIONAL COUNSELLING AND ADVICE CALL THE METH HELPLINE ON 1800 874 878 OR VISIT DRUGAWARE.COM.AU
METH CAN TAKE CONTROL
Meth Can Take Control campaign poster
OVERVIEW SIGNIFICANT ISSUESDISCLOSURES AND
LEGAL COMPLIANCEAPPENDICES
Page 21 Mental Health Commission | 2016/17 Annual Report
AGENCY PERFORMANCE
• an independent post-campaign evaluation of 155 young Aboriginalpeople found 83% were more aware of AOD harms as a result of theStrong Spirit Strong Mind Metro Project campaign, and 73% wereexposed to the campaign at least once;
• a 2017 National Health and Medical Research Council fundedstudy by the Cancer Council Victoria identified the Commission’sAlcohol.Think Again advertisements ‘Cancer – Spread’ and ‘What youcan’t see’, as the two most likely campaigns, worldwide, to motivatepeople to reduce the amount of alcohol they drink; and
• Western Australia recorded significantly greater awareness of thenational low-risk drinking guidelines than other jurisdictions in the2017 Foundation for Alcohol Research and Education (FARE) AnnualAlcohol Poll, with 73% of participants in Western Australia aware ofthe guidelines (compared with the Australian average of 58%) and85% of participants in Western Australia knowing that the safest optionis to not drink any alcohol at all when pregnant (compared with an80% Australian average).
The Commission invested $6.7 million in community-based prevention services provided by non-government organisations in 2016/17. These initiatives support promotion of mental health and work to reduce suicide and AOD harms in the community. Initiatives supported included:• Mental Health Week 2016;• MATES in Construction, which is a mental health initiative for the
Western Australian building and construction industry;• Act Belong Commit;• beyondblue (please note Related Party Disclosures on page 165);• Lifeline WA; and• School Drug Education and Road Aware (SDERA) program.
The full list is available in Appendix One on page 169.
OVERVIEW SIGNIFICANT ISSUESDISCLOSURES AND
LEGAL COMPLIANCEAPPENDICES

Page 22 Mental Health Commission | 2016/17 Annual Report
AGENCY PERFORMANCE
In 2016/17, the Commission supported the development and implementation of 32 Alcohol and Other Drug Management Plans (AODMPs) across Western Australia. Prevention Plans were developed and led by local service providers to prevent and reduce AOD related harms, with 31 plans developed regionally and one in the metropolitan area.
The Commission’s Community Support and Development Programs (CSDP) team was engaged to assist with the development of five new AODMPs in 2016/17 to address local AOD harm. The CSDP team supported the review of a further four AODMPs and provided ongoing support in planning, development, implementation and review of the other AODMPs at a local level across Western Australia. This included:• facilitation of planning meetings to identify issues and stakeholder
roles;• support with the development of AODMPs and strategies;• targeted capacity building at a local, regional and State level for key
community stakeholders and relevant service providers including23 training sessions;
• providing support to local media and communications campaigns toreduce local AOD harm; and
• support with seeking funding for local activity.
The Commission also provided advice to community groups, government agencies and NGOs on policy-based actions that reduce alcohol-related harm. The Commission:• monitored liquor licence applications across the State and investigated
209 matters regarding the potential for, and minimisation of,alcohol-related harm and ill-health;
• made 65 submissions to inform the Director of Liquor LicencingAuthority about alcohol-related harm or ill-health matters associatedwith particular liquor licence applications;
• made two submissions to inquiries examining whether it was in thepublic interest to strengthen existing liquor restrictions to reducealcohol-related harm in Kununurra, Wyndham and surroundingcommunities and in Port and South Hedland; and
• worked with the Western Australian Local Government Association onthe development and training of the Local Government Town PlanningGuideline for Alcohol Outlets.
The Commission commenced the development of a Mental Health Promotion, Mental Illness and Alcohol and Other Drug Prevention Plan (the Prevention Plan) in 2016/17. The aim of the Plan is to provide guidance in the recommended evidence-informed programs, strategies and initiatives to prevent and reduce harmful AOD use, and promote optimal mental health in the Western Australian community.
Community support, treatment and bed-based servicesThe Commission invested $474.7 million in public and non-government community services in 2016/17, an increase of 1.2% since 2015/16.
This included an extra $4.85 million to establish new community initiatives under the Western Australian Meth Strategy 2016 and additional funding through Suicide Prevention 2020: Together we can save lives. The full list of services funded is available at Appendix One. Achievements included:• a new community mental health step up/step down service was opened
in Rockingham in October 2016, providing an additional 10 beds.
OVERVIEW SIGNIFICANT ISSUESDISCLOSURES AND
LEGAL COMPLIANCEAPPENDICES

Page 23 Mental Health Commission | 2016/17 Annual Report
AGENCY PERFORMANCE
Mind Australia was contracted to provide recovery-oriented support services in partnership with the South Metropolitan Health Service (SMHS), that was contracted to provide the clinical mental health in-reach service. The service had 69 admissions in its first nine months of operation;
• the State’s first step up/step down service at Joondalup had 312admissions (an average of 26 per month) in 2016/17. Of these,approximately 99% of people ‘stepping up’ were transitionedback into the community and did not require hospital admission(1% were admitted to an inpatient facility). At the end of ‘steppingdown’, approximately 98% were transitioned to the community(2% returned to an inpatient facility);
• the Commission progressed projects to establish step up/step downservices in Karratha (six beds), Bunbury (10 beds) and Broome(six beds), with extensive community consultation undertaken thisfinancial year;
• a targeted round of suicide prevention grants totalling $239,000 wasreleased in 2016/17, which resulted in funding for 14 communityinitiatives delivered to communities. Grant recipients are deliveringpeer support and/or mentoring projects for at-risk communities(Aboriginal people, youth, and the lesbian, gay, bisexual, transgenderand intersex (LGBTI) community);
• the ALIVE postvention program was expanded through an enhancedcontract with 360 Health, to provide additional services for peopleidentified as being at risk of suicide following presentation to hospitalsat Joondalup, and establish new services linked to Armadale,Fremantle and Rockingham hospitals;
• the Commission procured an additional 52 residential rehabilitationbeds (ten beds in the North Metropolitan area, 14 beds in the SouthMetropolitan area and 28 regional beds) and eight low medical
withdrawal beds (four metropolitan beds and four regional beds). These beds delivered an estimated 228 methamphetamine treatment episodes, in addition to the almost 1,300 already provided through existing services, which is an 18% increase;
• the Commission expanded existing Community Alcohol and DrugServices (CADS) across the state through an additional 13 communitytreatment full time positions to provide additional prevention andoutpatient services, including for methamphetamine issues; and
• the Commission procured a Statewide network of treatmentproviders, in anticipation of referrals from the State Government’snew mandatory performance-based Alcohol Interlock Scheme(the Scheme) to provide Alcohol Assessment and Treatment to roadtraffic offenders. The Commission’s Alcohol and Drug Support Servicedatabase was also updated to support a centralised booking service tolink Scheme participants with treatment providers.
Community mental health step up/step down service in Rockingham
OVERVIEW SIGNIFICANT ISSUESDISCLOSURES AND
LEGAL COMPLIANCEAPPENDICES

Page 24 Mental Health Commission | 2016/17 Annual Report
AGENCY PERFORMANCE
Step up/step down mental health services are delivered in the community, close to an individual’s personal supports including family and friends.
Step up/step down services are staffed 24/7 and provide short term recovery-oriented care and residential support, following discharge from hospital or to those in the community who are experiencing a deterioration in their mental health but do not require hospitalisation. The model has been successfully implemented in Rockingham and Joondalup.
Although individuals can stay for up to 28 days, the average length of stay in a step up/step down service is 17 to 24 days. During their stay, support workers facilitate residents to engage in individual and group activities (including counselling) towards their mental health recovery. This is achieved by identifying the person’s own strengths, values and goals, to increase personal autonomy, confidence and self-belief to live independently in their own community. Individuals also participate in a number of daily activities, which include preparing their own meals, yoga, arts and crafts, tennis and other recreational activities to support their recovery.
In 2016/17, the community mental health step up/step down service in Joondalup had 312 admissions. Of these, approximately
99% of people ‘stepping up’ were transitioned back into the community and did not require hospital admission (1% were
admitted to an inpatient facility). At the end of ‘stepping down’, approximately 98% were transitioned to the community
(2% returned to an inpatient facility)
Step up
Home/community
Step down
Hospital/inpatient
Community mental health
step up/step down service
in Joondalup
312admissions
Approximately 99% of people who stepped up transitioned back into the community
Approximately 98% of people who stepped
down transitioned into the community
89 admissions
223 admissions
OVERVIEW SIGNIFICANT ISSUESDISCLOSURES AND
LEGAL COMPLIANCEAPPENDICES

Page 25 Mental Health Commission | 2016/17 Annual Report
AGENCY PERFORMANCE
The Commission invested $321 million in public specialised mental health non-admitted services in the community in 2016/17, through contracts with each of the State’s Health Service Providers (HSPs) – the Child and Adolescent Health Service (CAHS), North Metropolitan Health Service (NMHS), South Metropolitan Health Service (SMHS), East Metropolitan Health Service (EMHS) and WA Country Health Service (WACHS). More than 689,616 treatment days were provided by these services, which included core community services purchased by the Commission, and the following targeted initiatives:• Statewide Specialist Aboriginal Mental Health Service;• youth mental health services (including the regional Youth Mental
Health Program purchased through the WACHS, and YouthCommunity Treatment at Fiona Stanley Hospital);
• WA Eating Disorder Outreach Consultation Service;• Mental Health Court Diversion program;• Mental Health and Police Co-Response Trial;• Individualised Community Living Strategy;• School Suicide Response;• Gender Diversity Service;• Mobile Clinical Outreach Team;• regional Suicide Prevention Community Coordinators; and• services to the Rockingham step up/step down service.
A new specialist Child, Adolescent and Youth Psychiatrist service was established in the Kimberley through the WACHS. This commenced in January 2017 and expands the clinical, supervisory and coordinating capacity of mental health services for children and young people in the Kimberley.
The adult component of the Mental Health Court Diversion program, the Start Court, is based within the Central Law Courts in the Perth CBD. It is operated by a dedicated multi-disciplinary team that includes mental health clinical support from the NMHS.
OVERVIEW SIGNIFICANT ISSUESDISCLOSURES AND
LEGAL COMPLIANCEAPPENDICES

Page 26 Mental Health Commission | 2016/17 Annual Report
AGENCY PERFORMANCE
2016/17 expenditure on mental health non-admitted services provided by public Health Service Providers
Services to the Community
$321 million
Mental Health Commission non-admitted
funding
South Metropolitan
Health Service
$59.3 million
Child and Adolescent Health
Service
$45.5 million
WA Country Health Service
$66.5 million
East Metropolitan
Health Service
$68 million
North Metropolitan
Health Service
$81.4 million
OVERVIEW SIGNIFICANT ISSUESDISCLOSURES AND
LEGAL COMPLIANCEAPPENDICES

Page 27 Mental Health Commission | 2016/17 Annual Report
AGENCY PERFORMANCE
The Commission also directly provided approximately $18 million worth of AOD treatment and support services to Western Australians. Highlights included:• the Commission established and promoted the Meth Helpline to
provide free specialist information, support, counselling and referral forindividuals and families affected by methamphetamine use. The newMeth Helpline was promoted through television, radio, cinema,out-of-home and digital advertising. More than 1,500 calls werereceived to the Meth Helpline since it was launched on12 September 2016;
• the Commission provided over 21,550 occasions-of-service toWestern Australians through the four 24/7 telephone counselling,information, referral and support lines for AOD: the Parent and FamilyDrug Support line; Meth Helpline; Alcohol and Drug Support Line;and Working Away Alcohol and Drug Support Line. Of these,21% of contacts mentioned alcohol as the primary drug of concern,21% cannabis and 24% methamphetamine;
• the Commission established a specialist Methamphetamine Clinicin East Perth at Next Step to provide rapid assessment, earlyintervention and outpatient withdrawal for methamphetamine users.This model was replicated in Rockingham in May, with furtherexpansion planned for other metropolitan Community Alcohol andDrug Services (CADS);
• Next Step managed a significant increase in the number ofHepatitis C clients referred, tested and treated by Direct ActingAntiviral medications since they were listed on the PharmaceuticalBenefits Scheme in March 2016; and
• there were 636 admissions to the Next Step Inpatient Withdrawal Unit.During 2016/17, 77% of closed treatment episodes were completedas planned.
OVERVIEW SIGNIFICANT ISSUESDISCLOSURES AND
LEGAL COMPLIANCEAPPENDICES

Page 28 Mental Health Commission | 2016/17 Annual Report
AGENCY PERFORMANCE
Hospital-based servicesIn 2016/17 the Commission invested $330 million in public mental health inpatient services, through contracts with each of the State’s HSPs – the CAHS, NMHS, SMHS, EMHS and WACHS. More than 250,000 inpatient beddays were provided to people across metropolitan and regional areas via these services and the Commission’s high-medical AOD withdrawal service through Next Step.
The Commission worked with the CAHS and the SMHS to manage child, adolescent and youth mental health services, as ward movements occurred ahead of the future opening of the Perth Children’s Hospital. Following the closure of eight beds at Princess Margaret Hospital in March 2016, which was unforeseen by the Commission, seven additional beds were opened at the Bentley Adolescent Unit site, for individuals up to the age of 16 and clinically appropriate 17 year olds. The remaining six beds at the Fiona Stanley Hospital youth unit, were also opened in November 2016 to further assist with the treatment of 16 and 17 year olds.
The Commission expanded its existing Next Step clinical liaison inreach model at Joondalup Health Campus, into Rockingham Hospital. A clinical nurse inreach service was also established to service Bunbury Hospital through the South West CADS. These specialist support services provide timely review, support, information and referral options to individuals, family members and hospital staff related to AOD issues including methamphetamine.
This resulted in increased AOD interventions for patients presenting at emergency departments and mental health services and increased referrals to CADS. This model received acknowledgement at the Australasian Professional Society on Alcohol and other Drugs (APSAD) national conference in November 2016.
SMHS mental health services, such as at Rockingham Hospital, are funded through the Commission
OVERVIEW SIGNIFICANT ISSUESDISCLOSURES AND
LEGAL COMPLIANCEAPPENDICES

Page 29 Mental Health Commission | 2016/17 Annual Report
AGENCY PERFORMANCE
2016/17 expenditure on mental health inpatient services, provided by public Health Service Providers
Services to the Community
$330 million
Mental Health Commission
inpatient funding
South Metropolitan
Health Service
$54.4 million
Child and Adolescent Health
Service
$13.1 million
WA Country Health Service
$28.4 million
East Metropolitan
Health Service
$89.8 million
North Metropolitan
Health Service
$144.3 million
OVERVIEW SIGNIFICANT ISSUESDISCLOSURES AND
LEGAL COMPLIANCEAPPENDICES

Page 30 Mental Health Commission | 2016/17 Annual Report
AGENCY PERFORMANCE
Forensic servicesThe Commission enhanced specialised forensic community services in 2016/17. Highlights included:• a dedicated stream for individuals with co-occurring AOD problems
was introduced, to enable individuals to be assessed and referred to specialist AOD drug treatment providers from the Start Court;
• 385 referrals to the Start Court. Where clinical data was available, 89% of the cases that exited the program experienced improvement in their mental health and/or AOD issues;
• two additional consumer and carer representatives were recruited to the Start Court Operational Committee;
• the Links Clinical Assessment Team in the Children’s Court provided advice, assessment or assistance in 466 cases during 2016/17 to young people appearing before the Children’s Court;
• collaboration with the former Department of Corrective Services and the NMHS to develop and establish a new forensic mental health prison in-reach transition service from February 2017 across several metropolitan prisons. This service assists prisoners who experience severe and enduring mental illness with complex co-morbidity, in preparing for release. It also facilitates transitions between prison and community mental health services; and
• over 2,930 bookings Statewide, for WA Police and other diversionary programs including the Cannabis Intervention Requirement, Other Drug Requirement, and the Alcohol Assessment and Treatment component of the Alcohol Interlock Scheme.
System wide reformRecovery-oriented practiceDuring 2016/17, the Commission and Self Management and Recovery Training (SMART) Recovery worked in partnership to provide facilitator training to Parents and Family Drug Support (PFDS) coordinators, and Alcohol and Drug Support Service staff and peer parent volunteers, to enable Be SMART recovery groups to be run by PFDS. SMART Recovery supports people with AOD issues in a recovery focused, goal orientated group process. The Be SMART groups are for parents, other family members and significant others impacted by the AOD issues of a loved one.
Consumer, carer and family engagementThe Commission strengthened engagement with consumers, families and carers in many areas of its work in 2016/17. Engagement has included:• the development and implementation of its Consumer, Family, Carer
and Community Paid Partnership Policy. The co-produced Policy adopts a tiered participation payment approach and has seen the Commission provide advice and support to a range of external stakeholders, around consumer, family and carer engagement in the health, disability and education sectors;
• a dedicated 12 person Community Advisory Group to guide the development of the Exposure Draft Compulsory Treatment (Alcohol and Other Drugs) Bill 2016;
• contribution from 25 active participants in an Accommodation and Support Strategy Consumer, Carer and Family Workshop;
• in partnership with Consumers of Mental Health WA, 20 students received scholarships to complete the Certificate IV Peer Work qualification through North Metropolitan TAFE;
OVERVIEW SIGNIFICANT ISSUESDISCLOSURES AND
LEGAL COMPLIANCEAPPENDICES
Page 31 Mental Health Commission | 2016/17 Annual Report
AGENCY PERFORMANCE
• providing funding to the Health Consumers Council to progress AOD consumer involvement by developing a principles and strategies document;
• establishment of a trial, in partnership with Helping Minds, of the Practical Guide to Working with Carers for mental health services;
• the appointment of a Consumer Co-chair to the Next Step Consumer Involvement Committee and commencement of the development of a co-designed training package specific to AOD consumer representatives; and
• a steering committee was convened and co-chaired by a consumer/carer representative, to develop a Statewide engagement framework to ensure consumers, families, carers and community members actively and effectively participate in the Commission’s work.
Bringing everyone together The Mental Health Network, is a co-sponsored project between the Western Australian Department of Health and the Commission and comprises approximately 1,600 members, 10 steering groups and sub-networks.
The Network brings together NGO service providers, clinicians, consumers and carers from all areas across the mental health sector and community to collaboratively facilitate policy and increase coordination of care.
In the past year, four new sub-networks have been established to address specific issues relating to personality disorders, neuropsychiatry and developmental disability, multicultural mental health and older adult mental health. Over 30 priority projects that aim to improve outcomes for people with mental health conditions and reform the mental health sector are being progressed by the Mental Health Network.
Support to independent entitiesThe Commission provided corporate services to the Mental Health Advocacy Service, the Mental Health Tribunal and the Office of the Chief Psychiatrist. This included services and support in the areas of finance, human resources, information technology and facilities management.
Aboriginal PeoplePlease refer to the Workforce Development (page 35), Reconciliation Action Plan (page 166), Prevention (page 20) and Services in the community (page 22) sections for the range of programs undertaken by the Commission in 2016/17 in support of Aboriginal people and communities.
All services funded by the Commission are required to be able to demonstrate how they respond to cultural and social diversity, including for Aboriginal people, through the Commission’s Quality Evaluation and Accreditation processes for mental health and AOD services. The Mental Health Act 2014 also requires that assessment, examination and treatment for Aboriginal people should be in collaboration with Aboriginal mental health workers, their family and community, including elders and traditional healers, and cater for cultural and spiritual beliefs and practices, wherever appropriate.
System integration and navigationThe Commission is working with the Western Australian Primary Health Alliance (WAPHA) to co-plan and co-commission services where possible, with the aim that investment is coordinated and contributes to an effective and coherent system of services. One project that the WAPHA has been leading, supported by the Commission, is the development of a mental health and AOD Atlas of services in Western Australia. The aim of the Atlas is to provide a Statewide snapshot of the location and nature of mental health and AOD services across Western Australia. This will assist with the planning and commissioning of services, as well as providing the base information to contribute to initiatives to assist clinicians, consumers and carers in navigating the system.
OVERVIEW SIGNIFICANT ISSUESDISCLOSURES AND
LEGAL COMPLIANCEAPPENDICES

Page 32 Mental Health Commission | 2016/17 Annual Report
AGENCY PERFORMANCE
New Mental Health Commission website
The Commission developed a new website at www.mhc.wa.gov.au in 2016/17 that provides an integrated and up-to-date source of information, for both the community, and the mental health and AOD sector. The website was launched in early 2017 and includes content on health and wellbeing; information and contact details for treatment and support services in Perth and regional areas; and information about the Commission and its role. The new website brings together mental health and AOD resources in one place.
Proposed compulsory alcohol and other drug treatment legislationA Compulsory Alcohol and Other Drug Treatment Program was proposed for Western Australia in the Western Australian Mental Health, Alcohol and Other Drug Services Plan 2015-2025: Better Choices. Better Lives, to facilitate short-term compulsory treatment, stabilisation, care and support for people with a severe AOD problem.
In the 2016/17 financial year, the Commission developed an Exposure Draft Compulsory Treatment (Alcohol and Other Drugs) Bill 2016 (Exposure Draft Bill) and associated Summary Model of Service to enable input into the design of the proposed program.
Following substantial consultation on the Discussion and Background Papers, the Exposure Draft Bill and Summary Model of Service were released for public comment from December 2016 to January 2017.
Corrective Services e-learningCollaboration between the Commission and the former Department of Corrective Services resulted in the development and roll-out of an online mental health and AOD awareness training package designed specifically for prison officers and other Corrections staff.
The Commission contributed funding to the cost of the training package, provided expert advice and facilitated stakeholder input into the content through the forensic sub-network of the Mental Health Network.
Approximately 3,000 Corrections staff have participated in the e-learning program, and those that have completed the training have gained increased awareness and understanding of mental health issues and enabling access to mental health supports and services for people in their care.
Department of Corrective Services e-learning program
OVERVIEW SIGNIFICANT ISSUESDISCLOSURES AND
LEGAL COMPLIANCEAPPENDICES

Page 33 Mental Health Commission | 2016/17 Annual Report
AGENCY PERFORMANCE
Department of Corrective Services e-learning program
Organisational effectiveness and efficiencyThis financial year, the Commission developed and released the Commissioning Framework, which sets out the approach it adopts when commissioning services. The Framework outlines the full cycle of strategic planning, defining commissioning and decommissioning intentions, service design, procurement and contracting, and monitoring and evaluation.
Commissioning decisions and new service developments in mental health and AOD services throughout 2016/17 were guided by the priorities identified in the Western Australian Mental Health, Alcohol and Other Drug Services Plan 2015-2025: Better Choices. Better Lives.
The Commission has further improved its internal governance through the development of its Organisational Project Management Framework and System.
Strategic direction developmentStakeholder consultation to inform the development of a Western Australian Mental Health, Alcohol and Other Drug Accommodation and Support Strategy 2017-2025 was undertaken through the financial year. The Strategy outlines a system-wide, multi-agency approach to addressing the accommodation and support needs of people with severe mental health or AOD related issues.
The Commission consulted with and received submissions from approximately 50 stakeholder organisations, convened two targeted workshops and established an Advisory Committee to guide its development.
The draft Western Australian Alcohol and Drug Interagency Strategy 2017-2021 was developed in 2016/17, by the Drug and Alcohol Strategic Senior Officers Group (DASSOG), which is chaired by the Commission and includes senior representatives from other key government departments involved in the response to reducing AOD related harms.
Advisory bodiesThe Alcohol and Other Drugs Advisory Board (AODAB) provides advice to the Commission on matters relevant to section 11 functions of the Alcohol and Other Drug Act 1974. A complete list of members and their remuneration is provided in Appendix Two.
The Drug and Alcohol Youth Service (DAYS) is one of the NGO services contracted by the Commission
OVERVIEW SIGNIFICANT ISSUESDISCLOSURES AND
LEGAL COMPLIANCEAPPENDICES

Page 34 Mental Health Commission | 2016/17 Annual Report
AGENCY PERFORMANCE
In 2016/17, the AODAB provided input into the draft Alcohol and Drug Interagency Strategy 2017-2021, consumer engagement in the AOD sector, proposed compulsory AOD treatment legislation and Summary Model of Service, and consideration of the implementation of the Western Australian Mental Health, Alcohol and Other Drug Services Plan 2015-2025: Better Choices. Better Lives.
The Mental Health Advisory Council (MHAC) provides advice to the Commission regarding major issues affecting Western Australians with mental health issues, their carers and service providers. A complete list of members and their remuneration is provided in Appendix Two. In 2016/17, the MHAC provided advice to the Commission regarding: support services to assist prisoners to successfully transition from prison to the community; the Post Implementation Review of the Mental Health Act 2014; the Commission’s approach to funding and contractual requirements for services commissioned from HSPs and how consumers, carers and families are included; and on the proposed compulsory AOD treatment program in Western Australia.
National and international partnershipsThe Mental Health Commissioner represents Western Australia on the Mental Health, Drug and Alcohol Principal Committee (MHDAPC), a national committee that provides advice on mental health, tobacco and AOD issues to the Australian Health Ministers’ Advisory Council.
In 2016/17, the Commission provided support and representation on programs and initiatives such as the:• Mental Health Professional Online Development Program;• National Mental Health Consumer and Carer Forum. The Commission
continued to support Ms Lorraine Powell and Ms Debra Sobott as Western Australia’s consumer and carer representatives on this forum;
• International Initiative of Mental Health Leadership (IIMHL) and the associated Leadership Exchange held in Sydney in February and March 2017;
• drafting of the Fifth National Mental Health and Suicide Prevention Plan;
• National Mental Health Commission’s Advisory Group for Suicide Prevention;
• Mental Health Information Strategy Standing Committee;• Safety and Quality Partnership Standing Committee; and• drafting of the National Drug Strategy 2016-2025 as a member of the
Inter-Governmental Committee on Drugs.
Through the Thinker in Residence program, the Commission continued its partnership with the Commissioner of Children and Young People to engage highly regarded specialists in the field of young people. The 2016/17 Thinker in Residence was Jane Burns, Professor of Innovation and Industry at The University of Sydney Faculty of Health Sciences. Professor Burns is nationally and internationally recognised for her work in suicide prevention research, translation, practice implementation and policy.
Funding was provided by the Commission to the World Health Organization (WHO) for the development of the QualityRights toolkit, which is used to assess and improve quality, and human rights conditions in mental health and related services.
OVERVIEW SIGNIFICANT ISSUESDISCLOSURES AND
LEGAL COMPLIANCEAPPENDICES

Page 35 Mental Health Commission | 2016/17 Annual Report
AGENCY PERFORMANCE
Research and evaluationIn addition to monitoring and performance analysis, a range of evaluation and research projects were undertaken to inform policy development and support evidence-based commissioning. These included the:• re-establishment of the Western Australian Coronial Suicide
Information System (WACSIS) in conjunction with the Telethon Kids Institute, to provide an in-depth evidence-base on all suicides between 1986 and 2015;
• planning and commissioning of a major research project, The Research and Evaluation Services for the Fly-In Fly-Out Work Arrangements On Mental Health In The Resources Industry, in line with the recommendations of the Legislative Assembly Education and Health Standing Committee;
• implementation of the mental health Your Experience of Service Survey pilot program, with a wider roll-out of the survey to occur in 2017/18. This will capture feedback from consumers to support the commissioning of improved services;
• establishment of a contract with the University of Western Australia to mitigate mental ill-health and foster thriving workplaces;
• enhanced focus on non-admitted mental health services, including implementation of improved monitoring and analysis of service activity delivered by HSPs across the State; and focus on two key indicators with HSPs being:– monitoring the percentage of re-admissions to hospital within
28 days of discharge from acute specialised inpatient units; and– the percentage of contacts with community-based, public,
non-admitted services, within seven days post discharge from public inpatient units.
Workforce developmentThe Commission continued to provide development opportunities to clinicians, frontline workers, volunteers and peer workers. Key achievements included:• leadership and support for undergraduate and post graduate
addiction medicine training programs. Two Addiction Medicine Registrars completed the Next Step training to become Fellows of the Australasian Chapter of Addiction Medicine and a further two are currently in training;
• additional general practitioners trained and authorised as suboxone-only prescribers by Next Step, which enabled an expansion of community pharmacotherapy programs across Western Australia;
• the hosting of the Towards Elimination of Restrictive Practices national conference held in Perth in February 2017. The theme for the forum, ‘Working together, a culture of care’, was designed to bring improvements in policy and practice in mental health services. It provided an opportunity to reflect on current lessons, innovations and ideas that have arisen from practice and research around the world;
• funding for the WA Aids Council to develop and deliver the Peer Amphetamine Project: Rock Solid, to prevent and reduce methamphetamine-related harms for people who currently use or are at risk of using methamphetamine, by providing peer-based education. There have been 12 peer educators recruited;
• an amphetamine intoxication and toxicity, opioid overdose training resource package was developed, with training delivered to a total of 1,281 participants;
OVERVIEW SIGNIFICANT ISSUESDISCLOSURES AND
LEGAL COMPLIANCEAPPENDICES

Page 36 Mental Health Commission | 2016/17 Annual Report
AGENCY PERFORMANCE
• a total of 221 evidence-based training events were delivered to 3,817 participants from a range of health, welfare, justice, AOD and mental health services, including educational training in regional areas of Western Australia; and
• more than 12,000 information resources were disseminated to support the workforce around the State.
Workforce Development at the Commission
Evaluation of training events demonstrated that training exceeded key performance indicators.
87% of training participants reported that they found the Commission’s training had been ‘a lot’ to ‘extremely’ useful.
OVERVIEW SIGNIFICANT ISSUESDISCLOSURES AND
LEGAL COMPLIANCEAPPENDICES

Page 37 Mental Health Commission | 2016/17 Annual Report
AGENCY PERFORMANCE
The Commission’s Strong Spirit Strong Mind Aboriginal Programs delivered:• Certificate III in Community Services and Certificate IV in Alcohol and
other Drugs courses, with both qualifications customised to providea culturally secure learning environment for Aboriginal workers in thespecialist AOD and broader health sectors. Nineteen participantsregistered for the Certificate III and 14 graduates successfullycompleted the Certificate IV in May 2017. Participants were Aboriginalpeople from the Pilbara, East and West Kimberley regions, Mid West,Goldfields, Wheatbelt, Tjuntjunjarra (The Great Victoria Desert) andmetropolitan Perth;
• three days of Ways of Working Part 1 training to 80 participants, andtwo days of training to 34 participants for Ways of Working Part 2.The training develops participants’ knowledge, skills andunderstanding of Aboriginal culture in order to build better workingrelationships with Aboriginal clients and effect organisational change;
• three workshops about fetal alcohol spectrum disorders;• blood-borne virus training for cultural ways of responding to injecting
and other drug use in Aboriginal communities; and• a Quitline Aboriginal Liaison Training (QALT) program that ensured the
cultural security of Quitline services, promotion of Quitline services toAboriginal people in Western Australia, and the provision of trainingresources and promotional materials. QALT delivered 12 trainingsessions, including eight community events, training 145 healthprofessionals in 2016/17.
Strong Spirit Strong Mind Aboriginal Programs deliver training to participants from across Western Australia
OVERVIEW SIGNIFICANT ISSUESDISCLOSURES AND
LEGAL COMPLIANCEAPPENDICES

Page 38 Mental Health Commission | 2016/17 Annual Report
AGENCY PERFORMANCE
“You can go and study anywhere but to have somewhere where there is a cultural focus and respect… I am grateful because it is in line with how we live.
It’s made it achievable. These guys didn’t judge me, they supported me and really did walk alongside me, which is our way.
Certificate III, invaluable. It made me able to do the work that I do, that I love.
It’s been an incredible journey and I would recommend it to anyone.”
– a recent Strong Spirit Strong Mind Aboriginal Program Certificate IV graduate
Commission employee development and wellnessIn 2016/17 the Commission revised its Values. They are:• respect for individuals and culture;• working together and supporting each other;• involving and engaging others;• ownership, transparency and accountability;• fair and ethical decisions; and• improvement focus.
In alignment with its focus on respect, and working together and supporting each other, the Commission implemented professional and personal development initiatives to assist its employees to achieve both individually and as a team. These included:• ‘Behaviour Matters’ workshops, delivered to 228 employees, which
established a common understanding across the Commission, of the behaviours that are consistent with working in accordance with the Commission’s new Values and Code of Conduct;
• ‘Building and Leading High Performing Teams’ training for supervisors, which provided an overview of the strategies necessary to lead a team successfully and maximise the performance of individual staff members;
• ‘Mental Health First Aid’ training;
OVERVIEW SIGNIFICANT ISSUESDISCLOSURES AND
LEGAL COMPLIANCEAPPENDICES

Page 39 Mental Health Commission | 2016/17 Annual Report
AGENCY PERFORMANCE
• a new online learning management system, ELMO, to provideemployees with a comprehensive library of online courses rangingfrom Accountable and Ethical Decision Making, RecordkeepingAwareness Training, Communication and Personal Development,Customer Service, Finance, Leadership and Management,Health Care/Clinical and Project and Business Management.ELMO also provides accurate, up-to-date data on employee trainingcompletion, enabling the Commission to improve its reportingcapabilities and assist employees and supervisors with performancedevelopment; and
• as part of the Commission’s commitment to providing employees withan environment that actively assists them to maximise their overallhealth and wellbeing, a Wellness program was launched, supportedby the Wellness Committee. The program includes activities such ason-site fitness classes, toolbox sessions – on topics such asmindfulness, improved communication and relationships, financialhealth, and improved posture and resilience – corporate teamchallenges and free flu vaccinations. Commission employees during 2016/17
OVERVIEW SIGNIFICANT ISSUESDISCLOSURES AND
LEGAL COMPLIANCEAPPENDICES

Page 40 Mental Health Commission | 2016/17 Annual Report
Significant Issues
OVERVIEW AGENCY PERFORMANCEDISCLOSURES AND
LEGAL COMPLIANCEAPPENDICESSIGNIFICANT ISSUES
Page 41 Mental Health Commission | 2016/17 Annual Report
Significant Issues Impacting The CommissionOn 1 July 2016, WA Health (the Department of Health and five HSPs), underwent significant reform with the commencement of the Health Services Act 2016. This required the Commission to enter into new bilateral agreements with the new Health Services Boards, which were progressed in 2016/17. These agreements adhere to the legal framework outlined in the Health Services Act 2016 and provide a further mechanism for improvement and accountability in the delivery of public mental health services.
The amalgamation of the child and adolescent mental health inpatient facilities at Princess Margaret Hospital (PMH) and the Bentley Adolescent Unit (BAU) by the CAHS in March 2016, led to the closure of eight beds at PMH. This closure was unplanned by the Commission, but was implemented by the CAHS in the interests of safety and quality. The Commission closely monitored the impact, and sought and facilitated the opening of additional child and adolescent beds at the BAU to address the resultant increase in unmet demand following the PMH ward closure. To assist with the sustainability of child and adolescent mental health services and in preparation for the transfer of mental health inpatient beds to the Perth Children’s Hospital, the Commission is working in collaboration with the CAHS and Department of Health on a review of child and adolescent inpatient mental health costs. This review will inform commissioning and ongoing service improvements.
The implementation of the Western Australian Meth Strategy 2016 and the Government’s Methamphetamine Action Plan, has underpinned and expanded the Commission’s work in the AOD sector, as part of an across government effort to reduce the supply, demand and harm of methamphetamine in Western Australia. The Commission has worked in 2016/17 to plan, deliver and evaluate initiatives across the spectrum of prevention, treatment, and community-based and bed-based rehabilitation services.
Development of the Fifth National Mental Health and Suicide Prevention Plan is being led by the Mental Health, Drug and Alcohol Principal Committee of the Australian Health Minister’s Advisory Council, of which the Western Australian Mental Health Commissioner is a member. The National Drug Strategy 2017-2026 (NDS) was endorsed for release by the Ministerial Drug and Alcohol Forum on 29 May 2017. The NDS continues the strong partnership between health and law enforcement agencies with a commitment to harm minimisation and a comprehensive approach to AOD policy that focuses on reduction in supply, demand and harm.
The Mental Health Commission has been closely monitoring the implementation of the National Disability Insurance Scheme and working in partnership with the Department of Communities (former Disability Services Commission) and the National Disability Insurance Agency to include people with psychosocial disability within the Scheme. The Commission has not, and will not, reduce funding to mental health support services as a result of the Scheme.
The Commission continued to evaluate and prioritise the provision of services and initiatives in 2016/17 to ensure its resources are allocated both effectively and efficiently, to achieve maximum benefit to the community.
The 2017 State Election and the preceding caretaker period required a phase of transition. There were major legislative and planning decisions requiring assessment and review by the incoming government, and election commitments forming part of the Commission’s planned scope of works. The Commission worked to comprehensively brief the incoming Minister for Mental Health and the new Parliamentary Secretary for Mental Health. It also conducted planning and detailed assessment of deliverables within the Mental Health portfolio, ahead of their future implementation.
OVERVIEW AGENCY PERFORMANCEDISCLOSURES AND
LEGAL COMPLIANCEAPPENDICESSIGNIFICANT ISSUES

Page 42 Mental Health Commission | 2016/17 Annual Report
Overview of the mental health and AOD sector in Western Australia
Advocacy and Peak Bodies
Western Australian Network of Alcohol and other Drug Agencies
(WANADA)Western Australian Association for Mental
Health (WAAMH)Consumers of Mental Health WA
(CoMHWA)Mental Illness Fellowship Western
Australia (MIFWA)and others
Non-Government
Organisations (NGOs)98 NGOs funded by the
CommissionCommonwealth funded
Privately funded
Private Providers
Services delivered by Mental Health Commission
of Western AustraliaNext Step
Community Alcohol and Drug Services
Alcohol and Drug Support ServiceStrong Spirit Strong Mind
Metro Project
WA HealthDepartment of Health
North Metropolitan Health Service
South Metropolitan Health Service East Metropolitan Health Service
Child and Adolescent Health Service
WA Country Health Service
National Mental Health Commission
Frontline Services
Department of Justice (formerly Corrective Services)
WA Police Department of Communities
(formerly Child Protection, Disability Services and others)
Department of Educationand others
Advisory Groups
Mental Health Advisory Council (MHAC)
Alcohol and Other Drugs Advisory Board
Ministerial Council for Suicide Prevention
Independent Entities
Mental Health Tribunal (MHT)
Mental Health Advocacy Service (MHAS)
Office of the Chief Psychiatrist (OCP)
Commissioning Agencies
Mental Health Commission of Western Australia
Commonwealth Department of Health
WA Primary Health Alliance
OVERVIEW AGENCY PERFORMANCEDISCLOSURES AND
LEGAL COMPLIANCEAPPENDICESSIGNIFICANT ISSUES

Page 43 Mental Health Commission | 2016/17 Annual Report
Disclosures and Legal Compliance
OVERVIEW AGENCY PERFORMANCE SIGNIFICANT ISSUES APPENDICESDISCLOSURES AND
LEGAL COMPLIANCE

Page 44 Mental Health Commission | 2016/17 Annual Report
Certification of Financial Statements For the year ended 30 June 2017
The accompanying financial statements of the Mental Health Commission have been prepared in compliance with provisions of the Financial Management Act 2006 from proper accounts and records to present fairly the financial transactions for the financial year ended 30 June 2017 and the financial position as at 30 June 2017.
At the date of signing we are not aware of any circumstances which would render the particulars included in the financial statements misleading or inaccurate.
Marie Falconer Timothy MarneyChief Financial Officer Accountable AuthorityMental Health Commission Mental Health Commission
6 September 2017 6 September 2017
OVERVIEW AGENCY PERFORMANCE SIGNIFICANT ISSUES APPENDICESDISCLOSURES AND LEGAL COMPLIANCE

Page 45 Mental Health Commission | 2016/17 Annual Report
Independent Auditor’s Report
OVERVIEW AGENCY PERFORMANCE SIGNIFICANT ISSUES APPENDICESDISCLOSURES AND LEGAL COMPLIANCE

Page 46 Mental Health Commission | 2016/17 Annual Report
OVERVIEW AGENCY PERFORMANCE SIGNIFICANT ISSUES APPENDICESDISCLOSURES AND
LEGAL COMPLIANCE

Page 47 Mental Health Commission | 2016/17 Annual Report
OVERVIEW AGENCY PERFORMANCE SIGNIFICANT ISSUES APPENDICESDISCLOSURES AND
LEGAL COMPLIANCE
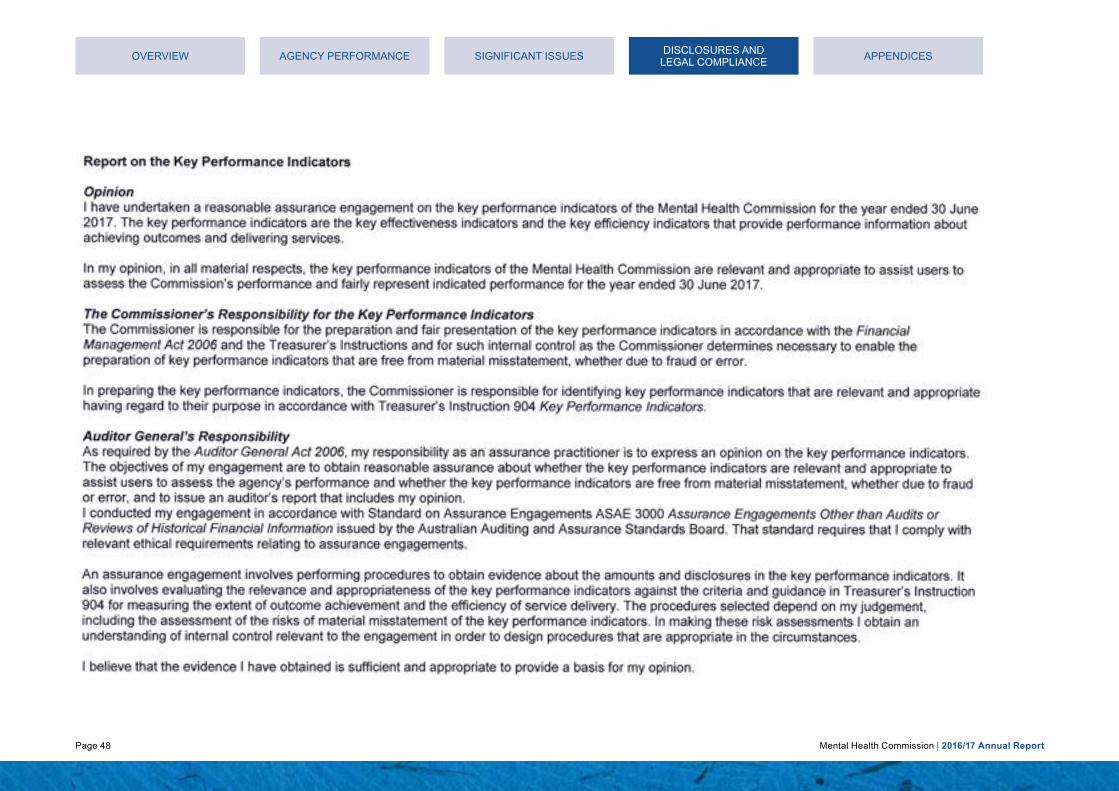
Page 48 Mental Health Commission | 2016/17 Annual Report
OVERVIEW AGENCY PERFORMANCE SIGNIFICANT ISSUES APPENDICESDISCLOSURES AND
LEGAL COMPLIANCE
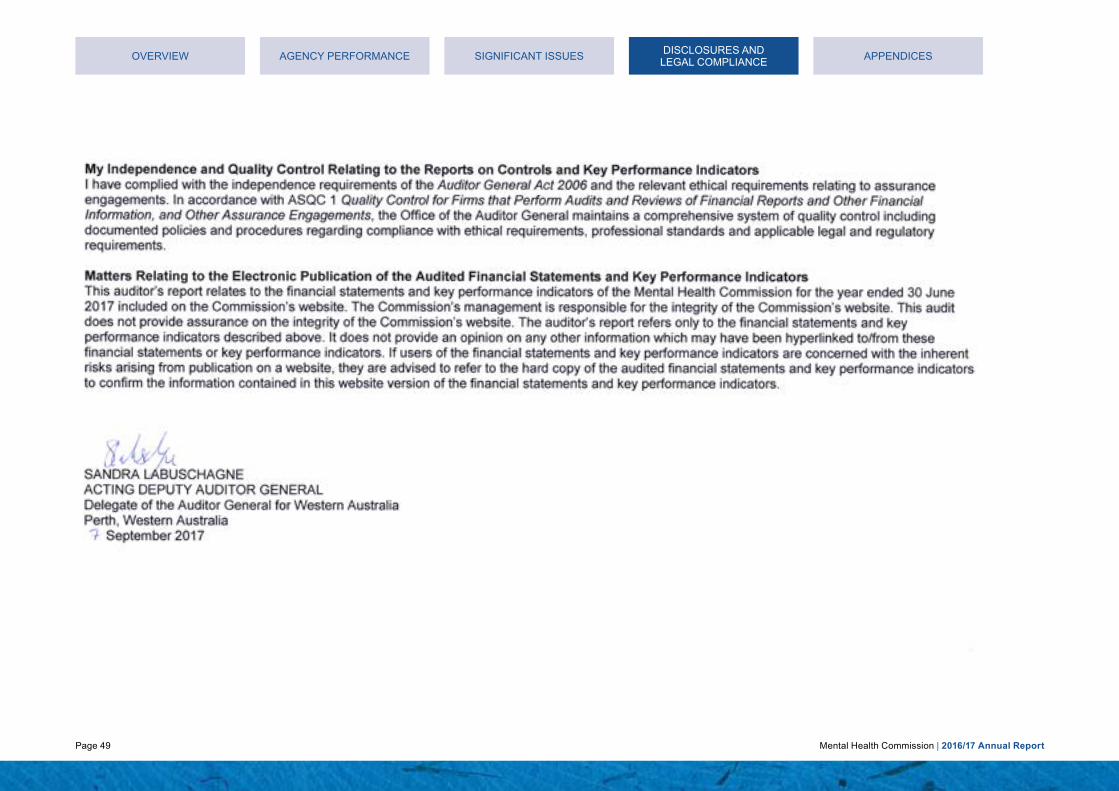
Page 49 Mental Health Commission | 2016/17 Annual Report
OVERVIEW AGENCY PERFORMANCE SIGNIFICANT ISSUES APPENDICESDISCLOSURES AND
LEGAL COMPLIANCE

Page 50 Mental Health Commission | 2016/17 Annual Report
Financial StatementsMental Health Commission
Statement of Comprehensive IncomeFor the year ended 30 June 2017
Note 2017 2016$ $
COST OF SERVICESExpenses
Employee benefits expense 6 35,975,411 38,982,037 Service agreement - WA Health 8 670,265,489 643,885,694 Service agreement - non government and other organisations 9 139,015,908 137,109,599 Supplies and services 10 10,389,927 10,684,639 Grants and subsidies 11 2,864,341 6,642,853 Depreciation expense 12 473,756 455,123 Accommodation expense 13 2,249,106 1,023,150 Other expenses 14 1,873,235 4,431,291
Total cost of services 863,107,173 843,214,386
IncomeRevenue
Commonwealth grants and contributions 16 163,338,110 173,026,975 Other grants and contributions 17 4,304,596 5,280,494 Other revenue 18 882,539 256,475
Total revenue 168,525,245 178,563,944
Total income other than income from State Government 168,525,245 178,563,944
NET COST OF SERVICES 694,581,928 664,650,442
Income from State GovernmentService appropriation 19 684,695,000 654,815,000 Services received free of charge 19 3,196,476 3,922,970 Royalties for Regions Fund 19 5,422,609 5,630,000
Total income from State Government 693,314,085 664,367,970
SURPLUS/(DEFICIT) FOR THE PERIOD (1,267,843) (282,472)
OTHER COMPREHENSIVE INCOME - -
TOTAL COMPREHENSIVE INCOME/(LOSS) FOR THE PERIOD (1,267,843) (282,472)
See also the 'Schedule of Income and Expenses by Service'.The Statement of Comprehensive Income should be read in conjunction with the accompanying notes.
OVERVIEW AGENCY PERFORMANCE SIGNIFICANT ISSUES APPENDICESDISCLOSURES AND LEGAL COMPLIANCE

Page 51 Mental Health Commission | 2016/17 Annual Report
Mental Health CommissionStatement of Financial Position
As at 30 June 2017
Note 2017 2016$ $
ASSETSCurrent Assets
Cash and cash equivalents 31 24,611,247 25,951,257 Restricted cash and cash equivalents 20, 31 6,022,264 4,818,201 Receivables 21 490,446 564,893 Inventories 23 18,244 20,008 Other current assets 24 27,626 39,685
Total Current Assets 31,169,827 31,394,044
Non-Current AssetsRestricted cash and cash equivalents 20, 31 123,552 - Amounts receivable for services 22 5,486,123 5,145,123 Property, plant and equipment 25 22,426,272 22,571,657
Total Non-Current Assets 28,035,947 27,716,780
TOTAL ASSETS 59,205,774 59,110,824
LIABILITIESCurrent Liabilities
Payables 28 4,331,079 3,897,124 Provisions 29 5,351,712 5,770,643
Total Current Liabilities 9,682,791 9,667,767
Non-Current LiabilitiesProvisions 29 2,098,539 1,860,770
Total Non-Current Liabilities 2,098,539 1,860,770
TOTAL LIABILITIES 11,781,330 11,528,537
NET ASSETS 47,424,444 47,582,287
EQUITYContributed equity 30 32,135,558 31,025,558 Accumulated surplus 30 15,288,886 16,556,729
TOTAL EQUITY 47,424,444 47,582,287
See also the 'Schedule of Assets and Liabilities by Service'.The Statement of Financial Position should be read in conjunction with the accompanying notes.
Financial Statements
OVERVIEW AGENCY PERFORMANCE SIGNIFICANT ISSUES APPENDICESDISCLOSURES AND
LEGAL COMPLIANCE
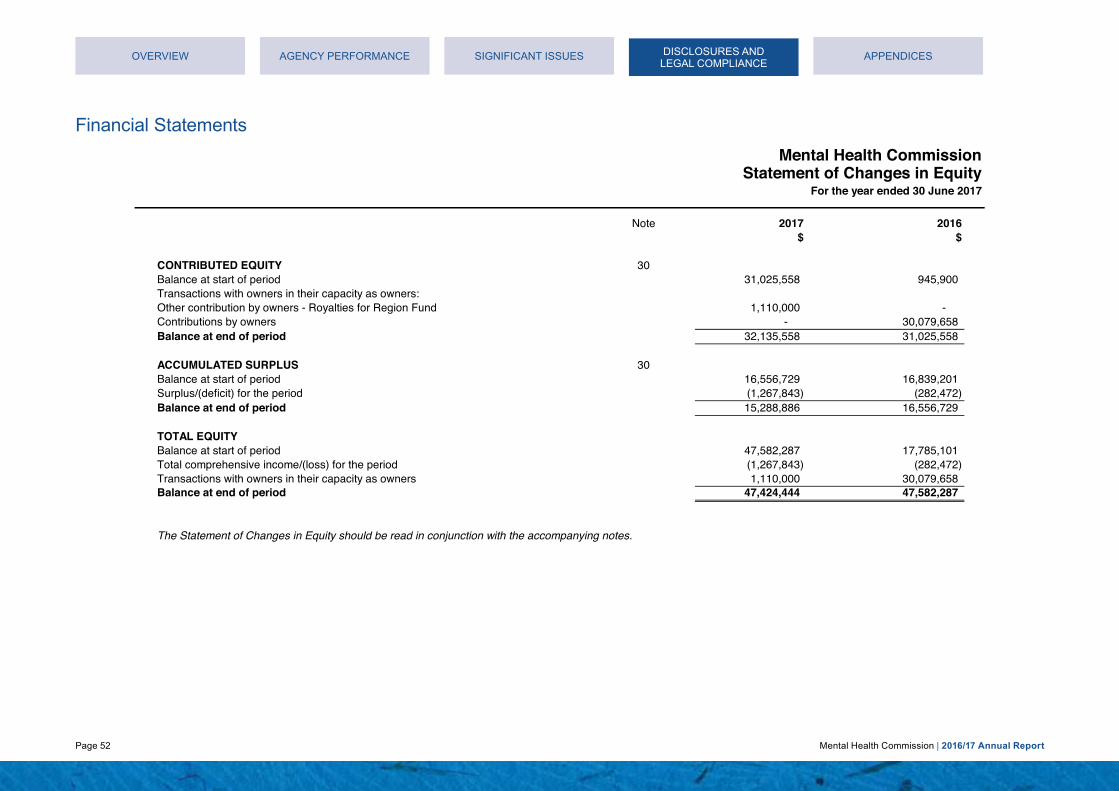
Page 52 Mental Health Commission | 2016/17 Annual Report
Mental Health CommissionStatement of Changes in Equity
For the year ended 30 June 2017
Note 2017 2016$ $
CONTRIBUTED EQUITY 30Balance at start of period 31,025,558 945,900 Transactions with owners in their capacity as owners:Other contribution by owners - Royalties for Region Fund 1,110,000 - Contributions by owners - 30,079,658 Balance at end of period 32,135,558 31,025,558
ACCUMULATED SURPLUS 30Balance at start of period 16,556,729 16,839,201 Surplus/(deficit) for the period (1,267,843) (282,472) Balance at end of period 15,288,886 16,556,729
TOTAL EQUITYBalance at start of period 47,582,287 17,785,101 Total comprehensive income/(loss) for the period (1,267,843) (282,472) Transactions with owners in their capacity as owners 1,110,000 30,079,658 Balance at end of period 47,424,444 47,582,287
The Statement of Changes in Equity should be read in conjunction with the accompanying notes.
Financial Statements
OVERVIEW AGENCY PERFORMANCE SIGNIFICANT ISSUES APPENDICESDISCLOSURES AND LEGAL COMPLIANCE

Page 53 Mental Health Commission | 2016/17 Annual Report
Financial Statements
Mental Health CommissionStatement of Cash Flows
For the year ended 30 June 2017
Note 2017 2016$ $
Inflows Inflows(Outflows) (Outflows)
CASH FLOWS FROM STATE GOVERNMENTService appropriation 31 684,354,000 654,575,000 Royalties for Regions Fund - Capital 30 1,110,000 - Royalties for Regions Fund - Recurrent 19 5,422,609 5,630,000
Net cash provided by State Government 690,886,609 660,205,000Utilised as follows:CASH FLOWS FROM OPERATING ACTIVITIESPayments
Employee benefits expense (36,122,797) (41,220,707) Service agreement - WA Health (670,265,489) (644,092,337) Service agreement - non government and other organisations (139,086,788) (137,797,069) Supplies and services (6,326,892) (6,265,190) Grants and subsidies (3,193,909) (6,349,005) Accommodation expense (2,025,210) (1,072,650) Other payments (1,919,112) (3,201,759)
ReceiptsCommonwealth grants and contributions 163,338,110 173,026,975 Other grants and contributions 4,304,596 5,280,494 Other receipts 643,244 189,943
Net cash used in operating activities 31 (690,654,247) (661,501,305)CASH FLOWS FROM INVESTING ACTIVITIESPayments
Purchase of non-current assets (244,757) (145,875)Net cash used in investing activities (244,757) (145,875)Net increase / (decrease) in cash and cash equivalents (12,395) (1,442,180) Cash and cash equivalents at the beginning of the period 30,769,458 24,032,135 Cash and cash equivalents transferred from WA Alcohol & Drug Authority 30 - 8,179,503 CASH AND CASH EQUIVALENTS AT THE END OF THE PERIOD 31 30,757,063 30,769,458The Statement of Cash Flows should be read in conjunction with the accompanying notes.
OVERVIEW AGENCY PERFORMANCE SIGNIFICANT ISSUES APPENDICESDISCLOSURES AND LEGAL COMPLIANCE

Page 54 Mental Health Commission | 2016/17 Annual Report
Financial Statements
Mental Health CommissionSchedule of Income and Expenses by Service
For the year ended 30 June 2017
2017 2016 2017 2016 2017 2016 2017 2016 2017 2016 2017 2016$ $ $ $ $ $ $ $ $ $ $ $
COST OF SERVICESExpenses
Employee benefits expense 856,215 966,755 15,329,123 16,333,473 1,859,929 2,003,677 15,994,667 17,272,940 1,935,477 2,405,192 35,975,411 38,982,037 Service agreement - WA Health 15,952,319 15,968,365 285,600,125 269,788,106 34,652,726 33,095,725 298,000,036 285,305,751 36,060,283 39,727,747 670,265,489 643,885,694 Service agreement - non government and other organisations 3,308,579 3,400,318 59,234,678 57,448,922 7,187,122 7,047,433 61,806,473 60,753,263 7,479,056 8,459,663 139,015,908 137,109,599 Supplies and services 247,280 264,979 4,427,148 4,476,864 537,159 549,190 4,619,362 4,734,364 558,978 659,242 10,389,927 10,684,639 Grants and subsidies 68,171 164,743 1,220,496 2,783,355 148,086 341,443 1,273,486 2,943,448 154,102 409,864 2,864,341 6,642,853 Depreciation expense 11,275 11,287 201,867 190,697 24,493 23,393 210,633 201,665 25,488 28,081 473,756 455,123 Accommodation expense 53,529 25,374 958,344 428,700 116,279 52,590 999,952 453,358 121,002 63,128 2,249,106 1,023,150 Other expenses 44,583 109,896 798,185 1,856,711 96,846 227,768 832,840 1,963,505 100,781 273,411 1,873,235 4,431,291
Total cost of services 20,541,951 20,911,717 367,769,966 353,306,828 44,622,640 43,341,219 383,737,449 373,628,294 46,435,167 52,026,328 863,107,173 843,214,386
IncomeCommonwealth grants and contributions 336,000 181,000 96,549,948 99,219,612 - - 66,270,402 68,411,749 181,760 5,214,614 163,338,110 173,026,975 Other grants and contributions 2,226,312 2,467,143 100,000 208,145 - - 1,978,284 2,605,206 - - 4,304,596 5,280,494 Other revenue 21,004 6,361 376,050 107,463 45,627 13,182 392,377 113,644 47,481 15,825 882,539 256,475
Total income other than income from State Government 2,583,316 2,654,504 97,025,998 99,535,220 45,627 13,182 68,641,063 71,130,599 229,241 5,230,439 168,525,245 178,563,944
NET COST OF SERVICES 17,958,635 18,257,213 270,743,968 253,771,608 44,577,013 43,328,037 315,096,386 302,497,695 46,205,926 46,795,889 694,581,928 664,650,442
Income from State GovernmentService appropriation 17,662,100 17,774,635 268,841,722 252,009,528 44,346,207 43,111,877 308,492,226 296,033,130 45,352,745 45,885,830 684,695,000 654,815,000 Services received free of charge 76,076 97,290 1,362,019 1,643,724 165,258 201,641 1,421,153 1,738,268 171,970 242,047 3,196,476 3,922,970 Royalties for Regions Fund 190,283 378,283 - - - - 4,619,326 4,601,134 613,000 650,583 5,422,609 5,630,000
Total income from State Government 17,928,459 18,250,208 270,203,741 253,653,252 44,511,465 43,313,518 314,532,705 302,372,532 46,137,715 46,778,460 693,314,085 664,367,970
SURPLUS/(DEFICIT) FOR THE PERIOD (30,176) (7,005) (540,227) (118,356) (65,548) (14,519) (563,681) (125,163) (68,211) (17,429) (1,267,843) (282,472)
The Schedule of Income and Expenses by Service should be read in conjunction with the accompanying notes.
TotalCommunityTreatment
Community BedBased Services Prevention
Hospital BedBased Services
CommunitySupport
OVERVIEW AGENCY PERFORMANCE SIGNIFICANT ISSUES APPENDICESDISCLOSURES AND LEGAL COMPLIANCE

Page 55 Mental Health Commission | 2016/17 Annual Report
Financial Statements
Mental Health CommissionSchedule of Assets and Liabilities by Service
As at 30 June 2017
2017 2016 2017 2016 2017 2016 2017 2016 2017 2016 2017 2016$ $ $ $ $ $ $ $ $ $ $ $
ASSETSCurrent assets 741,842 778,572 13,281,463 13,154,105 1,611,480 1,613,654 13,858,105 13,910,701 1,676,937 1,937,012 31,169,827 31,394,044 Non-current assets 667,256 687,376 11,946,117 11,613,331 1,449,458 1,424,642 12,464,782 12,281,305 1,508,334 1,710,126 28,035,947 27,716,780
Total Assets 1,409,098 1,465,948 25,227,580 24,767,436 3,060,938 3,038,296 26,322,887 26,192,006 3,185,271 3,647,138 59,205,774 59,110,824
LIABILITIESCurrent liabilities 230,450 239,761 4,125,837 4,050,794 500,600 496,923 4,304,970 4,283,788 520,934 596,501 9,682,791 9,667,767 Non-current liabilities 49,945 46,147 894,187 779,663 108,494 95,643 933,012 824,507 112,901 114,810 2,098,539 1,860,770
Total Liabilities 280,395 285,908 5,020,024 4,830,457 609,094 592,566 5,237,982 5,108,295 633,835 711,311 11,781,330 11,528,537
NET ASSETS 1,128,703 1,180,040 20,207,556 19,936,979 2,451,844 2,445,730 21,084,905 21,083,711 2,551,436 2,935,827 47,424,444 47,582,287
The Schedule of Assets and Liabilities by Service should be read in conjunction with the accompanying notes.
TotalCommunity
Support PreventionHospital Bed
Based ServicesCommunity BedBased Services
CommunityTreatment
OVERVIEW AGENCY PERFORMANCE SIGNIFICANT ISSUES APPENDICESDISCLOSURES AND LEGAL COMPLIANCE

Page 56 Mental Health Commission | 2016/17 Annual Report
Financial Statements
Mental Health CommissionSummary of Consolidated Account Appropriations and Income Estimates
For the year ended 30 June 2017
2017 2017 2017 2016Estimate Actual Variance Actual Actual Variance
$ $ $ $ $ $Delivery of ServicesItem 43 Net amount appropriated to deliver services 668,680,000 683,886,000 15,206,000 683,886,000 657,798,000 26,088,000 Section 25 transfer of service appropriation
Office of the Chief Psychiatrist - - - - (921,000) 921,000 Mental Health Tribunal - - - - (1,406,000) 1,406,000 Mental Health Advocacy Service - - - - (1,439,000) 1,439,000
Amount Authorised by Other Statutes- Salaries and Allowances Act 1975 809,000 809,000 - 809,000 783,000 26,000 Total appropriations provided to deliver services 669,489,000 684,695,000 15,206,000 684,695,000 654,815,000 29,880,000 Administered TransactionsAdministered grants, subsidies and other transfer payments 7,569,000 7,569,000 - 7,569,000 4,520,000 3,049,000 Administered capital appropriations - - - - - - Total administered transactions 7,569,000 7,569,000 - 7,569,000 4,520,000 3,049,000 GRAND TOTAL 677,058,000 692,264,000 15,206,000 692,264,000 659,335,000 32,929,000 Details of Expenses by Service
Prevention 19,507,000 20,541,951 1,034,951 20,541,951 20,911,717 (369,766) Hospital Bed Based Services 364,119,000 367,769,966 3,650,966 367,769,966 353,306,828 14,463,138 Community Bed Based Services 49,036,000 44,622,640 (4,413,360) 44,622,640 43,341,219 1,281,421 Community Treatment 381,704,000 383,737,449 2,033,449 383,737,449 373,628,294 10,109,155 Community Support 51,406,000 46,435,167 (4,970,833) 46,435,167 52,026,328 (5,591,161) Total Cost of Services 865,772,000 863,107,173 (2,664,827) 863,107,173 843,214,386 19,892,787
Less Total income (182,722,000) (168,525,245) 14,196,755 (168,525,245) (178,563,944) 10,038,699 Net Cost of Services 683,050,000 694,581,928 11,531,928 694,581,928 664,650,442 29,931,486 Adjustments (a) (13,561,000) (9,886,928) 3,674,072 (9,886,928) (9,835,442) (51,486) Total appropriations provided to deliver services 669,489,000 684,695,000 15,206,000 684,695,000 654,815,000 29,880,000 Details of Income EstimatesIncome disclosed as Administered Income 7,569,000 8,649,914 1,080,914 8,649,914 5,058,418 3,591,496
7,569,000 8,649,914 1,080,914 8,649,914 5,058,418 3,591,496
Note 42 'Explanatory statement' and note 43 'Explanatory statement for Administered Items' provide details of any significant variations between estimates and actual results for 2017 and between actual results for 2017 and 2016.
(a) Adjustments comprise resources received free of charge, Royalities for Regions fund, movements in cash balances and other accrual items such as receivables, payables andsuperannuation.
OVERVIEW AGENCY PERFORMANCE SIGNIFICANT ISSUES APPENDICESDISCLOSURES AND
LEGAL COMPLIANCE

Page 57 Mental Health Commission | 2016/17 Annual Report
Financial Statements
Mental Health CommissionNotes to the Financial StatementsFor the year ended 30 June 2017
Note 1
Note 2
(a)
(b)
Australian Accounting Standards
The Commission cannot early adopt an Australian Accounting Standard unless specifically permitted by TI 1101 'Application of Australian Accounting Standards and Other Pronouncements '. There has been no early adoption of any other Australian Accounting Standards that have been issued or amended (but not operative) by the Commission for the annual reporting period ended 30 June2017.
The Commission is a not-for-profit reporting entity that prepares general purpose financial statements in accordance with Australian Accounting Standards, the Framework, Statements ofAccounting Concepts and other authoritative pronouncements of the Australian Accounting Standards Board as applied by the Treasurer's instructions. Several of these are modified by theTreasurer's instructions to vary application, disclosure, format and wording.
Note 3 'Judgements made by management in applying accounting policies' discloses judgements that have been made in the process of applying the Commission's accounting policies resulting inthe most significant effect on amounts recognised in the financial statements.
General
Early adoption of standards
Basis of preparation
General statement
The Commission has adopted any applicable new and revised Australian Accounting Standards from their operative dates.
Summary of significant accounting policies
The financial statements are presented in Australian dollars and all values are rounded to the nearest dollar ($).
Where modification is required and has had a material or significant financial effect upon the reported results, details of that modification and the resulting financial effect are disclosed in the notesto the financial statements.
The Commission’s financial statements for the year ended 30 June 2017 have been prepared in accordance with Australian Accounting Standards. The term ‘Australian Accounting Standards’includes Standards and Interpretations issued by the Australian Accounting Standards Board (AASB).
The Financial Management Act 2006 and the Treasurer's Instructions impose legislative provisions that govern the preparation of financial statements and take precedence over the AustralianAccounting Standards, the Framework, Statements of Accounting Concepts and other authoritative pronouncements of the Australian Accounting Standards Board.
The accounting policies adopted in the preparation of the financial statements have been consistently applied throughout all periods presented unless otherwise stated.
Note 4 'Key sources of estimation uncertainty' discloses key assumptions made concerning the future, and other key sources of estimation uncertainty at the end of the reporting period, that have asignificant risk of causing a material adjustment to the carrying amounts of assets and liabilities within the next financial year.
The financial statements have been prepared on the accrual basis of accounting using the historical cost convention, except for land and buildings which have been measured at fair value.
OVERVIEW AGENCY PERFORMANCE SIGNIFICANT ISSUES APPENDICESDISCLOSURES AND
LEGAL COMPLIANCE

Page 58 Mental Health Commission | 2016/17 Annual Report
Financial Statements
Mental Health CommissionNotes to the Financial StatementsFor the year ended 30 June 2017
Note 2
(c) Reporting entity
Summary of significant accounting policies (continued)
To be an effective leader of alcohol, drug and mental health commissioning, providing and partnering in the delivery of person-centred and evidence-based:
* Prevention, promotion and early intervention programs;
* Research, policy and system improvements.
Prevention and promotion in the mental health and alcohol and other drug sectors include activities to promote positive mental health, raise awareness of mental illness, suicide prevention, and thepotential harms of alcohol and other drug use in the community.
The reporting entity comprises the Commission only.
Mission
Community support services provide individuals with mental health, alcohol and other drug problems access to the help and support they need to participate in their community. These servicesinclude peer support, home in-reach, respite, recovery and harm reduction programs.
Community Treatment
Community treatment provides clinical care in the community for individuals with mental health, alcohol and other drug problems. These services generally operate with multidisciplinary teams, andinclude specialised and forensic community clinical services.
* Treatment, services and supports; and
The Commission provides the following services. Income, expenses, assets and liabilities attributable to these services are set out in the 'Schedule of Income and Expenses by Service' and the'Schedule of Assets and Liabilities by service'.
Hospital bed based services include acute and sub-acute inpatient units, mental health observation areas and hospital in the home.
The Commission is predominantly funded by Parliamentary appropriations and Commonwealth Grants and Contributions.
Community Bed Based Services
The Commission is responsible for purchasing mental health services, alcohol and other drug services from a range of providers including public health systems, other government agencies,private sector providers and non-government organisations.
Prevention
Hospital Bed Based Services
Community Support
The Commission administers assets, liabilities, income and expenses on behalf of Government which are not controlled by, nor integral, to the function of the Commission. These administeredbalances and transactions are not recognised in the principal financial statements of the Commission but schedules are prepared using the same basis as the financial statements and arepresented at Note 40 ‘Disclosure of administered income and expenses by service’ and Note 41 ‘Administered assets and liabilities’.
Services
Community bed based services are focused on providing recovery-oriented services and residential rehabilitation in a home-like environment.
OVERVIEW AGENCY PERFORMANCE SIGNIFICANT ISSUES APPENDICESDISCLOSURES AND LEGAL COMPLIANCE

Page 59 Mental Health Commission | 2016/17 Annual Report
Financial Statements
Mental Health CommissionNotes to the Financial StatementsFor the year ended 30 June 2017
Note 2
(d)
(e)
Revenue recognition
Sale of goods
Provision of services
Interest
Service appropriations
Net appropriation determination
Service Appropriations are recognised as revenues at fair value in the period in which the Commission gains control of the appropriated funds. The Commission gains control of appropriated fundsat the time those funds are deposited to the bank account or credited to the "Amounts receivable for the services" (holding account) held at Treasury. Refer to note 19 'Income from StateGovernment' for further information.
Summary of significant accounting policies (continued)
Revenue is recognised as the interest accrues.
Revenue is recognised and measured at the fair value of consideration received or receivable as follows:
AASB Interpretation 1038 'Contributions by Owners Made to Wholly-Owned Public Sector Entities' requires transfers in the nature of equity contributions, other than as a result of a restructure ofadministrative arrangements, to be designated by the Government (the owner) as contributions by owners (at the time of, or prior to transfer) before such transfers can be recognised as equitycontributions. Capital appropriations have been designated as contributions by owners by TI 955 'Contributions by Owners made to Wholly Owned Public Sector Entities' and have been crediteddirectly to Contributed Equity.
Refer also to note 30 'Equity'.
Contributed equity
The Treasurer may make a determination providing for prescribed receipts to be retained for services under the control of the Commission. In accordance with the determination specified in the2016-17 Budget Statements, the Commission retained $5,704,895 in 2017 ($12,943,584 in 2016) from the following:
- Specific purpose grants and contributions; and- Other departmental revenue.
Income
Revenue is recognised by reference to the stage of completion of the transaction.
In addition, Commonwealth revenue retained under the National Health Funding Pool Act 2012 totals $162,820,350 in 2017 ($165,620,360 in 2016).
The transfer of net assets to/from other agencies, other than as a result of a restructure of administrative arrangements, are designated as contributions by owners where the transfers are non-discretionary and non-reciprocal.
Revenue is recognised from the sale of goods and disposal of other assets when the significant risks and rewards of ownership transfer to the purchaser and can be measured reliably.
OVERVIEW AGENCY PERFORMANCE SIGNIFICANT ISSUES APPENDICESDISCLOSURES AND LEGAL COMPLIANCE

Page 60 Mental Health Commission | 2016/17 Annual Report
Financial Statements
Mental Health CommissionNotes to the Financial StatementsFor the year ended 30 June 2017
Note 2
(e)
Gains
(f)
Capitalisation/expensing of assets
Initial recognition and measurement
Subsequent measurement
Where market-based evidence is available, the fair value of land and buildings (non-clinical sites) is determined on the basis of current market values determined by reference to recent markettransactions.
Revenue is recognised at fair value when the Commission obtains control over the assets comprising the contributions, usually when cash is received.
Subsequent to initial recognition as an asset, the revaluation model is used for the measurement of land and buildings and historical cost for all other property, plant and equipment. Land andbuildings are carried at fair value less accumulated depreciation (buildings) and accumulated impairment losses. All other items of property, plant and equipment are stated at historical cost lessaccumulated depreciation and accumulated impairment losses.
In the absence of market-based evidence, fair value of land and buildings (clinical sites) is determined on the basis of existing use. This normally applies where buildings are specialised or whereland use is restricted. Fair value for existing use buildings is determined by reference to the cost of replacing the remaining future economic benefits embodied in the asset, i.e. the depreciatedreplacement cost. Fair value for restricted use land is determined by comparison with market evidence for land with similar approximate utility (high restricted use land) or market value ofcomparable unrestricted land (low restricted use land).
For items of property, plant and equipment acquired at no cost or for nominal cost, the cost is their fair value at the date of acquisition.
Summary of significant accounting policies (continued)
Income (continued)
Items of property, plant and equipment costing $5,000 or more are recognised as assets and the cost of utilising assets is expensed (depreciated) over their useful lives. Items of property, plantand equipment costing less than $5,000 are immediately expensed direct to the Statement of Comprehensive Income (other than where they form part of a group of similar items which aresignificant in total).
When buildings are revalued, the accumulated depreciation is eliminated against the gross carrying amount of the asset and the net amount restated to the revalued amount.
Realised and unrealised gains are usually recognised on a net basis. These include gains arising on the disposal of non-current assets and some revaluations of non-current assets.
Property, plant and equipment are initially recognised at cost.
Other non-reciprocal contributions that are not contributions by owners are recognised at their fair value. Contributions of services are only recognised when a fair value can be reliably determinedand the services would be purchased if not donated.
Property, plant and equipment
Royalties for Regions funds are recognised as revenue at fair value in the period in which the Commission obtains control over the funds. The Commission obtains control of the funds at the timethe funds are deposited into the Commission's bank account.
Grants, donations, gifts and other non-reciprocal contributions
OVERVIEW AGENCY PERFORMANCE SIGNIFICANT ISSUES APPENDICESDISCLOSURES AND
LEGAL COMPLIANCE

Page 61 Mental Health Commission | 2016/17 Annual Report
Financial Statements
Mental Health CommissionNotes to the Financial StatementsFor the year ended 30 June 2017
Note 2
(f)
Derecognition
Asset revaluation surplus
Depreciation
Buildings 23 to 50 yearsComputer equipment 4 yearsFurniture and fittings 10 to 20 yearsMedical equipment 10 yearsOther plant and equipment 5 to 10 years
(g) Impairment of assets
The depreciation method for buildings was changed to straight line on 1 July 2016. Up to 30 June 2016, buildings were depreciated using the diminishing value.
Property, plant and equipment are tested for any indication of impairment at the end of each reporting period. Where there is an indication of impairment, the recoverable amount is estimated.Where the recoverable amount is less than the carrying amount, the asset is considered impaired and is written down to the recoverable amount and an impairment loss is recognised. Where anasset measured at cost is written down to recoverable amount, an impairment loss is recognised as expense in the Statement of Comprehensive Income. Where a previously revalued asset iswritten down to recoverable amount, the loss is recognised as a revaluation decrement in other comprehensive income. As the Commission is a not-for-profit entity, unless a specialised asset hasbeen identified as a surplus asset, the recoverable amount is the higher of an asset’s fair value less costs to sell and depreciated replacement cost.
* Buildings, Plant and equipment - straight line
Artworks controlled by the Commission are classified as property, plant and equipment. These are anticipated to have indefinite useful lives. Their service potential has not, in any material sense,been consumed during the reporting period and consequently no depreciation has been recognised.
Land and buildings are independently valued annually by the Western Australian Land Information Authority (Valuation Services) and recognised annually to ensure that the carrying amount doesnot differ materially from the asset’s fair value at the end of the reporting period.
The most significant assumptions and judgements in estimating fair value are made in assessing whether to apply the existing use basis to assets and in determining estimated economic life.Professional judgement by the valuer is required where the evidence does not provide a clear distinction between market type assets and existing use assets.
Summary of significant accounting policies (continued)
Property, plant and equipment (continued)
When buildings are revalued, the accumulated depreciation is eliminated against the gross carrying amount of the asset and the net amount restated to the revalued amount.
Upon disposal or derecognition of an item of property, plant and equipment, any revaluation surplus relating to that asset is retained in the asset revaluation reserve.
The asset revaluation surplus is used to record increments and decrements on the revaluation of non-current assets as described in note 25 'Property, plant and equipment'.
All non-current assets having a limited useful life are systematically depreciated over their estimated useful lives in a manner that reflects the consumption of their future economic benefits.
In order to apply this policy, the following methods are utilised:* Land - not depreciated
See also note 25 'Property, plant and equipment' for further information on revaluation.
The assets' useful lives are reviewed, and adjusted if appropriate, annually. Estimated useful lives for each class of depreciable asset are:
OVERVIEW AGENCY PERFORMANCE SIGNIFICANT ISSUES APPENDICESDISCLOSURES AND
LEGAL COMPLIANCE

Page 62 Mental Health Commission | 2016/17 Annual Report
Financial Statements
Mental Health CommissionNotes to the Financial StatementsFor the year ended 30 June 2017
Note 2
(g)
(h)
(i)
Leases
Leases of property, plant and equipment, where the Commission has substantially all of the risks and rewards of ownership, are classified as finance leases. The Commission does not have anyfinance leases.
• Financial liabilities measured at amortised cost.
Financial instruments have been disaggregated into the following classes:
Property, plant and equipment are tested for any indication of impairment at the end of each reporting period. Where there is an indication of impairment, the recoverable amount is estimated.Where the recoverable amount is less than the carrying amount, the asset is considered impaired and is written down to the recoverable amount and an impairment loss is recognised. Where anasset measured at cost is written down to recoverable amount, an impairment loss is recognised as expense in the Statement of Comprehensive Income. Where a previously revalued asset iswritten down to recoverable amount, the loss is recognised as a revaluation decrement in other comprehensive income. As the Commission is a not-for-profit entity, unless a specialised asset hasbeen identified as a surplus asset, the recoverable amount is the higher of an asset’s fair value less costs to sell and depreciated replacement cost.
• Loans and receivables; and
Summary of significant accounting policies (continued)
Impairment of assets (continued)
The recoverable amount of assets identified as surplus assets is the higher of fair value less costs to sell and the present value of future cash flows expected to be derived from the asset. Surplusassets carried at fair value have no risk of material impairment where fair value is determined by reference to market-based evidence. Where fair value is determined by reference to depreciatedreplacement cost, surplus assets are at risk of impairment and the recoverable amount is measured. Surplus assets at cost are tested for indications of impairment at the end of each reportingperiod.
Refer also to note 2(l) 'Receivables" and note 21 'Receivables' for impairment of receivables and note 27 'Impairment of assets'.
The risk of impairment is generally limited to circumstances where an asset’s depreciation is materially understated, where the replacement cost is falling or where there is a significant change inuseful life. Each relevant class of assets is reviewed annually to verify that the accumulated depreciation reflects the level of consumption or expiration of asset's future economic benefits and toevaluate any impairment risk from falling replacement costs.
• Amounts receivable for services
Financial instruments
• Receivables
• Cash and cash equivalents
Leases in which the lessor retains significantly all of the risks and rewards of ownership are classified as operating leases. Operating lease payments are expensed on a straight line basis over thelease term as this represents the pattern of benefits derived from the leased items.
• Restricted cash and cash equivalents
Financial Assets
In addition to cash, the Commission has two categories of financial instrument:
Initial recognition and measurement of financial instruments is at fair value which normally equates to the transaction cost or the face value. Subsequent measurement is at amortised cost usingthe effective interest method.
Financial Liabilities• Payables
The fair value of short-term receivables and payables is the transaction cost or the face value because there is no interest rate applicable and subsequent measurement is not required as the effectof discounting is not material.
OVERVIEW AGENCY PERFORMANCE SIGNIFICANT ISSUES APPENDICESDISCLOSURES AND LEGAL COMPLIANCE

Page 63 Mental Health Commission | 2016/17 Annual Report
Financial Statements
Mental Health CommissionNotes to the Financial StatementsFor the year ended 30 June 2017
Note 2
(j)
(k)
(l) Receivables
Accounting procedure for Goods and Services Tax
(m) Amounts receivable for services (holding account)
(n) Inventories
Accrued salaries
Revenues, expenses and assets are recognised net of the amount of associated GST. Payables and receivables are stated inclusive of the amount of GST receivable or payable. The net amountof GST recoverable from the ATO is included with Receivables in the Statement of Financial Position.
See also note 19 'Income from State Government' and note 22 'Amounts receivable for services'.
For the purpose of the Statement of Cash Flows, cash and cash equivalent (and restricted cash and cash equivalent) assets comprise cash on hand, cash at bank, and short-term deposits withoriginal maturities of three months or less that are readily convertible to a known amount of cash and which are subject to insignificant risk of changes in value.
The Commission receives state appropriation funding from the State Government on an accural basis, partly in cash and partly as an asset (holding account receivable). The accrued amountreceivable is accessible on the emergence of the cash funding requirement to cover leave entitlements and asset replacement.
Rights to collect amounts receivable from the Australian Taxation Office (ATO) and responsibilities to make payments for GST have been assigned to the 'Department of Health'. This accountingprocedure was a result of application of the grouping provisions of “A New Tax System (Goods and Services Tax) Act 1999" whereby the Department of Health became the Nominated GroupRepresentative (NGR) for the GST Group as from 1 July 2012. The entities in the GST group include the Department of Health, Mental Health Commission, East Metropolitan Health Service, NorthMetropolitan Health Service, South Metropolitan Health Service, Child and Adolescent Health Service, Health Support Services, WA Country Health Service, QE II Medical Centre Trust, and Healthand Disability Services Complaints Office.
Summary of significant accounting policies (continued)
Cash and cash equivalents
Refer to note 2(i) 'Financial instruments' and note 21 'Receivables'.
Accrued salaries (see note 28 'Payables') represent the amount due to employees but unpaid at the end of the financial year. Accrued salaries are settled within a fortnight of the financial year end.The Commission considers the carrying amount of accrued salaries to be equivalent to its fair value.
Inventories not held for resale are measured at cost unless they are no longer required in which case they are measured at net realisable value. (See note 23 'Inventories')
Receivables are recognised at original invoice amount less an allowance for uncollectible amounts (i.e. impairment). The collectability of receivables is reviewed on an ongoing basis and anyreceivables identified as uncollectible are written off against the allowance account. The allowance for uncollectible amounts (doubtful debts) is raised when there is objective evidence that theCommission will not be able to collect the debts. The carrying amount is equivalent to fair value as it is due for settlement within 30 days.
The accrued salaries suspense account (see note 20 'Restricted cash and cash equivalents') consists of amounts paid annually into a suspense account over a period of 10 financial years tolargely meet the additional cash outflow in each eleventh year when 27 pay days occur instead of the normal 26. No interest is received on this account.
Inventories are measured at the lower of cost and net realisable value. Costs are assigned on a weighted average cost basis.
OVERVIEW AGENCY PERFORMANCE SIGNIFICANT ISSUES APPENDICESDISCLOSURES AND
LEGAL COMPLIANCE

Page 64 Mental Health Commission | 2016/17 Annual Report
Financial Statements
Mental Health CommissionNotes to the Financial StatementsFor the year ended 30 June 2017
Note 2
(o)
(p)
Refer to note 29 'Provisions'.
Provisions - employee benefits
Long service leave is not expected to be settled wholly within 12 months after the end of the reporting period. The long service leave liability is recognised and measured at the present value ofamounts expected to be paid when the liabilities are settled using the remuneration rate expected to apply at the time of settlement.
Provisions are liabilities of uncertain timing or amount and are recognised where there is a present legal or constructive obligation as a result of a past event and when the outflow of resourcesembodying economic benefits is probable and a reliable estimate can be made of the amount of obligation. Provisions are reviewed at the end of each reporting period.
When assessing expected future payments, consideration is given to expected future wage and salary levels including non-salary components such as employer superannuation contributions, aswell as the experience of employee departures and periods of service. The expected future payments are discounted using market yields at the end of the reporting period on national governmentbonds with terms to maturity that match, as closely as possible, the estimated future cash outflows.
Annual leave is not expected to be settled wholly within 12 months after the end of the reporting period and is therefore considered to be 'other long-term employee benefits'. The annual leaveliability is recognised and measured at the present value of amounts expected to be paid when the liabilities are settled using the remuneration rate expected to apply at the time of settlement.
When assessing expected future payments, consideration is given to expected future wage and salary levels including non-salary components such as employer superannuation contributions, aswell as the experience of employee departures and periods of service. The expected future payments are discounted using market yields at the end of the reporting period on national governmentbonds with terms to maturity that match, as closely as possible, the estimated future cash outflows.
Long service leave
Unconditional long service leave provisions are classified as current liabilities as the Commission does not have an unconditional right to defer settlement of the liability for at least 12 months afterthe end of the reporting period. Pre-conditional and conditional long service leave provisions are classified as non-current liabilities because the Commission has an unconditional right to defer thesettlement of the liability until the employee has completed the requisite years of service.
Annual leave
Provisions
All annual leave and long service leave provisions are in respect of employees’ services up to the end of the reporting period.
The provision for annual leave is classified as a current liability as the Commission does not have an unconditional right to defer settlement of the liability for at least 12 months after the end of thereporting period.
Payables
Payables are recognised when the Commission becomes obliged to make future payments as a result of a purchase of assets or services. The carrying amount is equivalent to fair value, as theyare generally settled within 30 days.
Refer to note 2(i) 'Financial Instruments' and note 28 'Payables'.
Summary of significant accounting policies (continued)
OVERVIEW AGENCY PERFORMANCE SIGNIFICANT ISSUES APPENDICESDISCLOSURES AND LEGAL COMPLIANCE

Page 65 Mental Health Commission | 2016/17 Annual Report
Financial Statements
Mental Health CommissionNotes to the Financial StatementsFor the year ended 30 June 2017
Note 2
(p)
Deferred Salary Scheme
Liabilities for sick leave are recognised when it is probable that sick leave paid in the future will be greater than the entitlement that will accrue in the future.
Refer to note 2(q) ‘Superannuation expense’.
Refer to note 14 'Other expenses' and note 29 'Provisions'.
Employment on-costs (workers’ compensation insurance) are not employee benefits and are recognised separately as liabilities and expenses when the employment to which they relate hasoccurred. Employment on-costs are included as part of ‘Other expenses’ and are not included as part of the Commission's 'Employee benefits expense'. Any related liability is included in‘Employment on-costs provision’.
The GSS is a defined benefit scheme for the purposes of employees and whole-of-government reporting. However, it is a defined contribution plan for agency purposes because the concurrentcontributions (defined contributions) made by the Commission to GESB extinguishes the Commission’s obligations to the related superannuation liability.
Past history indicates that on average, sick leave taken each reporting period is less than the entitlement accrued. This is expected to continue in future periods. Accordingly, it is unlikely thatexisting accumulated entitlements will be used by employees and no liability for unused sick leave entitlements is recognised. As sick leave is non-vesting, an expense is recognised in theStatement of Comprehensive Income for this leave as it is taken.
Sick Leave
Employees commencing employment prior to 16 April 2007 who were not members of either the Pension Scheme or the GSS became non-contributory members of the West State SuperannuationScheme (WSS). Employees commencing employment on or after 16 April 2007 became members of the GESB Super Scheme (GESBS). From 30 March 2012, existing members of the WSS orGESBS and new employees have been able to choose their preferred superannuation fund provider. The Commission makes contributions to GESB or other fund providers on behalf of employeesin compliance with the Commonwealth Government’s Superannuation Guarantee (Administration) Act 1992 . Contributions to these accumulation schemes extinguish the Commission's liability forsuperannuation charges in respect of employees who are not members of the Pension Scheme or GSS.
The provision for deferred salary scheme relates to the Commission's employees who have entered into an agreement to self-fund an additional twelve months leave in the fifth year of theagreement. The provision recognises the value of salary set aside for employees to be used in the fifth year. This liability is measured on the same basis as annual leave. Deferred salary scheme isreported as a current provision as employees can leave the scheme at their discretion at any time.
The Commission has no liabilities under the Pension Scheme or the GSS. The liabilities for the unfunded Pension Scheme and the unfunded GSS transfer benefits attributable to members whotransferred from the Pension Scheme, are assumed by the Treasurer. All other GSS obligations are funded by concurrent contributions made by the Commission to the GESB.
The GESB makes all benefit payments in respect of the Pension Scheme and GSS, and is recouped from the Treasurer for the employer's share.
The Government Employees Superannuation Board (GESB) and other fund providers administer public sector superannuation arrangements in Western Australia in accordance with legislativerequirements. Eligibility criteria for membership in particular schemes for public sector employees vary according to commencement and implementation dates.
Eligible employees contribute to the Pension Scheme, a defined benefit pension scheme closed to new members since 1987, or the Gold State Superannuation Scheme (GSS), a defined benefitlump sum scheme closed to new members since 1995.
Employment on-costs
Summary of significant accounting policies (continued)
Provisions (continued)
Superannuation
OVERVIEW AGENCY PERFORMANCE SIGNIFICANT ISSUES APPENDICESDISCLOSURES AND
LEGAL COMPLIANCE

Page 66 Mental Health Commission | 2016/17 Annual Report
Financial Statements
Mental Health CommissionNotes to the Financial StatementsFor the year ended 30 June 2017
Note 2
(q)
(r)
(s)
(t)
Note 3
Comparative figures are, where appropriate, reclassified to be comparable with the figures presented in the current financial year.
Services received free of charge or for nominal cost
Services received from other State Government agencies are separately disclosed under Income from State Government in the Statement of Comprehensive Income.
Comparative figures
Superannuation expense recognised in the Statement of Comprehensive Income comprises employer contributions paid to the GSS (concurrent contributions), the West State SuperannuationScheme (WSS), the GESB Super Scheme (GESBS) and other superannuation funds. The employer contribution paid to the GESB in respect of the GSS is paid back into the Consolidated Accountby the GESB.
A number of buildings that are located on the land of local government agencies have been recognised in the financial statements. The Commission believes that, based on past experience, itsoccupancy in these buildings will continue to the end of their useful lives.
Employee benefits provision
An average turnover rate for employees has been used to calculate the non-current long service leave provision. This turnover rate is representative of the Health public authorities in general.
Operating lease commitments
Discretionary transfers of net assets (assets and liabilities) between State Government agencies free of charge, are measured at the fair value of those net assets that the Commission wouldotherwise pay for, and are reported under Income from State Government. Transfers of assets and liabilities in relation to a restructure of administrative arrangements are recognised as distributionto owners by the transferor and contribution by owners by the transferee under AASB 1004 'Contributions ' in respect of the net assets transferred.
Services received free of charge or for nominal cost, that the Commission would otherwise purchase if not donated, are recognised as income at the fair value of the services where they can bereliably measured. A corresponding expense is recognised for services received.
Judgements made by management in applying accounting policies
Superannuation expense
The Commission has entered into a number of leases for office accommodation. It has been determined that the lessor retains substantially all the risks and rewards incidental to ownership.Accordingly, these leases have been classified as operating leases.
Summary of significant accounting policies (continued)
Assets transferred between government agencies
The preparation of financial statements requires management to make judgements about the application of accounting policies that have a significant effect on the amounts recognised in thefinancial statements. The Commission evaluates these judgements regularly.
Buildings
The judgements that have been made in the process of applying accounting policies that have the most significant effect on the amounts recognised in the financial statements include:
OVERVIEW AGENCY PERFORMANCE SIGNIFICANT ISSUES APPENDICESDISCLOSURES AND
LEGAL COMPLIANCE

Page 67 Mental Health Commission | 2016/17 Annual Report
Financial Statements
Mental Health CommissionNotes to the Financial StatementsFor the year ended 30 June 2017
Note 4
Note 5
The Commission has applied the following Australian Accounting Standards effective, or adopted, for annual reporting periods beginning on or after 1 July 2016 that impacted on the Commission.
AASB 1057
AASB 2014-4
AASB 2015-1
AASB 2015-2
AASB 2015-6
Buildings
Key sources of estimation uncertainty
Key estimates and assumptions concerning the future are based on historical experience and various other factors that have a significant risk of causing a material adjustment to the carryingamount of assets and liabilities within the next financial year.
In order to estimate fair value on the basis of existing use, the depreciated replacement costs are determined on the assumption that the buildings will be used for the same functions in the future.A major change in utilisation of the buildings may result in material adjustment to the carrying amounts.
Initial application of an Australian Accounting Standard
Amendments to Australian Accounting Standards - Extending Related Party Disclosures to Not-for-Profit Public Sector Entities (AASB 10, 124 & 1049)
Disclosure of changes in accounting policy and estimates
These amendments arise from the issuance of International Financial Reporting Standard Annual Improvements to IFRSs 2012-2014 Cycle in September 2014, andeditorial corrections. The Commission has determined the application of the Standard has no financial impact.
The adoption of this Standard has no financial impact for the Commission as depreciation and amortisation is not determined by reference to revenue generation,but by reference to consumption of future economic benefits.
Amendments to Australian Accounting Standards – Clarification of Acceptable Methods of Depreciation and Amortisation [AASB 116 & 138]
Long Service Leave
Several estimations and assumptions used in calculating the Commission’s long service leave provision include expected future salary rates, discount rates, employee retention rates and expectedfuture payments. Changes in these estimations and assumptions may impact on the carrying amount of the long service leave provision.
The amendments extend the scope of AASB 124 to include application by not-for-profit public sector entities. Implementation guidance is included to assistapplication of the Standard by not-for-profit public sector entities. There is no financial impact.
This Standard amends AASB 101 to provide clarification regarding the disclosure requirements in AASB 101. Specifically, the Standard proposes narrow-focusamendments to address some of the concerns expressed about existing presentation and disclosure requirements and to ensure entities are able to use judgementwhen applying a Standard in determining what information to disclose in their financial statements. There is no financial impact.
Amendments to Australian Accounting Standards - Annual Improvements to Australian Accounting Standards 2012-2014 Cycle (AASB 1, 2, 3, 5, 7, 11, 110, 119, 121, 133, 134, 137 & 140)
Amendments to Australian Accounting Standards - Disclosure Initiative: Amendments to AASB 101 (AASB 7, 101, 134 & 1049)
Application of Australian Accounting Standard
This Standard lists the application paragraphs for each other Standard (and Interpretation), grouped where they are the same. There is no financial impact.
OVERVIEW AGENCY PERFORMANCE SIGNIFICANT ISSUES APPENDICESDISCLOSURES AND
LEGAL COMPLIANCE
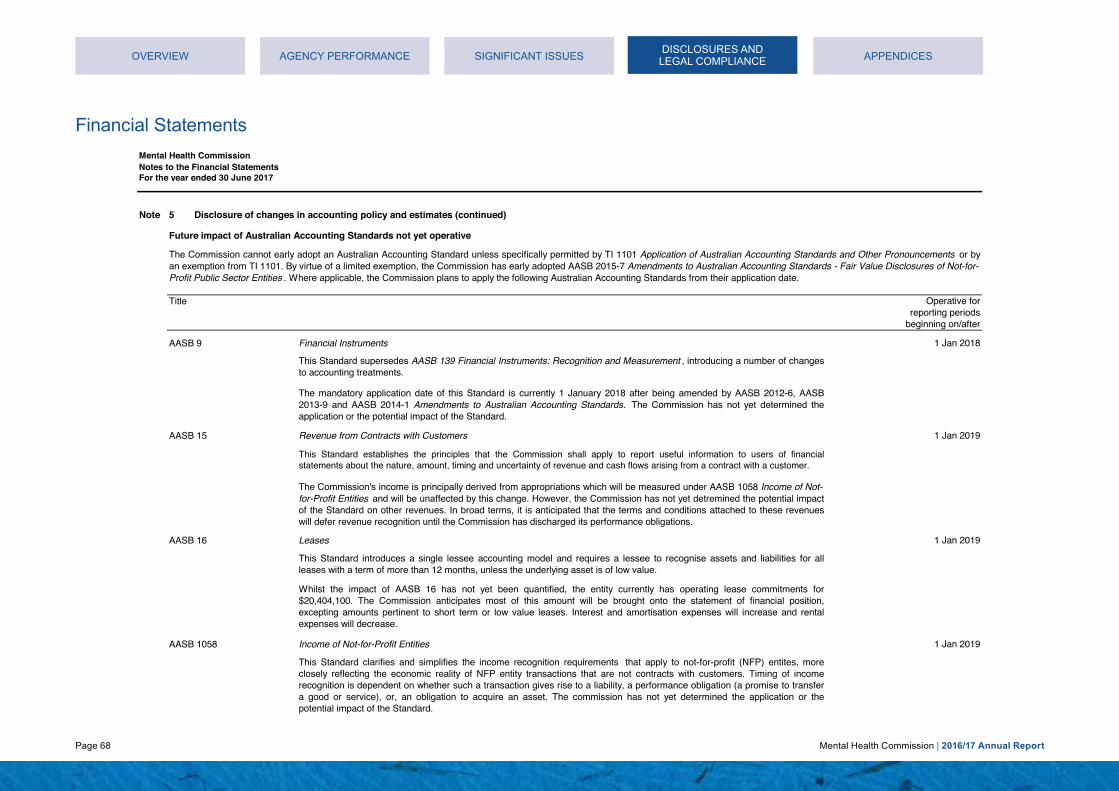
Page 68 Mental Health Commission | 2016/17 Annual Report
Financial Statements
Mental Health CommissionNotes to the Financial StatementsFor the year ended 30 June 2017
Note 5
Future impact of Australian Accounting Standards not yet operative
Title
AASB 9 1 Jan 2018
AASB 15 1 Jan 2019
AASB 16 1 Jan 2019
AASB 1058 1 Jan 2019
The Commission's income is principally derived from appropriations which will be measured under AASB 1058 Income of Not-for-Profit Entities and will be unaffected by this change. However, the Commission has not yet detremined the potential impactof the Standard on other revenues. In broad terms, it is anticipated that the terms and conditions attached to these revenueswill defer revenue recognition until the Commission has discharged its performance obligations.
Whilst the impact of AASB 16 has not yet been quantified, the entity currently has operating lease commitments for$20,404,100. The Commission anticipates most of this amount will be brought onto the statement of financial position,excepting amounts pertinent to short term or low value leases. Interest and amortisation expenses will increase and rentalexpenses will decrease.
Leases
Revenue from Contracts with Customers
This Standard establishes the principles that the Commission shall apply to report useful information to users of financialstatements about the nature, amount, timing and uncertainty of revenue and cash flows arising from a contract with a customer.
This Standard clarifies and simplifies the income recognition requirements that apply to not-for-profit (NFP) entites, moreclosely reflecting the economic reality of NFP entity transactions that are not contracts with customers. Timing of incomerecognition is dependent on whether such a transaction gives rise to a liability, a performance obligation (a promise to transfera good or service), or, an obligation to acquire an asset. The commission has not yet determined the application or thepotential impact of the Standard.
The Commission cannot early adopt an Australian Accounting Standard unless specifically permitted by TI 1101 Application of Australian Accounting Standards and Other Pronouncements or byan exemption from TI 1101. By virtue of a limited exemption, the Commission has early adopted AASB 2015-7 Amendments to Australian Accounting Standards - Fair Value Disclosures of Not-for-Profit Public Sector Entities . Where applicable, the Commission plans to apply the following Australian Accounting Standards from their application date.
Financial Instruments
Operative forreporting periods
beginning on/after
Disclosure of changes in accounting policy and estimates (continued)
This Standard supersedes AASB 139 Financial Instruments: Recognition and Measurement , introducing a number of changesto accounting treatments.
The mandatory application date of this Standard is currently 1 January 2018 after being amended by AASB 2012-6, AASB2013-9 and AASB 2014-1 Amendments to Australian Accounting Standards. The Commission has not yet determined theapplication or the potential impact of the Standard.
This Standard introduces a single lessee accounting model and requires a lessee to recognise assets and liabilities for allleases with a term of more than 12 months, unless the underlying asset is of low value.
Income of Not-for-Profit Entities
OVERVIEW AGENCY PERFORMANCE SIGNIFICANT ISSUES APPENDICESDISCLOSURES AND
LEGAL COMPLIANCE

Page 69 Mental Health Commission | 2016/17 Annual Report
Financial Statements
Mental Health CommissionNotes to the Financial StatementsFor the year ended 30 June 2017
Note 5
Future impact of Australian Accounting Standards not yet operative (continued)
Title
AASB 2010-7 1 Jan 2018
AASB 2014-1 1 Jan 2018
AASB 2014-5 1 Jan 2018
AASB 2014-7 1 Jan 2018
AASB 2015-8 1 Jan 2019
Amendments to Australian Accounting Standards arising from AASB 9 (December 2014)
Amendments to Australian Accounting Standards arising from AASB 15
This Standard amends the mandatory effective date (application date) of AASB 15 Revenue from Contracts with Customers so that AASB15 is required to be applied for annual reporting periods beginning on or after 1 January 2018 instead of 1 January2017. For Not-For-Profit entities, the mandatory effective date has subsequently been amended to 1 January 2019 by AASB2016-7. The Commission has not yet determined the application or the potential impact of AASB 15.
Amendments to Australian Accounting Standards arising from AASB 9 (December 2010) [AASB 1, 3, 4, 5, 7, 101, 102, 108,112, 118, 120, 121, 127, 128, 131, 132, 136, 137, 139, 1023 & 1038 and Int 2, 5, 10, 12, 19 & 127]
Part E of this Standard makes amendments to AASB 9 and consequential amendments to other Standards. It has not yet beenassessed by the Commission to determine the application or potential impact of the Standard.
Amendments to Australian Accounting Standards
This Standard makes consequential amendments to other Australian Accounting Standards and Interpretations as a result ofissuing AASB 9 in December 2010. The mandatory application date of this Standard has been amended by AASB 2012-6 and AASB 2014-1 to 1 January 2018.The Commission has not yet determined the application or the potential impact of the Standard.
This Standard gives effect to the consequential amendments to Australian Accounting Standards (including Interpretations)arising from the issuance of AASB 9 (December 2014). The Commission has not yet determined the application or thepotential impact of the Standard. Amendments to Australian Accounting Standards - Effective Date of AASB 15
Operative forreporting periods
beginning on/after
Disclosure of changes in accounting policy and estimates (continued)
This Standard gives effect to the consequential amendments to Australian Accounting Standards (including Interpretations)arising from the issuance of AASB 15. The mandatory application date of this Standard has been amended by AASB 2015-8 to1 January 2018. The Commission has not yet determined the application or the potential impact of the Standard.
OVERVIEW AGENCY PERFORMANCE SIGNIFICANT ISSUES APPENDICESDISCLOSURES AND
LEGAL COMPLIANCE

Page 70 Mental Health Commission | 2016/17 Annual Report
Financial Statements
Mental Health CommissionNotes to the Financial StatementsFor the year ended 30 June 2017
Note 5
Future impact of Australian Accounting Standards not yet operative (continued)
Title
AASB 2016-2 1 Jan 2017
AASB 2016-3 1 Jan 2018
AASB 2016-4 1 Jan 2017
AASB 2016-7 1 Jan 2017
AASB 2016-8 1 Jan 2019
Amendments to Australia Accounting Standards - Recoverable Amount of Non-Cash-Generating Specialised Assets of Not-for-Profit Entities.
Amendments to Australian Accounting Standards - Clarifications to AASB 15
Amendments to Australian Accounting Standards – Deferral of AASB 15 for Not for Profit Entities
This Standard clarifies that recoverable amount of primarily non-cash-generating assets of not-for-profit entities, which aretypically specialised in nature and held for continuing use of their service capacity, is expected to be materially the same as fairvalue determined under AASB13 Fair Value Measurement . The Commission has not yet determined the application or thepotential impact.
Amendments to Australian Accounting Standards - Disclosure Initiative: Amendments to AASB 107
This Standard clarifies identifying performance obligations, principal versus agent considerations, timing of recognisingrevenue from granting a licence, and, provides further transitional provisions to AASB 15. The Commission has not yetdetermined the application or the potential impact.
Operative forreporting periods
beginning on/after
This Standard inserts Australian requirements and authoritative implementation guidance for not-for-profit entities into AASB 9and AASB 15. This guidance assists not-for-profit entities in applying those Standards to particular transactions and otherevents. There is no financial impact.
The Standard amends AASB 107 Statement of Cash Flows (August 2015) to require disclosures that enable users of financialstatements to evaluate changes in liabilities arising from financing activities, including both changes arising from cash flowsand non-cash changes. There is no financial impact.
Amendments to Australian Accounting Standards – Australian Implementation Guidance for Not for Profit Entities
Disclosure of changes in accounting policy and estimates (continued)
This Standard amends the mandatory effective date (application date) of AASB 15 and defers the consequential amendmentsthat were originally set out in AASB 2014 5 Amendments to Australian Accounting Standards arising from AASB 15 for not forprofit entities to annual reporting periods beginning on or after 1 January 2019, instead of 1 January 2018. There is nofinancial impact.
OVERVIEW AGENCY PERFORMANCE SIGNIFICANT ISSUES APPENDICESDISCLOSURES AND
LEGAL COMPLIANCE

Page 71 Mental Health Commission | 2016/17 Annual Report
Financial Statements
Mental Health CommissionNotes to the Financial StatementsFor the year ended 30 June 2017
2017 2016$ $
Note 6 32,801,318 35,632,630 3,174,093 3,349,407
35,975,411 38,982,037
Note 7
Compensation of Senior Officers Band ($) 2017 2016480,001 - 490,000 - 1410,001 - 420,000 1 -390,001 - 400,000 - 1330,001 - 340,000 1 -230,001 - 240,000 1 -210,001 - 220,000 - 1200,001 - 210,000 3 1190,001 - 200,000 2 1180,001 - 190,000 - 2160,001 - 170,000 2 2140,001 - 150,000 - 2130,001 - 140,000 1 -120,001 - 130,000 1 180,001 - 90,000 1 -70,001 - 80,000 - 160,001 - 70,000 1 -40,001 - 50,000 1 -20,001 - 30,000 1 -
$ $Short-term employee benefits 2,204,888 2,188,170Post-employment benefits 281,574 283,394Other long-term benefits 298,194 233,767Total compensation of key management personnel 2,784,656 2,705,331
(a) Includes the value of the fringe benefit to the employees plus the fringe benefits tax component and the value of superannuationcontribution component for leave entitlements.
Total compensation for key management personnel, comprising senior officers of the Commission for the reporting period are presented within the following bands:
Compensation of Key Management Personnel
Employment on-costs (workers' compensation insurance) are included at note 14 'Other expenses'.
Superannuation - defined contribution plans (b)
Employee benefits expenseSalaries and wages (a)
The Commission has determined that key management personnel include the responsible Minister and senior officers of the Commission. However, the Commission is not obligated for thecompensation of the responsible Minister and therefore no disclosure is required. The disclosure in relation to the responsible Minister's compensation may be found in the Annual Report on StateFinances.
(b) Defined contribution plans include West State, Gold State and GESB Super and other eligible funds. Super contribution paid toGESB for West State, Gold State and GESB Super is $2,892,957 (2015-16 $3,108,907).
OVERVIEW AGENCY PERFORMANCE SIGNIFICANT ISSUES APPENDICESDISCLOSURES AND LEGAL COMPLIANCE

Page 72 Mental Health Commission | 2016/17 Annual Report
Financial Statements
Mental Health CommissionNotes to the Financial StatementsFor the year ended 30 June 2017
2017 2016$ $
Note 8- 551,954,527
163,094,963 - 235,021,901 - 116,588,065 - 59,464,397 - 96,096,163 91,931,167
670,265,489 643,885,694
Note 9 139,015,908 137,109,599
Note 10
529,976 247,086 4,074,044 3,665,055 3,188,663 3,917,088
240,336 272,780 1,336,746 1,364,281
394,702 396,699 4,190 14,476
296,717 371,260 281,739 382,736 42,814 53,178
10,389,927 10,684,639
Printing and Stationery
Service agreement - non government and other organisations
Equipment lease expenses
Service agreement - WA Health
Non-government and other organisationsNon-government and other organisations are contracted to provide specialised mental health, alcohol and other drug services to thecommunity.
Supplies and services
Metropolitan Health Service
Other
Specific project expenses - other government organisations (a)Purchase of outsourced services (b)Corporate support services (c)
Consulting fees (b)Consumables
Communications
Computer related services
Child and Adolescent Health ServiceWA Country Health Service
(c) Health Support Services, previously within Metropolitan Health Service, has provided supply services, IT services, humanresource services, finance services to the Commission since 2010. Due to proclamation of Health service Act 2016, MetropolitanHealth Service is abolished and new health services have been established including Health Support Services. Service provided isinclusive free of charge $3,095,2975 (2015-16 $3,791,791).
Metropolitan Health Service is abolished on 1 July 2016 and established 5 Health Services Providers including Health SupportServices due to proclamation of Health Services Act 2016. WA Health comprises the Department of Health, East MetropolitanHealth Service, North Metropolitan Health Service, South Metropolitan Health Service, Child and Adolescent Health Service, HealthSupport Services and WA Country Health Service. Under the Commission Service Agreements, public hospitals in WA Healthprovide specialised mental health services to the public patients and the community.
(a) Department of Corrective Services $434,537 (2015-16 $247,086) and Western Australia Police Service $95,439 (2015-16 $0).(b) Department of Finance $368,809 (2015-16 $284,750) and Western Australia Police Service $0 (2015-16 $146,000).
East Metropolitan Health ServiceNorth Metropolitan Health ServiceSouth Metropolitan Health Service
OVERVIEW AGENCY PERFORMANCE SIGNIFICANT ISSUES APPENDICESDISCLOSURES AND LEGAL COMPLIANCE

Page 73 Mental Health Commission | 2016/17 Annual Report
Financial Statements
Mental Health CommissionNotes to the Financial StatementsFor the year ended 30 June 2017
2017 2016Note 11 $ $
- 1,900,0001,074,830 1,709,478
- 506,148100,000 441,350442,000 424,114608,310 -639,201 1,661,763
2,864,341 6,642,853
Note 12
422,267 428,84516,628 16,629
- 3911,647 1,647
33,214 7,611473,756 455,123
Note 13
2,249,106 1,023,150
Note 14
195,522 593,523 361,973 496,148 433,678 1,053,043
- 667,900 69,801 240,389
168,370 227,187 124,887 345,710 73,803 127,909
206,328 308,632 66,677 93,426
105,539 96,217 4,299 31,389
62,358 149,818 1,873,235 4,431,291
National Perinatal Depression Initiative
Crisis Accommodation Support
National Partnership Agreement - Improving public hospitals
Grants and subsidies
Recurrent
Computer equipment
Accommodation expense
Depreciation expense
Other expenses
Prevention and Anti-Stigma
Other employee related expenses
Loss on revaluation of landLoss on revaluation of buildings
Other plant and equipment
Other grants
Advertising
Workers' compensation insurance (a) (b)
Disposal of non-current assetOther (c)
Travel related expenses (d)Audit fees (e)
Other insurance (b)
Expenses include Department of Finance $2,066,920 (2015-16 $420,395) and Health Support Services $408,597 in 2015-16.
Grants and subsidies include payment to Disability Services Commission $50,000 (2015-16 $50,000), Department for ChildProtection $533,785 (2015-16 $424,114), refund to Road Safety Commission $608,310 (2015-16 $0), Department of Education$417,390 (2015-16 $486,998), Department of Housing 1,900,000 in 2015-16, Department of Health $110,113 in 2015-16 and WACountry Health Service $50,000 in 2015-16.
Suicide Prevention Strategy
Office accommodation expenses
Medical equipment
Consumable equipment, repairs and maintenance (c)
Legal fees (f)Administration
Furniture and fittings
Buildings
Alcohol Assessment and Treatment Services
OVERVIEW AGENCY PERFORMANCE SIGNIFICANT ISSUES APPENDICESDISCLOSURES AND
LEGAL COMPLIANCE

Page 74 Mental Health Commission | 2016/17 Annual Report
Financial Statements
Mental Health CommissionNotes to the Financial StatementsFor the year ended 30 June 2017
Note 14
Note 15
• • • • •
• • • • • • • • • • • • • • • • •
(f) Include expense to State Solicitor's Office $72,701 (2015-16 $99,941).
Related Party Transactions
the Government Employees Superannuation Board (GESB).
Material transactions with related parties
Significant transactions with Government-related entitiesSignificant transactions include:
Other expenses (continued)(a) The employment on-costs include workers' compensation insurance only. Any on-costs liability associated with the recognition of annual and long service leave liability is included at note 29'Provisions'. Superannuation contributions accrued as part of the provision for leave are employee benefits and are not included in employment on-costs.(b) Include expense to Riskcover $311,507 (2015-16 $699,388).(c) Include expense to Department of Finance $16,156 (2015-16 $83,418).
all departments and public sector entities, including their related bodies, that are included in the whole of government consolidated financial statements;associates and joint ventures, that are included in the whole of Government consolidated financial statements; and
corporate support services - Health Support Services (prior year within Metropolitan Health Service) (Note 10);
Related parties of the Commission include:all Ministers and their close family members, and their controlled or jointly controlled entities;
The Mental Health Commissioner, Mr. Timothy Michael Marney, is the Deputy Chair of the Beyond Blue Ltd, Board of Directors. A not-for-profit organisation, Beyond Blue Ltd, focuses on raisingawareness and understanding of anxiety and depression in Australia, and received $342,000 funding from the Commission in 2016/17. This funding, which commenced in 2000, predates theestablishment of the Commission and has remained at approximately this level since 2005. The Commission’s current contract with Beyond Blue Ltd is for five years contract total value of$1,710,000 from 2015 to 2020. This contract was awarded and approved by the Director, Non-Government Organisations Purchasing and Development in 2015. Funding decisions and contractmanagment is separted from the Commissioner to ensure there is no capicity to influence decisons.
(e) Include expense to Office of Audit General $0 (2015-16 $258,927). In 2015-16 expense to Office of Audit General is inclusive of 2014-15 payment and accrued 2015-16 audit fee. In 2016-17,accrued 2015-16 fee is paid however no fee is accrued at the end of financial year 2016-17. So net expense to Office of Audit General is $0 in 2016-17.
grants and contribution received from other government agencies (Note 17).
The Commission is a wholly-owned public sector entity that is controlled by the State of the Western Australia. In conducting its activities, the Commission is required to pay various taxes andlevies based on the standard terms and conditions that apply to all tax and levy payers to the State and entities related to the State.
service appropriation (Note 19);other contribution by owners (Note 30);services received free of charge from the other state government agencies (Note 19);
legal fees from State Solicitor's Office (Note 14); and
purchase of outsourced services - Western Australia Police Service (Note10);
(d) Include expense to Statefleet $79,196 (2015-16 $120,730).
royalties for regions fund (Note 19 & 30);
services provided free of charge to the other state government agencies (Note 38);
services agreement WA Health (Note 8);specific project expenses - Department of Corrective Services and Western Australia Police Service (Note 10);
grants and subsidies payment to other government agencies (Note 11);project management consultancies and other payments (Note 10), consumable and other payments (Note 14) to Department of Finance ;
lease rentals and accommodation related payments to the Department of Finance and Health Support Services (Note 13);
audit fees payments to Office of Audit General (Note 14);
workers' compensation and other insurance payment to Riskcover (Note 14);vehicle rental payments to Statefleet (Note 14);
all senior officers and their close family members, and their controlled or jointly controlled entities;
OVERVIEW AGENCY PERFORMANCE SIGNIFICANT ISSUES APPENDICESDISCLOSURES AND
LEGAL COMPLIANCE

Page 75 Mental Health Commission | 2016/17 Annual Report
Financial Statements
Mental Health CommissionNotes to the Financial StatementsFor the year ended 30 June 2017
Note 15
• 2017 2016
$ $Note 16
162,820,350 165,620,360
- 7,004,000- 31,900
181,760 189,715181,000 181,000155,000 -
163,338,110 173,026,975
Note 17
685,131 763,1291,129,745 1,154,745
Department for Child Protection and Family Support 706,000 706,000Department of Education 155,296 152,850WA Police - 487,406Road Safety Commission 600,000 773,066Healthway 838,424 1,123,298Department of Regional Development 90,000 -Other 100,000 120,000
4,304,596 5,280,494
WA Country Health Service
Related Party Transactions (continued)
(a) As from 1 July 2012, activity based funding and block grant funding have been received from the Commonwealth Governmentunder the National Health Reform Agreement for services, health teaching, training and research provided by local hospital networks.The new funding arrangement established under the Agreement requires the Commonwealth Government to make funding paymentsto the State Pool Account from which distributions to the local hospital networks (health services) are made by the Department ofHealth and Mental Health Commission. In previous financial years, the equivalent Commonwealth funding was received in the formof Service Appropriations from the State Treasurer.
National Partnership Agreement:
All other transactions (including general citizen type transactions) between Commission and Ministers/senior officers or their close family members or their controlled (or jointly controlled) entitiesare not material for disclosure.
Superannuation payments to the Government Employees Superannuation Board (GESB) (Note 6).
National Health Reform Agreement (a)
Cost Shared Funding Model (CSFM) Projects
Plan for Perinatal Depression
Commonwealth grants and contributions
Department of Health
Material transactions with other related parties
Pay Equity Funding
Supporting National Mental Health
Other grants and contributions
Indigenous Advancement Strategy
OVERVIEW AGENCY PERFORMANCE SIGNIFICANT ISSUES APPENDICESDISCLOSURES AND LEGAL COMPLIANCE
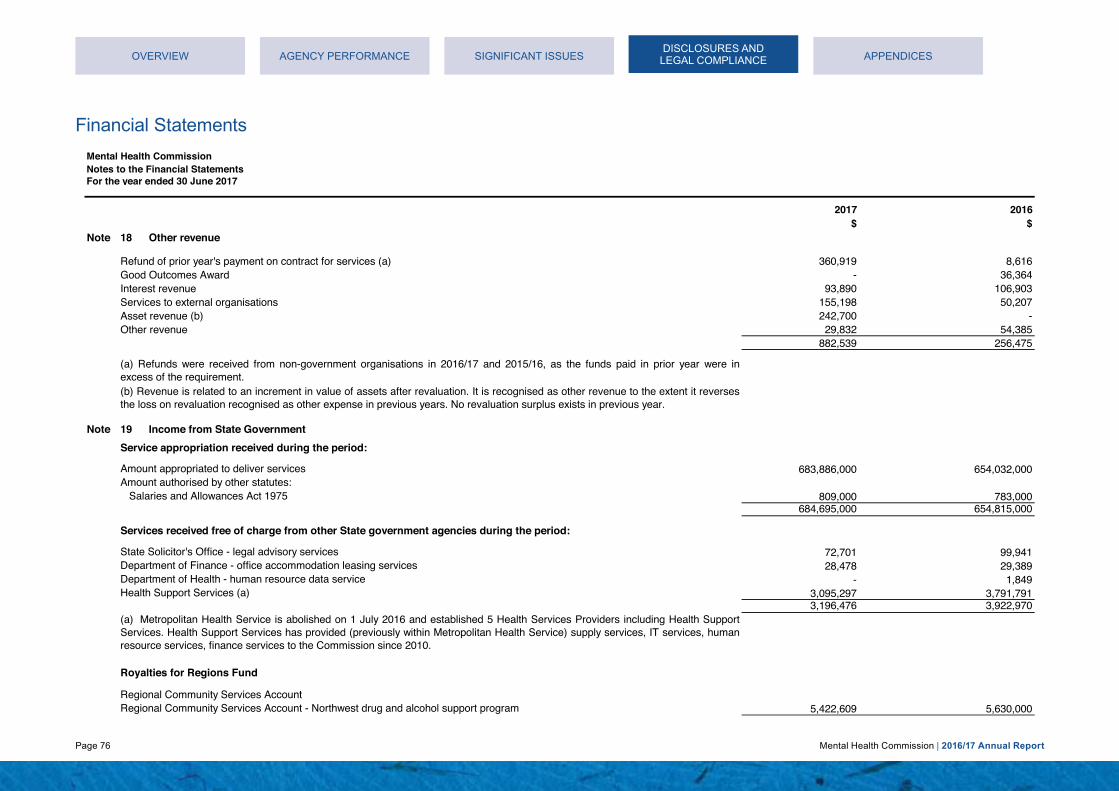
Page 76 Mental Health Commission | 2016/17 Annual Report
Financial Statements
Mental Health CommissionNotes to the Financial StatementsFor the year ended 30 June 2017
2017 2016$ $
Note 18
360,919 8,616- 36,364
93,890 106,903155,198 50,207242,700 -29,832 54,385
882,539 256,475
Note 19
683,886,000 654,032,000
809,000 783,000 684,695,000 654,815,000
72,701 99,941 28,478 29,389
- 1,849 3,095,297 3,791,791 3,196,476 3,922,970
5,422,609 5,630,000
Good Outcomes Award
(a) Metropolitan Health Service is abolished on 1 July 2016 and established 5 Health Services Providers including Health SupportServices. Health Support Services has provided (previously within Metropolitan Health Service) supply services, IT services, humanresource services, finance services to the Commission since 2010.
Income from State Government
Salaries and Allowances Act 1975
State Solicitor's Office - legal advisory servicesDepartment of Finance - office accommodation leasing services
Services to external organisationsInterest revenue
Other revenue
Amount appropriated to deliver services
Other revenue
Health Support Services (a)
Regional Community Services Account
Asset revenue (b)
(a) Refunds were received from non-government organisations in 2016/17 and 2015/16, as the funds paid in prior year were inexcess of the requirement.
Refund of prior year's payment on contract for services (a)
Department of Health - human resource data service
Services received free of charge from other State government agencies during the period:
(b) Revenue is related to an increment in value of assets after revaluation. It is recognised as other revenue to the extent it reversesthe loss on revaluation recognised as other expense in previous years. No revaluation surplus exists in previous year.
Amount authorised by other statutes:
Regional Community Services Account - Northwest drug and alcohol support program
Service appropriation received during the period:
Royalties for Regions Fund
OVERVIEW AGENCY PERFORMANCE SIGNIFICANT ISSUES APPENDICESDISCLOSURES AND
LEGAL COMPLIANCE
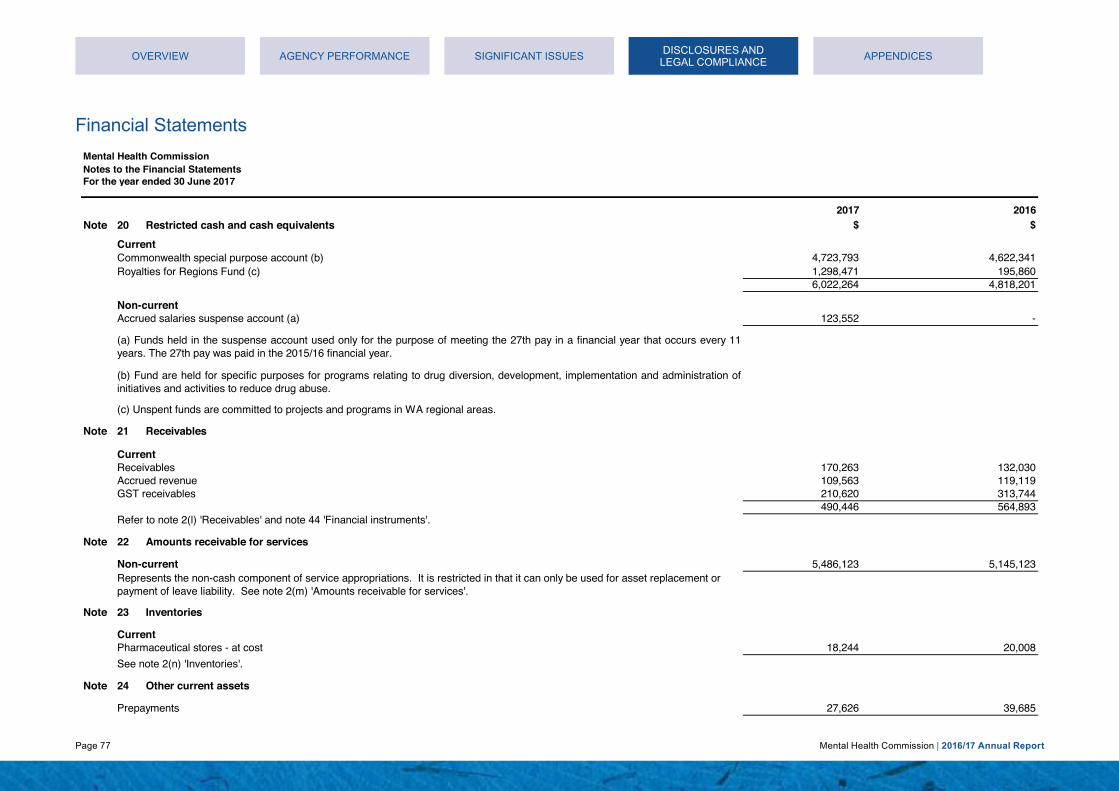
Page 77 Mental Health Commission | 2016/17 Annual Report
Financial Statements
Mental Health CommissionNotes to the Financial StatementsFor the year ended 30 June 2017
2017 2016Note 20 $ $
4,723,793 4,622,341 1,298,471 195,860 6,022,264 4,818,201
123,552 -
Note 21
170,263 132,030 109,563 119,119 210,620 313,744 490,446 564,893
Note 22
5,486,123 5,145,123
Note 23
18,244 20,008
Note 24
27,626 39,685
Commonwealth special purpose account (b)
Non-current
Refer to note 2(l) 'Receivables' and note 44 'Financial instruments'.
Non-current
Current
Inventories
See note 2(n) 'Inventories'.
Current
(c) Unspent funds are committed to projects and programs in WA regional areas.
Pharmaceutical stores - at cost
Other current assets
Prepayments
Accrued revenueReceivables
Amounts receivable for services
Represents the non-cash component of service appropriations. It is restricted in that it can only be used for asset replacement or payment of leave liability. See note 2(m) 'Amounts receivable for services'.
Current
GST receivables
Restricted cash and cash equivalents
(a) Funds held in the suspense account used only for the purpose of meeting the 27th pay in a financial year that occurs every 11years. The 27th pay was paid in the 2015/16 financial year.
(b) Fund are held for specific purposes for programs relating to drug diversion, development, implementation and administration ofinitiatives and activities to reduce drug abuse.
Accrued salaries suspense account (a)
Royalties for Regions Fund (c)
Receivables
OVERVIEW AGENCY PERFORMANCE SIGNIFICANT ISSUES APPENDICESDISCLOSURES AND LEGAL COMPLIANCE

Page 78 Mental Health Commission | 2016/17 Annual Report
Financial Statements
Mental Health CommissionNotes to the Financial StatementsFor the year ended 30 June 2017
2017 2016Note 25 $ $
8,681,900 8,439,200 8,681,900 8,439,200
13,288,100 13,780,168 13,288,100 13,780,168
49,886 49,886(33,257) (16,629) 16,629 33,257
- 6,273 - (1,974) - 4,299
167,819 14,819(3,293) (1,647)
164,526 13,172
310,623 303,853(47,506) (14,292) 263,117 289,561
12,000 12,000 12,000 12,000
22,426,272 22,571,657
(b) During 2016/17 financial year, the Commission reviewed the depreciation method of buildings and changed method fromdiminishing balance to straight-line, to bring it in line with other asset classes. It is also the method applied by Landgate ValuationServices to derive their depreciated replacement cost valuation for building assets. The impact of this change is increase indepreciation expense by $8,862 in 2016-17 and expected increase in depreciation expense by $7,865 each year from 2017-18 andonwards.
Accumulated depreciation
At fair value (a) (b)
Medical equipment
Furniture and fittings
Total property, plant and equipment(a) Land and buildings were revalued as at 1 July 2016 by the Western Australian Land Information Authority (Valuation Services).The valuations were performed during the year ended 30 June 2017 and recognised at 30 June 2017. In undertaking the revaluation,fair value was determined by reference to market values for land: $780,000 (2015/16 $1,035,000) and buildings $1,190,000 (2015/16 $1,325,000). For the remaining balance, fair value of buildings was determined on the basis of depreciated replacement cost and fairvalue of land was determined on the basis of comparison with market evidence for land with low level utility (high restricted use land).See also note 2 (f) 'Property, plant and equipment'.
Other plant and equipment At cost Accumulated depreciation
Land
Property, plant and equipment
At fair value (a)
Buildings
Artworks
Accumulated depreciation At cost
At cost
At cost
Computer equipment
Accumulated depreciation
At cost
OVERVIEW AGENCY PERFORMANCE SIGNIFICANT ISSUES APPENDICESDISCLOSURES AND
LEGAL COMPLIANCE

Page 79 Mental Health Commission | 2016/17 Annual Report
Financial Statements
Mental Health CommissionNotes to the Financial StatementsFor the year ended 30 June 2017
2017 2016Note 25 $ $
Reconciliations
8,439,200 - - 9,107,100
242,700 (667,900)8,681,900 8,439,200
13,780,168 - - 14,292,000 - 157,402
(69,801) (240,389)(422,267) (428,845)
13,288,100 13,780,168
33,257 - - 58,906 - (9,020)
(16,628) (16,629)16,629 33,257
4,299 4,690(4,299) -
- (391)- 4,299
13,172 -- 14,819
153,001 -(1,647) (1,647)
164,526 13,172
289,561 22,896- 58,659
6,770 237,986- (22,369)
(33,214) (7,611) 263,117 289,561
Depreciation
Reconciliations of the carrying amounts of property, plant and equipment at the beginning and end of the reporting period are set outbelow.
Other plant and equipment
Additions
Property, plant and equipment (continued)
Disposals
DisposalsTransfer from WA Alcohol & Drug Authority
Disposals
Carrying amount at the start of yearTransfer from WA Alcohol & Drug Authority
Computer equipment
Revaluation increments / (decrements)
Depreciation
Transfer from WA Alcohol & Drug AuthorityCarrying amount at start of periodBuildings
Carrying amount at start of period
Transfer from Work in Progress
Additions
Carrying amount at start of period
Depreciation
Furniture and fittings
Carrying amount at start of period
Carrying amount at end of period
Medical equipment
Land
Carrying amount at end of period
Transfer from WA Alcohol & Drug Authority
Carrying amount at start of period
Carrying amount at end of period
Carrying amount at end of period
Transfer from WA Alcohol & Drug Authority
Depreciation
Carrying amount at end of periodDepreciation
Revaluation increments / (decrements)
Carrying amount at the end of year
OVERVIEW AGENCY PERFORMANCE SIGNIFICANT ISSUES APPENDICESDISCLOSURES AND LEGAL COMPLIANCE

Page 80 Mental Health Commission | 2016/17 Annual Report
Financial Statements
Mental Health CommissionNotes to the Financial StatementsFor the year ended 30 June 2017
2017 2016$ $
Note 25
ArtworksCarrying amount at the start of year 12,000 12,000Carrying amount at the end of year 12,000 12,000
- -- 11,527- 145,875- (157,402)- -
Total property, plant and equipment 22,571,657 39,586
- 23,543,011 159,771 383,861
(4,299) (31,389) 172,899 (908,289)
(473,756) (455,123) 22,426,272 22,571,657
Note 26
Assets measured at fair value:Level 1 Level 2 Level 3
$ $ $ $- 780,000 7,901,900 8,681,900- 1,190,000 12,098,100 13,288,100- 1,970,000 20,000,000 21,970,000
Land (Note 25) - 1,035,000 7,404,200 8,439,200Buildings (Note 25) - 1,325,000 12,455,168 13,780,168
- 2,360,000 19,859,368 22,219,368
There were no transfers between Levels 1, 2, or 3 during the current period.
Valuation techniques to derive Level 2 fair values
Capitalised to asset classesCarrying amount at the end of year
Fair Value At end of period
Works in progress
Depreciation
Transfer from WA Alcohol & Drug Authority
Transfer from WA Alcohol & Drug Authority
Carrying amount at the end of year
2017
Carrying amount at the start of year
Additions
Land (Note 25)
2016
Disposals
Property, plant and equipment (continued)
Carrying amount at the start of year
Additions
Revaluation increments/(decrements)
Level 2 fair values of Land and Buildings are derived using the market approach. Market evidence of sales prices of comparable land and buildings in close proximity is used to determine price persquare metre.
Fair value measurements
Buildings (Note 25)
OVERVIEW AGENCY PERFORMANCE SIGNIFICANT ISSUES APPENDICESDISCLOSURES AND LEGAL COMPLIANCE
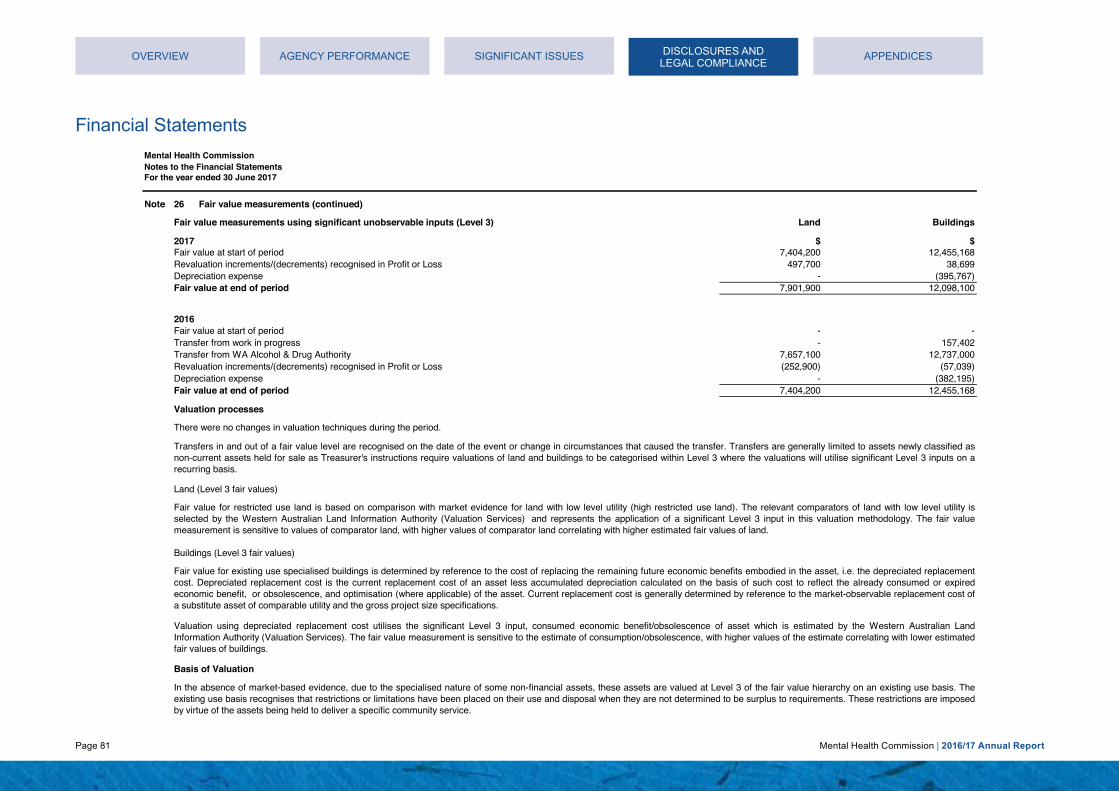
Page 81 Mental Health Commission | 2016/17 Annual Report
Financial Statements
Mental Health CommissionNotes to the Financial StatementsFor the year ended 30 June 2017
Note 26
Fair value measurements using significant unobservable inputs (Level 3) Land Buildings
$ $Fair value at start of period 7,404,200 12,455,168
497,700 38,699Depreciation expense - (395,767)Fair value at end of period 7,901,900 12,098,100
Fair value at start of period - -Transfer from work in progress - 157,402
7,657,100 12,737,000(252,900) (57,039)
Depreciation expense - (382,195)Fair value at end of period 7,404,200 12,455,168
Valuation processes
There were no changes in valuation techniques during the period.
In the absence of market-based evidence, due to the specialised nature of some non-financial assets, these assets are valued at Level 3 of the fair value hierarchy on an existing use basis. Theexisting use basis recognises that restrictions or limitations have been placed on their use and disposal when they are not determined to be surplus to requirements. These restrictions are imposedby virtue of the assets being held to deliver a specific community service.
2016
Transfer from WA Alcohol & Drug AuthorityRevaluation increments/(decrements) recognised in Profit or Loss
Fair value for restricted use land is based on comparison with market evidence for land with low level utility (high restricted use land). The relevant comparators of land with low level utility isselected by the Western Australian Land Information Authority (Valuation Services) and represents the application of a significant Level 3 input in this valuation methodology. The fair valuemeasurement is sensitive to values of comparator land, with higher values of comparator land correlating with higher estimated fair values of land.
Valuation using depreciated replacement cost utilises the significant Level 3 input, consumed economic benefit/obsolescence of asset which is estimated by the Western Australian LandInformation Authority (Valuation Services). The fair value measurement is sensitive to the estimate of consumption/obsolescence, with higher values of the estimate correlating with lower estimatedfair values of buildings.
2017
Transfers in and out of a fair value level are recognised on the date of the event or change in circumstances that caused the transfer. Transfers are generally limited to assets newly classified asnon-current assets held for sale as Treasurer's instructions require valuations of land and buildings to be categorised within Level 3 where the valuations will utilise significant Level 3 inputs on arecurring basis.
Land (Level 3 fair values)
Fair value for existing use specialised buildings is determined by reference to the cost of replacing the remaining future economic benefits embodied in the asset, i.e. the depreciated replacementcost. Depreciated replacement cost is the current replacement cost of an asset less accumulated depreciation calculated on the basis of such cost to reflect the already consumed or expiredeconomic benefit, or obsolescence, and optimisation (where applicable) of the asset. Current replacement cost is generally determined by reference to the market-observable replacement cost ofa substitute asset of comparable utility and the gross project size specifications.
Buildings (Level 3 fair values)
Basis of Valuation
Fair value measurements (continued)
Revaluation increments/(decrements) recognised in Profit or Loss
OVERVIEW AGENCY PERFORMANCE SIGNIFICANT ISSUES APPENDICESDISCLOSURES AND LEGAL COMPLIANCE

Page 82 Mental Health Commission | 2016/17 Annual Report
Financial Statements
Mental Health CommissionNotes to the Financial StatementsFor the year ended 30 June 2017
Note 27
2017 2016Note 28 $ $
1,469,249 1,513,337421,544 328,984
2,435,695 2,054,8034,591 -
4,331,079 3,897,124
Note 29
2,551,321 2,667,212 2,589,029 2,787,059
211,362 316,372 5,351,712 5,770,643
2,098,539 1,860,770
7,450,251 7,631,413
1,792,352 1,862,002 758,969 805,210
2,551,321 2,667,212
524,201 559,479 4,163,367 4,088,350 4,687,568 4,647,829
103,065 151,765 108,297 164,607 211,362 316,372
(a) Includes expenses not paid yet to Department of Finance $384,504 (2015-16 $476,011), Office of Audit General 2015-16 $180,800, WA Police $95,439 (2015-16 $0) and Department of Child Protection $247,086 in 2015-16.
Employee benefits provision
Provisions
Deferred salary scheme (c)
Within 12 months of the end of the reporting period
Employee benefits provision
(a) Annual leave liabilities have been classified as current as there is no unconditional right to defer settlement for at least 12 monthsafter the end of the reporting period. Assessments indicate that actual settlement of the liabilities is expected to occur as follows:
Within 12 months of the end of the reporting period
(b) Long service leave liabilities have been classified as current where there is no unconditional right to defer settlement for at least12 months after the end of the reporting period. Assessments indicate that actual settlement of the liabilities will occur as follows:
Other creditors
There were no indications of impairment to property, plant and equipment at 30 June 2017. The Commission held no goodwill during the reporting period.
Non-current
Accrued expenses (a)
Payables
Impairment of assets
Trade creditors (a)Current
Accrued salaries
Within 12 months of the end of the reporting period
Refer to note 2(o) 'Payables' and note 44 'Financial instruments'.
Current
Long service leave (b)
Annual leave (a)
More than 12 months after the end of the reporting period
More than 12 months after the end of the reporting period
(c) Deferred salary scheme liabilities have been classified as current where there is no unconditional right to defer settlement for at least 12 months after the end of the reporting period. Assessments indicate that actual settlement of the liabilities will occur as follows:
More than 12 months after the end of the reporting period
Long service leave (b)
OVERVIEW AGENCY PERFORMANCE SIGNIFICANT ISSUES APPENDICESDISCLOSURES AND LEGAL COMPLIANCE
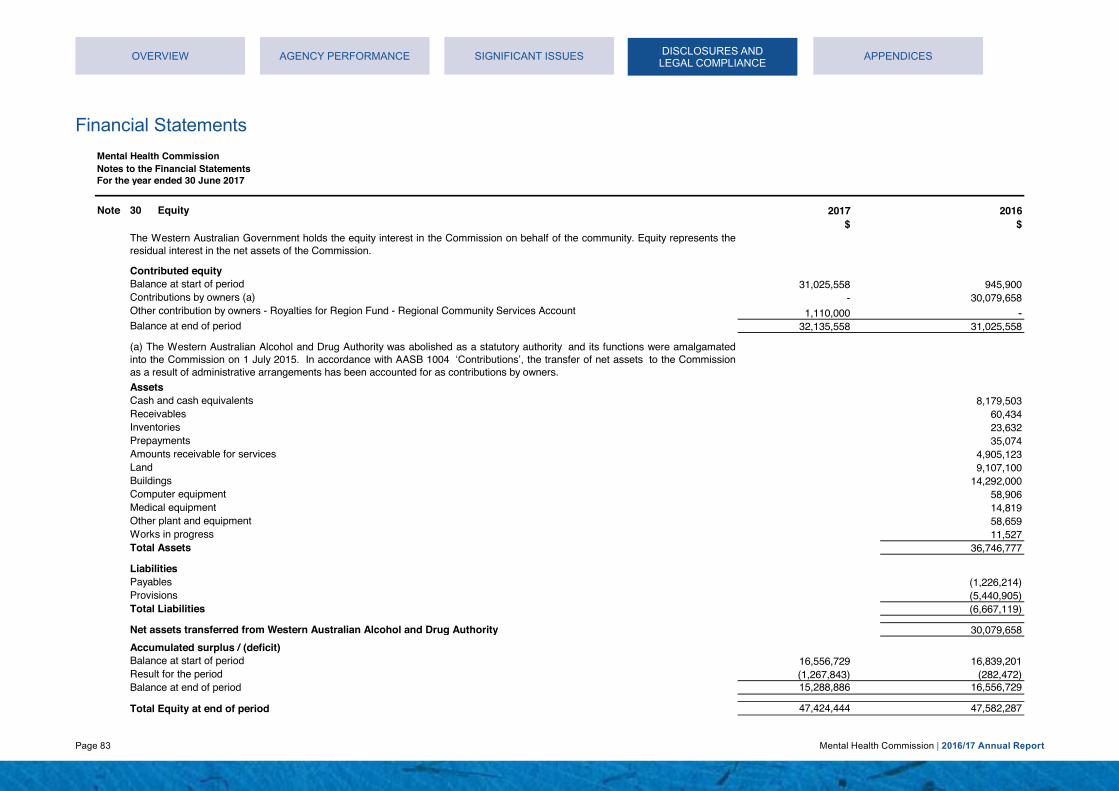
Page 83 Mental Health Commission | 2016/17 Annual Report
Financial Statements
Mental Health CommissionNotes to the Financial StatementsFor the year ended 30 June 2017
Note 30 2017 2016$ $
31,025,558 945,900- 30,079,658
1,110,000 - 32,135,558 31,025,558
AssetsCash and cash equivalents 8,179,503Receivables 60,434Inventories 23,632Prepayments 35,074Amounts receivable for services 4,905,123Land 9,107,100Buildings 14,292,000Computer equipment 58,906Medical equipment 14,819Other plant and equipment 58,659Works in progress 11,527Total Assets 36,746,777
LiabilitiesPayables (1,226,214)Provisions (5,440,905)Total Liabilities (6,667,119)
Net assets transferred from Western Australian Alcohol and Drug Authority 30,079,658
16,556,729 16,839,201(1,267,843) (282,472) 15,288,886 16,556,729
47,424,444 47,582,287
Balance at start of period
Other contribution by owners - Royalties for Region Fund - Regional Community Services Account
Equity
Balance at end of period
Balance at end of period
Result for the periodBalance at start of period
Total Equity at end of period
The Western Australian Government holds the equity interest in the Commission on behalf of the community. Equity represents theresidual interest in the net assets of the Commission.
(a) The Western Australian Alcohol and Drug Authority was abolished as a statutory authority and its functions were amalgamatedinto the Commission on 1 July 2015. In accordance with AASB 1004 ‘Contributions’, the transfer of net assets to the Commissionas a result of administrative arrangements has been accounted for as contributions by owners.
Contributions by owners (a)
Contributed equity
Accumulated surplus / (deficit)
OVERVIEW AGENCY PERFORMANCE SIGNIFICANT ISSUES APPENDICESDISCLOSURES AND LEGAL COMPLIANCE
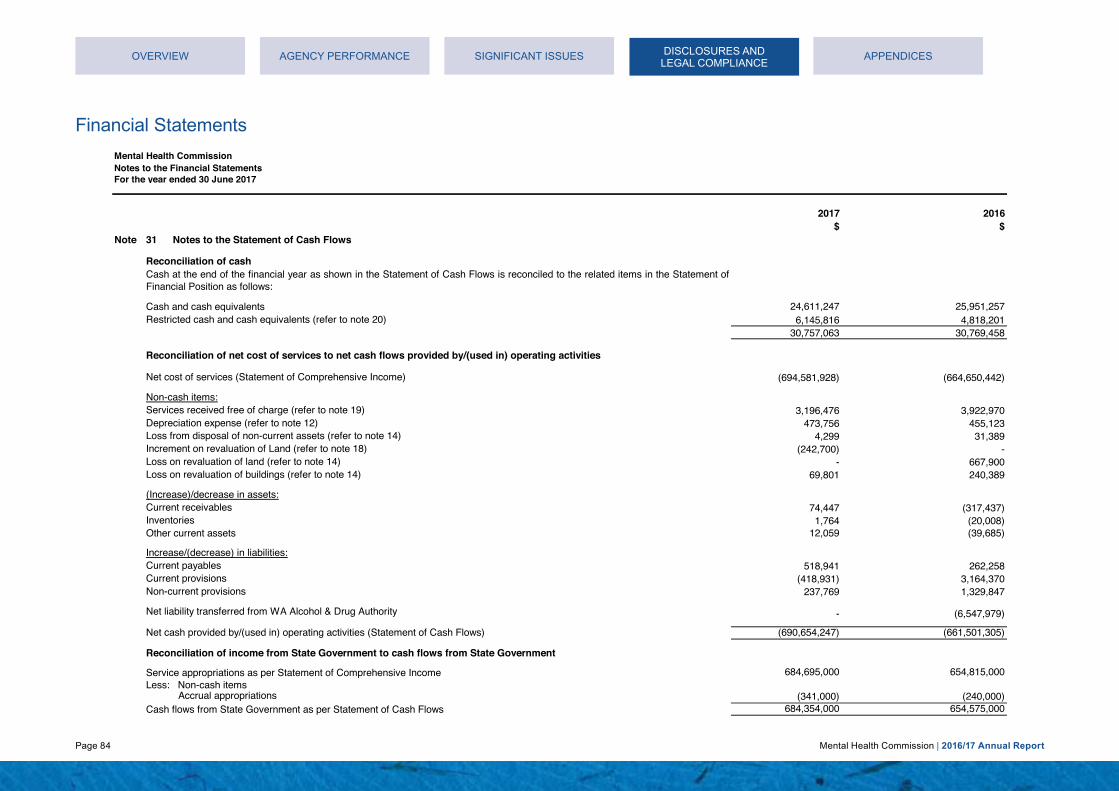
Page 84 Mental Health Commission | 2016/17 Annual Report
Financial Statements
Mental Health CommissionNotes to the Financial StatementsFor the year ended 30 June 2017
2017 2016$ $
Note 31
24,611,247 25,951,257 6,145,816 4,818,201
30,757,063 30,769,458
(694,581,928) (664,650,442)
3,196,476 3,922,970Depreciation expense (refer to note 12) 473,756 455,123
4,299 31,389(242,700) -
Loss on revaluation of land (refer to note 14) - 667,900Loss on revaluation of buildings (refer to note 14) 69,801 240,389
74,447 (317,437) 1,764 (20,008)
12,059 (39,685)
518,941 262,258(418,931) 3,164,370
Non-current provisions 237,769 1,329,847
- (6,547,979)
(690,654,247) (661,501,305)
684,695,000 654,815,000
Accrual appropriations (341,000) (240,000) 684,354,000 654,575,000
Inventories
Net liability transferred from WA Alcohol & Drug Authority
Current payablesIncrease/(decrease) in liabilities:
Services received free of charge (refer to note 19)
Reconciliation of cash
Cash and cash equivalents
Current receivables(Increase)/decrease in assets:
Notes to the Statement of Cash Flows
Restricted cash and cash equivalents (refer to note 20)
Cash at the end of the financial year as shown in the Statement of Cash Flows is reconciled to the related items in the Statement ofFinancial Position as follows:
Current provisions
Net cost of services (Statement of Comprehensive Income)
Reconciliation of net cost of services to net cash flows provided by/(used in) operating activities
Loss from disposal of non-current assets (refer to note 14)
Other current assets
Reconciliation of income from State Government to cash flows from State Government
Service appropriations as per Statement of Comprehensive IncomeLess: Non-cash items
Cash flows from State Government as per Statement of Cash Flows
Net cash provided by/(used in) operating activities (Statement of Cash Flows)
Increment on revaluation of Land (refer to note 18)
Non-cash items:
OVERVIEW AGENCY PERFORMANCE SIGNIFICANT ISSUES APPENDICESDISCLOSURES AND LEGAL COMPLIANCE

Page 85 Mental Health Commission | 2016/17 Annual Report
Financial Statements
Mental Health CommissionNotes to the Financial StatementsFor the year ended 30 June 2017
2017 2016$ $
Note 32
2,648,809 2,493,399 10,090,779 10,225,143 7,664,512 11,299,056
20,404,100 24,017,598
150,124,573 121,218,073 45,493,204 37,974,975
- 6,619,454 195,617,777 165,812,502
692,116,136 -
6,995 42,642
Note 33
177,700 175,000
Note 34
Other expenditure commitments contracted for at the end of the reporting period but not recognised as liabilities, are payable as follows:
The leases are non-cancellable, with rent payable monthly in advance. Operating leases relating to buildings and office equipment do not have contingent rental obligations. There are no restrictions imposed by these leasing arrangements on other financing transactions.
In addition, the 2017/18 service agreement between the Mental Health Commission, Department of Health and Area Health Servicesfor the provision of mental health services in public hospitals was signed prior to 30 June 2017. The 2016/17 service agreement wasnot signed prior to 30 June 2016. The expenditure commitment is payable as follows:
Within 1 year
The commitments below are inclusive of GST where relevant.
Later than 1 year and not later than 5 yearsLater than 5 years
Remuneration paid or payable to the Auditor General in respect of the audit for the current financial year is as follows:Remuneration of auditor
Commitments for minimum lease payments are payable as follows:
The Commission is not aware of any contingent liabilities or contingent assets.
Within 1 year
Non-cancellable operating lease commitments
Contracts for the provision of mental health, alcohol and other drug services
Later than 1 year and not later than 5 years
Other expenditure commitments
Within 1 year
Expenditure commitments in relation to private hospitals and non-government organisations contracted for at the end of the reporting period but not recognised as liabilities, are payable as follows:
Later than 5 years
Commitments
Within 1 year
Contingent liabilities and contingent assets
Auditing the accounts, controls, financial statements and key performance indicators
OVERVIEW AGENCY PERFORMANCE SIGNIFICANT ISSUES APPENDICESDISCLOSURES AND LEGAL COMPLIANCE

Page 86 Mental Health Commission | 2016/17 Annual Report
Financial Statements
Mental Health CommissionNotes to the Financial StatementsFor the year ended 30 June 2017
Note 35
Note 36
2017 2016$ $
Note 37
Albany Halfway House Association Incorporated 1,415,557 1,393,265Australian Medical Procedures Research Foundation Limited - 3,220,074Consumers of Mental Health WA 341,650 389,247Even Keel Bipolar Support Association Incorporated 126,505 124,513Goldfields Rehabilitation Services Inc - 724,519Holyoake Australian Institute for Alcohol and Drug Addiction Resolution Inc 4,294,999 3,905,986Home Health Pty Ltd (trading as Tender Care) 1,203,311 1,184,361June O'Conner Centre Incorporated 1,924,506 1,894,199Local Drug Action Groups Inc 1,189,047 629,751Palmerston Association Inc 8,064,279 7,365,448Pathways Southwest Inc. 752,883 741,027Richmond Wellbeing Incorporated 10,304,424 10,611,039St Vincent De Paul Society 743,917 -WA Council on Addictions (trading as Cyrenian House) 8,411,784 7,487,671
38,772,862 39,671,100
Office of Chief Psychiatrist is a government administered body that received administrative support from, but is not subject tooperational control by the Commission. It is funded by parliamentary appropriation of $2,262,000 for 2016/17 ($1,675,000 for2015/16)
Affiliated bodies
Mental Health Advocacy Service is a government administered body that received administrative support from, but is not subject tooperational control by the Commission. It is funded by parliamentary appropriation of $2,654,000 for 2016/17 ($1,439,000 for2015/16)
Mental Health Tribunal is a government administered body that received administrative support from, but is not subject to operationalcontrol by the Commission. It is funded by parliamentary appropriation of $2,653,000 for 2016/17 ($1,406,000 for 2015/16)
The Commission had no related bodies during the financial year.
The Commission is not aware of any events occurring after the end of the reporting period that have significant financial effect on the financial statements.
A related body is a body that receives more than half of its funding and resources from the Commission and is subject to operational control by the Commission.
Related bodies
During the financial year the following affiliated bodies received the funding from the Commission:
Events occurring after the end of the reporting period
In addition, Mental Health Commission has three affiliated bodies as determined by the Treasurer pursuant to Section 60(1)(b) of theFinancial Management Act 2006 in 2015/16 financial year.
An affiliated body is a body that receives more than half of its funding and resources from the Commission but is not subject tooperational control by the Commission.
OVERVIEW AGENCY PERFORMANCE SIGNIFICANT ISSUES APPENDICESDISCLOSURES AND LEGAL COMPLIANCE

Page 87 Mental Health Commission | 2016/17 Annual Report
Financial Statements
Mental Health CommissionNotes to the Financial StatementsFor the year ended 30 June 2017
2017 2016$ $
Note 38
312,110 168,804 346,141 185,203 393,511 167,145
1,051,762 521,152
Note 39
- -
Service appropriations (State Government) 253,932,217 245,419,236Commonwealth grants and contributions 73,699,322 73,579,896
327,631,539 318,999,132
Block grant funding to local hospital networks in WA Health (323,991,924) (315,412,510)Block grant funding to non-government organisation (3,639,615) (3,586,622)
- -
Receipts:
Payments:
Balance at the end of period
Mental Health Advocacy Service - corporate services
Special purpose accounts
The Mental Health Act of 2014 established the Mental Health Tribunal, Mental Health Advocacy Service, and Office of ChiefPsychiatrist, effective in 2015/16 financial year.
Balance at the start of period
State Managed Fund (Mental Health) Account
Office of the Chief Psychiatrist - orporate services and accommodation
Mental Health Tribunal - corporate services
The purpose of the special purpose account is to hold money received by the Mental Health Commission, for the purposes of healthfunding under the National Health Reform Agreement that is required to be undertaken in the State through a State Managed Fund.
Services provided free of charge
Services provided free of charge to other agencies during the period:
OVERVIEW AGENCY PERFORMANCE SIGNIFICANT ISSUES APPENDICESDISCLOSURES AND LEGAL COMPLIANCE

Page 88 Mental Health Commission | 2016/17 Annual Report
Financial Statements
Mental Health CommissionNotes to the Financial StatementsFor the year ended 30 June 2017
Note 40 2017 2016
$ $
2,653,000 1,406,000 2,654,000 1,439,000 2,262,000 1,675,000 1,080,044 537,840
870 578 8,649,914 5,058,418
6,638,163 3,627,125 1,226,585 703,186
364,379 135,479 245,072 176,764
8,474,199 4,642,554
Note 41
1,682,595 1,316,166 73,811 3,150
1,756,406 1,319,316
1,756,406 1,319,316
240,027 135,723 749,756 661,748 989,783 797,471
175,046 105,981 175,046 105,981
1,164,829 903,452
(a) The Mental Health Act 2014 established the Mental Health Tribunal, Mental Health Advocacy Service, and Office of ChiefPsychiatrist as administered affiliated bodies under the Mental Health Commission, effective in 2015/16 financial year.
(b) Service received free of charge in 2016 /17 includes $1,051,762 ($521,152 in 2015/16) from Mental Health Commission (refer tonote 38 'Services provided free of charge'), $28,282 ($14,361 in 2015/16) from State Solicitor Office, and $2,327 in 2015/16 fromDepartment of Finance.
Total Administered Current Assets
ProvisionTotal Administered Non-Current Liabilities
Provision
Disclosure of administered income and expenses by service
Appropriations from Government for transfer to :
Disclosure of administered assets and liabilities
Total Administered Assets
Mental Health Tribunal (a)
Current Liabilities
Cash and cash equivalentsCurrent Assets
Payables
Receivables
Accommodation expense (a)
The Mental Health Act 2014 established the Mental Health Tribunal, Mental Health Advocacy Service, and Office of ChiefPsychiatrist, effective in 2015/16 financial year.
Expenses
Total Administered Current Liabilities
Employee benefits expense (a)Supplies and services (a)
Service received free of charge (b)
Total administered expenses
Office of Chief Psychiatrist (a) Mental Health Advocacy Service (a)
Total Administered Liabilities
Non-Current Liabilities
Total administered incomeOther revenue
Other expenses (a)
Hospital Bed Based Services
Hospital Bed Based Services
Income
OVERVIEW AGENCY PERFORMANCE SIGNIFICANT ISSUES APPENDICESDISCLOSURES AND LEGAL COMPLIANCE

Page 89 Mental Health Commission | 2016/17 Annual Report
Financial Statements
Mental Health CommissionNotes to the Financial StatementsFor the year ended 30 June 2017
Note 42 Explanatory statement (Statement of Comprehensive Income)
Variance Note Estimate Actual Actual2017 2017 2016
$ $ $ $ $COST OF SERVICESExpenses
Employee benefits expense 39,336,000 35,975,411 38,982,037 (3,360,589) (3,006,626) Service agreement - WA Health 660,066,000 670,265,489 643,885,694 10,199,489 26,379,795 Service agreement - non government and other organisations 150,360,000 139,015,908 137,109,599 (11,344,092) 1,906,309 Supplies and services 7,762,000 10,389,927 10,684,639 2,627,927 (294,712) Grants and subsidies 3,063,000 2,864,341 6,642,853 (198,659) (3,778,512) Depreciation expense 341,000 473,756 455,123 132,756 18,633 Accommodation expense 2,396,000 2,249,106 1,023,150 (146,894) 1,225,956 Other expenses 2,448,000 1,873,235 4,431,291 (574,765) (2,558,056)
Total cost of services 865,772,000 863,107,173 843,214,386 (2,664,827) 19,892,787
IncomeRevenue
Commonwealth grants and contributions 172,551,000 163,338,110 173,026,975 (9,212,890) (9,688,865) Other grants and contributions 2,121,000 4,304,596 5,280,494 2,183,596 (975,898) Other revenue 8,050,000 882,539 256,475 (7,167,461) 626,064
Total income other than income from State Government 182,722,000 168,525,245 178,563,944 (14,196,755) (10,038,699)
NET COST OF SERVICES 683,050,000 694,581,928 664,650,442 11,531,928 29,931,486
Income from State GovernmentService appropriation 669,489,000 684,695,000 654,815,000 15,206,000 29,880,000 Services received free of charge 3,196,476 3,922,970 3,196,476 (726,494) Royalties for Regions Fund 7,233,000 5,422,609 5,630,000 (1,810,391) (207,391)
Total income from State Government 676,722,000 693,314,085 664,367,970 16,592,085 28,946,115
SURPLUS / (DEFICIT) FOR THE PERIOD (6,328,000) (1,267,843) (282,472) 5,060,157 (985,371)
OTHER COMPREHENSIVE INCOME - - - - - TOTAL COMPREHENSIVE INCOME/(LOSS) FOR THE PERIOD (6,328,000) (1,267,843) (282,472) 5,060,157 (985,371)
Variance between
estimate and actual
Variance between actual results for 2017
and 2016
All variances between estimates (original budget) and actual results for 2017, and between the actual results for 2017 and 2016 are shown below. Narratives areprovided for selected major variances, which are generally greater than:
5% and $16.9 million for the Statements of Comprehensive Income and Cash Flows; and 5% and $1.1 million for the Statements of Financial Position.
OVERVIEW AGENCY PERFORMANCE SIGNIFICANT ISSUES APPENDICESDISCLOSURES AND
LEGAL COMPLIANCE

Page 90 Mental Health Commission | 2016/17 Annual Report
Financial Statements
Mental Health CommissionNotes to the Financial StatementsFor the year ended 30 June 2017
Note 42 Explanatory statement (Statement of Financial Position)
Variance Note Estimate Actual Actual2017 2017 2016
$ $ $ $ $ASSETSCurrent Assets
Cash and cash equivalents 12,834,000 24,611,247 25,951,257 11,777,247 (1,340,010) Restricted cash and cash equivalents 4,775,000 6,022,264 4,818,201 1,247,264 1,204,063 Receivables 96,000 490,446 564,893 394,446 (74,447) Inventories 43,000 18,244 20,008 (24,756) (1,764) Other current assets 35,000 27,626 39,685 (7,374) (12,059)
Total Current Assets 17,783,000 31,169,827 31,394,044 13,386,827 (224,217) Non-Current Assets
Restricted cash and cash equivalents - 123,552 - 123,552 123,552 Amounts receivable for services 5,582,000 5,486,123 5,145,123 (95,877) 341,000 Property, plant and equipment 1 31,820,000 22,426,272 22,571,657 (9,393,728) (145,385)
Total Non-Current Assets 37,402,000 28,035,947 27,716,780 (9,366,053) 319,167 TOTAL ASSETS 55,185,000 59,205,774 59,110,824 4,020,774 94,950 LIABILITIESCurrent Liabilities
Payables 3,022,000 4,331,079 3,897,124 1,309,079 433,955 Provisions 2 7,040,000 5,351,712 5,770,643 (1,688,288) (418,931)
Total Current Liabilities 10,062,000 9,682,791 9,667,767 (379,209) 15,024
Non-Current LiabilitiesProvisions 2,044,000 2,098,539 1,860,770 54,539 237,769
Total Non-Current Liabilities 2,044,000 2,098,539 1,860,770 54,539 237,769
TOTAL LIABILITIES 12,106,000 11,781,330 11,528,537 (324,670) 252,793 NET ASSETS 43,079,000 47,424,444 47,582,287 4,345,444 (157,843)
EQUITYContributed equity 33,141,000 32,135,558 31,025,558 (1,005,442) 1,110,000 Reserves 608,000 - - (608,000) - Accumulated surplus 9,330,000 15,288,886 16,556,729 5,958,886 (1,267,843)
TOTAL EQUITY 43,079,000 47,424,444 47,582,287 4,345,444 (157,843)
Variance between estimate and
actual
Variance between actual results for
2017 and 2016
OVERVIEW AGENCY PERFORMANCE SIGNIFICANT ISSUES APPENDICESDISCLOSURES AND LEGAL COMPLIANCE

Page 91 Mental Health Commission | 2016/17 Annual Report
Financial Statements
Mental Health CommissionNotes to the Financial StatementsFor the year ended 30 June 2017
Note 42 Explanatory statement (Statement of Cash Flows)
Variance Note Estimate Actual Actual2017 2017 2016
$ $ $ $ $CASH FLOWS FROM STATE GOVERNMENT
Service appropriation 669,148,000 684,354,000 654,575,000 15,206,000 29,779,000Royalties for Regions Fund - Capital 10,400,000 1,110,000 - (9,290,000) 1,110,000Royalties for Regions Fund - Recurrent 7,233,000 5,422,609 5,630,000 (1,810,391) (207,391)
Net cash provided by State Government 686,781,000 690,886,609 660,205,000 4,105,609 30,681,609Utilised as follows:CASH FLOWS FROM OPERATING ACTIVITIESPayments
Employee benefits expense (39,187,000) (36,122,797) (41,220,707) 3,064,203 5,097,910Service agreement - WA Health (660,066,000) (670,265,489) (644,092,337) (10,199,489) (26,173,152)Service agreement - non government and other organisations (150,360,000) (139,086,788) (137,797,069) 11,273,212 (1,289,719)Supplies and services (7,762,000) (6,326,892) (6,265,190) 1,435,108 (61,702)Grants and subsidies (3,063,000) (3,193,909) (6,349,005) (130,909) 3,155,096Accommodation expense (2,396,000) (2,025,210) (1,072,650) 370,790 (952,560)Other payments (2,448,000) (1,919,112) (3,201,759) 528,888 1,282,647
ReceiptsCommonwealth grants and contributions 172,551,000 163,338,110 173,026,975 (9,212,890) (9,688,865)Other grants and contributions 2,121,000 4,304,596 5,280,494 2,183,596 (975,898)Other receipts 8,050,000 643,244 189,943 (7,406,756) 453,301
Net cash used in operating activities (682,560,000) (690,654,247) (661,501,305) (8,094,247) (29,152,942)CASH FLOWS FROM INVESTING ACTIVITIESPayments
Purchase of non-current assets (10,400,000) (244,757) (145,875) 10,155,243 (98,882)
Net cash used in investing activities (10,400,000) (244,757) (145,875) 10,155,243 (98,882)Net increase / (decrease) in cash and cash equivalents (6,179,000) (12,395) (1,442,180) 6,166,605 1,429,785Cash and cash equivalents at the beginning of the period 23,788,000 30,769,458 24,032,135 6,981,458 6,737,323Cash and cash equivalents transferred from WA Alcohol & Drug Authority - 8,179,503 - (8,179,503)CASH AND CASH EQUIVALENTS AT THE END OF THE PERIOD 17,609,000 30,757,063 30,769,458 13,148,063 (12,395)
Variance between estimate and
actual
Variance between actual results for
2017 and 2016
OVERVIEW AGENCY PERFORMANCE SIGNIFICANT ISSUES APPENDICESDISCLOSURES AND LEGAL COMPLIANCE

Page 92 Mental Health Commission | 2016/17 Annual Report
Financial Statements
Mental Health CommissionNotes to the Financial StatementsFor the year ended 30 June 2017
Note 42 Explanatory statement (continued)
Major Estimate and Actual (2017) Variance Narratives for Controlled Operations
1
2
Property, plant and equipment decreased by $9.4 million (29.5%) mainly due to repositioning of $10.4 million capital expenditure for the Bunbury and Karratha step-up step-down facilities,partially offset by a higher than budgeted amount for land and buildings of $0.7 million.
Provisions decreased $1.7 million (24%) mainly due to leave provisions of $0.7 million for the affiliated entities now being recognised in the Administered operations, together withmanagement and enforcement of the Commission's internal leave management policy.
OVERVIEW AGENCY PERFORMANCE SIGNIFICANT ISSUES APPENDICESDISCLOSURES AND LEGAL COMPLIANCE

Page 93 Mental Health Commission | 2016/17 Annual Report
Financial Statements
Mental Health Commission
Notes to the Financial StatementsFor the year ended 30 June 2017
Note 43 Explanatory statement for Administered Items (Statement of Comprehensive Income)
Variance Note Estimate Actual Actual2017 2017 2016
$ $ $ $ $
IncomeFor transfer:Service appropriation Mental Health Tribunal A 2,653,000 2,653,000 1,406,000 - 1,247,000 Mental Health Advocacy Service A 2,654,000 2,654,000 1,439,000 - 1,215,000 Office of Chief Psychiatrist A 2,262,000 2,262,000 1,675,000 - 587,000Service received free of charge 1, B - 1,080,044 537,840 1,080,044 542,204Other revenue - 870 578 870 292
Total administered income 7,569,000 8,649,914 5,058,418 1,080,914 3,591,496
ExpensesEmployee benefits expense - 6,638,163 3,627,125 6,638,163 3,011,038Supplies and services 7,569,000 1,226,585 703,186 (6,342,415) 523,399Accommodation expense - 364,379 135,479 364,379 228,900Other expenses - 245,072 176,764 245,072 68,308
Total administered expenses 2, C 7,569,000 8,474,199 4,642,554 905,199 3,831,645
Variance between estimate and
actual
Variance between actual results for
2017 and 2016
The Mental Health Act 2014 established the Mental Health Tribunal, Mental Health Advocacy Service, and Office of Chief Psychiatrist, effective in the 2015/16 financial year.
All variances between estimates (original budget) and actual results for 2017, between the actual results for 2017 and 2016 are below. Narratives are provided for key majorvariances, which are generally greater than 5% and $101 thousand.
OVERVIEW AGENCY PERFORMANCE SIGNIFICANT ISSUES APPENDICESDISCLOSURES AND LEGAL COMPLIANCE

Page 94 Mental Health Commission | 2016/17 Annual Report
Financial Statements
Mental Health Commission
Notes to the Financial StatementsFor the year ended 30 June 2017
Note 43 Explanatory statement for Administered Items (Statement of Financial Position)
Variance Note Estimate Actual Actual2017 2017 2016
$ $ $ $ $ASSETSCurrent Assets
Cash and cash equivalents - 1,682,595 1,316,166 1,682,595 366,429Receivables - 73,811 3,150 73,811 70,661
Total Administered Current Assets - 1,756,406 1,319,316 1,756,406 437,090
TOTAL ADMINISTERED ASSETS - 1,756,406 1,319,316 1,756,406 437,090
LIABILITIESCurrent Liabilities
Payables - 240,027 135,723 240,027 104,304Provisions D - 749,756 661,748 749,756 88,008
Total Administered Current Liabilities - 989,783 797,471 989,783 192,312
Non-Current LiabilitiesProvisions D - 175,046 105,981 175,046 69,065
Total Administered Non-Current Liabilities - 175,046 105,981 175,046 69,065
TOTAL ADMINISTERED LIABILITIES - 1,164,829 903,452 1,164,829 261,377
The Mental Health Act 2014 established the Mental Health Tribunal, Mental Health Advocacy Service, and Office of Chief Psychiatrist, effective in the 2015/16 financial year.
At the time of budget submission, it was estimated that there will not be any assets and liabilities. All variances between the actual results for 2017 and 2016 are below.Narratives are provided for key major variances, which are generally greater than 5%.
Variance between estimate and
actual
Variance between actual results for
2017 and 2016
OVERVIEW AGENCY PERFORMANCE SIGNIFICANT ISSUES APPENDICESDISCLOSURES AND LEGAL COMPLIANCE

Page 95 Mental Health Commission | 2016/17 Annual Report
Financial Statements
Mental Health CommissionNotes to the Financial StatementsFor the year ended 30 June 2017
Note 43 Explanatory statement for Administered Item (continued)
Major Estimate and Actual (2017) Variance Narratives
1
2
Major Actual (2017) and Comparative (2016) Variance Narratives
A
B
C
D
Increase in services received free of charge of $1.1 million (100%) is due to corporate services provide by the Commission for which no budget has been provided.
Increase in administered expenditure of of $0.9 million (12%) is mainly due to no budget provided for services received free of charge from the Commission. At the time of compilation ofthe 2016-17 Budget, administered expenditure was not disaggregated in to separate expense categories. Therefore a comparison of total 2016-17 budget with total actual 2016-17expenditure is only available.
Increase in provisions of $0.2 million (20.5%) is mainly due to increases in the number of employees and associated value of leave balances transferred in for new employees.
Increase in Administered approriation of $3 million (67.5%) is due to a full year operation of the Administered entities compared to a part year in 2015-16. The Administered entities wereestablished following proclamation of the Mental Health Act 2014 on 30 November 2015.
Increase in services received free of charge of $0.5 million (100.8%) is due to a full year of support provided by the Commission to the Administered entities compared to a part year in2015-16.
Increase in administered expenditure of $3.8 million (82.5%) is due to a full year operation of the Administered entities compared to a part year in 2015-16.
OVERVIEW AGENCY PERFORMANCE SIGNIFICANT ISSUES APPENDICESDISCLOSURES AND LEGAL COMPLIANCE

Page 96 Mental Health Commission | 2016/17 Annual Report
Financial Statements
Mental Health Commission
Notes to the Financial StatementsFor the year ended 30 June 2017
Note 44 Financial instruments
a) Financial risk management objectives and policies
Credit risk
Liquidity risk
Market risk
b) Categories of financial instruments
2017 2016$ $
Financial AssetsCash and cash equivalents 24,611,247 25,951,257Restricted cash and cash equivalents 6,145,816 4,818,201Receivables (a) 279,826 251,149Amounts receivable for services 5,486,123 5,145,123Financial LiabilitiesFinancial liabilities measured at amortised cost 4,331,079 3,897,124
(a) The amount of receivables excludes GST recoverable from the ATO (statutory receivable).
The Commission has appropriate procedures to manage cash flows including drawdowns of appropriations by monitoring forecast cash flows to ensure that sufficient funds are available tomeet its commitments.
Market risk is the risk that changes in market prices such as foreign exchange rates and interest rates will affect the Commission’s income or the value of its holdings of financial instruments.The Commission does not trade in foreign currency and is not materially exposed to other price risks.
The carrying amounts of each of the following categories of financial assets and financial liabilities at the end of the reporting period are:
Financial instruments held by the Commission are cash and cash equivalents, restricted cash and cash equivalents, receivables and payables. The Commission has limited exposure tofinancial risks. The Commission’s overall risk management program focuses on managing the risks identified below.
Credit risk arises when there is the possibility of the Commission’s receivables defaulting on their contractual obligations resulting in financial loss to the Commission.
The maximum exposure to credit risk at the end of the reporting period in relation to each class of recognised financial assets is the gross carrying amount of those assets inclusive of anyallowance for impairment, as shown in the table at note 44(c) 'Financial Instruments Disclosures' and note 21 'Receivables'.
Credit risk associated with the Commission’s financial assets is minimal because the debtors are predominantly government bodies.
Liquidity risk arises when the Commission is unable to meet its financial obligations as they fall due. The Commission is exposed to liquidity risk through its normal course of operations.
OVERVIEW AGENCY PERFORMANCE SIGNIFICANT ISSUES APPENDICESDISCLOSURES AND LEGAL COMPLIANCE
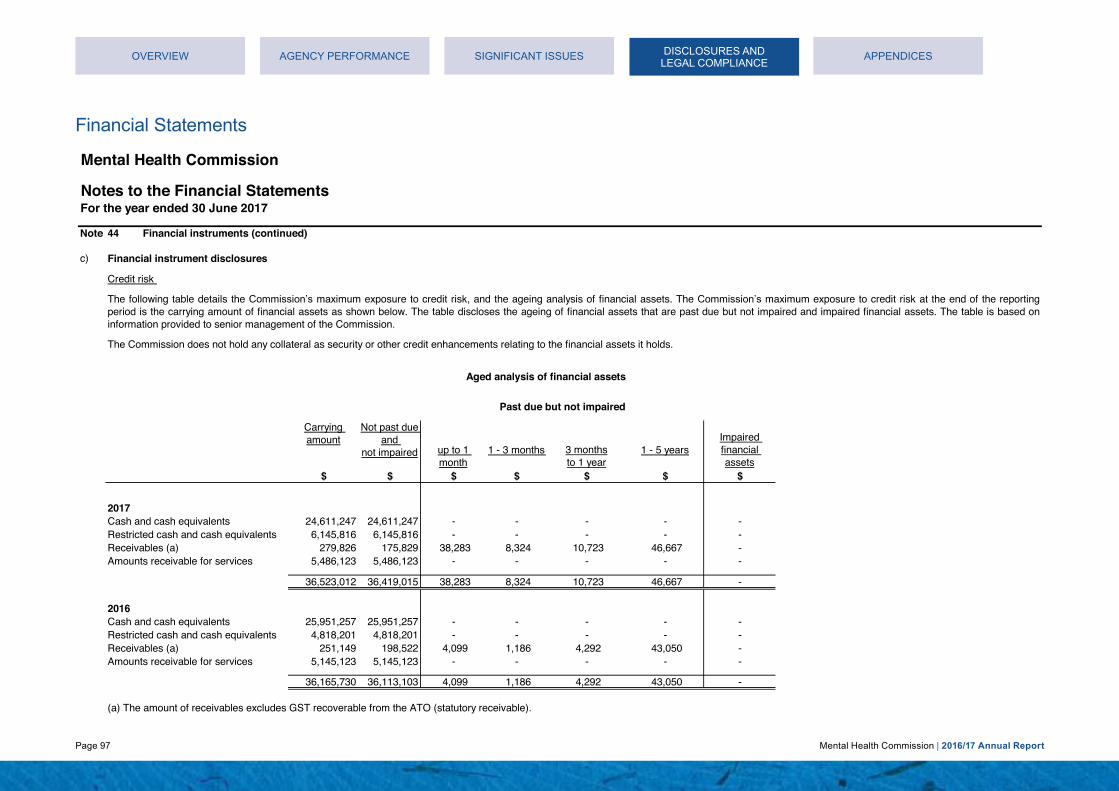
Page 97 Mental Health Commission | 2016/17 Annual Report
Financial Statements
Mental Health Commission
Notes to the Financial StatementsFor the year ended 30 June 2017
Note 44 Financial instruments (continued)
c)
up to 1 month
1 - 3 months 1 - 5 years
$ $ $ $ $ $ $
2017Cash and cash equivalents 24,611,247 24,611,247 - - - - -Restricted cash and cash equivalents 6,145,816 6,145,816 - - - - -Receivables (a) 279,826 175,829 38,283 8,324 10,723 46,667 -Amounts receivable for services 5,486,123 5,486,123 - - - - -
36,523,012 36,419,015 38,283 8,324 10,723 46,667 -
2016Cash and cash equivalents 25,951,257 25,951,257 - - - - -Restricted cash and cash equivalents 4,818,201 4,818,201 - - - - -Receivables (a) 251,149 198,522 4,099 1,186 4,292 43,050 -Amounts receivable for services 5,145,123 5,145,123 - - - - -
36,165,730 36,113,103 4,099 1,186 4,292 43,050 -
(a) The amount of receivables excludes GST recoverable from the ATO (statutory receivable).
The Commission does not hold any collateral as security or other credit enhancements relating to the financial assets it holds.
Aged analysis of financial assets
Credit risk
Not past due and
not impairedImpaired financial assets
Past due but not impaired
3 monthsto 1 year
Carrying amount
The following table details the Commission’s maximum exposure to credit risk, and the ageing analysis of financial assets. The Commission’s maximum exposure to credit risk at the end of the reportingperiod is the carrying amount of financial assets as shown below. The table discloses the ageing of financial assets that are past due but not impaired and impaired financial assets. The table is based oninformation provided to senior management of the Commission.
Financial instrument disclosures
OVERVIEW AGENCY PERFORMANCE SIGNIFICANT ISSUES APPENDICESDISCLOSURES AND LEGAL COMPLIANCE

Page 98 Mental Health Commission | 2016/17 Annual Report
Financial Statements
Mental Health Commission
Notes to the Financial StatementsFor the year ended 30 June 2017
Note 44 Financial instruments (continued)
c) Financial instrument disclosures (continued)
Weighted average Fixed Variable Non-effective interest interest interest Nominal Up to 3 months More than
interest rate rate rate bearing Amount 1 month 1 - 3 months to 1 year 1 - 5 years 5 year% $ $ $ $ $ $ $ $ $ $
2017
Financial AssetsCash and cash equivalents - 24,611,247 - - 24,611,247 24,611,247 24,611,247 - - - -Restricted cash and cash equivalents 2.0% 6,145,816 - 4,723,793 1,422,023 6,145,816 6,145,816 - - - -Receivables (a) - 279,826 - - 279,826 279,826 279,826 - - - -Amounts receivable for services - 5,486,123 - - 5,486,123 5,486,123 - - - - 5,486,123
- 36,523,012 - 4,723,793 31,799,219 36,523,012 31,036,889 - - - 5,486,123
Financial LiabilitesPayables - 4,331,079 - - 4,331,079 4,331,079 4,331,079 - - - -
4,331,079 - - 4,331,079 4,331,079 4,331,079 - - - -
2016
Financial AssetsCash and cash equivalents - 25,951,257 - - 25,951,257 25,951,257 25,951,257 - - - -Restricted cash and cash equivalents 2.3% 4,818,201 - 4,622,341 195,860 4,818,201 4,818,201 - - - -Receivables (a) - 251,149 - - 251,149 251,149 251,149 - - - -Amounts receivable for services - 5,145,123 - - 5,145,123 5,145,123 - - - - 5,145,123
36,165,730 - 4,622,341 31,543,389 36,165,730 31,020,607 - - - 5,145,123
Financial LiabilitesPayables - 3,897,124 - - 3,897,124 3,897,124 3,897,124 - - - -
3,897,124 - - 3,897,124 3,897,124 3,897,124 - - - -
(a) The amount of receivables excludes GST recoverable from the ATO (statutory receivable). .
Interest rate exposure and maturity analysis of financial assets and financial liablities
Maturity Dates
The following table details the Commission's interest rate exposure and the contractual maturity analysis of financial assets and financial liabilities. The maturity analysis section includes interest andprincipal cash flows. The interest rate exposure section analyses only the carrying amount of each item.
Carrying amount
Liquidity risk and interest rate exposure
Interest rate exposure
OVERVIEW AGENCY PERFORMANCE SIGNIFICANT ISSUES APPENDICESDISCLOSURES AND LEGAL COMPLIANCE

Page 99 Mental Health Commission | 2016/17 Annual Report
Financial Statements
Mental Health Commission
Notes to the Financial StatementsFor the year ended 30 June 2017
Note 44 Financial instruments (continued)
c) Financial instrument disclosures (continued)
Surplus Equity
$ $ $ $ $2017
Financial AssetsRestricted cash and cash equivalents 4,723,793 (47,238) (47,238) 47,238 47,238
(47,238) (47,238) 47,238 47,238
Surplus Equity
$ $ $ $ $2016
Financial AssetsRestricted cash and cash equivalents 4,622,341 (46,223) (46,223) 46,223 46,223
(46,223) (46,223) 46,223 46,223
Fair values
All financial assets and liabilities recognised in the Statement of Financial Position, whether they are carried at cost or fair value, are recognised at amounts that represent a reasonableapproximation of fair value unless otherwise stated in the applicable notes.
+100 basis points
Total Increase/(Decrease)
SurplusCarrying amount
Equity
Total Increase/(Decrease)
Surplus
-100 basis points
Carrying amount
-100 basis points
The following table represents a summary of the interest rate sensitivity of the Commission’s financial assets and liabilities at the end of the reporting period on the surplus for the period and equity for a 1%change in interest rates. It is assumed that the change in interest rates is held constant throughout the reporting period.
Interest rate sensitivity analysis
+100 basis points
Equity
OVERVIEW AGENCY PERFORMANCE SIGNIFICANT ISSUES APPENDICESDISCLOSURES AND LEGAL COMPLIANCE

Page 100 Mental Health Commission | 2016/17 Annual Report
This page has been left blank intentionally
OVERVIEW AGENCY PERFORMANCE SIGNIFICANT ISSUESDISCLOSURES AND
LEGAL COMPLIANCEAPPENDICES

Page 101 Mental Health Commission | 2016/17 Annual Report
Key Performance Indicators
Certification of Key Performance Indicators for the year ended 30 June 2017
I hereby certify that key performance indicators are based on proper records, are relevant and appropriate for assisting users to assess the performance of the Mental Health Commission and fairly represent the performance of the Mental Health Commission for the financial year ended 30 June 2017.
Timothy MarneyCommissionerMental Health CommissionAccountable Authority
6 September 2017
This page has been left blank intentionally
OVERVIEW AGENCY PERFORMANCE SIGNIFICANT ISSUES APPENDICESDISCLOSURES AND LEGAL COMPLIANCE
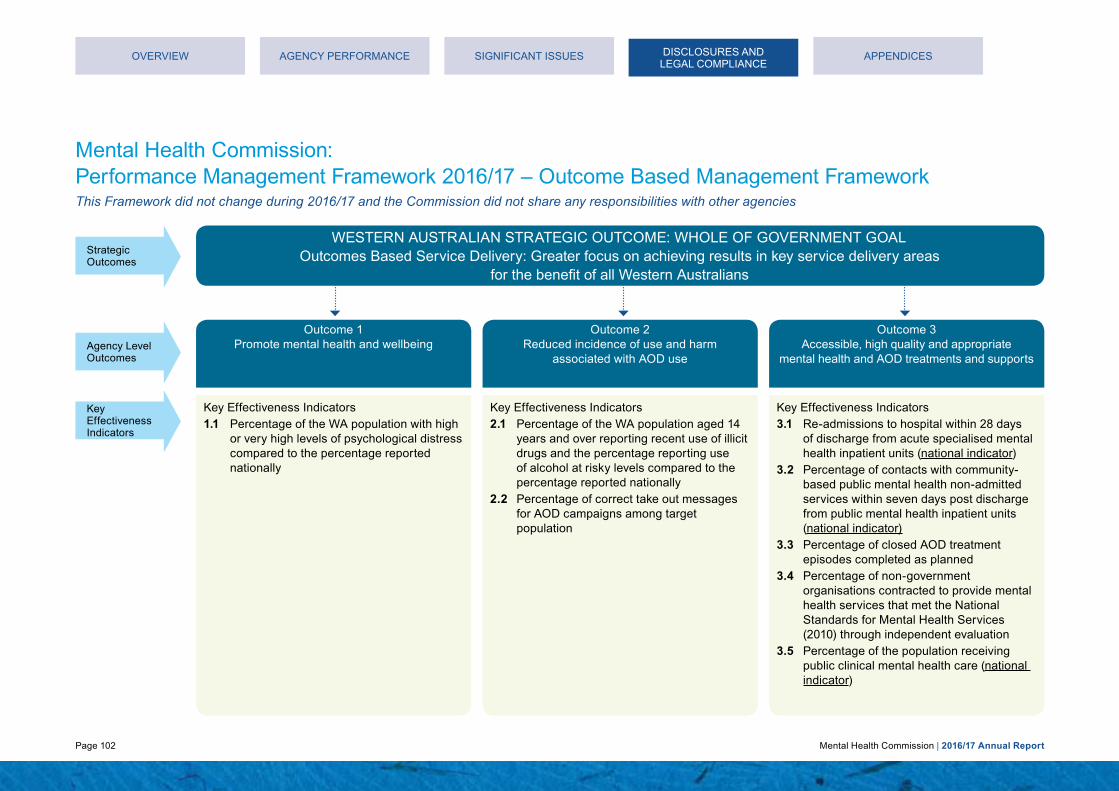
Page 102 Mental Health Commission | 2016/17 Annual Report
Mental Health Commission: Performance Management Framework 2016/17 – Outcome Based Management FrameworkThis Framework did not change during 2016/17 and the Commission did not share any responsibilities with other agencies
WESTERN AUSTRALIAN STRATEGIC OUTCOME: WHOLE OF GOVERNMENT GOAL Outcomes Based Service Delivery: Greater focus on achieving results in key service delivery areas
for the benefit of all Western Australians
Strategic
Agency Level Outcomes
Outcome 1Promote mental health and wellbeing
Key Effectiveness Indicators
Key Effectiveness Indicators1.1 Percentage of the WA population with high
or very high levels of psychological distress compared to the percentage reported nationally
Key Effectiveness Indicators2.1 Percentage of the WA population aged 14
years and over reporting recent use of illicit drugs and the percentage reporting use of alcohol at risky levels compared to the percentage reported nationally
2.2 Percentage of correct take out messages for AOD campaigns among target population
Key Effectiveness Indicators3.1 Re-admissions to hospital within 28 days
of discharge from acute specialised mental health inpatient units (national indicator)
3.2 Percentage of contacts with community-based public mental health non-admitted services within seven days post discharge from public mental health inpatient units (national indicator)
3.3 Percentage of closed AOD treatment episodes completed as planned
3.4 Percentage of non-government organisations contracted to provide mental health services that met the National Standards for Mental Health Services (2010) through independent evaluation
3.5 Percentage of the population receiving public clinical mental health care (national indicator)
OVERVIEW AGENCY PERFORMANCE SIGNIFICANT ISSUES APPENDICES
Outcome 2Reduced incidence of use and harm
associated with AOD use
Outcome 3Accessible, high quality and appropriate
mental health and AOD treatments and supports
Outcomes
DISCLOSURES AND LEGAL COMPLIANCE

Page 103 Mental Health Commission | 2016/17 Annual Report
Mental Health Commission: Performance Management Framework 2016/17 – Outcome Based Management FrameworkThis Framework did not change during 2016/17 and the Commission did not share any responsibilities with other agencies
Service 2Hospital Bed-Based
Services
Service 3Community Bed-Based
Services
Service 4Community Treatment
Service 5
Services Community Support
1.1 Cost per capita to enhance mental health and wellbeing and prevent suicide (illness prevention promotion and protection activities)
1.2 Cost per capita of the WA population 14 years and above for initiatives that delay the uptake and reduce the harm associated with alcohol and other drugs
1.3 Cost per person of AOD campaign target groups who are aware of, and correctly recall, the main campaign messages
Acute2.1 Average length of stay
in purchased acutespecialised mental health units
2.2 Average cost per purchased bedday in acute specialised mental health units
Sub-acute2.3 Average length of stay
in purchased sub-acutespecialised mental health units
2.4 Average cost per purchased bedday in sub-acute specialised mental health units
Hospital in the Home2.5 Average length of stay in
purchased hospital in the home mental health units
2.6 Average cost per purchased bedday in hospital in the home mental health units
Forensic2.7 Average length of stay
in purchased forensic mental health units
2.8 Average cost per purchased bedday in forensic mental health units
3.1 Average cost per purchased bedday in non-acute (24 hours support) community bed-based services
3.2 Average cost per purchased bedday in non-acute (hospital/ nursing home) community bed-based units
3.3 Average cost per purchased bedday in step up/step down community bed-based units
3.4 Cost per completed treatment episode in AOD residential rehabilitation services
4.1 Average cost per purchased treatment day of ambulatory care provided by public clinical mental health services (national indicator)
4.2 Average treatment days per episode of ambulatory care provided by public clinical mental health services
4.3 Cost per completed treatment episode in community -based AOD services
5.1 Average cost per hour of community support provided to people with mental health problems
5.2 Average cost per episode of community support provided for AOD services
5.3 Average cost per package of care provided for the Individualised Community Living Strategy
5.4 Cost per episode of care in safe places for intoxicated people
Service 1Prevention
Key Efficiency Indicators
OVERVIEW AGENCY PERFORMANCE SIGNIFICANT ISSUES APPENDICESDISCLOSURES AND LEGAL COMPLIANCE

Page 104 Mental Health Commission | 2016/17 Annual Report
Key Effectiveness Indicators Outcome one Promote mental health and wellbeingDescription:An indication of the mental health and wellbeing of a population is provided by measuring levels of psychological distress using the K10. The K10 questionnaire is a widely used and reported measure of global psychosocial distress, and is used in both population based surveys and in clinical settings. High psychological distress has a strong relationship with diagnosable mental disorders and is useful for estimating population need for mental health services.
Rationale:Monitoring psychological distress in the Western Australian population will enable the Commission to assess the impact of its services and initiatives on the population to promote mental health and wellbeing.
Results: The most recent survey (2015/16) stated that the proportion of the Western Australian population with high or very high levels of psychological distress (9.9 per cent) was 1.8 percentage points lower than the proportion reported nationally (11.7 per cent). The next survey’s results will be available in 2018/19.
OVERVIEW AGENCY PERFORMANCE SIGNIFICANT ISSUES APPENDICESDISCLOSURES AND LEGAL COMPLIANCE

Page 105 Mental Health Commission | 2016/17 Annual Report
1.1: Percentage of the Western Australian population with high or very high levels of psychological distress compared to the percentage reported nationally
% h
igh
or v
ery
high
dis
tres
s
0
2
4
6
8
10
12
AUSWA
2015/162012/13
10.6 10.8
9.9
11.7
Note: The Kessler Psychological Distress Scale (K10) is scored from 10 to 50, with higher scores indicating a higher level of distress, a score of 22 and above indicates high or very high distress.
Data Source: Australian Bureau of Statistics (ABS) – National Health Survey, 2011/12 and 2014/15. The 2014/15 survey was conducted in all states and territories and across urban, rural and remote areas of Australia (other than very remote areas), and included around 19,000 people in nearly 15,000 private dwellings.
Time Period: The National Health Survey is only conducted every three years. The 2011/12 results were published in 2012/13 and the 2014/15 results were published in 2015/16. The next survey will be conducted in 2017/18 and published in 2018/19, so no results are available for 2016/17.
The percentage of Western Australians who report high or very high psychological distress is
1.8 than the national average
percentage points lower
OVERVIEW AGENCY PERFORMANCE SIGNIFICANT ISSUES APPENDICESDISCLOSURES AND
LEGAL COMPLIANCE

Page 106 Mental Health Commission | 2016/17 Annual Report
Outcome two Reduce incidence of use and harm with AOD useDescription:Alcohol-related risk of harm is determined using the 2009 National Health and Medical Research Council guidelines. The 2009 guidelines recommend that for healthy men and women, drinking no more than two standard drinks on any day reduces the lifetime risk of harm from alcohol-related disease or injury.
The term ‘Illicit drugs’, as reported in the NDSHS, covers a wide range of drugs that includes illegal drugs (such as cannabis, ecstasy, heroin and cocaine), prescription and over-the-counter pharmaceuticals (such as tranquillisers/sleeping pills) used for illicit purposes, and other substances used inappropriately such as inhalants and naturally occurring hallucinogens. The term ‘recent use’ refers to the use of drugs or alcohol within 12 months prior to being surveyed for the NDSHS.
Key Effectiveness Indicators Rationale:Preventing or delaying the onset of risky alcohol consumption and preventing illicit drug use reduces the impact of short-term risk and contributes to the prevention of long-term health related harm. This indicator is strategic, measurable and comparable to other jurisdictions. It uses information from a national survey conducted every three years and provides a view of reported illicit drug use and alcohol over time. This indicator reflects the impact of preventative initiatives of a range of government departments, including the Commission, on reducing the incidence of use and harm associated with alcohol and other drugs.
Results: The most recent survey (2014/15) stated that the proportion of the Western Australian population aged 14 years and over reporting recent use of illicit drugs (17.0 per cent) was two percentage points higher than the proportion reported nationally (15.0 per cent). The proportion of the Western Australian population aged 14 years and over reporting use of alcohol at lifetime risky levels (21.6 per cent) was 3.4 percentage points higher than the proportion reported nationally (18.2 per cent). The next survey’s results will be available in 2017/18.
OVERVIEW AGENCY PERFORMANCE SIGNIFICANT ISSUES APPENDICESDISCLOSURES AND LEGAL COMPLIANCE

Page 107 Mental Health Commission | 2016/17 Annual Report
2.1: Percentage of the Western Australian population aged 14 years and over reporting recent use of illicit drugs and the percentage reporting use of alcohol at risky levels compared to the percentage reported nationally
% r
ecen
t use
of i
llici
t dru
gs
0
5
10
15
20
AUSWA
2014/152011/12
18.6
17.0
14.7 15.0
% u
sing
alc
ohol
at l
ifetim
e ris
ky le
vels
0
5
10
15
20
25
AUSWA
2014/152011/12
23.021.6
20.5
18.2
OVERVIEW AGENCY PERFORMANCE SIGNIFICANT ISSUES APPENDICES
Data Source: Australian Institute of Health and Wellbeing (AIHW) – National Drug Strategy Household Survey (NDSHS), 2010 and 2013. The 2013 survey collected data from nearly 24,000 people across Australia. Households were selected by a multistage, stratified area random sample design.
Time Period: The NDSHS is only conducted every three years. The 2010 results were published in 2011/12 and the 2013 results were published in 2014/15. The next survey is in progress (2016) and will be published in 2017/18, so no results are available for 2016/17.
DISCLOSURES AND LEGAL COMPLIANCE

Page 108 Mental Health Commission | 2016/17 Annual Report
Outcome two Reduce incidence of use and harm with AOD useDescription:This indicator reports on the percentage “correct” take out messages for AOD campaigns, which are social marketing programs aimed at raising awareness of the risk of AOD-related harms.
An alcohol or other drug prevention advertisement is presented to a panel of individuals recruited by a marketing company. The individuals represent the age and/or gender demographic that the campaign intends to target. The panel members participate in a post-evaluation campaign session which collects data relating to awareness and correct recall of the campaign messages. These statistics are then applied to the corresponding Western Australian population figures for that targeted age and/or gender demographic.
An adjustment factor was applied to approximate a correct message recall rate amongst the target population. The factor used was 80% and has been recommended by experts at TNS.
Key Effectiveness Indicators
OVERVIEW AGENCY PERFORMANCE SIGNIFICANT ISSUES APPENDICES
Rationale:This indicator measures success of public education and social marketing campaigns to reduce the social acceptability of risky AOD use and increase the awareness of associated harm. The campaigns aim to build awareness and understanding of the risks and harms associated with AOD use. This indicator provides a measure of how many people aware of the campaign correctly understood the message(s) (i.e. correct take out) presented by the campaign, which provides an indication of how effective the campaign was in delivering the message(s) to the target population to reduce the incidence of use and harm associated with AODs. A range of other prevention activities are undertaken within the Western Australian community and linked explicitly to the key campaign messages: Alcohol.Think Again and Drug Aware.
Results: In 2016/17, the correct message take out for the “Alcohol. Think Again” health campaign was 39.2 per cent. This result is lower than the 2016/17 target of 72.8 per cent due to the implementation of a refined methodology used to calculate campaign correct message takeout which was not available at the time of target development. This methodology uses both correct recall and correct message takeout. If the old methodology was used the campaign correct message take out amongst the target population would be 78.4%, indicating the campaign was above target.
The correct message take out for the Drug Aware “Meth Can Take Control” campaign (38.2 per cent) was 3.6 percentage points higher than the 2016/17 target of 34.6 per cent. As this is the first time Drug Aware “Meth Can Take Control” campaign results have been presented using this methodology the target is not effected by the change.
DISCLOSURES AND LEGAL COMPLIANCE

Page 109 Mental Health Commission | 2016/17 Annual Report
2.2: Percentage of correct take out messages for AOD campaigns among target population
% c
orre
ct ta
ke o
ut m
essa
ges
0
10
20
30
40
50
60
70
80
MethamphetamineAlcohol
2016/17 Actual2016/17 Target2015/16
45.9
39.2
72.8
38.234.6
Data Source – Alcohol: TNS Global social marketing company. The total sample size was 402 and was weighted by gender within age and by location to approximate the Western Australian population of individuals aged 25 to 54 years. The response rate was 76%. The confidence interval is 95% and the standard error rate is 4.59%.
Data Source – Methamphetamine: TNS Global social marketing company. The total sample size was 401 and was weighted by gender within age and by location to approximate the Western Australian population of individuals aged 14 to 29 years. The response rate was 25%. The confidence interval is 95% and the standard error rate is 4.99%.
Time Period: The data is for the financial year.
During 2016/17 a new online tool was launched as part of the Alcohol.Think Again campaign
OVERVIEW AGENCY PERFORMANCE SIGNIFICANT ISSUES APPENDICESDISCLOSURES AND LEGAL COMPLIANCE

Page 110 Mental Health Commission | 2016/17 Annual Report
Outcome three Accessible, high quality and appropriate mental health and AOD treatments and supportsDescription:The proportion of overnight separations from acute specialised mental health inpatient units that are followed by a re-admission to the same or another specialised mental health inpatient unit within 28 days of discharge.
Rationale:This indicator measures the appropriateness and quality of care provided by mental health services. The re-admission rate is an indicator of the objective to provide effective care and continuity of care in the delivery of mental health services. This indicator is a nationally endorsed and widely reported indicator, considered to be a global performance measure as it potentially points to deficiencies in the functioning of the overall mental health care system. Admissions to a specialised mental health inpatient unit following a recent discharge may indicate that inpatient treatment was either incomplete or ineffective, or that follow-up care was inappropriate or inadequate to maintain the person out of hospital.
Key Effectiveness Indicators This indicator seeks to address the policy question of whether mental health consumers receive effective care in hospital and if on discharge, care is coordinated and continuous in the community setting (and therefore people are more likely to recover). A community support system for people who are discharged from hospital after an acute psychiatric episode is essential to maintain clinical and functional stability and to minimise the need for hospital re-admission. This is particularly important in the vulnerable period following discharge from hospital.
Results: In 2016, the re-admission rate to acute mental health inpatient facilities within 28 days of discharge was 17.1 per cent. This result is lower than the 2015 result of 17.6 per cent but above the nationally set target of less than or equal to 12.0 per cent. Since 2014, re-admission rates have been impacted by the introduction of new models of care such as hospital in the home and data recording and reporting practices. The Commission has implemented a monitoring program for this key effectiveness measure and is regularly reviewing current results with Western Australian Department of Health to further improve performance and enhance data capture.
OVERVIEW AGENCY PERFORMANCE SIGNIFICANT ISSUES APPENDICESDISCLOSURES AND LEGAL COMPLIANCE

Page 111 Mental Health Commission | 2016/17 Annual Report
3.1 Re-admissions to hospital within 28 days of discharge from acute specialised mental health units (national indicator)
% r
e-ad
mis
sion
to h
ospi
tal w
ithin
28
days
0
5
10
15
20
2016 Actual2016 Target2015201420132012
17.1
13.514.2
15.6
17.617.1
<=12.0
Note: A re-admission for any of the separations identified as ‘in scope’ is defined as an admission to any acute specialised mental health inpatient unit in Western Australia and includes admissions to specialised mental health inpatient units in publicly funded private hospitals. This indicator is constructed using the national definition and target. Due to a six month lag to enable coding of this indicator, calendar year is a more appropriate reporting period.
Data Source: Mental Health Information System, Department of Health.
Time Period: The data is for the calendar year.
A community support system for people who are discharged from hospital after an acute psychiatric episode is essential to maintain clinical and functional stability and to minimise the need for hospital re-admission.
OVERVIEW AGENCY PERFORMANCE SIGNIFICANT ISSUES APPENDICESDISCLOSURES AND
LEGAL COMPLIANCE

Page 112 Mental Health Commission | 2016/17 Annual Report
Outcome three Accessible, high quality and appropriate mental health and AOD treatments and supportsDescription:The proportion of overnight separations from public mental health inpatient units where a first contact with a community-based public mental health non-admitted service occurred within seven days following discharge. The time period of seven days was recommended nationally as an indicative measure for contact with community-based non-admitted services following discharge from hospital.
Key Effectiveness Indicators Rationale:This indicator measures the quality of care provided by mental health services. It is an indicator of the objective to provide continuity of care in the delivery of mental health services. A large proportion of people with a mental health problem have a chronic or recurrent type illness that results in only partial recovery between acute episodes and deterioration in functioning that can lead to problems in living an independent life. As a result, hospitalisation may be required on more than one occasion each year with the need for ongoing community-based support.
A responsive and high quality community support system will assist people who have experienced an acute psychiatric episode requiring hospitalisation in maintaining clinical and functional stability to minimise their need for a hospital re-admission. Patients leaving hospital after a psychiatric admission with a formal discharge plan, involving linkages with public community-based services and supports, are less likely to need inappropriate re-admission.
These community services provide ongoing clinical treatment and access to a range of programs that maximise an individual’s independent functioning and quality of life.
Results: In 2016, 64.1 per cent of patients had contact with a community-based public mental health service within seven days post discharge from a public mental health inpatient unit. This result is higher than the 2015 result of 60.7 per cent but below the nationally set target of greater than or equal to 70 per cent. As seen over the six year period, the Commission is continuing to work towards the national target.
OVERVIEW AGENCY PERFORMANCE SIGNIFICANT ISSUES APPENDICESDISCLOSURES AND LEGAL COMPLIANCE

Page 113 Mental Health Commission | 2016/17 Annual Report
3.2: Percentage of contacts with community-based public mental health non-admitted services within seven days post discharge from public mental health inpatient units (national indicator)
% c
onta
cts
with
pub
lic n
on-a
dmitt
ed s
ervi
ces
0
10
20
30
40
50
60
70
80
2016 Actual
2016 Target
2015 2014201320122011
49.652.6
56.460.4 60.7
64.1
>=70.0
Note: This indicator includes follow up by public mental health non-admitted services only. Follow up by other providers, including private psychiatrists, GPs or community managed (non-government) services are not included.
Data Source: Mental Health Information System (MHIS), Department of Health. Hospital Morbidity Data Collection, Department of Health.
Time Period: The data is for the calendar year.
In 2016/17 the Commission funded community-based public mental health non-admitted services, such as the Youth Community Treatment service at Fiona Stanley Hospital
OVERVIEW AGENCY PERFORMANCE SIGNIFICANT ISSUES APPENDICESDISCLOSURES AND LEGAL COMPLIANCE

Page 114 Mental Health Commission | 2016/17 Annual Report
Outcome three Accessible, high quality and appropriate mental health and AOD treatments and supportsDescription:This indicator reports the percentage of closed treatment episodes in AOD treatment services that were completed as planned. An episode is the period of care between the start and end of treament. Treatment episodes are considered to have a planned exit if the client had left a service for one of the following reasons: ceased as expiation, ceased to participate by mutual agreement, change in the delivery setting, change in the main treatment type, transferred to another service provider or treatment completed.
Unplanned exits occur if the client ceased to participate against advice, ceased to participate (non-compliance), ceased to participate without notice, died, sanctioned by drug court or court diversion service back to jail, and imprisoned (other than drug court sanctioned).
Key Effectiveness Indicators Rationale:This indicator measures the quality of AOD treatment and supports. International literature identifies that treatment outcomes for people with alcohol and drug-related problems are significantly enhanced if they remain in treatment until the program is completed or they leave with the agreement of their clinician. Treatment episodes that are completed as planned are indicative of effective outcomes. This indicator provides an indication of the extent of which treatment objectives are likely to be achieved (i.e., a planned outcome). A high percentage of closed AOD treatment episodes completed as planned is indicative of high quality and appropriate care in AOD treatment and support.
Results: In 2016/17, the percentage of closed treatment episodes that were completed as planned was 73.5 per cent. This result is higher than the 2015/16 result of 72.6 per cent but below the 2016/17 target of greater than or equal to 76.0 per cent. The Commission is continuing to work towards the target to ensure high quality and appropriate care.
OVERVIEW AGENCY PERFORMANCE SIGNIFICANT ISSUES APPENDICESDISCLOSURES AND LEGAL COMPLIANCE

Page 115 Mental Health Commission | 2016/17 Annual Report
3.3: Percentage of closed AOD treatment episodes completed as planned
% tr
eatm
ent e
piso
des
com
plet
ed a
s pl
anne
d
0
10
20
30
40
50
60
70
80
2016/17 Actual2016/17 Target2015/16
72.6 73.5>=76.0
Data Source: The Commission’s De-identified Treatment Agency Database.
Time Period: Data is for the April 2016 to March 2017 time period to allow for a three month lag for coding and auditing purposes.
In 2016/17, the percentage of closed treatment episodes that were completed as planned was 73.5 per cent
OVERVIEW AGENCY PERFORMANCE SIGNIFICANT ISSUES APPENDICESDISCLOSURES AND
LEGAL COMPLIANCE

Page 116 Mental Health Commission | 2016/17 Annual Report
Outcome three Accessible, high quality and appropriate mental health and AOD treatments and supportsDescription:Monitoring the non-government organisations contracted by the Mental Health Commission to provide mental health services and supports against national standards for care will enable the Commission to be confident that it is investing in services that are providing appropriate and quality care to individuals in the community. Revised National Standards for Mental Health Services (NSMHS) were released in September 2010 and provide a blueprint for new and existing services to guide quality improvement and service enhancement activities. These standards can apply to non-government community mental health services as well as specialised public mental health services. This indicator measures the proportion of organisations that have been through an independent evaluation that achieved at least eight of the ten standards.
Key Effectiveness Indicators Rationale:This indicator measures the appropriateness and quality of mental health services provided by non-government organisations contracted by the Commission against the NSMHS. All Commission funded organisations are required to meet the NSMHS and these are evaluated through Independent Quality Evaluations in addition to an annual self-assessment. The intent of Independent Quality Evaluations is to focus on how an organisation is continuously improving its services, supporting individuals to meet their individual goals (Outcomes) and meeting the Standards. A key component of the Quality Evaluations is identifying the satisfaction people (individuals, families and carers) have experienced accessing the services including their perception and confidence in how the organisation is meeting their needs. Having an independent team of evaluators look at an organisation’s services and speak to the people accessing them in a confidential manner can provide the opportunity for continuous improvement activities that otherwise may not be identified.
Results: In 2016/17, the percentage of non-government organisations contracted to provide mental health services that met at least eight of the ten NSMHS standards was 77.8 per cent. This is lower than the 2016/15 result of 94.1 per cent and the 2016/17 target of 100 per cent. The 2016/17 result relates to four of the eighteen service providers audited in 2016/17 failing to meet at least eight of the standards. These service providers have required actions identified that must be implemented within a set timeframe and provide evidence to the Commission that these have been implemented in order to bring their services in line with the Standards.
OVERVIEW AGENCY PERFORMANCE SIGNIFICANT ISSUES APPENDICESDISCLOSURES AND LEGAL COMPLIANCE

Page 117 Mental Health Commission | 2016/17 Annual Report
3.4: Percentage of non-government organisations contracted to provide mental health services that met the National Standards for Mental Health Services (2010) through independent evaluation
% o
f NG
O’s
that
met
at l
east
80%
of s
tand
ards
0
20
40
60
80
100
2016/17 Actual2016/17 Target2015/16
77.8
94.1100.0
OVERVIEW AGENCY PERFORMANCE SIGNIFICANT ISSUES APPENDICES
Data Source: The Commission, Sector and Quality Evaluation Management.
Time Period: Data is for the financial year.
DISCLOSURES AND LEGAL COMPLIANCE

Page 118 Mental Health Commission | 2016/17 Annual Report
Outcome three Accessible, high quality and appropriate mental health and AOD treatments and supportsDescription:This indicator reports on the proportion of the Western Australian population using a specialised public mental health service. This indicator measures the accessibility of public mental health services.
Rationale:This indicator measures the accessibility of public mental health services. Widespread concern about access to mental health care was a key factor that underpinned the Council of Australian Governments (COAG) National Action Plan on Mental Health endorsed by governments in 2006, and was reinforced in the commitments made under the various National Mental Health Plans. The Third and Fourth National Mental Health Plans in particular have emphasised the need to improve access to primary mental health care, especially for people with common mental illnesses.
The issue of unmet need has become prominent at a national level since the National Survey of Mental Health and Wellbeing indicated that a majority of people affected by a mental disorder do not receive treatment.
Key Effectiveness Indicators While not all people affected by a mental disorder require treatment, and while some will only receive treatment from sources other than specialised public mental health services (such as primary care from GPs, treatment in private hospitals or supports from non-government organisations), this indicator enables the Commission to monitor the accessibility of public mental health services, which currently account for more than 78% of the Commission’s funding. Severe mental health disorders are experienced by approximately 3% of the Australian population (National Action Plan for Mental Health 2006-2011: Fourth Progress Report; Council of Australian Governments). A higher percentage is indicative of greater accessibility to mental health services by those in need.
Results: In 2016, the percentage of the Western Australian population receiving public mental health care was 2.3 per cent. This result is higher than the 2015 result (2.2 per cent) and met the 2016/17 target of greater than or equal to 2.2 per cent. It should be noted that although the result of 2.3 per cent is below the estimated population prevalence of severe mental health disorders (3.0 per cent), many individuals receive treatment through the private sector and are therefore not captured in this indicator.
OVERVIEW AGENCY PERFORMANCE SIGNIFICANT ISSUES APPENDICESDISCLOSURES AND LEGAL COMPLIANCE

Page 119 Mental Health Commission | 2016/17 Annual Report
3.5: Percentage of the population receiving public clinical mental health care (national indicator)
% r
ecei
ving
clin
ical
men
tal h
ealth
car
e
0.0
0.5
1.0
1.5
2.0
2.5
2016 Actual2016 Target2015
2.2 >=2.22.3
Data Source: Mental Health Information System (MHIS), Department of Health. Hospital Morbidity Data Collection, Department of Health. Population figures – ABS time series workbook 3101.0 Population by age and sex, Australian States and Territories, Western Australia.
Time Period: The population receiving public clinical mental health care data is for the calendar year, the population data is a June 2016 population estimate calculated by the ABS in December 2016, the latest estimate available.
NMHS public mental health services, such as those at Graylands Hospital, are funded through the Commission
OVERVIEW AGENCY PERFORMANCE SIGNIFICANT ISSUES APPENDICESDISCLOSURES AND LEGAL COMPLIANCE

Page 120 Mental Health Commission | 2016/17 Annual Report
Key Efficiency Indicators Service one PreventionDescription:This indicator is calculated by dividing total Commission expenditure on mental health illness prevention, promotion and protection activities by the total Western Australian estimated resident population. Mental health prevention, promotion and protection activities focus on groups rather than individuals. The activities aim to eliminate or reduce modifiable risk factors associated with individual, social and environmental health determinants to enhance mental health and wellbeing and prevent mental disorders before they develop. Mental health promotion is defined as activities designed to lead to improvement of the mental health and functioning of persons through prevention, education and intervention activities and services. It involves the population as a whole in the context of their everyday lives. Such measures encourage lifestyle and behavioural choices, attitudes and beliefs that protect and promote mental health and reduce mental disorders.
Rationale:This indicator measures the cost per capita of mental health promotion, illness prevention, protection and related activities. It monitors the investment by the Mental Health Commission in activities that aim to eliminate or reduce modifiable risk factors associated with individual, social and environmental health determinants to enhance mental health and wellbeing and prevent mental illnesses before they develop. This investment applies to the population as a whole in the context of their everyday lives. This indicator also seeks to address the policy question regarding how well mental health prevention services use their resources (inputs) to produce outputs, that is, whether prevention programs are delivered in the most efficient manner.
Results: In 2016/17, the cost per capita to provide prevention, promotion, protection and related activities to enhance mental health wellbeing was $4.10. The result is lower than the 2015/16 result of $4.20 and below the 2016/17 target of $4.44. This is because not all the budgeted funds were expended during 2016/17 due to the delayed commencement of some projects (such as the Aboriginal Family Wellbeing Pilot Project and the Mental Health and Wellbeing Education for Men in Regional and Remote Farming Communities).
OVERVIEW AGENCY PERFORMANCE SIGNIFICANT ISSUES APPENDICESDISCLOSURES AND LEGAL COMPLIANCE

Page 121 Mental Health Commission | 2016/17 Annual Report
1.1: Cost per capita to enhance mental health and wellbeing and prevent suicide (illness prevention, promotion and protection activities)
$ co
st p
er c
apita
0
1
2
3
4
5
2016/17 Actual2016/17 Target2015/162014/152013/14
4.31 4.36 4.20 4.10
4.44
Data Source: The Commission’s Financial Systems. Population figures – ABS time series workbook 3101.0 Population by age and sex, Australian States and Territories, Western Australia.
Time Period: The population data is a June 2016 population estimate calculated by the ABS in December 2016, the latest estimate available. Cost data is presented by financial year.
In 2016/17, the cost per capita to provide prevention, promotion, protection and related activities to enhance mental health wellbeing was $4.10
OVERVIEW AGENCY PERFORMANCE SIGNIFICANT ISSUES APPENDICESDISCLOSURES AND LEGAL COMPLIANCE

Page 122 Mental Health Commission | 2016/17 Annual Report
Service one PreventionDescription:The Commission delivers public health campaigns and initiatives to reduce harmful alcohol use and prevent illicit drug use including: the Alcohol. Think Again campaign, which encourages and supports communities to achieve a safer drinking culture in Western Australia; and the Drug Aware program, which focuses on reducing the harm from illicit drugs by encouraging sensible and informed decisions about illicit drug use, through providing credible, factual information and delivering comprehensive strategies to address drug-related issues.
The Commission supports local service providers to prevent AOD use and related problems through activities such as a Statewide network of local drug action groups that deliver preventative activities and education for youth and support for families, and school drug education through the state, Catholic and independent school sectors. The Commission provides a range of prevention and early intervention programs and services that prevent and delay the onset of AOD use, support environments that discourage harmful use, enhance healthy community attitudes and skills to avoid harmful use, support and enhance the community’s capacity to address AOD problems and support initiatives that discourage inappropriate supply of alcohol and other drugs.
Key Effi iency Indicators Rationale:This indicator measures the cost per capita of AOD related initiatives that delay uptake and reduce harmful alcohol use as well as preventing illicit drug use. Key outcomes include: a community with better knowledge and skills to prevent AOD problems and reduce associated harms; prevention programs that build the resilience and protective factors targeted at children and young people; and a positive culture in Western Australia that is consistent with decreasing illicit drug use and harmful alcohol consumption. This investment applies to the population as a whole in the context of their everyday lives. The aim is to increase the proportional investment in the prevention service and gain a return in health, economic and social benefits for the Western Australian community.This indicator also seeks to address the policy question regarding how well AOD prevention services use their resources (inputs) to produce outputs, that is, whether AOD prevention programs are delivered in the most efficient manner.
Results: In 2016/17, the cost per capita for initiatives that delay the uptake and reduce the harm associated with alcohol and other drugs was $4.78. This result is substantially above the 2016/17 target of $3.57 but only slightly higher than the 2015/16 result of $4.67. The variation between the 2016/17 actual and the 2016/17 target reflects the inclusion in the cost of service of previous Commonwealth and other grant funding for Drug and Alcohol Services. This was not included in the budget target because confirmation of Commonwealth and other grant funding had not been received at the time.
OVERVIEW AGENCY PERFORMANCE SIGNIFICANT ISSUES APPENDICESDISCLOSURES AND LEGAL COMPLIANCE

Page 123 Mental Health Commission | 2016/17 Annual Report
1.2: Cost per capita of the Western Australian population 14 years and above for initiatives that delay the uptake and reduce the harm associated with alcohol and other drugs
$ co
st p
er c
apita
0
1
2
3
4
5
2016/17 Actual2016/17 Target2015/16
4.67 4.78
3.57
Data Source: The Commission’s Financial Systems. Population figures – ABS time series workbook 3101.0 Population by age and sex, Australian States and Territories, Western Australia.
Time Period: The population data is a June 2016 population estimate calculated by the ABS in December 2016, the latest estimate available. Cost data is presented by financial year.
Alcohol.Think Again campaign poster during 2016/17
OVERVIEW AGENCY PERFORMANCE SIGNIFICANT ISSUES APPENDICESDISCLOSURES AND LEGAL COMPLIANCE

Page 124 Mental Health Commission | 2016/17 Annual Report
Service one PreventionDescription:The Commission delivers public health campaigns and initiatives to reduce harmful alcohol use and prevent illicit drug use. These include the Alcohol.Think Again and Drug Aware Prevention Campaigns. Online post-campaign surveys are conducted with a cohort of individuals representing the age and/or gender of the campaign target group. The surveys collect data on campaign awareness and correct message recall. As advised by TNS Social Research, an adjustment factor of 80% is applied to the correct message recall rate. This figure is then multiplied by the WA population figures for the campaign target group, which is divided by the average cost of a campaign burst in the financial year.
Key Effi iency Indicators Rationale:This indicator monitors the cost efficiency of key social marketing programs in terms of the target population‘s awareness of the campaign and recall of main messages in post-campaign evaluation. Separate targets are set for each campaign undergoing evaluation. Costs include direct media scheduling costs, production, evaluation and other campaign associated costs. The campaigns aim to build awareness and understanding of the risks and harms associated with AOD use. This indicator provides a measure of how much it costs to reach each person aware of the campaign and who correctly understood the message(s) presented by the campaign. This provides an indication of how cost efficient the campaign was in delivering the message(s) intended by the campaign to the target population.
Results: In 2016/17 the cost per person of the “Alcohol.Think Again” health campaign target group who was aware of, and could correctly recall, the main campaign message was $0.89. This is higher than the 2016/17 target of $0.68 and slightly higher than the 2015/16 result of $0.81 due to the implementation of a refined methodology used to calculate campaign correct message takeout which was not available at the time of target development.
In 2016/17 the cost per person of the Drug Aware “Meth Can Take Control” campaign target group who was aware of, and could correctly recall, the main campaign message was $1.19, slightly lower than the 2016/17 target of $1.27. The cost per person for the methamphetamine campaign was higher than for the alcohol campaign as the target population is almost half that of the alcohol campaign and delivered in a more targeted manner than the alcohol campaign.
OVERVIEW AGENCY PERFORMANCE SIGNIFICANT ISSUES APPENDICESDISCLOSURES AND LEGAL COMPLIANCE

Page 125 Mental Health Commission | 2016/17 Annual Report
1.3: Cost per person of AOD campaign target groups who are aware of, and correctly recall, the main campaign messages
$ co
st p
er p
erso
n fo
r ta
rget
gro
ups
0.0
0.3
0.6
0.9
1.2
1.5
MethamphetamineAlcohol
2016/17 Actual2016/17 Target2015/16
0.810.89
0.68
1.191.27
OVERVIEW AGENCY PERFORMANCE SIGNIFICANT ISSUES APPENDICES
Data Source – Alcohol: The Commission’s Prevention Branch – Total cost of the campaign. TNS Global – percentage of target group who were ‘aware’ and ‘correctly’ identified campaign message. The total sample size was 402 and was weighted by gender within age and by location to approximate the Western Australian population of individuals aged 25 to 54 years. The response rate was 76%. The confidence interval is 95% and the standard error rate is 4.59%. Population figures – ABS time series workbook 3101.0 Population by age and sex, Australian States and Territories, Western Australia.
Data Source – Methamphetamine: The Commission’s Prevention Branch – Total cost of the campaign. TNS-Global – percentage of target group who were ‘aware’ and ‘correctly’ identified campaign message. The total sample size was 401 and was weighted by gender within age and by location to approximate the Western Australian population of individuals aged 14 to 29 years. The response rate was 25%. The confidence interval is 95% and the standard error rate is 4.99%. Population figures – ABS time series workbook 3101.0 Population by age and sex, Australian States and Territories, Western Australia.
Time Period: Population data is a June 2016 population estimate calculated by the ABS in December 2016, the latest estimate available. Cost data is for the financial year.
DISCLOSURES AND LEGAL COMPLIANCE
Page 126 Mental Health Commission | 2016/17 Annual Report
Service two Hospital Bed-Based ServicesDescription:Acute hospital beds provide inpatient assessment and treatment services for people experiencing severe episodes of mental illness who cannot be adequately treated in a less restrictive environment. Average length of stay is defined as the number of inpatient patient days divided by the number of separations in the reference period — data are disaggregated by inpatient target population (acute units only). Acute inpatient services include the Next Step and DAYS inpatient withdrawal units.
Key Effi iency Indicators Rationale:Average length of stay is included to present a more meaningful picture of the efficiency of each bed type. In national reports, such as the Report on Government Services, average length of stay is commonly reported together with cost per inpatient bedday to provide an overall picture of the cost of inpatient care.
The purpose of this indicator is to better understand underlying factors which cause variation in acute specialised mental health care costs. It may also demonstrate the degrees of accessibility to acute specialised mental health units. The length of stay indicates the relative volume of care provided to people in acute units and is the main driver of variation in costs. Inclusion of this indicator also provides a basis for understanding utilisation of services.
Results: In 2016/17, the average length of stay in purchased acute specialised units was 14.9 days.
This result is marginally lower than the 2016/17 target of less than 15.0 days and slightly higher than the 2015/16 result of 14.3 days.
OVERVIEW AGENCY PERFORMANCE SIGNIFICANT ISSUES APPENDICESDISCLOSURES AND LEGAL COMPLIANCE

Page 127 Mental Health Commission | 2016/17 Annual Report
2.1: Average length of stay in purchased acute specialised mental health units
Day
s
0
3
6
9
12
15
2016/17 Actual2016/17 Target2015/16
<15.014.3
14.9
Data Source: Hospital Morbidity Data Collection, Department of Health. Drug and Alcohol Youth Service (DAYS) and Next Step data extracted from the Commission’s De-identified Treatment Agency Database.
Time Period: Data is for the April 2016 to March 2017 time period to allow for a three month lag for coding and auditing purposes.
OVERVIEW AGENCY PERFORMANCE SIGNIFICANT ISSUES APPENDICES
In 2016/17, the average length of stay in purchased acute specialised units was 14.9 days
DISCLOSURES AND LEGAL COMPLIANCE

Page 128 Mental Health Commission | 2016/17 Annual Report
Service two Hospital Bed-Based ServicesDescription:As outlined in the Plan, acute hospital beds provide hospital based inpatient assessment and treatment services for people experiencing severe episodes of mental illness who cannot be adequately treated in a less restrictive environment. Cost per inpatient bedday is defined as expenditure on inpatient services divided by the number of inpatient beddays — data are disaggregated by care type (acute units). Acute inpatient services include the Next Step and DAYS inpatient withdrawal units.
Key Effi iency Indicators Rationale:A key objective of the Plan is the realignment of bed-based services to ensure that beds of the right type are in the right places, in the right quantity, and delivered at an efficient price. This efficiency indicator aligns with the key hospital based bed types identified in the Plan, and reflects key indicators identified in the Plan’s Evaluation Framework. This indicator will enable greater transparency of services in the context of the developing Activity Based Funding environment, and over time will enable monitoring of progress towards the targets and goals identified in the Plan.
In order to ensure quality care and cost effectiveness, it is important to monitor the unit cost of admitted patient care in acute specialised mental health units. Minimising the costs of providing inpatient mental health care may enable the reallocation of funds to alternative non-admitted care.
Results: In 2016/17, the average cost per bedday in acute specialised units was $1,489. This result is higher than the 2016/17 target of $1,441 and the recasted 2015/16 result of $1,434. This indicator is impacted by a number of factors, including demand for services which affects the overall volume of beddays as well as changes which occur year to year to the underlying national funding model.
OVERVIEW AGENCY PERFORMANCE SIGNIFICANT ISSUES APPENDICESDISCLOSURES AND LEGAL COMPLIANCE

Page 129 Mental Health Commission | 2016/17 Annual Report
2.2 Average cost per purchased bedday in acute specialised mental health units
$ A
vera
ge c
ost p
er b
edda
y
0
300
600
900
1,200
1,500
2016/17 Actual2016/17 Target2015/16
1,4411,489
1,434
Note: In 2016/17, a newly established mental health treatment model has been developed. This changes the service cost classification, which means the prior year figure is no longer comparable. The prior year figure has been recasted from $1,384 to $1,434.
Data Source: The Commission’s Financial Systems. BedState, Department of Health. DAYS and Next Step data extracted from the Commission’s De-identified Treatment Agency Database.
Time Period: Data is for the financial year.
In Western Australia in 2016/17 the cost per day for a mental health bed was:
$1,489in acute specialised mental health units
Compared to:
$643in step up/step down community bed-based units (see 3.3)
OVERVIEW AGENCY PERFORMANCE SIGNIFICANT ISSUES APPENDICESDISCLOSURES AND LEGAL COMPLIANCE

Page 130 Mental Health Commission | 2016/17 Annual Report
Key Effi iency Indicators
Service two Hospital Bed-Based ServicesDescription:Sub-acute hospital short stay provides hospital based treatment and support in a safe, structured environment for people with unremitting and severe symptoms of mental illness and an associated significant disturbance in behaviour which precludes their receiving treatment in a less restrictive environment. This service provides for adults, older adults and a selected number of young people with special needs. Average length of stay is defined as the number of inpatient patient days divided by the number of separations in the reference period — data are disaggregated by inpatient target population (sub-acute units only).
Rationale:Average length of stay is included to present a more meaningful picture of the efficiency of each bed type. In national reports, such as the Report on Government Services, average length of stay is commonly reported together with cost per inpatient bedday to provide an overall picture of the cost of inpatient care. The purpose of this indicator is to better understand underlying factors which cause variation in sub-acute specialised mental health care costs. It may also demonstrate the degrees of accessibility to sub-acute specialised mental health units. The length of stay indicates the relative volume of care provided to people in sub-acute units and is the main driver of variation in costs. Inclusion of this indicator also provides a basis for understanding utilisation of services.
Results: In 2016/17, the average length of stay in purchased sub-acute specialised mental health units was 105.8 days. This result is not significantly different to either the 2016/17 target or the 2015/16 result.
OVERVIEW AGENCY PERFORMANCE SIGNIFICANT ISSUES APPENDICESDISCLOSURES AND LEGAL COMPLIANCE

Page 131 Mental Health Commission | 2016/17 Annual Report
2.3: Average length of stay in purchased sub-acute specialised mental health units
Day
s
0
20
40
60
80
100
120
2016/17 Actual2016/17 Target2015/16
<103.0 105.8108.8
OVERVIEW AGENCY PERFORMANCE SIGNIFICANT ISSUES APPENDICES
Data Source: Hospital Morbidity Data Collection, Department of Health.
Time Period: Data is for the April 2016 to March 2017 time period to allow for a three month lag for coding and auditing purposes.
Sub-acute hospital short stay provides hospital based treatment and support in a safe, structured environment
DISCLOSURES AND LEGAL COMPLIANCE
Page 132 Mental Health Commission | 2016/17 Annual Report
Service two Hospital Bed-Based ServicesDescription:Sub-acute hospital short stay provides hospital based treatment and support in a safe, structured environment for people with unremitting and severe symptoms of mental illness and an associated significant disturbance in behaviour which precludes their receiving treatment in a less restrictive environment. This service provides for adults, older adults and a selected number of young people with special needs. Cost per inpatient bedday is defined as expenditure on inpatient services divided by the number of inpatient beddays — data are disaggregated by care type (sub-acute units).
Key Effi iency Indicators Rationale:A key objective of the Plan is the realignment of bed-based services to ensure that beds of the right type are in the right places, in the right quantity, and delivered at an efficient price. This efficiency indicator aligns with the key hospital based bed types identified in the Plan, and reflects key indicators identified in the Plan’s Evaluation Framework. This indicator will enable greater transparency of services in the context of the developing Activity Based Funding environment, and over time will enable monitoring of progress towards the targets and goals identified in the Plan.
In order to ensure quality care and cost effectiveness, it is important to monitor the unit cost of admitted patient care in sub-acute specialised mental health units. Minimising the costs of providing inpatient mental health care may enable the reallocation of funds to alternative non-admitted care.
Results: In 2016/17, the average cost per bedday in sub-acute specialised units was $1,419. This result is higher than the 2016/17 target of $1,383 and the 2015/16 result of $1,354. This indicator is impacted by a number of factors, including demand for services which affects the overall volume of beddays as well as changes which occur year to year to the underlying national funding model. The increased cost per bedday in 2016/17 is due to a slightly lower number of beddays and increased cost.
OVERVIEW AGENCY PERFORMANCE SIGNIFICANT ISSUES APPENDICESDISCLOSURES AND LEGAL COMPLIANCE

Page 133 Mental Health Commission | 2016/17 Annual Report
2.4: Average cost per purchased bedday in sub-acute specialised mental health units
$ A
vera
ge c
ost p
er b
edda
y
0
300
600
900
1,200
1,500
2016/17 Actual2016/17 Target2015/16
1,3831,419
1,354
Data Source: The Commission’s Financial Systems. BedState, Department of Health.
Time Period: Data is for the financial year.
In 2016/17, the average cost per bedday in sub-acute specialised units was $1,419
OVERVIEW AGENCY PERFORMANCE SIGNIFICANT ISSUES APPENDICESDISCLOSURES AND
LEGAL COMPLIANCE

Page 134 Mental Health Commission | 2016/17 Annual Report
Service two Hospital Bed-Based ServicesDescription:The mental health Hospital in the Home (HITH) program offers individuals the opportunity to receive hospital level treatment delivered in their home, where clinically appropriate. HITH is consistent with the approach of providing care in the community, closer to where individuals live. HITH is delivered by multidisciplinary teams including medical and nursing staff. People admitted into this program remain under the care of a treating hospital doctor. HITH is delivered in the community, but measured and funded via ‘beds’, and therefore falls under the hospital beds stream for funding purposes. Average length of stay is defined as the number of inpatient patient days divided by the number of separations in the reference period — data are disaggregated by inpatient target population (hospital in the home mental health units only).
Key Effi iency Indicators Rationale:Average length of stay is included to present a more meaningful picture of the efficiency of each bed type. In national reports, such as the Report on Government Services, average length of stay is commonly reported together with cost per inpatient bedday to provide an overall picture of the cost of inpatient care.
The purpose of this indicator is to better understand underlying factors which cause variation in HITH mental health care costs. It may also demonstrate the degrees of accessibility to HITH mental health units. The length of stay indicates the relative volume of care provided to people in HITH units and is the main driver of variation in costs. Inclusion of this indicator also provides a basis for understanding utilisation of services.
Results: In 2016/17, the average length of stay in purchased hospital in the home mental health units was 23.7 days. This result is slightly higher than the 2016/17 target of less than 22 days and similar to the 2015/16 result of 24.0 days.
OVERVIEW AGENCY PERFORMANCE SIGNIFICANT ISSUES APPENDICESDISCLOSURES AND LEGAL COMPLIANCE

Page 135 Mental Health Commission | 2016/17 Annual Report
2.5: Average length of stay in purchased Hospital in the Home mental health units
Day
s
0
5
10
15
20
25
2016/17 Actual2016/17 Target2015/16
24.0 23.7
<22.0
Data Source: Hospital Morbidity Data Collection, Department of Health.
Time Period: Time Period: Data is for the April 2016 to March 2017 time period to allow for a three month lag for coding and auditing purposes.
The mental health Hospital in the Home program offers individuals the opportunity to receive hospital level treatment delivered in their home, where clinically appropriate.
It is consistent with the approach of providing care in the community, closer to where individuals live.
OVERVIEW AGENCY PERFORMANCE SIGNIFICANT ISSUES APPENDICESDISCLOSURES AND LEGAL COMPLIANCE

Page 136 Mental Health Commission | 2016/17 Annual Report
Service two Hospital Bed-Based ServicesDescription:The HITH program offers individuals the opportunity to receive hospital level treatment delivered in their home, where clinically appropriate. HITH is consistent with the approach of providing care in the community, closer to where individuals live. HITH is delivered by multidisciplinary teams including medical and nursing staff. People admitted into this program remain under the care of a treating hospital doctor. HITH is delivered in the community, but measured and funded via ‘beds’, and therefore falls under the hospital beds stream for funding purposes. Cost per inpatient bedday is defined as expenditure on inpatient services divided by the number of inpatient beddays — data are disaggregated by care type (hospital in the home mental health units).
Key Effi iency Indicators Rationale:A key objective of the Plan is the realignment of bed-based services to ensure that beds of the right type are in the right places, in the right quantity, and delivered at an efficient price. This efficiency indicator aligns with the key hospital based bed types identified in the Plan, and reflects key indicators identified in the Plan’s Evaluation Framework. This indicator will enable greater transparency of services in the context of the developing Activity Based Funding environment, and over time will enable monitoring of progress towards the targets and goals identified in the Plan.
In order to ensure quality care and cost effectiveness, it is important to monitor the unit cost of admitted patient care in HITH specialised mental health units. Minimising the costs of providing inpatient mental health care may enable the reallocation of funds to alternative non-admitted care.
Results: In 2016/17, the average cost per bedday in Hospital in the Home mental health units was $1,352. This result is lower than the 2016/17 target of $1,393. The 2016/17 result was higher than the recasted 2015/16 result of $1,177. This indicator is impacted by a number of factors, including demand for services which affects the overall volume of beddays as well as changes which occur year to year to the underlying national funding model. The increased cost per bedday in 2016/17 compared to 2015/16 is due to a an increased allocation of funding to HITH beds. Accordingly, bedday activity increased 5% from 2015/16.
OVERVIEW AGENCY PERFORMANCE SIGNIFICANT ISSUES APPENDICESDISCLOSURES AND LEGAL COMPLIANCE

Page 137 Mental Health Commission | 2016/17 Annual Report
2.6: Average cost per purchased bedday in Hospital in the Home mental health units
$ A
vera
ge c
ost p
er b
edda
y
0
300
600
900
1,200
1,500
2016/17 Actual2016/17 Target2015/16
1,177
1,3521,393
OVERVIEW AGENCY PERFORMANCE SIGNIFICANT ISSUES APPENDICES
Note: In 2016/17, a newly established mental health treatment model has been developed. This changes the service cost classification, which means the prior year figure is no longer comparable. The prior year figure has been recasted from $2,170 to $1,177.
Data Source: The Commission’s Financial Systems. BedState, Department of Health.
Time Period: Data is for the financial year.
City West older Adult Mental Health Service Hospital in the Home
DISCLOSURES AND LEGAL COMPLIANCE
Page 138 Mental Health Commission | 2016/17 Annual Report
Service two Hospital Bed-Based ServicesDescription:Forensic mental health acute inpatient beds are authorised to provide secure mental health care for patients within the criminal justice system on special orders. These beds include both acute and sub-acute beds. These beds provide specialist multidisciplinary forensic mental health care including close observation, assessment, evidence-based treatments, court reports and physical health care. Forensic sub-acute beds are for those people who may have been in an acute forensic inpatient bed and are awaiting discharge for treatment under the Mental Health Act into the community or to prison. People in this service are likely to be there due to a special order. Average length of stay is defined as the number of inpatient patient days divided by the number of separations in the reference period — data are disaggregated by inpatient target population (forensic mental health units only).
Key Effi iency Indicators Rationale:Average length of stay is included to present a more meaningful picture of the efficiency of each bed type. In national reports, such as the Report on Government Services, average length of stay is commonly reported together with cost per inpatient bedday to provide an overall picture of the cost of inpatient care. The purpose of this indicator is to better understand underlying factors which cause variation in forensic mental health care costs. It may also demonstrate the degrees of accessibility to forensic mental health units. The length of stay indicates the relative volume of care provided to people in forensic units and is the main driver of variation in costs. Inclusion of this indicator also provides a basis for understanding utilisation of services.
Results: In 2016/17, the average length of stay in purchased forensic mental health units was 34.3 days. This result is substantially lower than the 2016/17 target of less than 50 days and the 2015/16 result of 45.4 days. This is likely due to high demand for limited capacity, in part leading to shorter lengths of stay to accomodate a larger number of people.
OVERVIEW AGENCY PERFORMANCE SIGNIFICANT ISSUES APPENDICESDISCLOSURES AND LEGAL COMPLIANCE

Page 139 Mental Health Commission | 2016/17 Annual Report
2.7: Average length of stay in purchased forensic mental health units
Day
s
0
10
20
30
40
50
2016/17 Actual2016/17 Target2015/16
45.4
34.3
<50.0
OVERVIEW AGENCY PERFORMANCE SIGNIFICANT ISSUES APPENDICES
Data Source: Hospital Morbidity Data Collection, Department of Health.
Time Period: Data is for the April 2016 to March 2017 time period to allow for a three month lag for coding and auditing purposes.
Compared to the general community, the prevalence of mental health issues is higher at every stage of the criminal justice process.
Forensic inpatient services provide specialist multidisciplinary mental health care to patients within the criminal justice system
DISCLOSURES AND LEGAL COMPLIANCE

Page 140 Mental Health Commission | 2016/17 Annual Report
Key Effi iency Indicators
Service two Hospital Bed-Based ServicesDescription:Forensic beds include both acute and sub-acute beds. Forensic mental health acute inpatient beds are authorised to provide secure mental health care for patients within the criminal justice system on special orders. These beds provide specialist multidisciplinary forensic mental health care including close observation, assessment, evidence-based treatments, court reports and physical health care. Forensic sub-acute beds are for those people who may have been in an acute forensic inpatient bed and are awaiting discharge back into the community or back to prison. People in this service are likely to be there due to a special order. Cost per inpatient bedday is defined as expenditure on inpatient services divided by the number of inpatient beddays — data are disaggregated by care type (hospital in forensic mental health units).
Rationale:A key objective of the Plan is the realignment of bed-based services to ensure that beds of the right type are in the right places, in the right quantity, and delivered at an efficient price. This efficiency indicator aligns with the key hospital based bed types identified in the Plan, and reflects key indicators identified in the Plan’s Evaluation Framework. This indicator will enable greater transparency of services in the context of the developing Activity Based Funding environment, and over time will enable monitoring of progress towards the targets and goals identified in the Plan. In order to ensure quality care and cost effectiveness, it is important to monitor the unit cost of admitted patient care in forensic specialised mental health units. Minimising the costs of providing inpatient mental health care may enable the reallocation of funds to alternative non-admitted care.
Results: In 2016/17, the average cost per bedday in forensic units was $1,338. This result is marginally higher than the 2016/17 target of $1,310 and the 2015/16 result of $1,301.
OVERVIEW AGENCY PERFORMANCE SIGNIFICANT ISSUES APPENDICESDISCLOSURES AND LEGAL COMPLIANCE

Page 141 Mental Health Commission | 2016/17 Annual Report
2.8: Average cost per purchased bedday in forensic mental health units
$ A
vera
ge c
ost p
er b
edda
y
0
300
600
900
1,200
1,500
2016/17 Actual2016/17 Target2015/16
1,310 1,3381,301
OVERVIEW AGENCY PERFORMANCE SIGNIFICANT ISSUES APPENDICES
Data Source: The Commission’s Financial Systems. BedState, Department of Health.
Time Period: Data is for the financial year.
Community linked services
General community
Pre-arrest
Prison &detention
Court
ArrestForensichospital
Forensiccommunity
service
Prevention &promotion
Early intervention
Assessment
Treatment &Referral
Extendedcare
Recovery
Range of forensic settings in Western Australia
DISCLOSURES AND LEGAL COMPLIANCE

Page 142 Mental Health Commission | 2016/17 Annual Report
Service three Community Bed-Based ServicesDescription:Non-government organisations provide accommodation in residential units for people affected by mental illness who require support to live in the community. Non-acute (24 hours support) residential care facilities provide support with self-management of personal care and daily living activities as well as initiate appropriate treatment and rehabilitation to improve the quality of life. This care is intended to be short to medium term (up to twelve months) in duration. This accommodation support is available to people with a mental illness, including older persons with complex mental health issues and significant behavioural problems. They are unable to live independently in the community without support and care.
Key Effi iency Indicators
OVERVIEW AGENCY PERFORMANCE SIGNIFICANT ISSUES APPENDICES
Rationale:This indicator enables assessment of the efficiency of non-acute (24 hours support) community bed-based services both over time and relative to other services.
Results: In 2016/17, the average cost per purchased bedday in non-acute (24 hours support) community bed-based services was $239, in line with the 2016/17 target of $240 and the 2015/16 result.
DISCLOSURES AND LEGAL COMPLIANCE

Page 143 Mental Health Commission | 2016/17 Annual Report
3.1: Average cost per purchased bedday in non-acute (24 hours support) community bed-based services
$ A
vera
ge c
ost p
er b
edda
y
0
50
100
150
200
250
2016/17 Actual2016/17 Target2015/16
242 240 239
OVERVIEW AGENCY PERFORMANCE SIGNIFICANT ISSUES APPENDICES
Data Source: The Commission’s Financial Systems. The Commission’s Non-government Organisation Establishment State Data Collection. Activity data for 6 months extrapolated to 12 months.
Time Period: Data is for the financial year.
St Bartholomew’s House Inc, Bentley Villas, Community Supported Residential Units (CSRU’s).
DISCLOSURES AND LEGAL COMPLIANCE

Page 144 Mental Health Commission | 2016/17 Annual Report
Service three Community Bed-Based ServicesDescription:Non-government organisations provide accommodation in residential units for people affected by mental illness who require long term support to live in the community. Services are specifically designed for older adults who have severe and persistent symptoms of mental illness, and who have support and care needs above those provided for in mainstream aged care settings. The services provide assessment, ongoing treatment, rehabilitation and residential support for consumers. Community long-stay services provide a more home-like environment compared to hospital services and can reduce the inappropriate use of hospital-based older adult services.
Key Effi iency Indicators Rationale:This indicator enables assessment of the efficiency of non-acute (Hospital/Nursing Home) community bed-based services both over time and relative to other services.
Results: In 2016/17, the average cost per purchased bedday in non-acute (Hospital/Nursing Home) community bed-based services was $213. This is lower than the 2016/17 target of $230 and only slightly higher than the 2015/16 result of $208.
OVERVIEW AGENCY PERFORMANCE SIGNIFICANT ISSUES APPENDICESDISCLOSURES AND LEGAL COMPLIANCE

Page 145 Mental Health Commission | 2016/17 Annual Report
3.2: Average cost per purchased bedday in non-acute (hospital/nursing home) community bed-based units
$ A
vera
ge c
ost p
er b
edda
y
0
50
100
150
200
250
2016/17 Actual2016/17 Target2015/16
208 213
230
OVERVIEW AGENCY PERFORMANCE SIGNIFICANT ISSUES APPENDICES
Data Source: The Commission’s Financial Systems. The Commission’s Non-government Organisation Establishment State Data Collection. Activity data for 6 months extrapolated to 12 months.
Time Period: Data is for the financial year.
With our growing ageing population, the provision of appropriate services for older adults across the service spectrum is essential
DISCLOSURES AND LEGAL COMPLIANCE

Page 146 Mental Health Commission | 2016/17 Annual Report
Service three Community Bed-Based ServicesDescription:The Mental Health step-up/step-down service is a new initiative in Western Australia that provides short term mental health care, in a residential setting, that promotes recovery and reduces the disability associated with mental illness. These are comprehensive services designed to deliver support to individuals that is aimed at improving symptoms, encouraging the use of functional abilities and assists in facilitating a return to the usual environment. This is achieved within a framework of recovery and rehabilitation, and is delivered predominantly through non-clinical activities.
Key Effi iency Indicators Rationale:This indicator enables assessment of the efficiency of step up/step down community bed-based services both over time and relative to other services.
Results: In 2016/17, the average cost per purchased bedday in step-up/step-down community bed-based units was $643. This is slightly higher than the 2016/17 target of $628. Fluctuation in the average cost per purchased bedday across years may be attributable to variability in the number of occupied beddays. The increase in 2016/17 is due to service development costs associated with the setting up of additional step up/step down bed capacity in Rockingham.
OVERVIEW AGENCY PERFORMANCE SIGNIFICANT ISSUES APPENDICESDISCLOSURES AND LEGAL COMPLIANCE

Page 147 Mental Health Commission | 2016/17 Annual Report
3.3: Average cost per purchased bedday in step up/step down community bed-based units
$ A
vera
ge c
ost p
er b
edda
y
0
100
200
300
400
500
600
700
800
2016/17 Actual2016/17 Target2015/162014/152013/14
628 643595594
796
Data Source: The Commission’s Financial Systems. The Commission’s Non-government Organisation Establishment State Data Collection. Activity data for 6 months extrapolated to 12 months.
Time Period: Data is for the financial year.
22WESTERN AUSTRALIA’S FIRST STEP UP/STEP DOWN SERVICE IS IN JOONDALUP WITH 22 BEDS.
31289
223 WERE ‘STEPPING UP’ FROM THE COMMUNITY.22398-99% OF PEOPLEADMITTED WERESUCCESSFULLYTRANSITIONED BACKINTO THE COMMUNITYWITHOUT REQUIRINGHOSPITAL ADMISSIONOR RE-ADMISSION.
IN 2016/17 A SECOND STEP UP/STEP DOWN SERVICE OPENED IN ROCKINGHAM.
OVERVIEW AGENCY PERFORMANCE SIGNIFICANT ISSUES APPENDICES
98-99%
in 2016/17
THERE WERE 312 ADMISSIONS IN 2016/17.
OF THESE, 89 WERE ‘STEPPING DOWN’ FROM A STAY IN HOSPITAL.
DISCLOSURES AND LEGAL COMPLIANCE

Page 148 Mental Health Commission | 2016/17 Annual Report
Service three Community Bed-Based ServicesDescription:AOD Community bed-based services include residential rehabilitation and low medical withdrawal services which provide 24 hour, seven days per week recovery orientated treatment in a residential setting. Bed-based low medical withdrawal provides a supportive care model, based on non-medical or low medical interventions with support provided by a visiting doctor or nurse specialist. These programs are most appropriate when the withdrawal symptoms are likely to be low to moderate and there is a lack of social support or an unstable home environment. Residential rehabilitation provides clients (following withdrawal) a structured program of medium to longer-term duration that may include counselling, behavioural treatment approaches, recreational activities, social and community living skills and group work.
Key Effi iency Indicators Rationale:This indicator enables assessment of the efficiency of residential rehabilitation services both over time and relative to other services.
Results: In 2016/17, the average cost per completed treatment episode in AOD residential rehabilitation services was $10,140. This result is higher than the 2016/17 target of $9,291 and the 2015/16 result of $9,652. The increase in 2016/17 is due to service development costs associated with the setting up of substantial additional residential rehabilitation bed capacity.
OVERVIEW AGENCY PERFORMANCE SIGNIFICANT ISSUES APPENDICESDISCLOSURES AND LEGAL COMPLIANCE

Page 149 Mental Health Commission | 2016/17 Annual Report
3.4: Cost per completed treatment episode in AOD residential rehabilitation services
$ A
vera
ge c
ost p
er b
edda
y
0
2,000
4,000
6,000
8,000
10,000
12,000
2016/17 Actual2016/17 Target2015/16
9,29110,140
9,652
Agency Database.
Time Period: Treatment episode data is for the April 2016 to March 2017 time period to allow for a three month lag for coding and auditing purposes. Cost data is presented by financial year.
Data Source: The Commission’s Financial Systems and De-identified Treatment
Rick Hammersley Therapeutic Community run by Cyrenian House
OVERVIEW AGENCY PERFORMANCE SIGNIFICANT ISSUES APPENDICESDISCLOSURES AND LEGAL COMPLIANCE

Page 150 Mental Health Commission | 2016/17 Annual Report
Key Effi iency Indicators
Service four Community TreatmentDescription:An ambulatory mental health care service is a specialised mental health organisation that provides services to people who are not currently admitted to a mental health inpatient or residential service. Services are delivered by health professionals with specialist mental health qualifications or training. Community treatment service types include counselling face to face. This indicator is the total expenditure on mental health ambulatory care services divided by the total number of community treatment days provided by mental health ambulatory care services, where a treatment day is defined as any day on which one or more community contacts are recorded for a consumer during their episode of care.
Rationale:This indicator enables assessment of the efficiency of public clinical ambulatory mental health services both over time and relative to other services.
Results: In 2016/17, the average cost per purchased treatment day of ambulatory care provided by public clinical mental health services was $470. This is slightly lower than both the 2016/17 target of $491 and the 2015/16 result of $482.
OVERVIEW AGENCY PERFORMANCE SIGNIFICANT ISSUES APPENDICESDISCLOSURES AND LEGAL COMPLIANCE
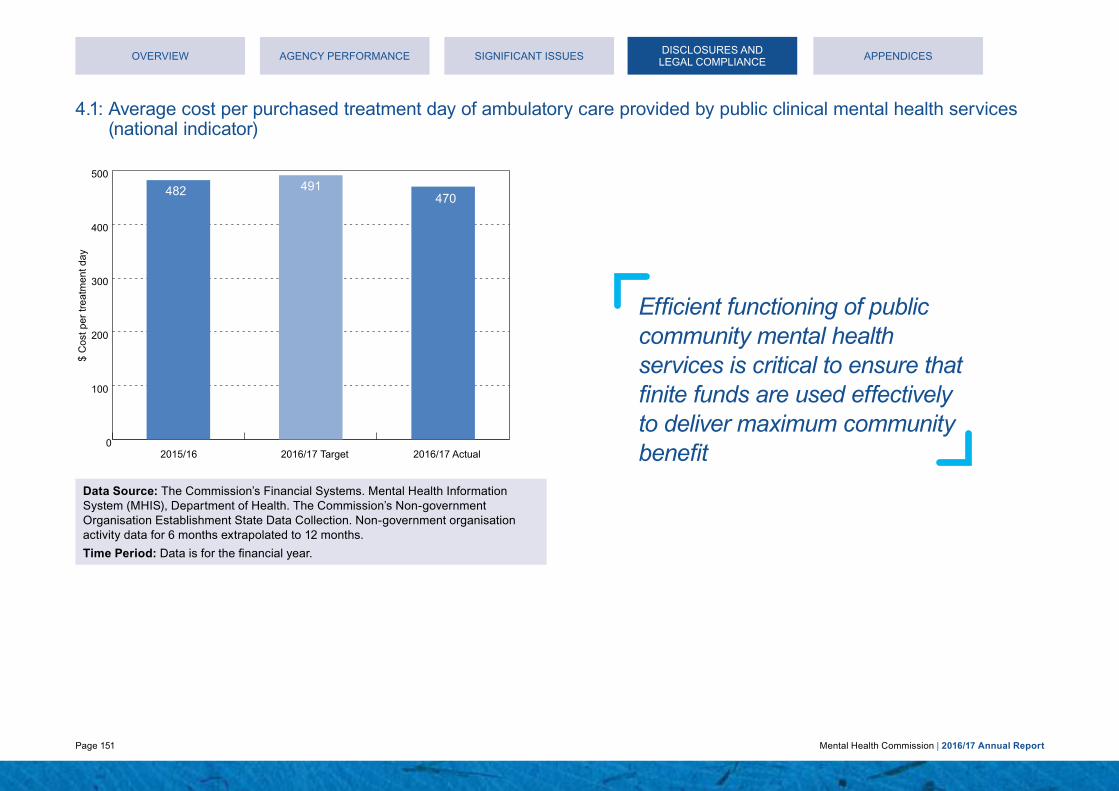
Page 151 Mental Health Commission | 2016/17 Annual Report
4.1: Average cost per purchased treatment day of ambulatory care provided by public clinical mental health services (national indicator)
$ C
ost p
er tr
eatm
ent d
ay
0
100
200
300
400
500
2016/17 Actual2016/17 Target2015/16
491470
482
OVERVIEW AGENCY PERFORMANCE SIGNIFICANT ISSUES APPENDICES
Data Source: The Commission’s Financial Systems. Mental Health Information System (MHIS), Department of Health. The Commission’s Non-government Organisation Establishment State Data Collection. Non-government organisation activity data for 6 months extrapolated to 12 months.
Time Period: Data is for the financial year.
Efficient functioning of public community mental health services is critical to ensure that finite funds are used effectively to deliver maximum community benefit
DISCLOSURES AND LEGAL COMPLIANCE

Page 152 Mental Health Commission | 2016/17 Annual Report
Service four Community TreatmentDescription:An ambulatory mental health care service is a specialised mental health organisation that provides services to people who are not currently admitted to a mental health inpatient or residential service. Services are delivered by health professionals with specialist mental health qualifications or training. This indicator is the number of community treatment days provided by ambulatory mental health services divided by the number of ambulatory care statistical episodes (three month periods) treated by ambulatory mental health services.
Key Effi iency Indicators Rationale:The purpose of this indicator is to better understand underlying factors which cause variation in community care costs. It may also demonstrate the accessibility to public sector community mental health services. The number of treatment days is the community treatment equivalent to length of stay and it indicates the relative volume of care provided. Frequency of servicing is the main driver of variation in community care costs and may reflect differences between health service organisation practices. This indicator provides an understanding of the extent or duration of community care treatment.
Results: In 2016/17, the average treatment days per episode of ambulatory care provided by public clinical mental health services was 4.87 days. This result is in line with both the 2016/17 target and the 2015/16 result.
OVERVIEW AGENCY PERFORMANCE SIGNIFICANT ISSUES APPENDICESDISCLOSURES AND LEGAL COMPLIANCE

Page 153 Mental Health Commission | 2016/17 Annual Report
4.2: Average treatment days per episode of ambulatory care provided by public clinical mental health services (national indicator)
Day
s
0
1
2
3
4
5
2016/17 Actual2016/17 Target2015/16
4.874.92 <5.00
OVERVIEW AGENCY PERFORMANCE SIGNIFICANT ISSUES APPENDICES
Data Source: Mental Health Information System (MHIS), Department of Health.
Time Period: Data is for the financial year.
An ambulatory mental health care service is a specialised mental health organisation that provides services to people who are not currently admitted to a mental health inpatient or residential service
DISCLOSURES AND LEGAL COMPLIANCE

Page 154 Mental Health Commission | 2016/17 Annual Report
Service four Community TreatmentDescription:The Commission supports a comprehensive range of outpatient counselling, pharmacotherapy and support and case management services, including specialist youth, women’s and family services, which are provided primarily by non-government agencies. The Western Australian Diversion Program aims to reduce crime by diverting offenders with drug use problems away from the criminal justice system and into treatment to break the cycle of offending and address their drug use. The Alcohol and Drug Support Service (ADSS) is a 24-hour, Statewide, confidential telephone service providing information, advice, counselling and referral to anyone concerned about their own or another person’s AOD use. Callers have the option of talking to a professional counsellor, a volunteer parent or both. This indicator is the cost for these community-based services divided by the number of treatment episodes provided and the number of ADSS contacts answered with an outcome of counselling (excluding tobacco-related contacts). A treatment episode is the period of care between the start and end of treament, whereas for ADSS this refers to a single contact (e.g. a phone call).
Key Effi iency Indicators Rationale:This indicator enables assessment of the efficiency of community-based AOD services both over time and relative to other services.
Results: In 2016/17, the average cost of a completed treatment episode in community-based AOD services was $1,680. This is in line with both the 2016/17 target and the 2015/16 result.
OVERVIEW AGENCY PERFORMANCE SIGNIFICANT ISSUES APPENDICESDISCLOSURES AND LEGAL COMPLIANCE

Page 155 Mental Health Commission | 2016/17 Annual Report
4.3: Cost per completed treatment episode in community-based AOD services
$ C
ost p
er c
lose
d tr
eatm
ent e
piso
de
0
500
1,000
1,500
2,000
2016/17 Actual2016/17 Target2015/16
1,671 1,6801,705
OVERVIEW AGENCY PERFORMANCE SIGNIFICANT ISSUES APPENDICES
Data Source: The Commission’s Financial Systems and the De-identified Treatment Agency Database and Alcohol Drug and Information Service Database.
Time Period: Treatment episode data is for the April 2016 to March 2017 time period to allow for a three month lag for coding and auditing purposes. Cost data is presented by financial year.
In 2016/17, the average cost of a completed treatment episode in community-based AOD services was $1,680
DISCLOSURES AND LEGAL COMPLIANCE

Page 156 Mental Health Commission | 2016/17 Annual Report
Service fi e Community SupportDescription:Community-based support programs support people with mental health problems to develop/maintain skills required for daily living, improve personal and social interaction, and increase participation in community life and activities. They also aim to decrease the burden of care for carers. These services primarily are provided in the person’s home or in the local community. The range of services provided is determined by the needs and goals of the individual.
This indicator is the total expenditure on mental health community support services divided by the total number of direct contact hours of community support.
Key Effi iency Indicators Rationale:This indicator enables assessment of the efficiency of community support provided to people with mental health problems both over time and relative to other services.
Results: In 2016/17, the average cost per hour of community support provided to people with mental health problems was $144. This result is higher than the 2016/17 target of $130 and the previous years’ results. This is due to refinements in data capture and validation processes. Delays in staff recruitment and higher than normal staff turnover in some non-government community support service providers, which has caused increased cost of services.
OVERVIEW AGENCY PERFORMANCE SIGNIFICANT ISSUES APPENDICESDISCLOSURES AND LEGAL COMPLIANCE

Page 157 Mental Health Commission | 2016/17 Annual Report
5.1: Average cost per hour for community support provided to people with mental health problems
$ C
ost p
er h
our
0
30
60
90
120
150
2016/17 Actual2016/17 Target2015/162014/152013/14
130
144
131130
116
Data Source: The Commission’s Financial Systems and the Non-government Organisation Establishment State Data Collection. Activity data for 6 months extrapolated to 12 months.
Time Period: Data is for the financial year.
South Metropolitan Community Alcohol and Drug Support Service
OVERVIEW AGENCY PERFORMANCE SIGNIFICANT ISSUES APPENDICESDISCLOSURES AND LEGAL COMPLIANCE

Page 158 Mental Health Commission | 2016/17 Annual Report
Service fi e Community SupportDescription:The Transitional Housing and Support Program (THASP) provide in-reach community support for people staying in short-term accommodation following residential AOD treatment. There are currently 12 THASP houses operational across Western Australia. A 2013 evaluation of the program has demonstrated a range of positive outcomes including reductions in relapse rates, improvements in wellbeing, increased life and independent living skills and reduced levels of homelessness. This indicator is calculated by dividing the overall cost of THASP services by the number of closed treatment episodes. A treatment episode is the period of care between the start and end of treament.
Key Effi iency Indicators Rationale:This indicator enables assessment of the efficiency of THASP both over time and relative to other services.
Results: In 2016/17, the average cost per completed episode of community support provided for AOD services was $8,672, lower than the 2016/17 target of $9,277 and substantially lower than the 2015/16 result. This is due to a 44% increase in the number of closed treatment episodes in 2016/17 (59) as compared to 2015/16 (41). The difference in the number of closed treatment episodes between the 2016/17 actual (59) and 2016/17 target (55) was much less pronounced. Due to the long term nature of this service, there is a small volume of cases which can result in high variability in cost over the reporting periods.
OVERVIEW AGENCY PERFORMANCE SIGNIFICANT ISSUES APPENDICESDISCLOSURES AND LEGAL COMPLIANCE

Page 159 Mental Health Commission | 2016/17 Annual Report
5.2: Average cost per episode of community support provided for AOD services
$ C
ost p
er c
lose
d tr
eatm
ent e
piso
de
0
3,000
6,000
9,000
12,000
15,000
2016/17 Actual2016/17 Target2015/16
12,341
8,6729,277
OVERVIEW AGENCY PERFORMANCE SIGNIFICANT ISSUES APPENDICES
Data Source: The Commission’s Financial Systems and the De-identified Treatment Agency Database.
Time Period: Treatment episode data is for the April 2016 to March 2017 time period to allow for a three month lag for coding and auditing purposes. Cost data is presented by financial year.
Cyrenian House offers a transitional housing program to assist people who have completed a rehabilitation program to re-enter the community
DISCLOSURES AND LEGAL COMPLIANCE

Page 160 Mental Health Commission | 2016/17 Annual Report
Service fi e Community SupportDescription:The ICLS provides coordinated clinical and psychosocial support to assist individuals to achieve their recovery goals and live well in the community. ICLS supports people to live in their own home in the community with the principles of choice, personalised planning, self-direction and portability of funding. A significant emphasis is placed on planning processes that will focus on the development and achievement of each person’s individual recovery goals. Prior to any service commencing, individual plans are completed by the service provider in conjunction with the individual and any other related parties and submitted to the Commission for review. Individuals accessing ICLS can expect to: have an increasing ability to fully participate in their ongoing clinical and psychosocial support needs; develop and sustain meaningful social connections and relationships; participate and contribute to their community and relationships in personally meaningful ways; have an increasing ability to participate in educational, vocational and/or employment activities; develop their skills to self-manage their lifestyle and well-being; demonstrate an increasing ability to maintain and sustain their housing tenancy; and improve their quality of life. The target group includes individuals that have a range of complexities and challenges and there is a mix of individuals requiring low, medium, high and very high levels of support. Individuals have a severe mental illness and can only access the service by being nominated by a public mental health service Case Manager or Psychiatrist.
Key Effi iency Indicators Rationale:This indicator represents the average total funding available per package. Actual funding is allocated based on identified need reflected in the individuals plan. This varies from year to year based on the specific needs of the individuals. The program is distinct from funding provided for other community mental health support services.
Results: The 2016-17 cost of $42,150 was significantly lower than the 2016/17 target of $71,325 and previous years’ results. In part, this is because support packages are allocated and commence at staggered times throughout the financial year and therefore include part payments that are not reflective of the full year costs for an individual. There are also lead times for the development of support packages for new entrants when backfilling client vacancies. In addition, the purpose of the ICLS is to provide coordinated clinical and psychosocial supports to assist eligible individual’s to achieve their recovery goals and live well in the community. Therefore it is expected that the average cost per package would decline due to the individuals level of need for recovery focused supports also decreasing. Although there is the expectation that the average cost per package will decrease, it is hard to predict or estimate by how much due to the nature of the ICLS program being based on individualised support needs. The decline in funding is a positive outcome of the ICLS program and demonstrates program success by supporting individuals to maximise their recovery and maintain independent living in the community.
OVERVIEW AGENCY PERFORMANCE SIGNIFICANT ISSUES APPENDICESDISCLOSURES AND LEGAL COMPLIANCE

Page 161 Mental Health Commission | 2016/17 Annual Report
5.3: Average cost per package of care provided for the Individualised Community Living Strategy
$ C
ost p
er p
acka
ge
0
10,000
20,000
30,000
40,000
50,000
60,000
70,000
80,000
2016/17 Actual2016/17 Target2015/162014/152013/14
71,325
42,150
62,41365,430
50,394
Data Source: The Commission’s Financial Systems and Individualised Community Living Strategy (ICLS) service providers report the number of packages delivered to the Commission.
Time Period: Data is for the financial year.
OVERVIEW AGENCY PERFORMANCE SIGNIFICANT ISSUES APPENDICES
ICLS supports people to live in their own home in the community with the principles of choice, personalised planning, self-direction and portability of funding.
DISCLOSURES AND LEGAL COMPLIANCE

Page 162 Mental Health Commission | 2016/17 Annual Report
Service fi e Community SupportDescription:Safe places for intoxicated individuals or sobering up centres, provide residential care overnight for intoxicated individuals. There are ten sobering up centres in Western Australia providing a safe, care-oriented environment in which people found intoxicated in public may sober up. Sobering up centres help to reduce the harm associated with intoxication for the individual, their families and the broader community, and play a key role in the response to family and domestic violence. People may refer themselves to a centre or be brought in by the police, a local patrol, health/welfare agencies, or other means. Attendance at a centre is voluntary. A person being cared for in a sobering up centre can expect: a safe environment; a shower, clean bed, clean clothes, and a simple nutritious meal; non-discriminatory and non-judgemental care; and referral to other agencies and services if required. This indicator is calculated by dividing the overall cost of Sobering up centres by the number of episodes delivered. An episode is defined as an admission to a sobering up centre which may be for a few hours or overnight.
Key Effi iency Indicators Rationale:This indicator seeks to address the policy question regarding how well the Sobering-up Centre services use their resources (inputs) to produce outputs, that is, whether the sobering up service is delivered in the most efficient manner. This indicator provides greater transparency of funded services and enables monitoring of progress towards the targets and goals identified in the Plan.
Results: In 2016/17, the average cost per episode of care in safe places for intoxicated people was $342, slightly lower than both the 2016/17 target and the 2015/16 result.
OVERVIEW AGENCY PERFORMANCE SIGNIFICANT ISSUES APPENDICESDISCLOSURES AND LEGAL COMPLIANCE

Page 163 Mental Health Commission | 2016/17 Annual Report
5.4: Cost per episode of care in safe places for intoxicated people
$ C
ost p
er e
piso
de
0
50
100
150
200
250
300
350
400
2016/17 Actual2016/17 Target2015/16
361342
366
Data Source: The Commission’s Finance Systems and the Sobering Up Centre database.
Time Period: Sobering up episode data is for the April 2016 to March 2017 time period to allow for a three month lag for coding and auditing purposes. Cost data is presented by financial year.
There are ten sobering up centres in Western Australia providing a safe, care-oriented environment in which people found intoxicated in public may sober up.
Sobering up centres help to reduce the harm associated with intoxication for the individual, their families and the broader community
OVERVIEW AGENCY PERFORMANCE SIGNIFICANT ISSUES APPENDICESDISCLOSURES AND LEGAL COMPLIANCE

Page 164 Mental Health Commission | 2016/17 Annual Report
Other Legal And Government Policy Requirements And Financial DisclosuresMinisterial directivesTreasurer’s Instruction 903 (12) requires the Commission to disclose information on any Ministerial directives relevant to the setting of desired outcomes or operational objectives, the achievement of desired outcomes or operational objectives, investment activities and financial activities. No such directives were issued by the Minister with portfolio responsibility for the Commission during 2016/17.
Compliance with Public Sector Standards and ethical codesIn accordance with section 31(1) of the Public Sector Management Act 1994, the Commission fully complied with the public sector standards, the Western Australian Code of Ethics and the Mental Health Commission Code of Conduct.
The Commission’s Code of Conduct (the Code) and organisational values were reviewed during the year. The Code interprets the Commission’s organisational values into behaviours, which focus on working relationships, to ensure there is respect and that diversity is valued in the workplace. It outlines clear expectations on fair, ethical and accountable decisions. In 2016/17, 64% of employees attended the ‘Behaviour Matters’ training on the new Values, this established a common understanding of the standards of behaviours expected by all Commission employees.
In 2016/17, the Commission continued to promote compliance with public sector standards and ethical codes. The introduction of a new online learning management system in April 2017, ELMO, improved the Commission’s ability to promote, record and track employee completion of its Accountable and Ethical Decision Making course. Since rolling out ELMO, 91% of employees have completed the course.
Personal expenditureIn accordance with section 903(13)(iv) of the Treasurer’s Instructions, the following personal expenditure was incurred on a Western Australian Government Purchasing Card during the reporting period:
Number of instances the Purchasing Card has been used for Personal Use
1
Aggregate amount $149.40
Aggregate amount settled by due date $149.40
Aggregate amount settled after due date –
Aggregate amount outstanding –
Number of referrals for disciplinary action –
Board and committee remuneration reportingA number of advisory committees were established by the Commission outside of the Cabinet process as they were required to support specific projects such as the development of the Exposure Draft Compulsory Treatment (Alcohol and Other Drugs) Bill 2016, Accommodation Advisory Committee and the Engagement Framework Steering Committee. Some of these members were remunerated in accordance with the Commission’s Consumer, Family, Carer and Community Paid Partnership Policy.
Contracts with senior officersAt the date of reporting, other than normal contracts of employment of service, no senior officers or entities in which senior officers have any substantial interests had any interests in existing or proposed contracts with the Commission.
OVERVIEW AGENCY PERFORMANCE SIGNIFICANT ISSUES APPENDICESDISCLOSURES AND LEGAL COMPLIANCE

Page 165 Mental Health Commission | 2016/17 Annual Report
As per Related Party Disclosures (AASP124), conflicts of interest have been identified in relation to the Mental Health Commissioner. The Commissioner is:• the Deputy Chair of the beyondblue Board of Directors.
A not-for-profit organisation, beyondblue focuses on raising awarenessand understanding of anxiety and depression in Australia, andcurrently receives $342,000 per annum funding from the Commission.This funding, which commenced in 2000, predates the establishmentof the Commission and has remained at approximately this level since2005. The Commission’s current contract with beyondblue is for fiveyears and was approved by the Director, Non-Government OrganisationPurchasing and Development in 2015. The Commissioner takes annualleave to attend beyondblue meetings and is excluded from anycontractual matters and decisions between the Commission andbeyondblue.
These conflicts continue to be managed by delegating all decision-making regarding Commission funding and contract management to the Director, Non-Government Organisations Purchasing and Development.
Compliance with Electoral Act advertisingIn accordance with section 175ZE of the Electoral Act 1907, the Commission incurred the following expenditure on advertising agencies, market research, polling, direct mail and media advertising during the reporting period:
EXPENDITURE CLASS
NAME OF AGENCYAMOUNT 2016/17
TOTAL
Advertising agencies:
Carat Australia Media Services Pty Ltd
The Brand Agency
Seek Limited
Adcorp
Timeline Productions
$6,372.19
$11,618.00
$540.00
$5,490.52
$9,050.00
$33,090.71
Market research organisations:
La Trobe University
Miles Morgan Australia
Taylor Nelson Sofres
$71,050.00
$46,244.32
$240,800.00
$358,094.32
Polling organisations:
Nil Nil Nil
Direct mail organisations:
Nil Nil Nil
Media advertising organisations:
The Brand Agency via Curtin University*
Alucinor
$2,876,052.00
$56,600.00
$1,544.57
$2,934,196.59
$3,325,361.60 $3,325,361.60
* The prevention campaigns are managed by Curtin University under aPartnership Service Agreement with the Mental Health Commission
OVERVIEW AGENCY PERFORMANCE SIGNIFICANT ISSUES APPENDICESDISCLOSURES AND LEGAL COMPLIANCE

Page 166 Mental Health Commission | 2016/17 Annual Report
Disability Access and Inclusion PlanIn early 2017, the Commission launched its new Disability Access and Inclusion Plan (DAIP) for 2017–2021. The new DAIP builds on the achievements and experiences from the previous plan and demonstrates the Commission’s commitment to proactively removing any barriers that may exclude people from accessing information, services, facilities, events and employment opportunities with the Commission. The DAIP is available on the Commission’s website.
Reconciliation Action PlanIn March 2017, the Commission formed the Reconciliation Committee as a Corporate Executive subcommittee, chaired by the Commissioner.
The Committee is responsible for ensuring the Commission is achieving its vision for reconciliation, improving organisational awareness of the needs of Aboriginal people and progressing actions that will create opportunities to build relationships and grow respect for and with Aboriginal people.
To achieve this, the Committee oversees the implementation of the 2015-2017 Reconciliation Action Plan (RAP) and the development of a new RAP for 2017-2019.
Commission employees took part in cultural tours as part of Reconciliation Week 2017
OVERVIEW AGENCY PERFORMANCE SIGNIFICANT ISSUES APPENDICESDISCLOSURES AND LEGAL COMPLIANCE

Page 167 Mental Health Commission | 2016/17 Annual Report
Occupational safety, health and injury managementThe following table details the Commission’s 2016/17 key performance indicators against occupational safety and health and injury management measures:
INDICATORACTUAL 2016/17
Number of Workers Compensation Claims received 4
Number of fatalities 0
Lost time injury/disease incidence rate 0.6%
Lost time injury severity rate 0
Percentage of injured workers returned to work within 13 weeks
100%
Percentage of injured workers returned to work within 26 weeks
100%
Percentage of managers trained in occupational safety, health and injury management responsibilities
88%*
Percentage of employees trained in Mental Health First Aid
16%*
*approximate figure
Recordkeeping plansThe State Records Act 2000 (the Act) was established to standardise statutory record keeping practices for every government agency.
Government agency practice is subject to the provisions of the Act and the standards and policies of the State Records Commission. The Commission established a formal Recordkeeping Plan to ensure compliance with these requirements.
Following the amalgamation of the Mental Health Commission and the Drug and Alcohol Office in 2015/16, the Commission undertook a complete review of its Business Classification Scheme to capture the functions and activities from mental health and AOD related information management.
The Commission also participated in the delivery of the first Western Australian Sector Disposal Authority (SDA) for Mental Health Services. This SDA will be used in combination with the State Records Office publication General Disposal Authority for State Government Information, collectively defining appropriate disposal schedules of records relating to mental health related activities and functions, general administration, financial management and accounting, and human resource management at the Commission.
The Commission has also continued to shift to a greater electronic records management operation, significantly improving compliance with the Act.
In 2016/17, 88% of Commission employees completed the Recordkeeping Awareness Training. This training provides an understanding of the fundamentals of recordkeeping and employee responsibilities in creating, managing and protecting records.
OVERVIEW AGENCY PERFORMANCE SIGNIFICANT ISSUES APPENDICESDISCLOSURES AND LEGAL COMPLIANCE
Page 168 Mental Health Commission | 2016/17 Annual Report
OVERVIEW AGENCY PERFORMANCE SIGNIFICANT ISSUESDISCLOSURES AND
LEGAL COMPLIANCEAPPENDICESAPPENDICES
Appendices
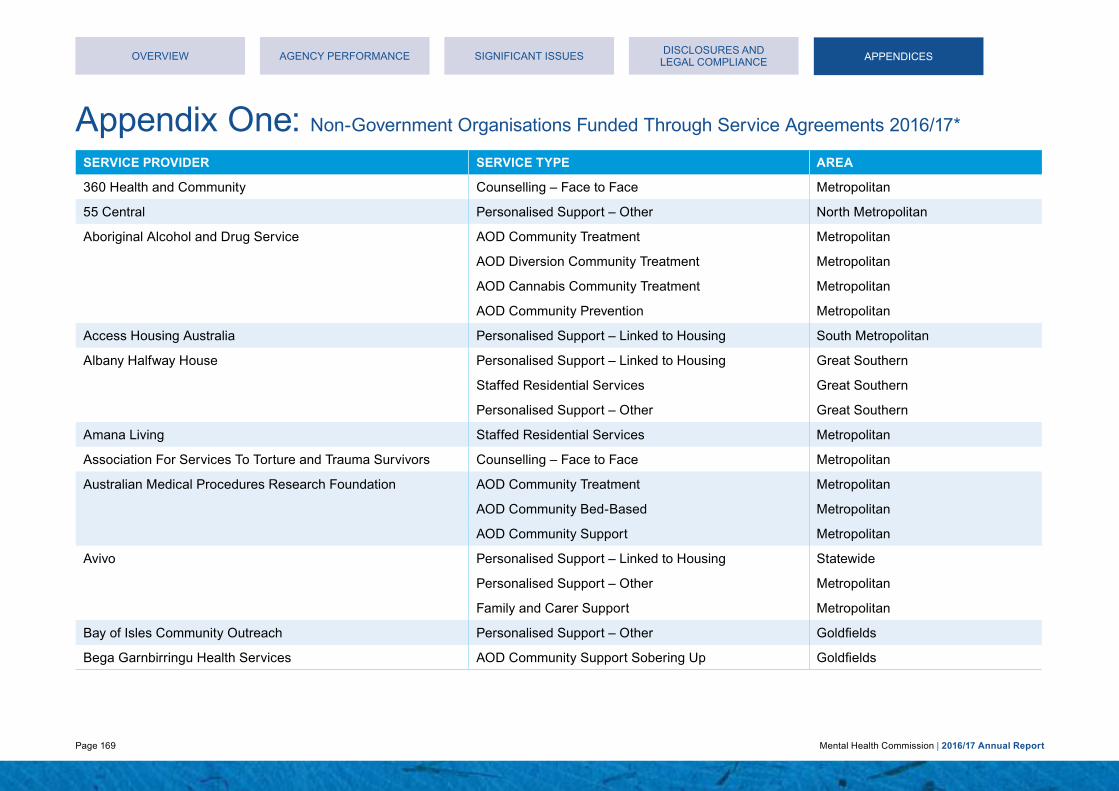
Page 169 Mental Health Commission | 2016/17 Annual Report
Appendix One: Non-Government Organisations Funded Through Service Agreements 2016/17*
SERVICE PROVIDER SERVICE TYPE AREA
360 Health and Community Counselling – Face to Face Metropolitan
55 Central Personalised Support – Other North Metropolitan
Aboriginal Alcohol and Drug Service AOD Community Treatment Metropolitan
AOD Diversion Community Treatment Metropolitan
AOD Cannabis Community Treatment Metropolitan
AOD Community Prevention Metropolitan
Access Housing Australia Personalised Support – Linked to Housing South Metropolitan
Albany Halfway House Personalised Support – Linked to Housing Great Southern
Staffed Residential Services Great Southern
Personalised Support – Other Great Southern
Amana Living Staffed Residential Services Metropolitan
Association For Services To Torture and Trauma Survivors Counselling – Face to Face Metropolitan
Australian Medical Procedures Research Foundation AOD Community Treatment Metropolitan
AOD Community Bed-Based Metropolitan
AOD Community Support Metropolitan
Avivo Personalised Support – Linked to Housing Statewide
Personalised Support – Other Metropolitan
Family and Carer Support Metropolitan
Bay of Isles Community Outreach Personalised Support – Other Goldfields
Bega Garnbirringu Health Services AOD Community Support Sobering Up Goldfields
OVERVIEW AGENCY PERFORMANCE SIGNIFICANT ISSUESDISCLOSURES AND
LEGAL COMPLIANCE APPENDICESAPPENDICES

Page 170 Mental Health Commission | 2016/17 Annual Report
SERVICE PROVIDER SERVICE TYPE AREA
Beyond Blue Mental Illness Prevention Statewide
Black Swan Health Counselling – Face to Face South Metropolitan
Bloodwood Tree Association AOD Community Support Sobering Up Pilbara
AOD Community Treatment Pilbara
BP Luxury Care Personalised Support – Other South Metropolitan
Burswood Care Pty Ltd Staffed Residential Service – Personal Care Support South Metropolitan
Carers Association of Western Australia Individual Advocacy Statewide
Sector Development and Representation Statewide
Carnarvon Family Support Service AOD Community Support Sobering Up Mid West
Casson Homes Staffed Residential Service – Personal Care Support North Metropolitan
Catholic Education Office of WA AOD Prevention Statewide
Centrecare Counselling – Face to Face Goldfields
Personalised Support – Other Goldfields
Personalised Support – Linked to Housing Goldfields
Family and Carer Support Goldfields
Collie Family Centre Counselling – Face to Face South West
Community First International Personalised Support – Linked to Housing Statewide
Connect Groups Support Groups Association WA Sector Development and Representation Metropolitan
Consumers of Mental Health WA (CoMHWA) Sector Development and Representation Statewide
Curtin University of Technology AOD Prevention Statewide
Curtin University of Technology (Aussie Optimism) Mental Illness Prevention Metropolitan
OVERVIEW AGENCY PERFORMANCE SIGNIFICANT ISSUESDISCLOSURES AND
LEGAL COMPLIANCEAPPENDICES

Page 171 Mental Health Commission | 2016/17 Annual Report
SERVICE PROVIDER SERVICE TYPE AREA
Curtin University of Technology (Mentally Healthy WA) Mental Health Promotion Statewide
Devenish Lodge Personal Care Subsidy South Metropolitan
Disability in the Arts Australia (DADAA) Group Support Activities North Metropolitan
Even Keel Bipolar Disorder Support Association Mutual Support and Self Help Metropolitan
Foundation Housing Personalised Support – Linked to Housing North Metropolitan
Franciscan House Personal Care Subsidy South Metropolitan
Fremantle Multicultural Centre Individual Advocacy Metropolitan
Fremantle Women’s Health Centre Counselling – Face to Face South Metropolitan
Fusion Australia Staffed Residential Services Mid West
Garl Garl Walbu Aboriginal Corporation AOD Community Support Sobering Up Kimberley
Goldfields Rehabilitation Services AOD Community Bed-Based Goldfields
AOD Community Support Goldfields
Gosnells Women’s Health Service Counselling – Face to Face South Metropolitan
Great Southern Community Housing Association Personalised Support – Linked to Housing Great Southern
GROW Mutual Support and Self Help Statewide
Mental Health Promotion Statewide
Helping Minds Mental Health Promotion Metropolitan
Individual Advocacy Statewide
Family and Carer Support Statewide
OVERVIEW AGENCY PERFORMANCE SIGNIFICANT ISSUESDISCLOSURES AND
LEGAL COMPLIANCE APPENDICESAPPENDICES

Page 172 Mental Health Commission | 2016/17 Annual Report
SERVICE PROVIDER SERVICE TYPE AREA
Holyoake Australian Institute for Alcohol and Drug Addiction Resolution
AOD Community Treatment Metropolitan Wheatbelt
AOD Diversion Community Treatment Metropolitan Wheatbelt
AOD Cannabis Community Treatment North East Metropolitan Wheatbelt
Home Health (trading as Tendercare) Personalised Support – Other North Metropolitan Wheatbelt South West
Family and Carer Support North Metropolitan Wheatbelt South West
Honeybrook Lodge Personal Care Subsidy North Metropolitan
Hope Community Services AOD Community Bed-Based Mid West
AOD Diversion Community Bed-Based Mid West
AOD Community Support Mid West
AOD Community Treatment Goldfields
AOD Diversion Community Treatment Goldfields
AOD Cannabis Community Treatment Goldfields
AOD Community Support Sobering Up Mid West
Ishar Multicultural Women’s Health Centre Family and Carer Support Metropolitan
Jennie Bertram & Associates Personalised Support – Other Metropolitan
June O’Connor Centre Group Support Activities Metropolitan
Personalised Support – Other Metropolitan
OVERVIEW AGENCY PERFORMANCE SIGNIFICANT ISSUESDISCLOSURES AND
LEGAL COMPLIANCE APPENDICESAPPENDICES

Page 173 Mental Health Commission | 2016/17 Annual Report
SERVICE PROVIDER SERVICE TYPE AREA
Kununurra Waringarri Aboriginal Corporation AOD Community Support Sobering Up Kimberley
Lamp Personalised Support – Other South West
Family and Carer Support South West
Personalised Support – Linked to Housing South West
Life Without Barriers Personalised Support – Linked to Housing Statewide
Staffed Residential Services South Metropolitan
Lifeline WA (The Living Stone Foundation) Counselling, Support, Information and Referral – Telephone
Statewide
Local Drug Action Groups AOD Prevention Statewide
Mental Health Law Centre Individual Advocacy Statewide
Mental Illness Fellowship of WA Personalised Support – Other Metropolitan
Family and Carer Support Statewide
Mental Health Promotion Statewide
Group Support Activities Metropolitan
Midland Women’s Health Care Place Counselling – Face to Face North Metropolitan
Milliya Rumurra Aboriginal Corporation AOD Community Treatment Kimberley
AOD Diversion Community Treatment Kimberley
AOD Community Support Kimberley
AOD Community Support Sobering Up Kimberley
Mind Australia Staffed Residential Services Metropolitan
OVERVIEW AGENCY PERFORMANCE SIGNIFICANT ISSUESDISCLOSURES AND
LEGAL COMPLIANCEAPPENDICESAPPENDICES

Page 174 Mental Health Commission | 2016/17 Annual Report
SERVICE PROVIDER SERVICE TYPE AREA
Mission Australia Family and Carer Support Metropolitan
AOD Community Bed-Based Metropolitan
AOD Diversion Community Bed-Based Metropolitan
AOD Community Support Metropolitan
AOD Cannabis Community Treatment Metropolitan Pilbara
AOD Community Treatment Metropolitan Pilbara
AOD Diversion Community Treatment Pilbara
Neami Personalised Support – Linked to Housing Statewide
Staffed Residential Services Metropolitan
Ngaanyatjarra Health Service Aboriginal Corporation AOD Community Treatment Goldfields
Ngangganawili Aboriginal Community Controlled Health & Medical
AOD Community Support Goldfields
Ngnowar Aerwah Aboriginal Corporation AOD Community Treatment Kimberley
AOD Diversion Community Treatment Kimberley
AOD Community Support Sobering Up Kimberley
Nindillingarri Cultural Health Services AOD Community Treatment Kimberley
Nyoongar Patrol System AOD Community Support Metropolitan
Outcare Personalised Support – Other Metropolitan
OVERVIEW AGENCY PERFORMANCE SIGNIFICANT ISSUESDISCLOSURES AND
LEGAL COMPLIANCE APPENDICESAPPENDICES

Page 175 Mental Health Commission | 2016/17 Annual Report
SERVICE PROVIDER SERVICE TYPE AREA
Palmerston Association AOD Community Treatment Metropolitan Great Southern
AOD Diversion Community Treatment Metropolitan Great Southern
AOD Community Bed-Based Metropolitan
AOD Diversion Community Bed-Based Metropolitan
AOD Community Support Metropolitan
AOD Cannabis Community Treatment South Metropolitan Great Southern
Pathways South West Personalised Support – Other South West
Personalised Support – Linked to Housing South West
Family and Carer Support South West
Perth Inner City Youth Service Personalised Support – Other Metropolitan
Richmond Wellbeing Personalised Support – Linked to Housing Statewide (ICLS only) South Metropolitan
Personalised Support – Other Statewide
Staffed Residential Services Statewide
Mutual Support and Self Help Metropolitan
Group Support Activities Great Southern
OVERVIEW AGENCY PERFORMANCE SIGNIFICANT ISSUESDISCLOSURES AND
LEGAL COMPLIANCE APPENDICESAPPENDICES

Page 176 Mental Health Commission | 2016/17 Annual Report
SERVICE PROVIDER SERVICE TYPE AREA
Rise Network Personalised Support – Linked to Housing Statewide (ICLS only) North Metropolitan Wheatbelt
Personalised Support – Other North Metropolitan
Individual Advocacy North Metropolitan
Romily House Personal Care Subsidy North Metropolitan
Ruah Community Services Personalised Support – Linked to Housing Statewide (ICLS only) South Metropolitan Mid West
Personalised Support – Other Metropolitan Great Southern Mid West
Education, Employment and Training Metropolitan
AOD Community Treatment Metropolitan
Staffed Residential Services Mid West
Salisbury Home Personal Care Subsidy North Metropolitan
Share & Care Community Services Group Personalised Support – Other Wheatbelt
Family and Carer Support Wheatbelt
Silver Chain Group Personalised Support – Other Pilbara
Family and Carer Support Pilbara
South Coastal Women’s Health Services Association Counselling – Face to Face South Metropolitan
Southern Cross Care (WA) Staffed Residential Services Metropolitan
Personalised Support – Other Metropolitan
Family and Carer Support Metropolitan
OVERVIEW AGENCY PERFORMANCE SIGNIFICANT ISSUESDISCLOSURES AND
LEGAL COMPLIANCEAPPENDICESAPPENDICES

Page 177 Mental Health Commission | 2016/17 Annual Report
SERVICE PROVIDER SERVICE TYPE AREA
Spirit of the Street Choir Group Support Activities Metropolitan
St Bartholomew’s House Staffed Residential Services Metropolitan
Personalised Support – Linked to Housing South Metropolitan
St John of God Health Care Clinical Treatment and Care – Admitted Metropolitan
AOD Community Bed-Based Metropolitan
AOD Diversion Community Bed-Based Metropolitan
St John of God Hospital Bunbury AOD Community Treatment South West
AOD Diversion Community Treatment South West
AOD Cannabis Community Treatment South West
AOD Community Bed-Based South West
St Jude’s Hostel (Pu-Fam Pty Ltd) Personal Care Subsidy North Metropolitan
St Patrick’s Community Support Centre Group Support Activities Metropolitan
AOD Community Treatment Metropolitan
St. Vincent De Paul Society (WA) Staffed Residential Service – Personal Care Support North Metropolitan
Teen Challenge Perth AOD Community Bed-Based Statewide
The Salvation Army Western Australia Property Trust Personalised Support – Other North Metropolitan
AOD Community Bed-Based Metropolitan
AOD Diversion Community Bed-Based Metropolitan
AOD Community Support Metropolitan
AOD Community Support Sobering Up Metropolitan
AOD Community Treatment Metropolitan
OVERVIEW AGENCY PERFORMANCE SIGNIFICANT ISSUESDISCLOSURES AND
LEGAL COMPLIANCE APPENDICESAPPENDICES

Page 178 Mental Health Commission | 2016/17 Annual Report
SERVICE PROVIDER SERVICE TYPE AREA
The Samaritans Counselling – Face to Face Statewide
Counselling, Support, Information and Referral – Telephone
Statewide
Mental Health Promotion Statewide
UnitingCare West Personalised Support – Linked to Housing North Metropolitan
AOD Community Treatment East Metropolitan
WA Council on Addictions T/A Cyrenian House AOD Community Treatment Metropolitan Kimberley
AOD Diversion Community Treatment Metropolitan
AOD Community Bed-Based Metropolitan
AOD Diversion Community Bed-Based Metropolitan
AOD Community Support Metropolitan
AOD Community Support Metropolitan
AOD Cannabis Community Treatment North Metropolitan
WA Network of Alcohol & Other Drug Agencies AOD Community Treatment Statewide
Wanslea Family Services Family and Carer Support South Metropolitan
Warmun Community (Turkey Creek) AOD Community Treatment Kimberley
Western Australian AIDS Council Mental Illness Prevention Statewide
Mental Health Promotion Statewide
OVERVIEW AGENCY PERFORMANCE SIGNIFICANT ISSUESDISCLOSURES AND
LEGAL COMPLIANCEAPPENDICESAPPENDICES

Page 179 Mental Health Commission | 2016/17 Annual Report
SERVICE PROVIDER SERVICE TYPE AREA
Western Australian Association for Mental Health Mental Health Promotion Statewide
Sector Development and Representation Statewide
Workforce Development Statewide
Education, Employment and Training Statewide
Western Australian Substance Users Association AOD Community Treatment Metropolitan
Women’s Healthcare Association Counselling – Face to Face North Metropolitan
Group Support Activities North Metropolitan
Mutual Support and Self Help Metropolitan
AOD Community Treatment Metropolitan
AOD Diversion Community Treatment Metropolitan
Yaandina Family Centre AOD Community Support Sobering Up Pilbara
AOD Community Bed-Based Pilbara
Youth Focus Counselling – Face to Face Metropolitan
*This list does not include grants
OVERVIEW AGENCY PERFORMANCE SIGNIFICANT ISSUESDISCLOSURES AND
LEGAL COMPLIANCE APPENDICESAPPENDICES
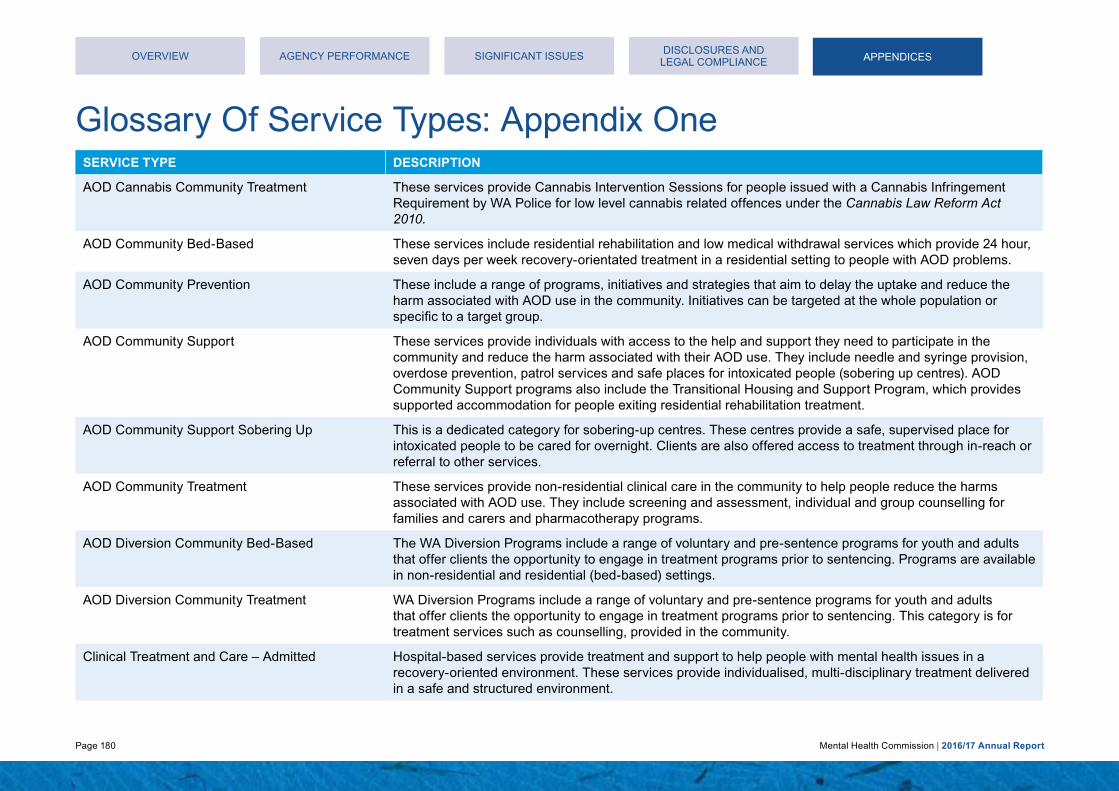
Page 180 Mental Health Commission | 2016/17 Annual Report
Glossary Of Service Types: Appendix One
OVERVIEW AGENCY PERFORMANCE SIGNIFICANT ISSUESDISCLOSURES AND
LEGAL COMPLIANCE
SERVICE TYPE DESCRIPTION
AOD Cannabis Community Treatment These services provide Cannabis Intervention Sessions for people issued with a Cannabis Infringement Requirement by WA Police for low level cannabis related offences under the Cannabis Law Reform Act 2010.
AOD Community Bed-Based These services include residential rehabilitation and low medical withdrawal services which provide 24 hour, seven days per week recovery-orientated treatment in a residential setting to people with AOD problems.
AOD Community Prevention These include a range of programs, initiatives and strategies that aim to delay the uptake and reduce the harm associated with AOD use in the community. Initiatives can be targeted at the whole population or specific to a target group.
AOD Community Support These services provide individuals with access to the help and support they need to participate in the community and reduce the harm associated with their AOD use. They include needle and syringe provision, overdose prevention, patrol services and safe places for intoxicated people (sobering up centres). AOD Community Support programs also include the Transitional Housing and Support Program, which provides supported accommodation for people exiting residential rehabilitation treatment.
AOD Community Support Sobering Up This is a dedicated category for sobering-up centres. These centres provide a safe, supervised place for intoxicated people to be cared for overnight. Clients are also offered access to treatment through in-reach or referral to other services.
AOD Community Treatment These services provide non-residential clinical care in the community to help people reduce the harms associated with AOD use. They include screening and assessment, individual and group counselling for families and carers and pharmacotherapy programs.
AOD Diversion Community Bed-Based The WA Diversion Programs include a range of voluntary and pre-sentence programs for youth and adults that offer clients the opportunity to engage in treatment programs prior to sentencing. Programs are available in non-residential and residential (bed-based) settings.
AOD Diversion Community Treatment WA Diversion Programs include a range of voluntary and pre-sentence programs for youth and adults that offer clients the opportunity to engage in treatment programs prior to sentencing. This category is for treatment services such as counselling, provided in the community.
Clinical Treatment and Care – Admitted Hospital-based services provide treatment and support to help people with mental health issues in a recovery-oriented environment. These services provide individualised, multi-disciplinary treatment delivered in a safe and structured environment.
APPENDICESAPPENDICES

Page 181 Mental Health Commission | 2016/17 Annual Report
SERVICE TYPE DESCRIPTION
Counselling – Face to Face Face to Face Counselling is a structured process where a counsellor works on an individual basis with the client to address and resolve specific problems, make decisions, work through feelings and inner conflicts, or improve relationships with others. Counselling facilitates personal growth, development, self-understanding and the adoption of constructive life practices.
Counselling, Support, Information and Referral – Telephone
Mental health support, information and referral telephone services are those that provide support for people experiencing mental illness and which offer reliable referrals, information and selfhelp resources to empower people to take steps towards maintaining mental health and emotional wellbeing.
Education, Employment and Training This category includes services where the principal function is to provide or support people with lived experience of mental illness, in gaining education, employment and/or training.
Family and Carer Support Family and carer support services provide families and carers of people living with a mental illness support, information, education and skill development opportunities to fulfil their caring role, while maintaining their own health and wellbeing.
Group Support Activities Group support activities include services that aim to improve the quality of life and psychosocial functioning of mental health consumers, through the provision of group-based social, recreational or pre-vocational activities. In contrast to services in the Mutual Support and Self Help service type, group support activities are led by a staff member of the NGO providing the service.
Individual Advocacy These services seek to represent the rights and interests of people with a mental illness, on a one-to-one basis, by addressing instances of discrimination, abuse and neglect. Individual advocates work with people with mental illness on either a short-term or issue specific basis.
Mental Health Promotion These services aim to raise awareness of mental health issues, improve mental health literacy, reduce stigma and discrimination and maximise the population’s mental health and wellbeing. Mental Health Promotion may include programs targeted to population segments, based on age (e.g. early childhood) or setting (e.g. school or workplace), as well as initiatives to educate the general population.
Mental Illness Prevention These services work to prevent the onset of mental disorders, in order to reduce the incidence and prevalence of mental illness in the community. Mental Illness Prevention activities are directed at reducing known risk factors and/or preventing people that display early signs of mental illness from developing a diagnosable mental illness. These activities can be either population-wide or targeted at vulnerable segments of the community. In contrast to Mental Health Promotion, which seeks to enhance the population’s mental health, Mental Illness Prevention aims to prevent the development of mental illness.
OVERVIEW AGENCY PERFORMANCE SIGNIFICANT ISSUESDISCLOSURES AND
LEGAL COMPLIANCE APPENDICESAPPENDICES

Page 182 Mental Health Commission | 2016/17 Annual Report
OVERVIEW AGENCY PERFORMANCE SIGNIFICANT ISSUESDISCLOSURES AND
LEGAL COMPLIANCE
SERVICE TYPE DESCRIPTION
Mutual Support and Self Help These services provide information and peer support to people with a lived experience of mental illness. People meet to discuss shared experiences, coping strategies and to provide information and referrals. Self Help groups are usually formed by peers who have come together for mutual support and to accomplish a specific purpose.
Personal Care Subsidy These services provide assistance to residents residing in large congregate care hostels. The intention of personal care support is to encourage and maintain the current skills of individuals, to increase autonomy and self-management and to improve the quality of life for residents. The amount of subsidy paid to each Hostel is based on the level of support required by each individual to meet their personal care needs.
Personalised Support – Linked to Housing These are flexible services tailored to a mental health consumer’s individual and changing needs to assist people maintain their tenancy and to support them to live independently.
Personalised Support – Other These are flexible services tailored to a mental health consumer’s individual and changing needs to support them in their recovery journey. They include a range of one-on-one activities and psychosocial support provided by a support worker directly to mental health consumers in their homes or local communities.
Sector Development and Representation Mental health sector development and representation services engage with a wide variety of issues regarding the sustainability and development of the mental health sector. This includes information dissemination, advocacy, policy analysis, program development and sector capacity building.
Staffed Residential Services
Staffed Residential Service – Personal Care Support
Staffed residential services provide overnight accommodation in a domestic style environment, with on-site support workers. Accommodation may be provided on a short, medium or long term basis for people with severe and persistent mental health problems.
Workforce Development These are structured education and training programs designed to enhance the capacity of workers to work with people with mental health or AOD problems. Programs may also aim to develop the capability of the broader health and human services workforce to contribute to preventing mental illness and to meet the needs of people with mental health or AOD problems.
APPENDICESAPPENDICES

Page 183 Mental Health Commission | 2016/17 Annual Report
Appendix Two: Board And Committee Remuneration
Alcohol and Other Drugs Advisory Board
POSITION MEMBERS NAMETYPE OF REMUNERATION
PERIOD OF MEMBERSHIPGROSS REMUNERATION 2016/17 FINANCIAL YEAR
Chair Prof Colleen Hayward Annual 1 July 2016 – 30 June 2017 $31,744.61
Deputy Chair Mr Barry Mackinnon AM Annual 1 July 2016 – 30 June 2017 $26,142.04
Member Ms Judith Alcock Sessional 1 July 2016 – 30 June 2017 $3,938.72
Member Prof Rosanna Capolingua Sessional 1 July 2016 – 30 June 2017 $3,938.73
Member Dr John Edwards Sessional 1 July 2016 – 30 June 2017 $5,012.92
$70,777.02
OVERVIEW AGENCY PERFORMANCE SIGNIFICANT ISSUESDISCLOSURES AND
LEGAL COMPLIANCE APPENDICESAPPENDICES

Page 184 Mental Health Commission | 2016/17 Annual Report
APPENDICES
Mental Health Advisory Council
POSITION MEMBERS NAMETYPE OF REMUNERATION
PERIOD OF MEMBERSHIPGROSS REMUNERATION 2016/17 FINANCIAL YEAR
Chair Mr Barry Mackinnon AM Annual 1 July 2016 – 30 June 2017 $15,872.31
Deputy Chair Hon. Eric Ripper AM Annual 19 September 2016 – 30 June 2017 $8,714.02
Member Mr Rodney Astbury Sessional 1 July 2016 – 30 June 2017 $5,233.05
Member Ms Margaret Doherty Sessional 1 July 2016 – 30 June 2017 $4,158.85
Member Dr John Edwards Sessional 1 July 2016 – 30 June 2017 $3,800.78
Member Ms Pamela Gardner Sessional 1 July 2016 – 30 June 2017 $4,158.85
Member – Ex Officio* Ms Aimee Sinclair Sessional 1 July 2016 – 30 June 2017 $716.13
Member Mr Lindsay Smoker Sessional 1 July 2016 – 30 June 2017 $3,800.78
Member Dr Bernadette Wright Sessional 1 July 2016 – 30 June 2017 $3,608.04
$50,062.81
* Ex Officio: Due to role held as CoMHWA representative
OVERVIEW AGENCY PERFORMANCE SIGNIFICANT ISSUESDISCLOSURES AND
LEGAL COMPLIANCE APPENDICESAPPENDICES

Page 185 Mental Health Commission | 2016/17 Annual Report
Ministerial Council for Suicide Prevention
POSITION NAMETYPE OF REMUNERATION
PERIOD OF MEMBERSHIPGROSS REMUNERATION 2016/17 FINANCIAL YEAR
Chair Dr Neale Fong Annual 1 July 2016 – 30 June 2017 $24,341.58
Deputy Chair Mr Glenn Pearson Annual 7 December 2016 – 30 June 2017 $9,903.92
Member Ms Jenny Allen Sessional 1 July 2016 – 30 June 2017 $1,489.20
Member Ms Tamisha King Sessional 1 July 2016 – 30 June 2017 $657.00
Member Ms Delys Mouritz Sessional 1 July 2016 – 30 June 2017 $3,985.80
Member Ms Anne Richards Sessional 1 July 2016 – 30 June 2017 $985.50
Member Prof Cobie Rudd Sessional 1 July 2016 – 30 June 2017 $3,985.80
Member Ms Donna Cole Sessional 1 July 2016 – 30 June 2017 $1,385.20
Member Dani Wright Toussaint Sessional 1 July 2016 – 30 June 2017 $1,971.00
Member Ms Alison Xamon Sessional 1 July 2016 – 30 June 2017 $2,671.80
Member – Ex Officio* Mr Timothy Marney N/A 1 July 2016 – 30 June 2017 $0
Member – Ex Officio* Mr Chris Gostelow N/A 1 July 2016 – 30 June 2017 $0
$51,376.80
* Ex Officio: Due to role held as State Government representative
OVERVIEW AGENCY PERFORMANCE SIGNIFICANT ISSUESDISCLOSURES AND
LEGAL COMPLIANCE APPENDICESAPPENDICES

Page 186 Mental Health Commission | 2016/17 Annual Report
Mental Health Tribunal In the interests of security and sensitivity, the names and details of the Mental Health Tribunal members have been excluded from this report. However, gross remuneration for the President, and averages for the Tribunal members, for the 2016/17 financial year is as follows:
President: $ 181,013.00
Member (high): $ 111,232.29
Member (average): $ 28,101.73
Member (low): $ 382.16
OVERVIEW AGENCY PERFORMANCE SIGNIFICANT ISSUESDISCLOSURES AND
LEGAL COMPLIANCEAPPENDICES

Page 187 Mental Health Commission | 2016/17 Annual Report

Mental Health CommissionLevels 1 and 2, 1 Nash Street, PERTH WA 6000PO Box X2299, Perth Business Centre, PERTH WA 6849T: 6553 0600E: [email protected]
@mentalhealthwa
@mentalhealthwa
Mental Health Commission of Western Australia
Mental Health Commission of Western Australia