Embed Size (px)
Citation preview

1
Mental Health Care in the Netherlands
Key Figures 2012
GGZ Nederland
Amersfoort, May 2014

2
Incidence of mental health disorders in the population of the Netherlands
Source: de Graaf, R., M. ten Have and S. van Dorsselaer (2010), De psychische gezondheid van de Nederlandse bevolking. Nemesis-2: Opzet en eerste resultaten. [The mental health of the Dutch population. Nemsis-2: design and preliminary results]. Trimbos Instituut
% and number of Dutch in the age of 18 - 64 years with a newly developed psychological disorder on DSM IV Axis 1 in the last 12 months*
1,8% 191,400
Top 5 most common disorders*
Depression 1,3% 135,600
Specific phobia 0,7% 75,700
Generalized anxiety disorder 0,6% 64,400
Alcohol abuse 0,6% 66,000
Panic disorder 0,5% 53,500
* These numbers are computed for the total population of 18-64 years in the Netherlands on 1-1-2012 (10,557,188)
3
Prevalence of mental health disorders in the population of the Netherlands
Source: de Graaf, R., M. ten Have and S. van Dorsselaer (2010), De psychische gezondheid van de Nederlandse bevolking. Nemesis-2: Opzet en eerste resultaten. [The mental health of the Dutch population. Nemsis-2: design and preliminary results]. Trimbos Instituut
Some form of psychological disorder 18,0%
Top 5 most common disorders*:
Depression 5,2%
Specific phobia 5,0%
Social phobia 3,8%
Alcohol abuse 3,7%
ADHD 2,1%
* prevalence in the past 12 months, residents aged 18-64 years

4
0,0
0,5
1,0
1,5
2,0
male
female
population (average)
Use of mental health services per age group (2010)
Source: GGZ Nederland (2013), GGZ in de Zorgverzekeringswet, tabellen over de jaren 2008-2010. [Mental health care in the Health Insurance Act, tables over the years 2008-2010], GGZ Nederland 2013

5
Mental health budget 2012
In the Netherlands, mental health problems are the major cause of burden of disease. However, mental health providers only use 6.1 % of total health and social care budgets in the Netherlands.
Source: CBS Statline (2013)
26%
19%
10% 8%
6%
31% hospitals, medical specialists
providers of long term care for elderly
providers of care for the disabled
primary care practices
mental health care
other care providers

6
65%
23%
10% 2% Health Insurance Act (ZVw)
Exceptional Medical Expenses Act (AWBZ)
Forensic Care (Ministry of Safety and Justice)
Social Support Act (WMO)
Funding of specialist mental health care (2012)
The Health Insurance Act (ZVW) covers curative care. This includes almost all outpatient mental health treatment as well as the first year of inpatient mental health care. Longterm mental health care is funded under the Exceptional Medical Expenses Act (AWBZ). In order to be eligible for care under the AWBZ, a person has to pass an objective assessment by the National Care Assessement Centre (CIZ). The total budget in 2012 for mental health care was € 5,82 billion.
Sources: State Budget Ministry of Health, 2012; Ministry of Safety and Justice, 2012; NZa, 2014.
7
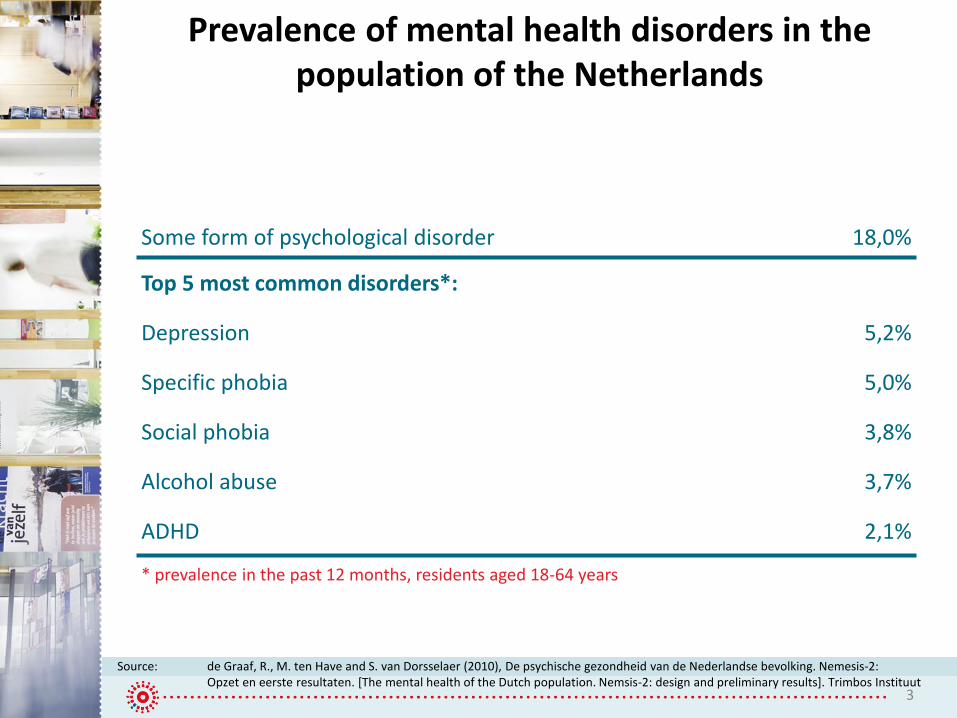
Number of patients and treatments under the Health Insurance Act 2009 - 2012
750.000
800.000
850.000
900.000
2009 2010 2011 2012**
number of patients
number of treatments
2009 2010 2011 2012* 2012**
number of patients 827,300 818,500 817,900 731,500 777,900
number of treatments 884,500 879,200 864,900 764,200 818,900
* preliminary data, excluding December 2012
** estimation for total of 2012, bases on the period November 2011 to October 2012
Source: GGZ Nederland (2014), Sectorrapport 2012: feiten en cijfers over een sector in beweging [Mental health industry report 2012, facts and figures on an industry in transition].

8
Number of treatments per sector of mental health care 2009 – 2012
2009 2010 2011 2012*
Children and youth 179,200 183,700 184,800 173,500
Adults 520,400 511,500 499,300 433,200
Elderly 93,100 90,100 87,000 74,800
Addiction care 75,200 76,200 75,300 66,600
Forensic care 16,500 17,800 18,500 16,200
TOTAL 884,400 879,300 864,900 764,300
* preliminary data, excluding December 2012
Source: GGZ Nederland (2014), Sectorrapport 2012: feiten en cijfers over een sector in beweging [Mental health industry report 2012, facts and figures on an industry in transition].
9
0%
10%
20%
30%
40%
50%
60%
70%
80%
90%
100%
2009 2010 2011 2012*
Forensic
Addiction care
Elderly
Adults
Children and youth
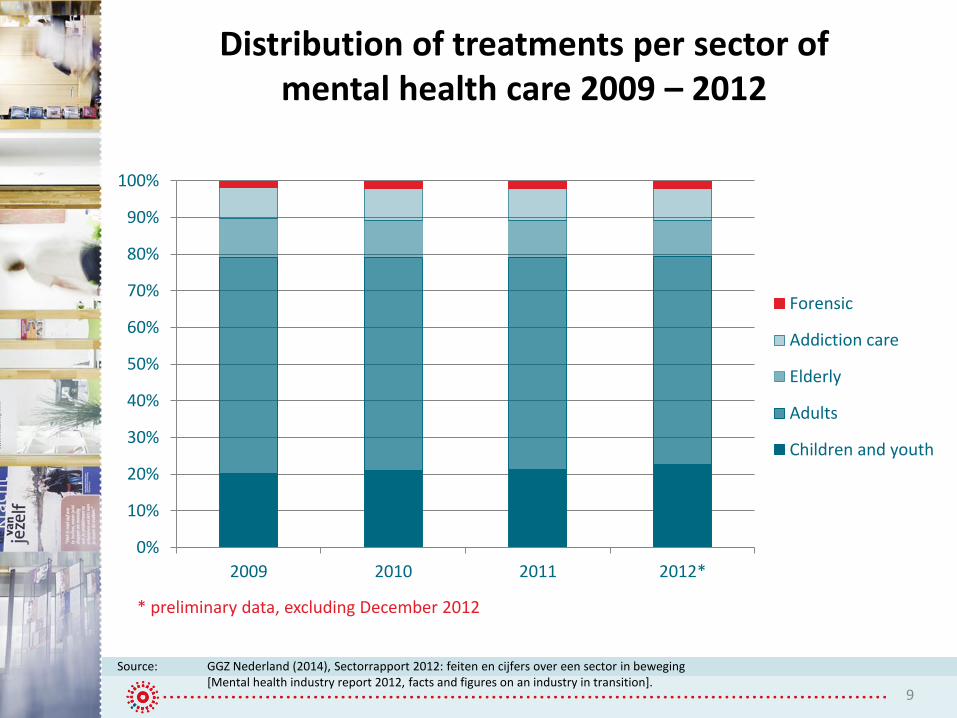
Distribution of treatments per sector of mental health care 2009 – 2012
Source: GGZ Nederland (2014), Sectorrapport 2012: feiten en cijfers over een sector in beweging [Mental health industry report 2012, facts and figures on an industry in transition].
* preliminary data, excluding December 2012

10
Source: CIZ (National Care Assessment Centre), 2014
9.900
36.200
79.800
-
10.000
20.000
30.000
40.000
50.000
60.000
70.000
80.000
90.000
clinical admission for morethan 1 year
sheltered housing other (outpatient care, dayoccupation, none)
Long term treatment for people with severe mental illness

11
Placements at the disposal of the government (Ministry of Security and Justice)
Placement at the disposal of the government (TBS) can be imposed by a court when someone with a mental disorder has committed a severe offence and is found to be (partially or fully) irresponsible for his/her criminal behaviour.
0
20
40
60
80
100
120
140
160
180
200
2008 2009 2010 2011 2012
Compulsoryconfinement
ConditionalPlacement
Total numberof impositions
0
500
1000
1500
2000
2500
2008 2009 2010 2011 2012
women men
Number of people at the disposal of the government in that year
Number of new placements at the disposal of the government
Source: DJI (2013). Forensische zorg in getal 2008 – 2012 [Forensic care in numbers 2008 – 2012]. Ministerie van Veiligheid en Justitie.

12
Number of primary and specialist mental health care providers between 2008 - 2011
This is an estimate of all health care providers in primary and specialist mental health care. The 181 service providers in specialist mental health are eligible for membership of GGZ Nederland, 113 were actually members of GGZ Nederland.
2008 2009 2010 2011
Primary mental health
care providers
Health care psychologists 3,956 4,031 N/A N/A
Other (such as psychiatrists,
educational counsellors)
197 174 N/A N/A
TOTAL 4,153 4,205
2008 2009 2010 2011
Specialist mental
health care providers
Mental health organisations
within budget parameter system
182 179 178 181
Mental health organisations
outside budget parameter system
16 58 N/A N/A
Self employed psychologists 1,220 1,518 N/A N/A
Self employed psychiatrists 455 466 N/A N/A
TOTAL 1,873 2,221 178 181
Source: NZa (2012)

13
Number of jobs and employees between 2009 – 2012
Sources: Number of people working: AZWinfo.nl (2013); Number of jobs in fulltime equivalents: Jaarverantwoording Zorginstellingen (2013)
2009 2010 2011 2012** (%) growth 2009-2012
Number of employees 81,350 84,930 85,780 85,300 4.9
Number of jobs (FTE)* 65,700 66,830 67,480 67,100 2.1
* only for members GGZ Nederland
** estimation based on numbers PGGM for year 2012

14
GGZ Nederland is the sector organisation of specialist mental health and addiction care providers in the Netherlands. The aim of GGZ Nederland and its members is to ensure the availability of high quality, accessible, affordable and sustainable mental health care.
In 2013, its 113 members were responsible for a market share of 80.6% in the health insurance market and more than 90% in child and youth care, sheltered housing, addiction care and forensic care
Seated in Amersfoort, its 66 employees represent the interests of its members in an on-going and constructive dialogue with client organisations, health insurers, national and local governments, professional associations and trade unions.

15
Members with mental health care output 2010 2011 2012 2013
Integrated mental health care organisation 32 31 32 33
Forensic care 7 7 7 7
Child and youth psychiatry 13 13 14 14
Outpatient mental health care (RIAGG) 13 13 16 24
Sheltered Housing (RIBW) 22 23 23 23
Addiction care 11 12 12 12
TOTAL 98 99 104 113
Source: GGZ Nederland (2014), Sectorrapport 2012: feiten en cijfers over een sector in beweging [Industry report 2012, facts and figures on an industry in transition].
Membership of GGZ Nederland 2010 – 2013 by type of service providers
Despite the increase in membership between 2010 and 2013, the market share decreased from 90.3% in 2009 to 80.6% in 2011 for common mental disorders. For other types of services, the market share is still more than 90% in 2013.

16
These data were supplied by member organisations of GGZ Nederland. In some cases, other sources have been used. For more information, please refer to the full report at:
http://www.ggznederland.nl/uploads/publication/GGZ-Nederland_Sectorrapport_2012-web.pdf
Published by: GGZ Nederland
PO Box 830,
3800 AV Amersfoort Website: www.ggznederland.nl/pagina/english e-mail: [email protected]


![2015 Recidivism Report - WODC 2016-1a_nw_tcm28-266946.pdf · namely Reclassering Nederland [Dutch Probation Service], Stichting Verslavingsreclassering GGZ [Dutch Addiction Probation](https://img.pdfslide.us/doc/110x75/5f1a68eb157a0e0d05254e2f/2015-recidivism-report-wodc-2016-1anwtcm28-namely-reclassering-nederland.jpg)


![Mental health in the Netherlands How far are we in the reform · 2017-12-21 · [Mental health care in the Health Insurance Act, tables over the years 2008-2010] ... [Trendreport](https://img.pdfslide.us/doc/110x75/5f34918059b51a62391f8306/mental-health-in-the-netherlands-how-far-are-we-in-the-2017-12-21-mental-health.jpg)