Embed Size (px)
Citation preview
1
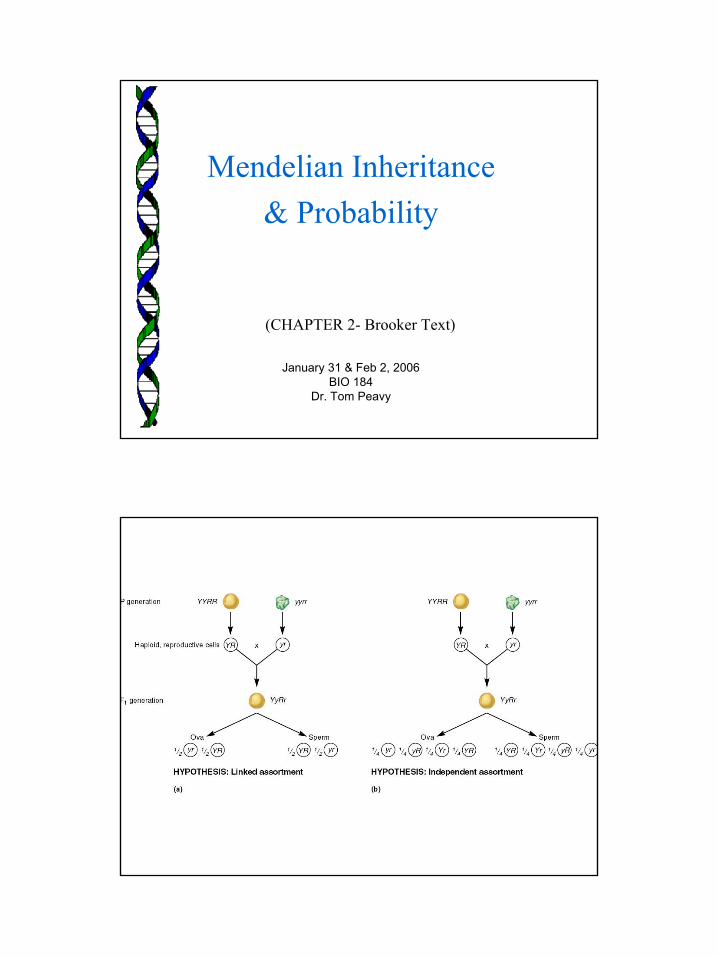
(CHAPTER 2- Brooker Text)
Mendelian Inheritance& Probability
January 31 & Feb 2, 2006BIO 184
Dr. Tom Peavy
2
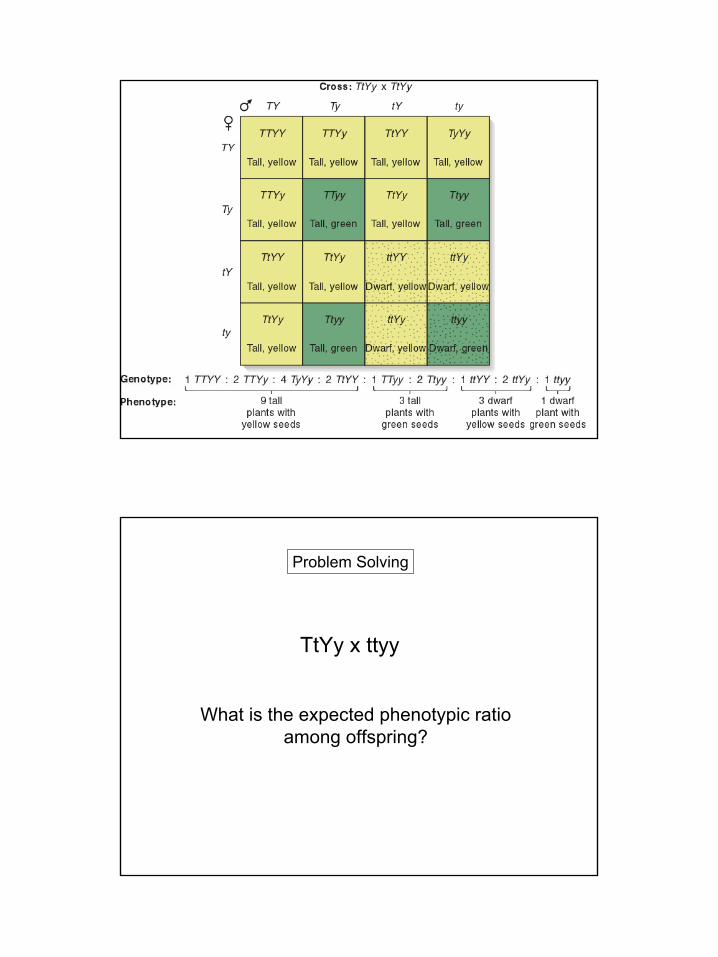
TtYy x ttyy
What is the expected phenotypic ratio among offspring?
Problem Solving
3
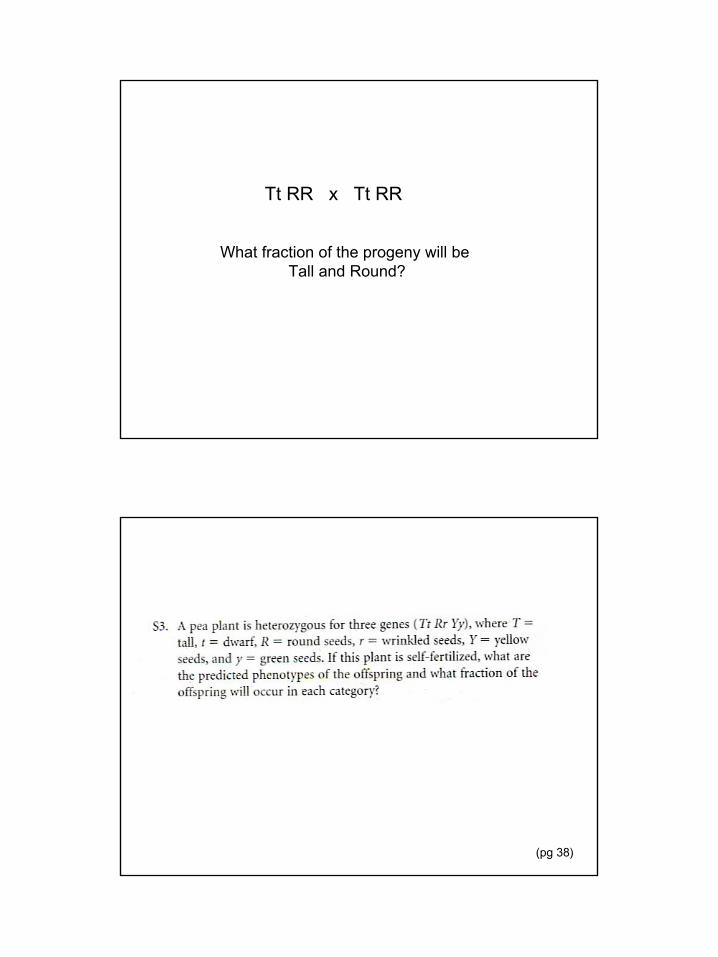
Tt RR x Tt RR
What fraction of the progeny will be Tall and Round?
(pg 38)
4
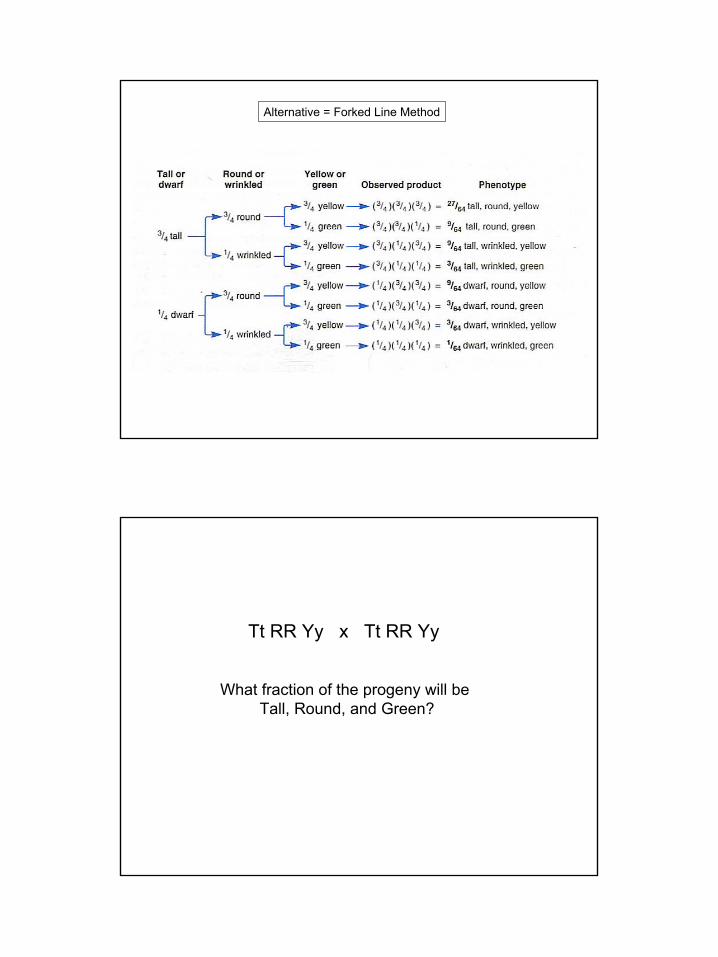
Alternative = Forked Line Method
Tt RR Yy x Tt RR Yy
What fraction of the progeny will be Tall, Round, and Green?
5
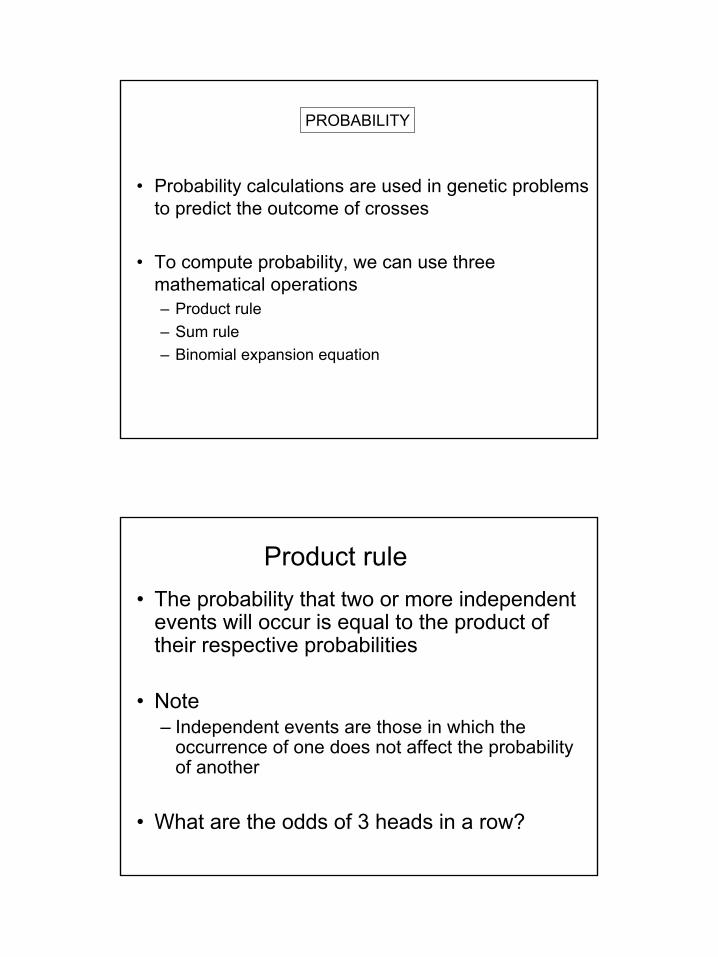
• Probability calculations are used in genetic problems to predict the outcome of crosses
• To compute probability, we can use three mathematical operations– Product rule
– Sum rule
– Binomial expansion equation
PROBABILITY
Product rule
• The probability that two or more independent events will occur is equal to the product of their respective probabilities
• Note– Independent events are those in which the
occurrence of one does not affect the probability of another
• What are the odds of 3 heads in a row?
6
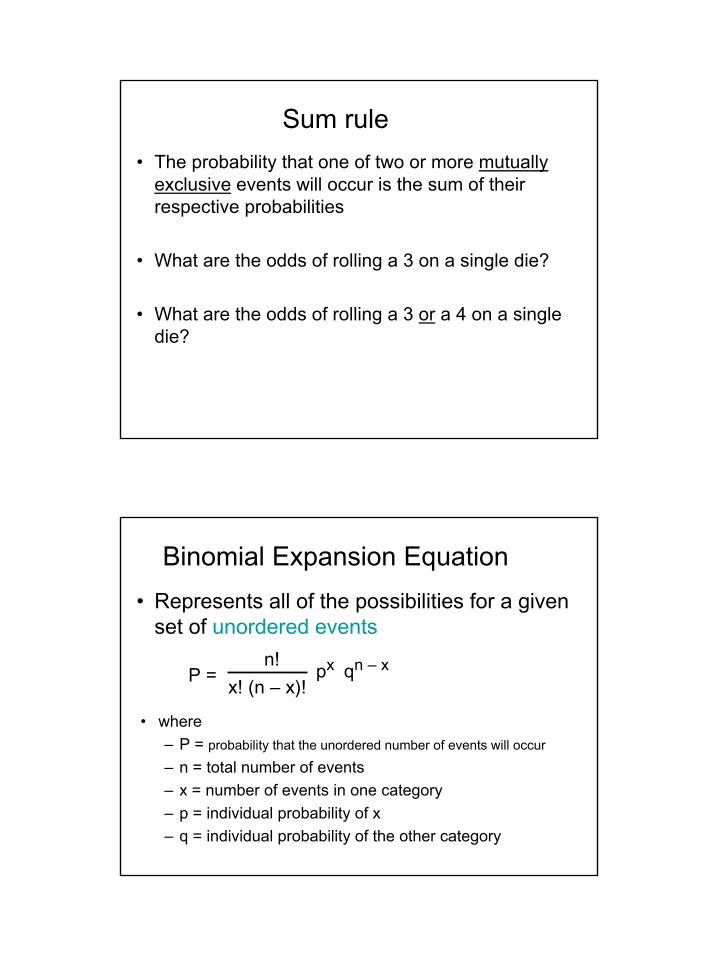
Sum rule
• The probability that one of two or more mutually exclusive events will occur is the sum of their respective probabilities
• What are the odds of rolling a 3 on a single die?
• What are the odds of rolling a 3 or a 4 on a single die?
Binomial Expansion Equation
• Represents all of the possibilities for a given set of unordered events
n!
x! (n – x)!px qn – x
• where
– P = probability that the unordered number of events will occur
– n = total number of events
– x = number of events in one category
– p = individual probability of x
– q = individual probability of the other category
P =
7
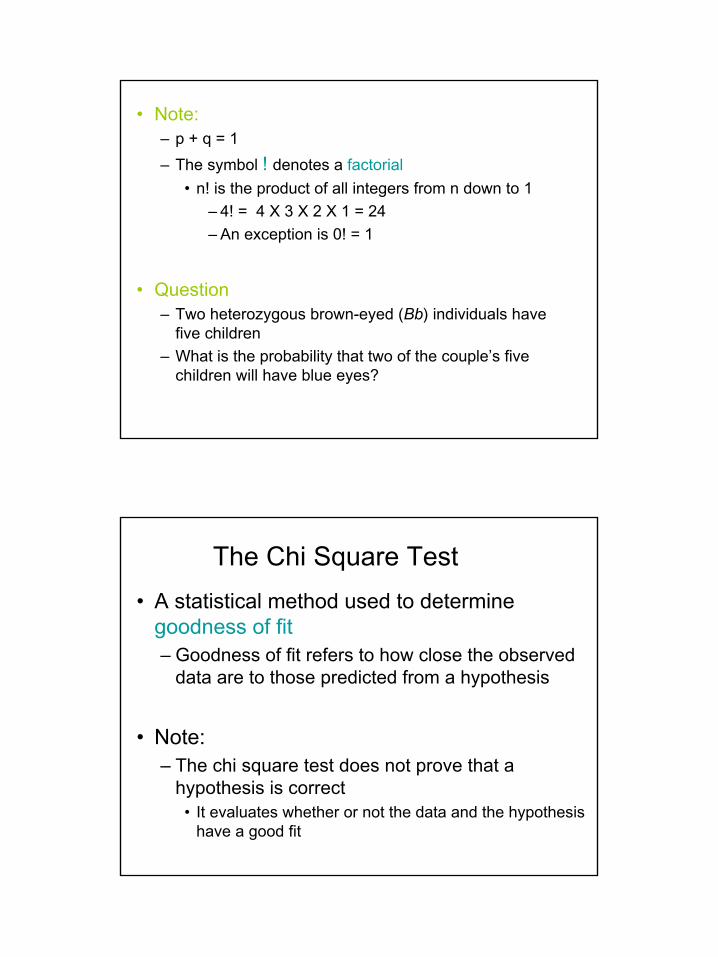
• Note:– p + q = 1
– The symbol ! denotes a factorial
• n! is the product of all integers from n down to 1
– 4! = 4 X 3 X 2 X 1 = 24
– An exception is 0! = 1
• Question– Two heterozygous brown-eyed (Bb) individuals have
five children
– What is the probability that two of the couple’s five children will have blue eyes?
The Chi Square Test
• A statistical method used to determine goodness of fit– Goodness of fit refers to how close the observed
data are to those predicted from a hypothesis
• Note:– The chi square test does not prove that a
hypothesis is correct• It evaluates whether or not the data and the hypothesis
have a good fit
8
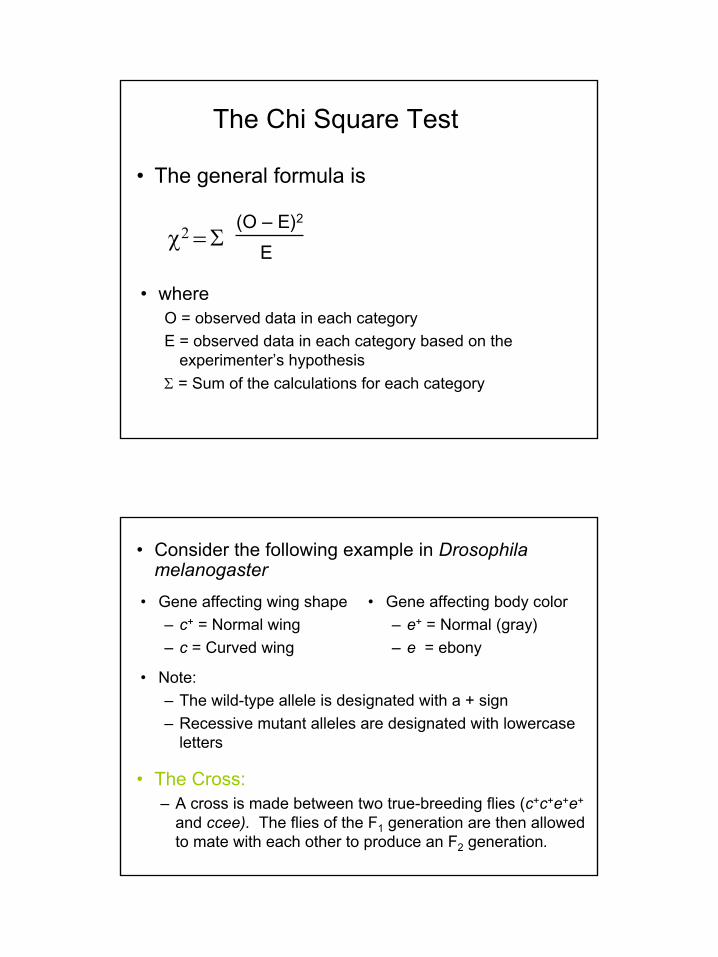
The Chi Square Test
• The general formula is
χ2 = Σ(O – E)2
E
• where O = observed data in each category
E = observed data in each category based on the experimenter’s hypothesis
Σ = Sum of the calculations for each category
• Consider the following example in Drosophila melanogaster
• Gene affecting wing shape
– c+ = Normal wing
– c = Curved wing
• Gene affecting body color
– e+ = Normal (gray)
– e = ebony
• Note:
– The wild-type allele is designated with a + sign
– Recessive mutant alleles are designated with lowercase letters
• The Cross:– A cross is made between two true-breeding flies (c+c+e+e+
and ccee). The flies of the F1 generation are then allowed to mate with each other to produce an F2 generation.
9
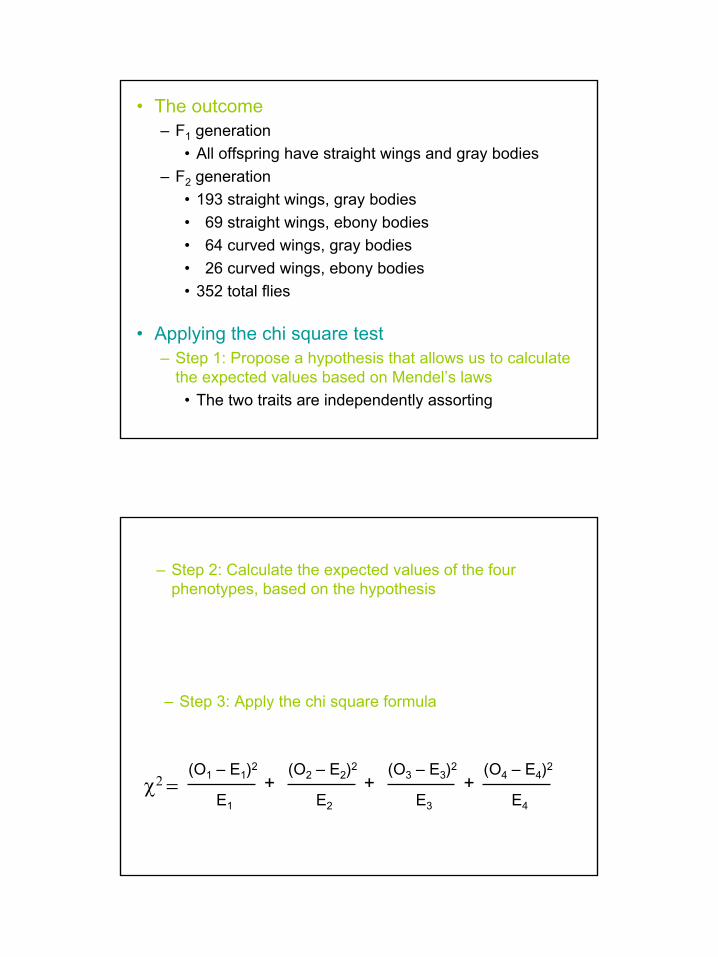
• The outcome– F1 generation
• All offspring have straight wings and gray bodies
– F2 generation
• 193 straight wings, gray bodies
• 69 straight wings, ebony bodies
• 64 curved wings, gray bodies
• 26 curved wings, ebony bodies
• 352 total flies
• Applying the chi square test– Step 1: Propose a hypothesis that allows us to calculate
the expected values based on Mendel’s laws
• The two traits are independently assorting
– Step 3: Apply the chi square formula
χ2 =(O1 – E1)2
E1
(O2 – E2)2
E2
(O3 – E3)2
E3
(O4 – E4)2
E4
+ + +
– Step 2: Calculate the expected values of the four phenotypes, based on the hypothesis
10
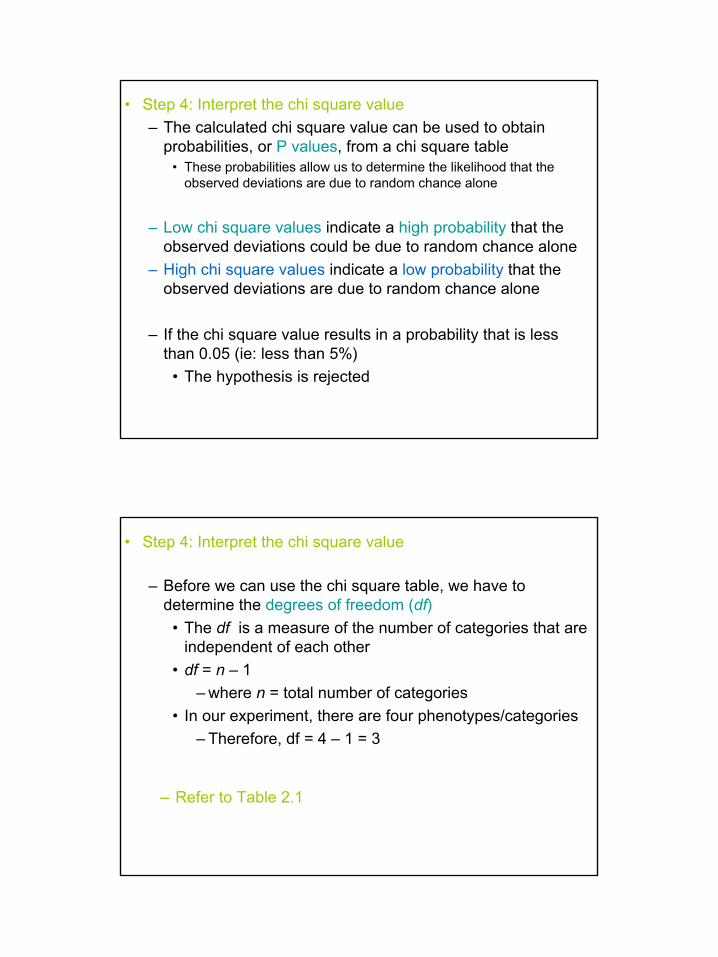
• Step 4: Interpret the chi square value
– The calculated chi square value can be used to obtain probabilities, or P values, from a chi square table
• These probabilities allow us to determine the likelihood that the observed deviations are due to random chance alone
– Low chi square values indicate a high probability that the observed deviations could be due to random chance alone
– High chi square values indicate a low probability that the observed deviations are due to random chance alone
– If the chi square value results in a probability that is less than 0.05 (ie: less than 5%)
• The hypothesis is rejected
• Step 4: Interpret the chi square value
– Before we can use the chi square table, we have to determine the degrees of freedom (df)
• The df is a measure of the number of categories that are independent of each other
• df = n – 1
– where n = total number of categories
• In our experiment, there are four phenotypes/categories
– Therefore, df = 4 – 1 = 3
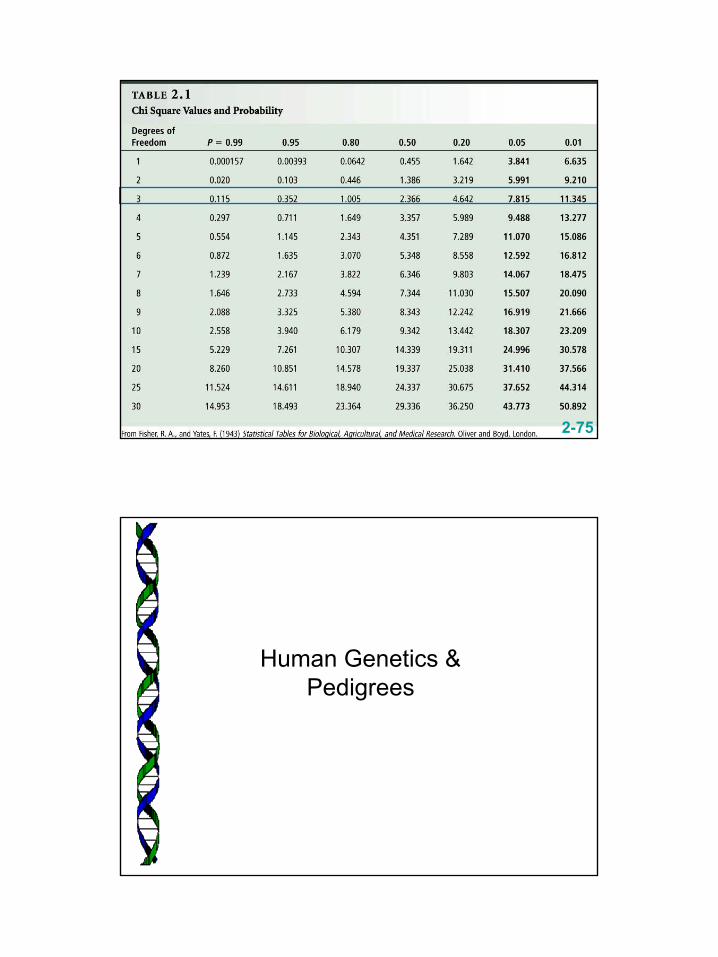
– Refer to Table 2.1
11
2-75
Human Genetics &Pedigrees
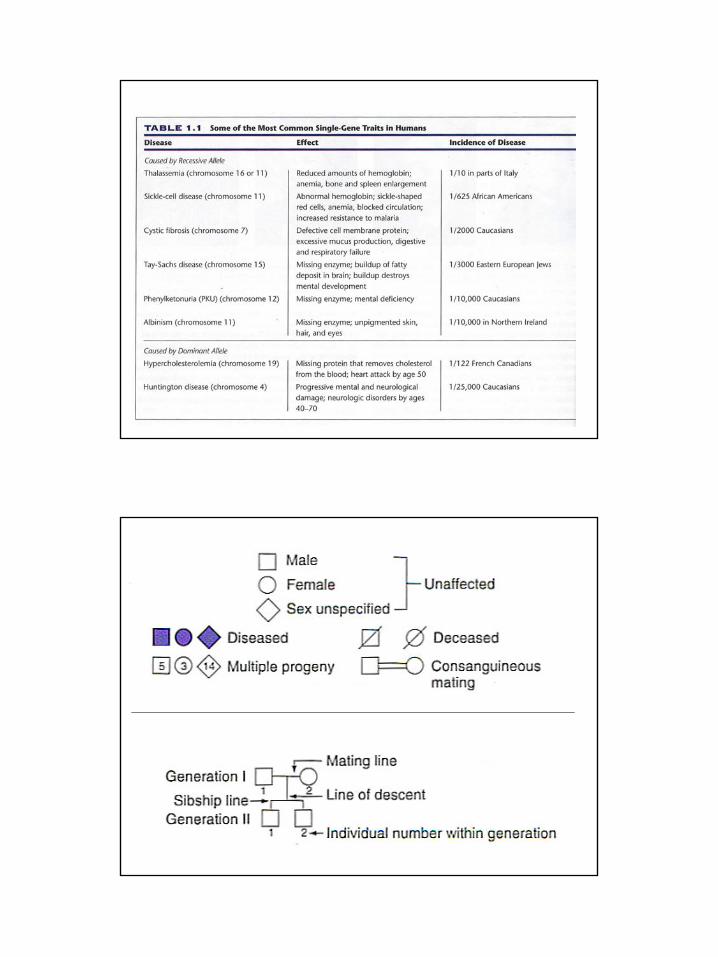
12
13
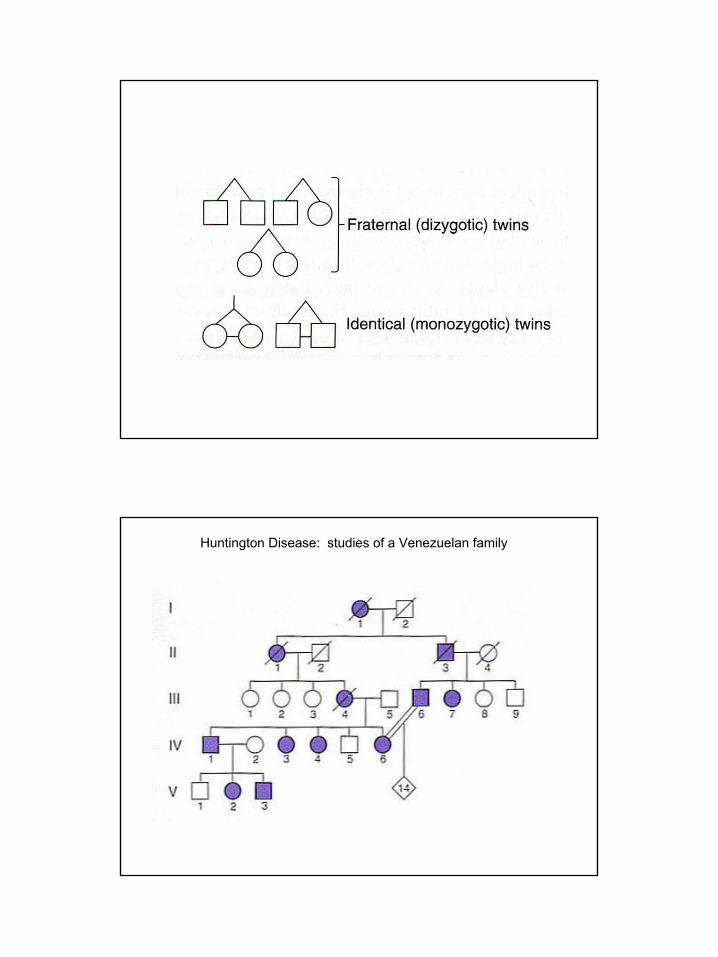
Huntington Disease: studies of a Venezuelan family
14
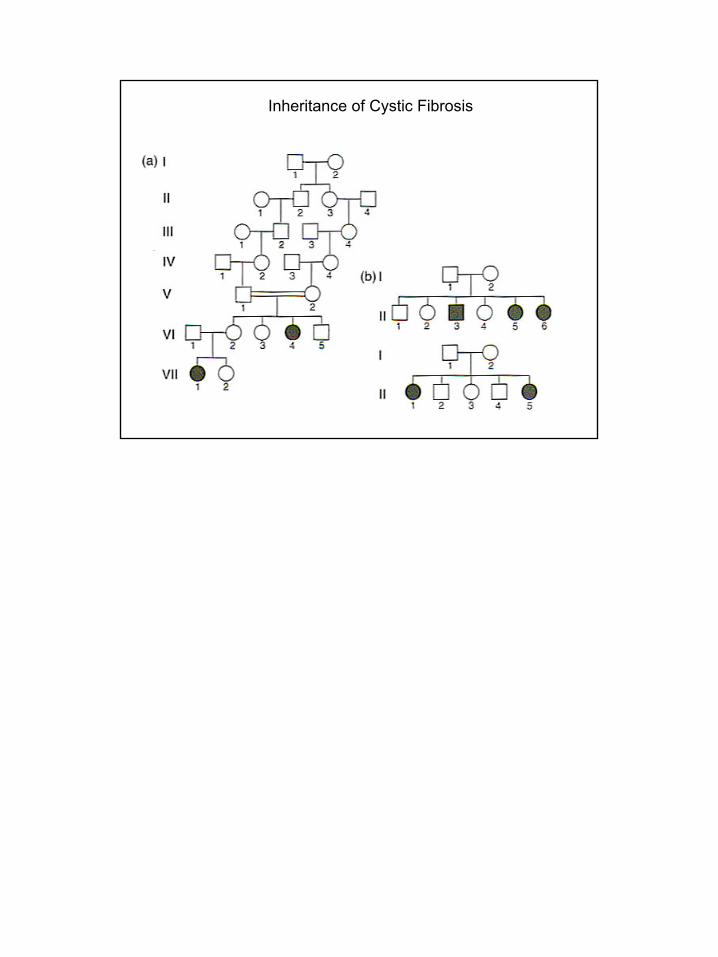
Inheritance of Cystic Fibrosis