Embed Size (px)
Citation preview

www.danamon.co.id
Vera Eve [email protected]
I Dewa Made [email protected]
Menara Bank Danamon, 6th FloorJl. Prof. Dr. Satrio Kav. E IV No.6 Jakarta 12950Tel. +62 (021) 5799 1001-03Fax. +62 (021) 5799 1445Email [email protected]
brua
ry 2
010
INVE
STOR
NEW
SLET
TER
Mass market loans grew 10% to Rp 34 trillion, •representing 54% of total loansLoans started to grow since third quarter and •increased 2% in last quarterCASAimprovedto33%oftotaldeposit,reflectingan•improvement in deposit franchiseNet operating income increased 19% to Rp 5,656 •billion supported by 13% growth in net interest incomeNet Interest Margin expanded to 12% in 2009 and •reached 13% in the last quarterEquity increased by 49% to Rp 15,806 billion bringing •CAR to 20.7% at the end of 2009
Full Year 2009 Financial Results
FY08 FY09 ∆ YoY 3Q09 4Q09 ∆ QoQINCOME STATEMENT (Rp billion)
Net Interest Income 8,354 9,462 13% 2,479 2,564 3%
Non-Interest Income 1,878 1,879 0% 546 420 (23%)
Operating Income 10,232 11,341 11% 3,025 2,984 (1%)
Operating Expenses (5,485) (5,685) 4% (1,450) (1,530) 6%
PreProvisionOperatingProfit 4,747 5,656 19% 1,575 1,454 (8%)
Cost of Credit (1,076) (2,340) 117% (660) (742) 12%
NormalizedNetProfitafterTax 2,333 2,036 (13%) 629 385 (39%)
Extraordinary Items (after Tax) (804) (504) (37%) (134) (218) 63%
ReportedNetProfitafterTax 1,530 1,532 0% 495 167 (66%)
BALANCE SHEET (Rp billion)
Total Assets 107,268 98,598 (8%) 100,128 98,598 (2%)
Total Loans 66,898 63,278 (5%) 62,145 63,278 2%
Total Government Bonds 13,083 11,011 (16%) 11,743 11,011 (6%)
Total Funding 88,029 76,613 (13%) 77,958 76,613 (2%)
Total Deposits 75,373 68,419 (9%) 69,185 68,419 (1%)
Total Equity 10,579 15,806 49% 15,619 15,806 1%
Key Financial Ratios (%)
Net Interest Margin 11.1 12.0 0.9 13.1 13.4 0.3
Cost to Income 53.6 50.1 (3.5) 47.9 51.3 3.4
Normalized Cost of Credit 1.6 3.5 1.9 4.1 4.5 0.4
Normalized ROAA 2.4 2.0 (0.4) 2.5 1.6 (0.9)
Normalized ROAE 22.3 14.9 (7.4) 17.4 10.6 (6.8)
Reported Cost of Credit 2.9 4.5 1.6 5.1 6.2 1.1
Reported ROAA 1.5 1.5 0.0 2.0 0.7 (1.3)
Reported ROAE 14.6 11.2 (3.4) 13.7 4.6 (9.1)
Loan to Deposits 86.4 88.8 2.4 86.1 88.8 2.7
Loan to Funding 75.8 82.4 6.6 79.5 82.4 2.9
Capital Adequacy (Consolidated) 15.4 20.7 5.3 20.9 20.7 (0.2)
NPL - Gross 2.3 4.5 2.2 4.0 4.5 0.5
LLP / NPL 136.7 93.8 (42.9) 97.5 93.8 (3.7)
Source: Bloomberg
1,000
2,000
3,000
4,000
5,000
0
40
60
80
100
120
20
Share price in RupiahDaily Trading Volume (Rp bn)Daily Share Price and Trading Volume
Jan Feb Mar Apr May Jun Jul Aug Sep Oct Nov Dec2009
Dec2008
Trading VolumeShare Price
2
INVESTOR NEWSLETTERFebruary 2010
DanamonreportedanetprofitaftertaxofRp1,532billionin 2009. Hence, Basic Earnings per Share (EPS) were Rp 186.36. While reported ROAA and ROAE stood at 1.5% and 11.2%, respectively, in 2009.
Income StatementNet interest income rose 13% to Rp 9,462 billion driven by margin expansion as well as higher average earnings assets. Interest income rose 11% to Rp 15,683 billion due to an increase in average earning assets and higher asset yield. Average earning assets increased 2% to Rp 84,747 billion from Rp 83,445 billion in last year supported by growing mass market loans. In 2009, asset yield improved to 18.3% from 16.8% in the same period last year partly due to higher contribution of mass market loans. Meanwhile, interest expenses rose 7% to Rp 6,221 billion in 2009 due to higher average interest-bearing funding as well as increased cost of funds. Our average funding increased 5% to Rp 82,129 billion as we strengthen ourliquiditypositioninthefaceofglobalfinancialcrisisparticularlyduringthefirsthalf of the year. Moreover, our cost of funds rose to 7.3% in 2009 from 7.0% in the same period last year on the back of tighter liquidity in the market. However, cost of funds started to decline since second quarter to 6.0% in the fourth quarter on the back of improved liquidity in the market as well as declining interest rates. Taking all together, our net interest margin expanded to 12.0% as compared to 11.1% in the previous year. Further, our net interest margin reached 13.4% in the fourth quarter, one of the highest in the sector.
Non-interest income stood at Rp 1,879 billion in 2009 due to lower credit related fees. Credit related fees, which accounted for 50% of non-interest income, declined 23% to Rp 937 billion due to lower new loan disbursements as we tigthened underwriring standards during times of global uncertainty. On the other hand, in 2009 we booked Rp 38 billion gains on sale of marketable securities, mainly government bonds, as opposed to Rp 152 billion losses in the previous year. As such, non-interest income contributed to 17% of operating income as compared to 18% in the same period last year. Overall, total operating income increased 11% to Rp 11,341 billion in 2009.
In 2009, operating expenses amounted to Rp 5,685 billion, 4% higher than Rp 5,485billioninthepreviousyear,reflectingourdiciplineexpensemanagementduring tough times. Moreover, operating expenses associated with mass market businesses increased 8% to Rp 2,818 billion in 2009 on the back of growing mass market business and represented 50% of the banks’ operating expenses. Hence, cost to income ratio improved to 50.1% as compared to 53.6% last year.
Excluding extraordinary items, our normalized cost of credit amounted to Rp 2,340 billion as compared to Rp 1,076 billion in the same period last year. The globalfinancialcrisishasimpactedemergingmarket,includingIndonesia,andinturn weakened the creditworthiness of nearly all of our customer segments, thus
Full Year 2009 Financial Results
Net Interest Margin%
20072009
2008
10.411.1
12.0
Normalized ROAA%
20072009
2008
2.4 2.4
2.0
Normalized ROAE%
20072009
2008
22.922.3
14.9
Net IncomeRp billion
20072009
2008
2,117
1,530 1,532
20072009
2008
2,117
1,530 1,532

3
INVESTOR NEWSLETTERFebruary 2010
causing an increase in non-performing loans. Hence, normalized cost of credit over average earning assets (excluding government securities) rose to 3.5% as comparedto1.6%oflastyear.Thecostofcreditinourconsumerautofinancingbusiness slightly increased to 3.4% as compared to 3.0% in the same period last year. While the cost of credit in the micro lending business stood at 4.7% in 2009 as compared to 3.2% in the previous year.
We incurred extraordinary losses of Rp 504 billion (after tax) as we set aside an additional provisioning for receivables arising from the unwound foreign exchange forward contracts (TARN) with customers. The rapid collapse of commodities’ prices combined with a sudden devaluation of Rupiah in late 2008 led to dramatic cashflowimpactofexporters,leadingtodefaultofderivatecontracts.Includingthese extraordinary items, our reported cost of credit stood at 4.5% in this year as compared to 2.9% in the same period last year.
Excluding the impact of these extraordinary items, our Normalized NPAT amounted to Rp 2,036 billion in 2009, reflecting a solid performance of core businesses. Accordingly our Normalized ROAA and ROAE stood at 2.0% and 14.9%, respectively, as compared to 2.4% and 22.3% in the previous year.
Balance SheetAs of December 2009, our outstanding loans amounted to Rp 63,278 billion, a 5% declined from Rp 66,898 billion a year earlier as an increase in mass market loans was offset by a reduction in wholesale and commercial loans. In addition, our loangrowthcontinuedtodecelerateinthefirsthalfof2009aswetightenedcreditunderwritingstandardsinfaceofglobalfinancialcrisis.
However, we continue to grow our mass market businesses. Mass market loans increased 10% to Rp 34,084 billion supported by strong growth in micro lending andconsumerautofinancingbusinesses.Hence,massmarketloansaccountedfor 54% of our loan book as of December 2009 as compared to 46% a year earlier. DSP, which serves micro and small scale enterprises, managed to grow its micro loans 12% to Rp 12,289 billion, contributing 19% of our total loan book. Our consumerautofinancingbusinessreporteda13%growthinreceivablesdespitethe industry’s salesofnewmotorcyclesandcarsdroppedsignificantly in2009.Hence our automotive loans rose to Rp 19,134 billion and contributed 30% of total loanbook.AdiraQuantum,whichoffersawhitegoodsfinancingextendedRp882billion loans at the end of 2009, an increase of 15% from Rp 767 billion a year.
Mid-size loans, which comprise of commercial and SME loans, declined 12% to Rp 16,481 billion and represented 26% of our loan book as of December 2009. Commercial loans declined 18% to Rp 7,361 billion as slower economic activities, collapse of commodity’s prices and high interest rates during the year dampened thedemandforasset-basedfinancing,investmentloansaswellastradefinancingfrom customers. Loans to Small and Medium Enterprises (SME) declined 5% to Rp9,120billionlargelyonthebackoflowerdemandforasset-basedfinancing.
Wholesale loans, which comprise of corporate banking, JFAB and FI loans, declined 32% to Rp 7,789 billion from Rp 11,518 billion a year earlier. As such, the share of wholesale loans reduced to 12% of total loans as of December 2009 from 17% a year earlier. Corporate banking loans shrunk 32% to Rp 6,500 billion largely due toa56%dropintradefinancing.Thecollapseofcommoditiespricesanddecline
Loan by SegmentAs of December 31, 2009
Mass Market54%
Wholesale12% Retail
8%
SME &Commercial26%
Outstanding LoansRp trillion
53.3
63.366.9
20072009
2008
Normalized Cost of Credit%
20072009
2008
2.3
1.6
3.5
Cost to Income Ratio%
20072009
2008
47.9
53.6
50.1

4
INVESTOR NEWSLETTERFebruary 2010
intradeactivitieshavereducedmarkedlythedemandfortradefinancing.Whileloans originated from joint financing and asset buy (JFAB)with other financecompanies also declined 32% to Rp 1,265 billion.
As of December 2009, non-performing loans were Rp 2,802 billion as compared toRp1,534billionayearearlier,reflectingandeterioratedoperatingenvironmentduring the year which in turn impacted unfavourably the credit quality of customers across all segments. Hence, non-performing loans (NPL) ratio rose to 4.5% as of December 2009 from 2.3% a year earlier. NPL ratio in micro lending business stood at 4.7% as compared to 3.8% in the previous year. While NPL ratio inautofinancingbusinesswasmaintainedatbelow1% level. However,net NPL remained 2.5% after taking into account the collateral value of some loans, particularly for corporate, commercial, SME and mortgage loans. Further, the ratio of loan loss provision to loan improved to 3.6% from 2.4% a year earlier.
Our government bonds portfolio reduced gradually to Rp 11,011 billion from Rp 13,083 billion last year as we sold some government bonds in the last quarters. As such, government bonds only accounted for 11% of assets as of December 2009 as compared to 12% a year earlier. Fixed rate bonds amounted to Rp 4,842 billion and made up 44% of the bond portfolio while the remaining 56% were floatingratebonds.
Customer deposits amounted to Rp 68,419 billion as of December 2009, accounting for 89% of our total funding. Our customer deposits were 9% lower than the previous year’s deposits of Rp 75,373 billion due to a reduction in time deposits. While current account and savings increased 4% and 20% to Rp 7,398 billionandRp15,370billion,respectively,reflectingtheimprovementinourdepositfranchise. As such, current account and saving account (CASA) contributed to 33% of customer deposits as of December 2009 as compared to 26% a year earlier. Time deposits reduced 18% to Rp 45,651 billion as we released expensive time deposits in the last three quarters following the bank’s improved liquidity position as well as strong capital base. As a result, our loan to deposit ratio (LDR) stood at 88.8% as of December 2009 from 86.4% a year earlier.
The remaining 11% of our funding is comprised of long-term funding, which includes senior bonds, securities sold under repurchase agreements (REPO) and other long-term borrowings. Our long-term funding reduced 35% to Rp 8,194 billion compared to Rp 12,656 billion of last year due to the repayment of USD 300 million sub-debt in March 2009. Taken all together, our total funding decreased 13% to Rp 76,613 billion. As such, our loan to total funding ratio stood at 82.4% as of December 2009, still reflecting a liquid balance sheet.
Consolidated capital adequacy ratio (CAR) improved to 20.7% as of December 2009 from15.4% a year earlier reflecting strong capital base and one of the highest in the country. We raised approximately Rp 4 trillion from this rights issue, which strengthened Tier 1 Capital to 19.3% as of December 2009 from 13.8% a year earlier. While Tier 2 Capital declined to 1.4% as of December 2009 from 1.6% a year earlier due to the repayment of USD 300 million sub-debt in March 2009. Furthermore, our equity to asset ratio stood at a high 16.0% as of December 2009 as compared to 9.9% in the previous year, enabling continued business growth.
CASA
Time Deposit
2007
20092008
41.4 45.7
55.4
18.1 19.9 22.8
Third Party FundRp trillion
Consolidated CAR%
2007
20092008
14.4
19.3
13.8
5.9
1.61.4
Tier 1 Capital
Tier 2 Capital
LDR%
20072009
2008
88.1
86.4
88.8
NPL%
20072009
2008
2.2 2.3
4.5

5
INVESTOR NEWSLETTERFebruary 2010
UPDATEBusiness Updates �
Consumer auto financing business• Ourconsumerautofinancingbusinessismanagedthrougha95%ownedsubsidiary, Adira Finance. Currently Adira Finance operates a branch network of 319 outlets and employs 15,957 staffs across the country.
Earnings of Adira Finance declined 2% to Rp 984 billion in 2009 mainly due to an increase in cost of credit. Hence its ROAA and ROAE stood at 5.6% and 37.6%, respectively, in 2009
Net interest income increased 11% to Rp 2,997 billion on the back of higher average receivables, which rose 15% to Rp 17,169 billion. Interest income rose 18% to Rp 5,086 billion due to improved asset yield as well as higher average receivables. On the other hand, interest expenses increased 31% to Rp 2,126 billion due to higher cost of fund.
Operating expenses amounted to Rp 1,134 billion, an increase of 10% over the same period last year. As such, its cost to income ratio increased to 36.8% in 2009 as compared to 35.7% of previous year.
Credit cost rose 27% to Rp 580 billion driven by higher average receivables as well as higher non-performing loans. As such, cost of credit over average receivables stood at 3.4% in 2009 as compared to 3.0% in the previousyearreflectingofdeterioratedoperatingenvironment.
In2009,newfinancingamountedtoRp14,541billion,anincreaseof4%from the same period last year despite the industry’s auto sales dropped during the year. Industry’s sales for new motorcycle and new car slid by 6% and 20%, respectively, to 5.9 million units and 486 thousand units in 2009.AdiraFinance’smarketshareinnewmotorcyclefinancingstoodat 13% in 2009.
Self Employed Mass Market (SEMM)• Self Employed Mass Market business, known as Danamon Simpan Pinjam (DSP), targets and serves micro and small scale enterprises.
DSP currently operates two business models: 1) Wet Market and 2) Supply Chain. Its Wet Market Model operates 801 DSP units in big traditional wet markets and 200 Mobile Units in smaller markets. Its Supply Chain Model, which was introduced in July 2007, targets traders at the low end ofsupplychainsandoperates246SalesOfficesacrossthecountry.
DSP extended Rp 8,305 billion of new loans in 2009, an increase of 4% compared to same period last year. As such, its outstanding loans grew 12% to Rp 12,289 billion as of December 2009. While its cost of credit stood at 4.7% in 2009 as compared to 3.2% of last year.
Automotive LoansRp billion
Motorcycle
Car
14,060 12,874
4,133 5,073
20082009
10,173
3,212
2007
12,289
10,965
20082009
Micro LoansRp billion
8,600
2007

6
INVESTOR NEWSLETTERFebruary 2010
Corporate Updates �IFRS Compliance (PSAK 50 and 55)•
We are implementing PSAK 50 & 55 in 2010. The implementation -of these new accounting standards is estimated to have a positive impact to our retained earnings.
Implementation of Basel II•We will start to implement capital charge for operational risk (as part -of Basel II) starting January 2010 toward the full implementation by 2011.
The impact of the implementation of capital charge for operational -risk is estimated to lower our CAR by approximately 2% this year.
AGMS / EGMS•We plan to hold our annual general meeting of shareholders on 29 April 2010 with agenda among others:
Toapprovethebank’sannualreportforfinancialyear2009 -
Toapprovetheappropriationofthebank’s2009netprofit -
To approve changes in the Board of Directors -
Payment of Dividend•We plan to pay out 50% of our 2009 NPAT or Rp 766 billion as dividend -subject to shareholders’ approval.
Credit Rating �
Bank Danamon Ratings and Outlook
PEFINDO (Indonesia)March 2009
Corporate RatingBond Rating
idAA+ / Stable
idAA+ / Stable
Standard & Poor’sOctober 2009
Long Term / Short Term Local CurrencyLong Term / Short Term Foreign Currency
BB- / B / PositiveBB- / B / Positive
Fitch RatingsJanuary 2010
Long Term / Short Term Foreign CurrencyNational (Long-Term)Individual / Support Rating
BB+ / B / StableAA+ (idn) / StableC/D / 3 / Stable
Moody’sSeptember 2009
Global Local Currency DepositForeign Currency Long Term / Short Term DepositBank Financial Strength Rating (BFSR)
Baa3 / P-3 / StableBa3 / NP / StableD / Stable

7
INVESTOR NEWSLETTERFebruary 2010
BALANCE SHEETSAS AT 31 DECEMBER 2009 AND 2008(In million Rupiah)
NO ACCOUNTS BANK DANAMON CONSOLIDATED2009 2008 2009 2008
ASSETS1. Cash 2,088,903 4,129,491 2,117,368 4,161,520 2. Placements with Bank Indonesia
a. Current accounts with Bank Indonesia 3,820,180 2,820,413 3,820,180 2,820,413 b.CertificatesofBankIndonesia 3,788,098 3,175,781 3,788,098 3,200,781 c.WadiahCertificatesofBankIndonesia - - - - d. Others 1,134,253 1,538,422 1,134,253 1,538,422
3. Current accounts with other banksa. Rupiah 39,261 108,935 264,230 354,890 b. Foreign currencies 1,657,152 3,279,258 1,660,240 3,285,261 Allowance for possible losses on current accounts with others banks -/- (16,964) (33,882) (16,964) (33,882)
4. Placements with other banksa. Rupiah 425,000 44,000 1,023,200 360,005 Allowance for possible losses on placements with other banks -/- (4,250) (440) (4,250) (440)b. Foreign currencies 916,919 664,900 919,276 669,323 Allowance for possible losses on placements with other banks -/- (9,169) (6,649) (9,169) (6,649)
5. Placement with other sharia banks - - - - Allowance for possible losses on placement with other sharia banks -/- - - - -
6. Marketable securitiesa. Rupiah i. Trading - - - - ii. Available for sale 241,320 249,167 241,320 288,583 iii. Held to maturity 1,197,865 1,043,373 1,197,865 1,043,375 Allowance for possible losses on marketable securities -/- (13,916) (12,568) (13,916) (12,568)b. Foreign currencies i. Trading - - - - ii. Available for sale 96,157 144,971 96,157 144,971 iii. Held to maturity 71,740 185,482 71,740 185,482 Allowance for possible losses on marketable securities -/- (1,789) (3,300) (1,789) (3,300)
7. Marketable securities - sharia bonds 180,000 220,091 180,000 220,091 Allowance for possible losses on marketable securities - sharia bonds -/- (1,800) (2,201) (1,800) (2,201)
8. Government Bonds i. Trading 216,285 437,552 216,285 437,552 ii. Available for sale 8,160,325 9,931,108 8,460,226 10,167,738 iii. Held to maturity 2,218,074 2,357,800 2,334,316 2,478,048
9. Securities purchased under resale agreements (Reverse Repo)a. Rupiah - - - - Allowance for possible losses on securities purchased under resale agreements -/- - - - - b. Foreign currencies - - - - Allowance for possible losses on securities purchased under resale agreements -/- - - - -
10. Derivative receivables 325,571 2,411,566 325,571 2,411,566 Allowance for possible losses on derivative receivables -/- (3,468) (660,150) (3,468) (660,150)
11. Loans a. Rupiah i. Related parties 4,709 12,723 4,709 12,723 ii. Third parties 54,382,869 55,397,635 54,382,869 55,397,635 Allowance for possible losses on loans -/- (1,981,316) (1,397,995) (1,981,316) (1,397,995)Deferred income -/- (84) (84) (84) (84)b. Foreign currencies i. Related parties - - - - ii. Third parties 5,444,520 8,823,548 5,444,520 8,823,548 Allowance for possible losses on loans -/- (220,218) (165,250) (220,218) (165,250)Deferred income -/- - - - -
12. Consumerfinancingreceivables - - 2,698,426 1,914,512 Allowanceforpossiblelossesonconsumerfinancingreceivables-/- - - (43,752) (37,800)
13. Premium receivable - - 28,873 22,303 Allowance for possible losses on premium receivable -/- - - (17) (20)
14. iBreceivablesandfinancingwithcontracta. Murabaha 280,382 290,454 280,382 290,454 b. Istishna - - - - c. Qardh 32,621 37,974 32,621 37,974 d. Mudharabah 434,174 420,788 434,174 420,788 e. Musyarakah - - - - AllowanceforpossiblelossesoniBfinancingandreceivables-/- (10,087) (9,319) (10,087) (9,319)
15. Acceptance receivables 1,120,111 865,914 1,120,111 865,914 Allowance for possible losses on acceptance receivables -/- (10,824) (9,315) (10,824) (9,315)
16. Investments 4,755,919 2,136,073 85,735 12,175 Allowance for possible losses on investments -/- (68,019) (21,362) (21,316) (122)
17. Goodwill - net - - 1,281,900 250,451 18. Interest receivable 755,868 950,025 767,051 958,765 19. Prepaid expenses 405,461 355,182 500,538 452,584 20. Prepaid taxes - - - - 21. Deferred tax assets 965,806 842,632 980,280 850,038 22. Fixed assets 3,053,078 2,835,331 3,510,268 3,262,211
Accumulateddepreciationoffixedassets-/- (1,471,196) (1,169,871) (1,707,994) (1,357,187)23. Unutilised properties 26,250 35,799 26,250 35,799
Allowance for possible losses on unutilised properties -/- (10,023) (4,466) (10,023) (4,466)24. Leased assets - - - -
Accumulated depreciation of leased assets -/- - - - - 25. Foreclosed assets 179,743 94,518 183,919 97,715
Allowance for possible losses on foreclosed assets -/- (8,592) (5,889) (8,592) (5,889)26. Other assets 2,043,315 2,483,761 3,050,581 3,501,390
TOTAL ASSETS 96,630,214 104,821,926 98,597,953 107,268,363

8
INVESTOR NEWSLETTERFebruary 2010
BALANCE SHEETSAS AT 31 DECEMBER 2009 AND 2008(In million Rupiah)
NO ACCOUNTS BANK DANAMON CONSOLIDATED2009 2008 2009 2008
LIABILITIES AND EQUITY1. Current accounts
a. Rupiah 4,878,062 4,794,398 4,568,416 4,616,169 b. Foreign currencies 2,173,620 2,213,475 2,172,155 2,207,538
2. iB current accounts 117,674 70,315 117,674 70,315 3. Other current liabilities 151,461 210,256 167,074 226,268 4. Savings 15,247,153 12,730,488 15,247,153 12,730,488 5. Sharia savings
a. iB deposit savings 1,561 1,475 1,561 1,475 b. iB savings 115,454 115,430 115,454 115,430
6. Time depositsa. Rupiah i. Related parties 284,690 426,547 42,370 97,048 ii. Third parties 40,279,517 46,602,540 40,279,517 46,602,540 b. Foreign currencies i. Related parties 21,062 19,711 8,614 10,391 ii. Third parties 4,257,475 7,165,874 4,257,475 7,165,874
7. iB time deposits 405,839 351,810 405,839 351,810 8. Certificatesofdeposits
a. Rupiah - - - - b. Foreign currencies - - - -
9. Deposits from other banks 1,202,939 1,470,781 1,202,939 1,470,781 10. Securities sold under repurchase agreement (Repo) 3,754,370 4,914,104 3,754,370 4,914,104 11. Deferred premium income - - 415,223 386,541 12. Unearned premium reserve - - 259,146 227,114 13. Derivative payables 327,836 2,485,908 327,836 2,485,908 14. Acceptance payables 1,170,870 907,459 1,170,870 907,459 15. Marketable securities issued
a. Rupiah 1,500,000 1,500,000 2,050,855 2,234,043 b. Foreign currencies 234,959 128 234,959 128
16. Borrowingsa. Short term funding facilities from Bank Indonesia - - - - b. Othersi. Rupiah - Related parties - - - - - Third parties 1,005,976 1,284,340 1,230,976 1,380,173 ii. Foreign currencies - Related parties - - - - - Third parties 1,162,914 1,164,028 1,162,914 1,164,028
17. Estimated allowance for possible losses on commitments and contingencies 30,734 27,411 30,734 27,411 18. Lease payables - - - - 19. Accruals 410,791 502,347 412,090 508,636 20. Estimated tax payable 82,283 56,956 145,287 299,225 21. Deferred tax liabilities - - 218,984 213,278 22. Other liabilities 1,487,662 1,457,513 2,195,482 1,975,359 23. Subordinated loans
a. Related parties - - - - b. Third parties 500,000 3,769,564 500,000 3,769,564
24. Loan capitala. Related parties - - - - b. Third parties - - - -
25. Minority interests - - 96,235 530,197 26. Equity
a. Paid up capital 5,303,992 3,631,865 5,303,992 3,631,865 b. General and legal reserve 118,709 103,409 118,709 103,409 c. Additional paid up capital 2,964,113 675,000 2,964,113 675,000 d. Difference in transaction of changes in equity of subsidiaries (13,206) (73,653) (32,767) (73,653)e. Capital donation - - - - f.Foreignexchangedifferencefromtranslationoffinancialstatements 1,996 2,866 1,996 2,866 g. Unrealized gain/(loss) from available for sale marketable securities and Government Bonds
(291,926) (749,832) (291,926) (749,832)
h. Other comprehensive income - - - - i. Retained earnings*) 7,741,634 6,989,413 7,741,634 6,989,413 TOTAL LIABILITIES AND EQUITY 96,630,214 104,821,926 98,597,953 107,268,363
*)AfterbeingeliminatedwithdeficitofRp32,968,831throughquasi-reorganisationon1January2001.

9
INVESTOR NEWSLETTERFebruary 2010
STATEMENTS OF INCOME AND RETAINED EARNINGSFOR THE YEARS ENDED 31 DECEMBER 2009 AND 2008(In million Rupiah, except earning per share)
NO ACCOUNTS BANK DANAMON CONSOLIDATED2009 2008 2009 2008
INCOME AND EXPENSES FROM OPERATIONS 1. Interest income, fees and commissions
1.1. Interest income a. Rupiah 11,808,433 10,667,028 14,867,855 13,202,691 b. Foreign currencies 712,976 892,168 712,976 892,168 1.2. Fees and commissions income a. Rupiah 889,154 870,525 1,966,520 1,859,675 b. Foreign currencies 16,813 69,980 16,813 69,980 Total interest income, fees and commissions 13,427,376 12,499,701 17,564,164 16,024,514
2. Interest expense, fees and comissions2.1. Interest expense a. Rupiah 5,616,035 4,879,507 5,680,229 4,992,815 b. Foreign currencies 353,597 649,709 353,597 649,709 2.2. Fees and commissions expense 291,946 213,253 1,248,493 1,006,623 Total interest expense, fees and commissions 6,261,578 5,742,469 7,282,319 6,649,147
3. Underwriting income3.1. Premium income - - 633,132 520,674 3.2. Underwriting expense - - 337,130 275,594 Total underwriting income - - 296,002 245,080 Net interest and underwriting income 7,165,798 6,757,232 10,577,847 9,620,447
4. Sharia income4.1. Margin 37,316 29,261 37,316 29,261 4.2.Profitsharing 64,630 64,723 64,630 64,723 4.3. Bonus income - 491 - 491 Total sharia income 101,946 94,475 101,946 94,475
5. Sharia expenses5.1. iB loss sharing 40,563 56,580 40,563 56,580 5.2. iB bonus expense 848 443 848 443 Total sharia expenses 41,411 57,023 41,411 57,023 Net interest income - sharia 60,535 37,452 60,535 37,452
6. Other operating income6.1. Fees and commisions 203,666 189,302 203,708 189,370 6.2. Gain on foreign exchange transactions 256,992 844 254,457 6,483 6.3. Gain from increase in fair value of marketable securities Government Bonds - 19,775 - 19,775 6.4. Other income 439,479 414,105 448,178 419,477 Total other operating income 900,137 624,026 906,343 635,105
7. Income from investment in subsidaries 1,384,024 925,311 - - 8. Allowance for possible losses in assets 2,857,590 1,808,756 2,890,269 1,834,556 9. Allowance for possible losses/(gain) on commitments and contingencies 4,889 (15,715) 4,889 (15,715)
10. Other operating expenses10.1. General and administrative expenses 1,777,142 1,549,844 2,196,060 1,947,826 10.2.Salariesandemployeebenefits 2,102,538 2,270,214 3,003,028 3,058,580 10.3. Losses from decline in fair value of marketable securities and Government Bonds 1,477 - 1,477 - 10.4. Losses on foreign exchange transactions - - - - 10.5. Third party premium expenses 145,579 135,308 145,579 135,308 10.6. Promotion expenses 235,417 291,679 266,997 323,856 10.7. Others expenses 143,176 290,943 254,314 337,452 Total other operating expenses 4,405,329 4,537,988 5,867,455 5,803,022 NET OPERATING INCOME 2,242,686 2,012,992 2,782,112 2,671,141 NON-OPERATING INCOME AND EXPENSES
11. Non - operating income 70,172 340,064 228,127 475,852 12. Non - operating expenses 325,720 319,760 432,314 380,672
Non - operating (expenses)/income - net (255,548) 20,304 (204,187) 95,180 13. Amortisation of goodwill 207,365 88,484 207,365 88,484 14. Extraordinary (expense)/income - - - -
INCOME BEFORE TAX 1,779,773 1,944,812 2,370,560 2,677,837 15. Income tax-/-
- Deferred (317,466) (312,835) (313,810) (291,483) - Current year 564,706 727,625 1,070,648 1,167,316
16. INCOME AFTER TAX 1,532,533 1,530,022 1,613,722 1,802,004 17. Minority interest -/- - - (81,189) (271,982)18. CURRENT YEAR INCOME 1,532,533 1,530,022 1,532,533 1,530,022 19. Retained earnings at the beginning of the year 6,989,413 6,595,065 6,989,413 6,595,065 20. Dividend -/- (765,012) (1,058,457) (765,012) (1,058,457)21. Others -/- (15,300) (77,217) (15,300) (77,217)22. Retained earnings at the end of the year 7,741,634 6,989,413 7,741,634 6,989,413 23. Basic earnings per share 186.36 303.70 186.36 303.70 24. Diluted earnings per share*) 179.13 305.96 179.13 305.96
*)AfterconsideringtheeffectofstockoptionsgrantedtoqualifiedemployeesofBankDanamon.

10
INVESTOR NEWSLETTERFebruary 2010
STATEMENTS OF COMMITMENTS AND CONTINGENCIESAS AT 31 DECEMBER 2009 AND 2008(In million Rupiah)
NO ACCOUNTS BANK DANAMON CONSOLIDATED2009 2008 2009 2008
COMMITMENTCommitment receivables
1. Unused borrowing facilitiesa. Rupiah - 327,000 - 327,000 b. Foreign currencies - - - -
2. Others - - - - Total commitment receivables - 327,000 - 327,000 Commitment payables
1. Unused loans facilities a. Rupiah - - - - b. Foreign currencies - - - -
2. Outstanding irrevocable letters of credit 1,113,562 497,795 1,113,562 497,795 3. Others - - - -
Total commitment payables 1,113,562 497,795 1,113,562 497,795 COMMITMENT PAYABLES -NET (1,113,562) (170,795) (1,113,562) (170,795)CONTINGENCIESContingent receivables
1. Guarantees receiveda. Rupiah - - - - b. Foreign currencies 41,942 267,173 41,942 267,173
2. Interest receivables on non performing assetsa. Rupiah 268,734 215,151 268,734 215,151 b. Foreign currencies 31,427 23,624 31,427 23,624
3. Others - 938 - 938 Total contingent receivables 342,103 506,886 342,103 506,886 Contingent payables
1. Guarantees issued in the form of :a. Bank guarantees - Rupiah 1,720,247 1,566,463 1,720,247 1,566,463 - Foreign currencies 476,230 693,328 476,230 693,328 b. Others - - - -
2. Standby letters of credit - - - - 3. Others - - - -
Total contingent payables 2,196,477 2,259,791 2,196,477 2,259,791 CONTINGENT PAYABLES - NET (1,854,374) (1,752,905) (1,854,374) (1,752,905)
11
INVESTOR NEWSLETTERFebruary 2010
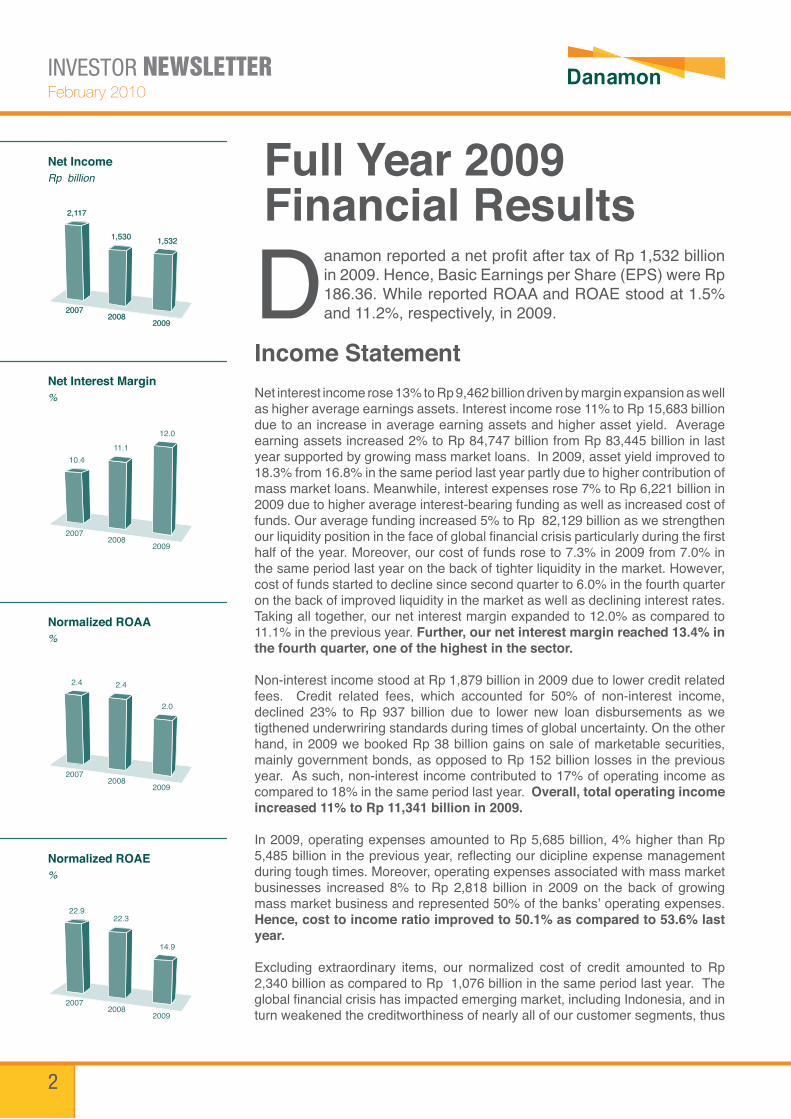
ASSET QUALITY AND OTHER INFORMATIONAS AT 31 DECEMBER 2009 AND 2008(In million Rupiah)
NO ACCOUNTS 2009 2008 Current Special
Mention Sub-
standard Doubtful Loss Total Current Special Mention
Sub-standard Doubtful Loss Total
I. Related parties
A. Earning assets
1. Placement with other banks 708,089 - - - - 708,089 1,378,202 - - - - 1,378,202 2. Marketable securities and Government Bonds
issued by third parties or Bank Indonesia - - - - - - - - - - - - 3a. Loans to third parties
a. Small business credit (KUK) - - - - - - - - - - - -
b. Property loans
i. Restructured - - - - - - - - - - - -
ii. Unrestructed - - - - - - - - - - - -
c. Other restructured loans - - - - - - - - - - - - d. Others 4,709 - - - - 4,709 12,723 - - - - 12,723
3b. iBreceivablesandfinancingwithcontract - - - - - - - - - - - -
4. Investment in third parties
a.Non-bankfinancialinstitution 4,047,363 - - - - 4,047,363 1,746,645 - - - - 1,746,645
b. For loans restructuring - - - - - - - - - - - -
c. Others 622,916 - - - - 622,916 377,348 - - - - 377,348
5. Other receivables from third parties - - - - - - - - - - - -
6. Commitments and contingencies to third parties - - - - - - 25 - - - - 25
B. Non earning assets
1. Unutilised properties - - - - - - - - - - - -
2. Foreclosed assets - net - - - - - - - - - - - -
3. Interbank and suspense account - - - - - - - - - - - -
II. Third parties
A. Earning assets
1. Placement with other banks 4,370,471 48 - - 8,833 4,379,352 5,159,605 - - 30,552 - 5,190,157 2. Marketable securities and Government Bonds
issued by third parties or Bank Indonesia 15,971,870 - 757 - - 15,972,627 18,101,474 - - - - 18,101,474 3a. Loans to third parties
a. Small business credit (KUK) 7,459,138 792,996 150,701 192,633 166,955 8,762,423 9,562,156 966,482 153,152 139,192 136,476 10,957,458
b. Property loans
i. Restructured 184,814 33,232 3,448 35,866 4,026 261,386 10,300 10,785 602 3,094 26,264 51,045
ii. Unrestructured 5,557,452 437,752 9,134 9,190 13,500 6,027,028 6,897,309 458,107 5,525 4,557 15,595 7,381,093
c. Other restructured loan 254,877 490,283 228,923 61,643 174,302 1,210,028 100,115 140,259 38,690 12,110 78,820 369,994
d. Others 37,539,899 3,897,524 584,232 550,051 602,471 43,174,177 40,198,895 3,816,231 284,977 147,202 452,896 44,900,201
3c. iBreceivablesandfinancingwithcontract 708,726 7,506 1,199 1,751 3,084 722,266 692,875 6,243 1,050 2,587 701 703,456
4. Investment in third parties
a.Non-bankfinancialinstitution - - - - - - - - - - - -
b. For loans restructuring - - 73,560 - - 73,560 - - - - - -
c. Others 2,355 25 - - - 2,380 2,355 25 - - - 2,380
5. Other receivables from third parties 1,907,984 3,235 259,077 148,160 128,069 2,446,525 2,612,889 803,077 46,766 - 104,274 3,567,006
6. Commitments and contingencies to third parties 3,276,343 33,696 - - - 3,310,039 2,742,231 14,280 1,050 - - 2,757,561
B. Non earning assets
1. Unutilised properties 5,480 - 1,033 19,737 - 26,250 6,027 - 29,772 - - 35,799
2. Foreclosed assets - net 138,685 - 34,107 6,951 - 179,743 55,260 - 39,258 - - 94,518
3. Interbank and suspense account 1,577 - - - 1,231 2,808 3,819 - - - 171 3,990
TOTAL 82,762,748 5,696,297 1,346,171 1,025,982 1,102,471 91,933,669 89,660,253 6,215,489 600,842 339,294 815,197 97,631,075 1. a. Minimum required allowance for possible
losses on earning assets 648,557 246,039 181,329 469,658 832,074 2,377,657 703,283 282,251 66,457 165,443 603,391 1,820,825 b. Minimum required allowance for possible losses on non earning assets - - 5,271 13,344 1,231 19,846 - - 10,355 - 171 10,526 c. Total minimum requires allowance for possible losses 648,557 246,039 186,600 483,002 833,305 2,397,503 703,283 282,251 76,812 165,443 603,562 1,831,351
2. a. Allowance for possible losses on earning assets (excluding iB receivables and financingwith contract ) 1,141,878 264,077 414,201 587,912 832,434 2,240,502 1,093,782 729,196 88,065 164,934 647,888 2,723,865 b.Allowance iB receivables and financingwithcontract - - - - - - 7,511 246 127 509 467 8,860 d. Allowance for possible losses on non earning assets - - 5,271 13,344 1,231 19,846 - - 10,355 - 171 10,526 e. Total allowance for possible losses 1,141,878 264,077 419,472 601,256 833,665 3,260,348 1,101,293 729,442 98,547 165,443 648,526 2,743,251
3. Collateralised assets
a. To Bank Indonesia 62,560 62,560
b. To other banks - -
4. Percentage of small business credit to total loan 15.10% 17.53%5. Percentage of total small business credit debtors
to total debtors 8.88% 10.92%6. Percentage of small medium enterprise credit
to total loans 74.41% 68.02%7. Percentage of total small medium Erise debtors
to total debtors 99.97% 99.97%

12
INVESTOR NEWSLETTERFebruary 2010
STATEMENT OF FOREIGN EXCHANGE AND DERIVATIVE TRANSACTIONSAS AT 31 DECEMBER 2009(In million Rupiah)
NO TRANSACTION Market Value Derivative Receivable and Payables Net Market Value
Hedging Others Receivables Payables
A. Related to exchange rate
1. Spot - 147,222 363 (257) -
2. Forwards - 175,030 986 (2,946) -
3. Options
a. Purchased - 822,910 163,672 - -
b. Written - 822,910 (163,672) -
4. Futures - 535,515 339 (28) -
5. Swaps - 3,407,276 73,555 (65,307) -
6. Others - - - - -
B. Related to interest rate
1. Forwards - - - - -
2. Options
a. Purchased - - - - -
b. Written - - - - -
3. Futures - - - - -
4. Swaps - 3,640,788 86,656 (95,626) -
5. Others - - - - -
C. Others - - - - -
TOTAL 325,571 (327,836)
Notes:Market value represents total notional amount buy and sell position at gross basis.Anationalamountisanumberofcurrencyunitsspacifiedinthecontract.Derivative receivables/payables represent the settlement value of a derivative instrument on balances sheet date.

13
INVESTOR NEWSLETTERFebruary 2010
CAPITAL ADEQUACY RATIO CALCULATIONAS AT 31 DECEMBER 2009 AND 2008(In million Rupiah)
NO DESCRIPTION 2009 2008I. COMPONENTS
A. CORE CAPITAL 14,616,964 10,237,047
1. Paid up capital 5,303,992 3,631,865
2. Disclosed reserves
a. Additional paid up capital 2,926,883 562,069
b. Discount on nominal value of shares ( -/- ) - -
c. Capital donation - -
d. Generalandspecificreserves 118,709 103,409
e. Prioryears'profitaftertax 5,658,071 5,322,362
f. Prior years' losses (-/-) - -
g. Currentyearprofitnetoftaxes(50%) 607,313 614,476
h. Current year loss (-/-) - -
i. Difference in foreign currency translation of overseas branch
1) Positive adjusment 1,996 2,866
2) Negative adjusment (-/-) - -
j. Paid up capital fund - -
k. Decline in fair value of available for sale securities - -
3. Goodwill (-/-) - -
4. Differences arising from the revaluation of the assets and liabilities due to the quasi reorganisation - -
B. SUPPLEMENTARY CAPITAL (Max. 100% of core capital) 1,205,239 1,390,971
1. Reservefromrevaluationoffixedassets - -
2. Differences arising from the revaluation of the assets and liabilities due to the quasi reorganisation - -
3. General allowance for possible losses on earning assets
(max 1.25% of weighted risk-based assets) 790,659 727,493
4. Loan capital - -
5. Subordinated loan (max 50% of core capital) 414,580 663,478
6. Increase in fair value of available for sale securities (45%) - -
C. TOTAL SUPPLEMENTARY CAPITAL WHICH FULFILL THE REQUIREMENTS - - D . ADDITIONAL SUPPLEMENTARY CAPITAL ALLOCATED TO ANTICIPATE MARKET RISK - -
II. TOTAL CORE AND SUPPLEMENTARY CAPITAL (A+B) 15,822,203 11,628,018 III. TOTAL CORE, SUPLEMENTARY CAPITAL AND ADDITIONAL SUPLEMENTARY CAPITAL
ALLOCATED TO ANTICIPATE MARKET RISK(A+B+D) 15,822,203 11,628,018 IV. INVESTMENTS ( -/- ) 4,670,280 2,136,073
V. TOTAL CAPITAL FOR CREDIT RISK (II-IV) 11,151,923 9,491,945
VI. TOTAL CAPITAL FOR CREDIT RISK AND MARKET RISK (III-IV) 11,151,923 9,491,945
VII. RISK WEIGHTED ASSETS - CREDIT RISK 62,941,010 67,853,672
VIII. RISK WEIGHTED ASSETS - MARKET RISK 617,972 3,129,312
IX. CAPITAL ADEQUACY RATIO WITH CREDIT RISK CHARGE (V : VII) 17.72% 13.99%
X. CAPITAL ADEQUACY RATIO WITH CREDIT RISK AND MARKET RISK CHARGE (VI : (VII +VIII)) 17.55% 13.37%
XI. EXCESS OF ADDITIONAL SUPPLEMENTARY CAPITAL RATIO ((C-D) : (VII + VIII)) - -
XII. MINIMUM REQUIRED CAPITAL ADEQUACY RATIO 8.00% 8.00%

14
INVESTOR NEWSLETTERFebruary 2010
*) Normalized cost to income exclude cost to unwind derivative contracts**) Reported cost to income include cost to unwind derivative contracts***) In line with BI regulation No. 10/25/PBI/2008 dated 23 October 2008 regarding “Changes on BI Regulation No. 10/19/PBI/2008 regarding Statutory Reserve Requirements (“GWM”) of
CommercialBankinBankIndonesiainRupiahandForeignCurrency”thatstarting24October2009,BankisrequiredtofulfilSecondaryGWMforRupiahCurrencyamountedto2.5%from average of total third party funds in Rupiah through SBI, SUN and/or Excess Reserve
KEY FINANCIAL RATIOSAS AT 31 DECEMBER 2009 AND 2008
NO RATIOS (%) 2009 2008CONSOLIDATED RATIOS :
I. Capital1 Capital Adequacy Ratio (CAR) with credit risk 20.84% 16.11%2 CAR with market risk 20.65% 15.43%
II. Earning assets1. Non-performing earning assets 3.63% 1.71%2 NPL gross 4.47% 2.29%3 NPL net after minimum BI provision of possible losses 2.38% 1.21%4 NPL net after the consolidated total provision on possible losses 0.96% 0.00%5. Allowance for possible losses to earning assets 3.48% 2.79%
III. Rentability1 Return on Assets (ROA) after tax 1.50% 1.52%2 Return on Assets (ROA) before tax 2.32% 2.67%3. Return on average core capital 11.24% 14.64%4 Return on average equity 10.77% 14.38%5 NIM including third party premium expenses 12.01% 11.12%6. Cost to income - Normalized *) 50.13% 52.99%7. Cost to income - Reported **) 50.05% 54.14%
BANK RATIOS:I. Capital
1 CAR 17.72% 13.99%2 CAR with market risk 17.55% 13.37%3. Fixed assets to total capital 19.29% 24.38%
II. Earning assets1. Non-performing earning assets 3.72% 1.73%2. NPL gross 4.64% 2.34%3. NPL net after minimum BI provision of possible losses 2.47% 1.23%4. NPL after the Bank's total provision on possible losses 0.99% 0.00%5. NonperformingiBreceivablesandfinancingwithcontract 0.84% 0.62%6. Allowance for possible losses on earning assets 3.53% 2.80%7. Fulfillmentofallowanceforpossiblelossesonearningassets 136.29% 150.08%8 Fulfillmentofallowanceforpossiblelossesonnonearningassets 100.00% 100.00%
III. Rentability1. ROA after tax 1.53% 1.58%2. ROA before tax 1.78% 2.01%3. Return on average core capital 11.24% 14.64%4 Return on average equity 10.77% 14.38%5 NIM excluding third party premium expenses 8.73% 8.31%6 NIM including third party premium expenses 8.55% 8.15%7 Operating expenses to operating income 85.82% 85.77%8. Cost to income - Normalized *) 53.55% 58.06%9. Cost to income- Reported **) 53.43% 60.18%
IV. Liquidity LDR 88.76% 86.42%
V. Compliance1. a. Percentage violation on Legal Lending Limit
a.1. Related parties 0.00% 0.00%a.2. Third parties 0.00% 0.00%
b. Percentage lending in excess of Legal Lending Limitb.1. Related parties 0.00% 0.00%b.2. Third parties 0.00% 0.00%
2. Statutory Reserve Requirements Rupiah ***)a. Primary 5.11% 5.07%b. Secondary 15.59% NA
3. Net open position 4.15% 7.83%4. Net open position on balance sheet 14.64% 1.70%

15
INVESTOR NEWSLETTERFebruary 2010
MANAGEMENT Of THE BANK(As at 31 Dec 2009)
SHAREHOLDERS(As at 31 Dec 2009)
Board Of Commissioners Board Of Directors1. President Commissioner : Ng Kee Choe 1. President Director : Juan Eugenio Sebastian
Paredes Muirragui1. Asia Financial (Indonesia) 67.63%
2. Vice President Commissioner : Johanes Berchmans Kristiadi Pudjosukanto 2)
2. Vice President Director : Joseph Fellipus PeterLuhukay
2. Public 32.37 %
3. Commissioner : Milan Robert Shuster2) 3. Director : Muliadi Rahardja
4. Commissioner : Harry Arief Soepardi Sukadis2) 4. Director : Ali Rukmijah / Ali Yong TOTAL 100 %5. Commissioner : Gan Chee Yen 5. Director : Vera Eve Lim
6. Commissioner : Liew Cheng San Victor 6. Director : Sanjiv Malhotra
7. Commissioner : Manggi Taruna Habir 2) 7. Director : Herry Hykmanto
8. Commissioner : Krisna Wijaya 8. Director : Kanchan Keshav Nijasure
9. Compliance Director : Fransiska Oei Lan Siem3)
Notes :1) All members of Board of Directors and Board of Commissioners are reappointed by Annnual General Meeting of Shareholders dated 3 April 2008 except for the appointment of Fransiska Oei Lan Siem.2) Independent Commissioner.3) Fransiska Oei Lan Siem is appointed by the Annual GMS dated 25 May 2009 and has become effective by Bank Indonesia letter dated 11 June 2009 No.11/74/GBI/DPIP/Rahasia.
Notes :
Information in the consolidated balance sheets and consolidated statements of commitments and contingencies as at 31 December 2009 and 2008, consolidated statements of income and 1. retainedearnings for theyearsended31December2009and2008arepreparedbasedon theconsolidatedfinancialstatementsasatand for theyearsended31December2009and2008,whichwereauditedbytheSiddharta&Widjaja,RegisteredPublicAccountants(partnerin-charge:KusumaningsihAngkawijaya,CPA),withanunqualifiedopinion.Theabovefinancialstatements are published in order to comply with Bank Indonesia Regulation No. 3/22/PBI/2001 dated 13 December 2001 regarding the “Transparency of Bank’s Financial Condition” which was amended by Bank Indonesia Regulation No. 7/50/PBI/2005 dated 29 November 2005, and prepared based on Circular Letter of Bank Indonesia No. 3/30/DPnP dated 14 December 2001 regarding “Quarterly and Monthly Published Financial Statements of Commercial Banks and Certain Reports Submitted to Bank Indonesia” as amended by Circular Letter of Bank Indonesia No.7/10/DPnP dated 31 March 2005, and in accordance with the Regulation of Capital Market Supervisory Agency (Bapepam) No. VIII.G.7 as included in the Appendix of the Decision of Chairman of Bapepam No. Kep-06/PM/2000 dated 13 March 2000 regarding “Guidelines for the Preparation of Financial Statements” jo Circular Letter of the Chairman of Bapepam No.SE-02/PM/2002 regarding “Guidelines for the Presentation and Disclosures of Financial Statements of Publicly Listed Companies”, and Regulation No. X.K.2 Decision of Chairman of the Capital Market Supervisory Board No. Kep-36/PM/2003 dated 30 September 2003 regarding “Obligation to Submit Periodic Financial Statements”.
BankIndonesiainitsletterdated31December2008hadapprovedtheBank’splantoincreaseitsownershipinPTAdiraQuantumMultifinance(AQ)from90%to99%andincreaseAQshare2. capital to reach Rp 100,000 million. On 23 April 2009, the Bank and PT Adira Dinamika Multi Finance Tbk (ADMF) signed a sell and purchase agreement with AQ’s minority shareholder, where the Bank and ADMF together increased their ownership by 10%, resulting in the Bank’s ownership in AQ reached 100%. The increase in AQ share capital to reach Rp 100,000 million has been approved by the Ministry of Law and Human Rights of the Republic of Indonesia dated 13 August 2009.
On 9 July 2009, the Bank has executed its call option to buy 20% of ADMF’s share with acquisition cost of Rp 1,628,812 million, in which this amount included the amount paid for call option 3. ofRp186,875million.Therefore,since9July2009,theBankhadowned95%ofADMF’ssharesandentitledfor20%additionofADMF’snetprofitsince1January2009.
Ministry of Finance (Bapepam-LK) in its letter dated 30 June 2009 has approved the change of the ownership PT Adira Insurance Dinamika (AI) share from PT Adira Dinamika Investindo to the 4. Bank. On 9 July 2009, PT Adira Dinamika Investindo has signed transfer agreement of 90% AI shares to the Bank. Therefore, currently the Bank owns 90% of AI’s shares.
The ultimate shareholder of Asia Financial (Indonesia) Pte.Ltd. is Temasek Holding Pte.Ltd., an investment holding company based in Singapore which is wholly owned by the Government 5. of Singapore.
Referring to the Circular Letter of Bank Indonesia No. 3/30/DPnP dated 14 December 2001 regarding “Quarterly and Monthly Published Financial Statements of Commercial Banks” which was 6. amendedbyCircularLetterofBankIndonesiaNo.7/10/DPnPdated31March2005,weareunabletopublishtheconsolidatedfinancialstatementsoftheparentcompany.
Exchange rate as at 31 December 2009 : USD 1 = Rp 9,395; exchange rate as at 31 December 2008 : USD 1 = Rp 10,900.7.
Publication: Jakarta, February 23, 2010Board of Directors
J.E. Sebastian Paredes M.President Director
Vera Eve LimDirector
Disclaimer:This report has been prepared by PT Bank Danamon Indonesia Tbk independently and is circulated for the puRp ose of general information only. It is not intended to the specificpersonwhomayreceivethisreport.Theinformationinthisreporthasbeenobtainedfromsourceswhichwedeemreliable.Nowarranty(expressedorimplied)is made to the accuracy or completeness of the information. All opinions and estimates included in this report constitute our judgment as of this date and are subject to changewithoutpriornotice.Wedisclaimanyresponsibilityorliability(expressedorimplied)ofPTBankDanamonIndonesiaTbkand/oritsaffiliatedcompaniesand/ortheir respective employees and/or agents whatsoever and howsoever arising which may be brought against or suffered by any person as a result of acting in reliance upon thewholeoranypartofthecontentsofthisreportandneitherPTBankDanamonIndonesiaTbkand/oritsaffiliatedcompaniesand/ortheirrespectiveemployeesand/or agents accepts liability for any errors, omissions or mis-statements, negligent or otherwise, in this report and any inaccuracy herein or omission here from which might otherwise arise.

PT Bank Danamon Indonesia TbkMenara Bank Danamon, Jl. Prof Dr. Satrio Kav. E IV No.6
Jakarta 12950, IndonesiaTel: (62-21) 5799 1001 - 03
Fax: (62-21) 5799 1161
www.danamon.co.id


![Corporate Social Responsibility - Danamon · corporate social responsibility in my clean market program, danamon lunhnlz zlsslyz huk z[hss v^ulyz pu [yhkp[pvuhs thyrl[z [v ptwyv]l](https://img.pdfslide.us/doc/110x75/5c946c3e09d3f2c2238c68ea/corporate-social-responsibility-danamon-corporate-social-responsibility-in.jpg)