Embed Size (px)
Citation preview

Female Labor Force Participation in Pakistan and Some
MENA Countries
Abbas Aboohamidi
Graduate Student
Department of Agriculture and Applied Economics,
Texas Tech University,
Box 42132, Lubbock, TX79409
Benaissa Chidmi
Associate Professor
Department of Agriculture and Applied Economics,
Texas Tech University,
Box 42132, Lubbock, TX79409
Selected paper prepared for presentation at the Southern Agricultural Economics
Association Annual Meeting, 2013
Copyright 2013 by Abbas Aboohamidi and Benaissa Chidmi. All rights reserved. Readers may
make verbatim copies of this document for non-commercial purposes by any means, provided
that this copyright notice appears on all such copies.

Abstract
The low-labor force participation rate of female in the MENA countries has been
recognized and investigated by many researchers. The multidimensional nature of the
issue demands a thorough investigation of different aspects of a region to better
understand the factors that affect and, or influence the female labor force participation
of that region.
This study uses the main determinants found in the previous literature to examine their
effects on labor force participation in 4 different countries from different regions but
with similar characteristics. For our analysis, we use World Bank Data indicators 2011.
We follow the data panel procedure to study the effect of factors, such as literacy rate,
eduction, fertility rate, urbanization, trade openness, and per capita GDP on the rate of
female labor participation; while accounting of the endogeneity of fertility and literacy
rates. We study the effects of these variables using the pooled model, the fixed, and the
random effects models.
The results indicate that the fixed and random effects models outperform the pooled
model. Moreover, the fixed effects and random effects models are equally appropriate in
this case. The empirical results of the random effects model indicate that literacy and
urbanization rates have a positive and significant effects on female labor participation.
Variables such as fertility rate and per capita GDP have a negative and significant effects
on female labor participation. Finally, female education enrollment and trade openness
do not have a significant effect on FLFP in the countries considered in this study.

Female Labor Force Participation in Pakistan and
Some MENA Countries
Abbas Aboohamidi and Benaissa Chidmi
1 Introduction
There have been enormous economic, social and cultural changes in the Middle East and
North African countries (MENA) in recent decades, and this has created new opportu-
nities and a new role for women in the socioeconomic life. The study of female labor
force participation requires knowing many areas that relate to the status of women in a
particular region. The multidimensional nature of the issue demands a thorough inves-
tigation of different aspects of a region to better understand the factors that affect and,
or influence the female labor force participation of that region.
The low-labor force participation rate of female in the MENA countries has been
recognized and investigated by many researchers. In this paper, we examine the impact of
economic, social, and demographic factors on the female labor force participation in three
MENA countries (Egypt, Morocco, and Turkey) and Pakistan. While these countries
are widely of Muslim majority, the female labor force participation rate displays some
similarities though the economic and social environment is different across these countries.
For instance, while one would expect the rate of FLFP in Turkey to be comparable to the
one in the Organization for Economic Co-operation and Development (OECD) countries,
this rate is only about 28% (World Bank, 2012); compared to an average 62% in the
OECD countries and 64% in the European Union-19 (World Bank, 2009).
In addition, despite Turkey’s strong economic performance, 1, the rate of FLFP in
1 According to World Bank (2012), Turkey’s GDP grew by approximately 9% GDP between 2010 and
2011, while the GDP growth in Egypt, Morocco, and Pakistan during the same period was 1.8%, 4.5%,
1

Turkey does not translate in significant difference when compared to the other three
countries. For instance, the rate of FLFP in Morocco reaches 26% in 2010 2. Moreover,
Turkey has the lowest female labor force participation rate in the world except to eight
countries (Fraker and zdemir, 2011). The case of Morocco and Egypt is interesting due to
their geographical closeness and their differences in their female labor force participation
rate. Morocco along with Tunisia are the only exceptions among MENA countries that do
not show very low rate of female labor force participation rate (Karshenas and Moghadam,
2001). Pakistan is included in this study because it is neither a member of OECD
countries nor it is of MENA countries, but shares many similarities, and is considered
one of the lowest FLFP rate in its region (Ameen, 2012).
Various studies have examined the factors behind the low female labor force partici-
pate rate in the MENA countries. Some, for example, use religion as a variable to explain
the low female labor force participation in Islamic countries (Fraker and zdemir, 2011);
while others use the role of family structure and the cultural factors to explain the low
rate of the FLFP in the Islamic countries (Yousef, 1971, 1978; Abu Nasr et al., 1985;
Clark et al., 1991 add the new one that you just found and read). Yet others explain it
through economic factors such as the effect of trade openness ( Assaad, 2004; Bussmann,
2008; El-Hamidi,2008; Ramjoue, 2010; Hayder and Behrman, 2011).
Assaad (2004) finds that the effects of trade liberalization in Morocco and Egypt are
distinct. While in Morocco the trade liberalization helps women contribute more in the
labor market, in Egypt, except for the civil service sector, trade openness have more
negative effect on the female labor force in the job market. Bussmann (2008), in her
analysis, finds no support for the positive effect of trade openness on women welfare in
absolute terms. El-Hamidi’s finding indicates that trade liberalization in Egypt increased
and 3.0%, respectively 2 In 2008, the rate of FLFP in Morocco was 27% (World Bank, 2012); this drop in the rate of FLFP
is due to the Moroccan economic conjecture characterized by a slower GDP growth and a sharp decrease
in foreign direct investments
2

wage discrimination in tradable and not-tradable sectors, but the non-tradable was more
affected than the tradable sector. On the other hand, Ramjoue (2010) concludes that
it is not an easy task to determine the effect of trade openness on women welfare, and
that is, because trade liberalization affects different sectors of the economy differently
and these effects vary among various countries. Hayder and Behrman (2011) in their
study of Pakistani labor force participation rates over 57 years find that trade openness
decreased the gender differences in terms of labor force participation rates profoundly due
to transition of production process from agriculture to the service and industrial sectors.
With regard to fertility rate Salehi Esfahani and Shajari, 2010), Bloom et al. (2009)
finds that there is an inverse relationship between fertility rate and female labor force
participation rate. That is as the fertility rate decreases, female labor force participation
rate increases. This expected result is also reported by Salehi Esfahani and Shajari (2010)
in their study of Female labor force participation rate of the Iranian women.
Education is another factor that was used to explain the variation in the FLFP rate.
Hence, Salehi Esfahani and Shajari (2010) find a positive relationship between education
and FLFP. Moreover, Chamlou, Muzi and Ahmed (2011) show that higher education
(post-secondary/university/post-universtiy) has positive relationship and sizable effect
on FLFP in MENA countries, which confirms Klasen’s (2002) analysis as well.
As an economic variable, the per capita GDP constitutes one of the variable commonly
used in the FLFP studies. In fact, Karshenas and Moghadam (2001) find that in MENA
countries, during their transition from a traditional agrarian societies to more modern
ones in the recent decades, higher GDP per capita allowed women to stay home and
contribute less to the labor market of their societies. The same finding is also reported
by Onaran and Baslevent (2010) with respect to Turkey.
Although urbanization is expected to increase the FLFP, Tansel (2002) finds an in-
verse relationship between the urbanization process and FLFP in Turkey. This result is
explained by the fact that agriculture constitutes a major GDP contributor. Women from
rural migration background, without university education are faced with low wage job
3

opportunities that cannot even offset the high cost of childcare (World Bank, 2009), have
no better alternative than not working. On the other hand, Uraz et al. (2010) show that
low-skilled women migrating from rural to urban areas are responsible for the significant
decline of FLFP, where these women make up 74% of the working age population of urban,
and 80% of all female population who participate in the labor market in Turkey.
This paper is organized as follows. In the next section, a brief socioeconomic back-
ground of each country in the study is provided. Section 3 presents the methodology and
describes the data used. In section 4, we present the results and in the last section we
conclude.
2 Background of the Countries Studied
2.1 Egypt
Since the 1970s the Egyptian economy has been in a privileged position of receiving
billions of dollars as foreign aid. Nevertheless, the Egyptian economy did not show any
sign of improvement. As a result, In the early 1990s, the Egyptian government started
the privatization of its economy to comply with a series of International Monetary Fund
(IMF) plans to help the Egyptian’s economy reduce its external debt, and restructure its
economy, which in turn helped Egypt improve its macroeconomic performance.
By late 1990s and mid 2000s, the industrial sector accounted for 25-30% of real GDP,
which was an overall of 10% growth annually. The industry’s growth came from the
increase demand in agricultural-food industry, mostly sugar and beverages; cotton and
wool yarn, and materials used in construction. The service sector showed higher growth
due to increase in oil prices and natural gas production, which earned a net value of $5.3
billion in export. The export of non-petroleum material increased from $2.3 billion to
$ 4.2 billion during the period year of 2001 to 2005. Despite the structural adjustment
policies, the Egyptian economy experienced a continuous reduction in GDP from 2001 to
2005. But in 2005, the GDP growth changed its direction and started to increase, mainly
4
as a result of currency devaluation (El-Hamidi, 2007).
Although the Egyptian economy grew and has performed better than the periods
before the 1990s, it has not been able to provide the jobs needed for the labor force that
exist in the country. Even with the drop in fertility rate for more than two decades, the
labor force growth has been 2.7% each year, and the economy has not been able to keep
up with the pace. Though the men unemployment rate averages only 6.9%, the women
unemployment rate exceeds 25% in a country where 56% of the population is female.
This indicates the negative effects of the downsizing and the privatization policies on
women employment, mostly. (El-Hamidi, 2007).
2.2 Morocco
Morocco is one of the two MENA countries 3 that do not show very low FLFP rate. Be-
sides, Morocco embarked in its structural adjustment program to restructure its economy
at the same time that Egypt took the steps.
The programs have caused a rise in the employment in the private sector and a fall the
public service sector. The structural adjustment was intended to improve the tradable
goods’ production, especially the labor intensive ones in the manufacturing sector like,
textile, garments, and industries that discriminate against women in terms of employ-
ment. Such policies are said to cut cost by reducing the presence of men and increase the
employment of female, so result in feminization of these sectors. The policies worked as
were expected in Morocco, but not in Egypt (Assasd, 2004).
2.3 Pakistan
Pakistan, like Egypt and Morocco, began its structural adjustment programs approxi-
mately at the same time. In Pakistan, like other developing countries the adjustment
programs intended to liberalize and deregulate the Pakistani economy. Pakistan’s main
aim was the adoption of a managed floating exchange rate system, which leads to an ad-
3 The other country is Tunisia
5

justment in the Pakistani national currency that boosted the country’s exports (Muleh-Ud
din, Ghani, Siddique, 2003).
Although the trade liberalization policies decreased the gender differences in terms
of labor force participation rates profoundly, due to transition of production process
from agriculture to the service and industrial sectors (Hayder and Behrman, 2011), the
gender-specific statistic in Pakistan is very disturbing. Women have very little right of
private ownership, and are limited to participate in labor market. They do not have the
same opportunities as men to access education and health care, and their employment
opportunities are extremely limited compared to their male counterparts (Pervaiz, Chani,
Ahmad Jan, Chaudhary, 2011).
2.4 Turkey
Turkey implemented same policies to restructure its economy. Besides, the import sub-
stitution policies that were implemented before the 1980s had led to an increase in the
employment in the industry sectors. Per capita income increased except with a minimal
drop in 2001, which can be tied and attributed to the recession in the global market that
in turn in a sign of intense integration of the Turkish economy into the global economy,
especially after the 1980s. The service industry is the largest sector of men employment
and ranks second for women employment after agricultural sector (Tansel, 2002). The
economic developments of the 1960s and the 1970s benefited women and helped them to
increase their participation in the job market in the 1980s. Turkey enjoyed a high level of
female labor force participation rate parallel to the developed countries. This is the case
of most OECD countries, and they have been able to sustain the same or higher rate of
FLFP whereas Turkey’s economy failed to do so (Onis, 2002).
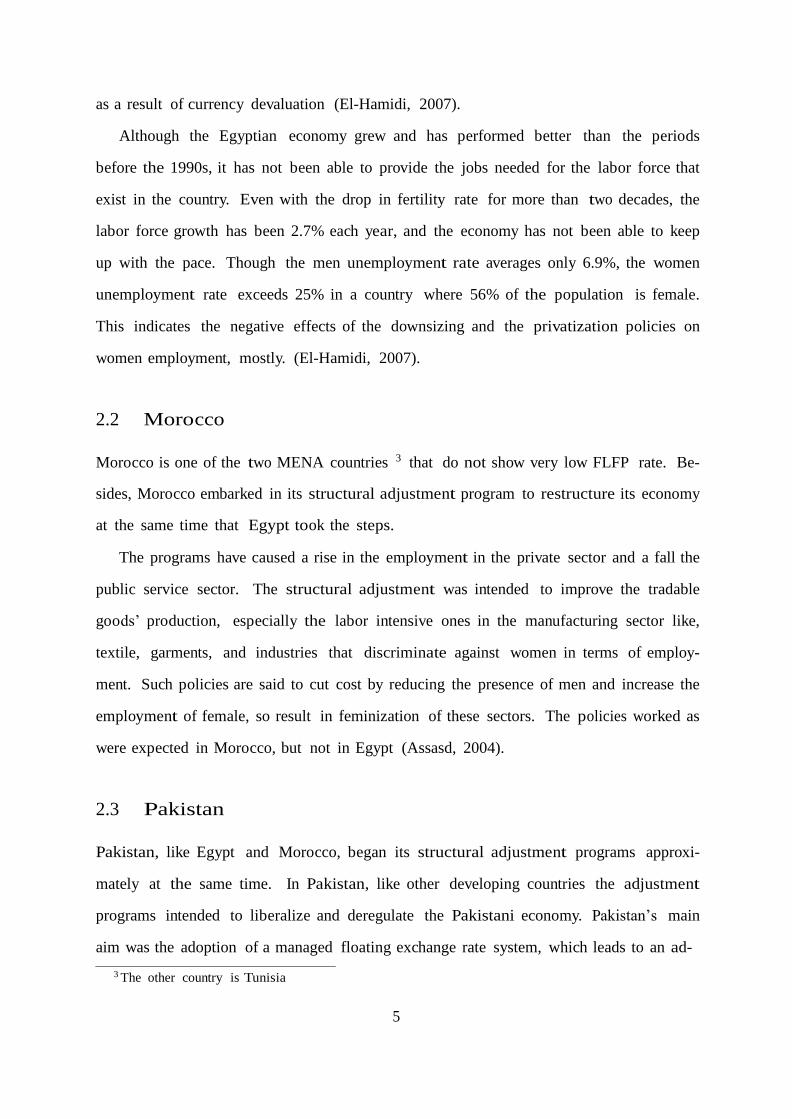
The evolution of the FLFP rate in these countries offers a very interesting case study.
In the case of Turkey, the FLFP rate shows a decreasing trend from more than 36% in
1990 to less than 27% in 2008. According to World Bank (2009), the decrease in FLFP in
Turkey is the result of an increase in urbanization and a decline in agricultural employ-
6
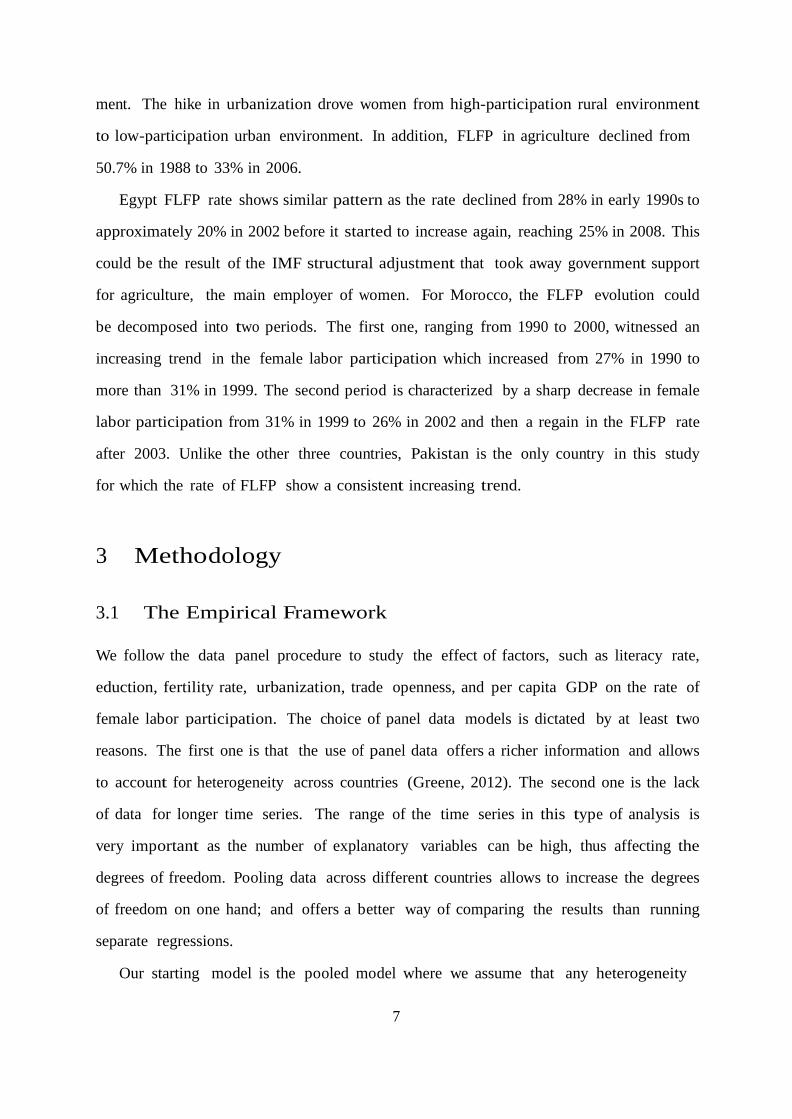
ment. The hike in urbanization drove women from high-participation rural environment
to low-participation urban environment. In addition, FLFP in agriculture declined from
50.7% in 1988 to 33% in 2006.
Egypt FLFP rate shows similar pattern as the rate declined from 28% in early 1990s to
approximately 20% in 2002 before it started to increase again, reaching 25% in 2008. This
could be the result of the IMF structural adjustment that took away government support
for agriculture, the main employer of women. For Morocco, the FLFP evolution could
be decomposed into two periods. The first one, ranging from 1990 to 2000, witnessed an
increasing trend in the female labor participation which increased from 27% in 1990 to
more than 31% in 1999. The second period is characterized by a sharp decrease in female
labor participation from 31% in 1999 to 26% in 2002 and then a regain in the FLFP rate
after 2003. Unlike the other three countries, Pakistan is the only country in this study
for which the rate of FLFP show a consistent increasing trend.
3 Methodology
3.1 The Empirical Framework
We follow the data panel procedure to study the effect of factors, such as literacy rate,
eduction, fertility rate, urbanization, trade openness, and per capita GDP on the rate of
female labor participation. The choice of panel data models is dictated by at least two
reasons. The first one is that the use of panel data offers a richer information and allows
to account for heterogeneity across countries (Greene, 2012). The second one is the lack
of data for longer time series. The range of the time series in this type of analysis is
very important as the number of explanatory variables can be high, thus affecting the
degrees of freedom. Pooling data across different countries allows to increase the degrees
of freedom on one hand; and offers a better way of comparing the results than running
separate regressions.
Our starting model is the pooled model where we assume that any heterogeneity
7

it
it
across countries has been averaged out
F LF Pit = β1+β2f litit +β3f rateit +β4 f ensit +β5f entit +β6urbanit +β7 T ropit +β9GDP pcit + it ,
(1)
where F LP is the female labor participation, f lit is the female literacy rate, f rate is the
fertility rate, f ens is the female enrollment in secondary education, f ent is the female
enrollment in tertiary education, urban is the percentage of urban population, T rop repre-
sents the trade openness, and GDP pc is the per capita GDP measured in 2000 US dollars.
The subscript t represents the year, t = 1990, ..., 2008; and the subscript i represents the
country, i = Egypt, M orocco, P akistan, T urkey. In the pooled model, we make the usual
assumption that the disturbances it have a conditional zero-mean and constant variance.
For the notational simplicity, we let xit = (f litit , f rateit , f ensit , f entit , urbanit , T ropit , GDP pcit )
in what follows. Our pooled model becomes then
F LF Pit = β1 + x0 β + it (2)
The second model considered is the fixed effect model where the omitted country
effects, ci , are included as an intercept shifter. This model allows the country effect to
be correlated with the included variables. Thus, we have
F LF Pit = ci + x0 β + it , (3)
with E[ci |xi ] = βi =. Equation 3 could also be written as
F LF Pit = βi + x0 β + [ci − βi ] + it = βi + x0 β + it ∗ . (4)
it it | {z } it ∗
Thus, by including the country fixed effect we remove the correlation between the ex-
planatory variables and the omitted country effects previously captured by the distur-
bance term. The fixed effect model allows us to capture the differences across countries
8

it
in the constant term.
However, if the country effects are uncorrelated with the explanatory variables, then
it would be appropriate to use the random effects formulation, which represents our third
model
F LF Pit = x0 β + (β1 + ui ) + it , (5)
where ui is the random heterogeneity specific to country i.
In all three models presented above, it has been reported that the variables female lit-
eracy rate and fertility rate might be endogenous, hence the parameter estimates might be
inconsistent. To solve the issue we use instrumental variable in a two-stage least squares
approach. First, we regress separately the variables f lit and f rate on the variables f enp,
f ens, f ent, rural, urban, trop, and GDP pc. The predicted, f ̂lit and f r̂ate, values form
these regressions, are included, in in a second stage, in equation 1. Moreover, we use
Breush and Pagan (1980) test to between the two specifications.
3.2 Data
For our analysis, we use World Bank Data indicators 2011. The data is unbalanced
for different indicators, which in turns limit our ability to use all the data available in
different years. As a result, we are forced to reduced our years of observations and choose
years that data is available and more balanced. Year of 1990 seemed a good starting point
and the ending year of 2008 appeared to be a reasonable year where data is available and
sparse missing values were in between and could be interpolated. So, the data covers
years 1990-2008 for each country.
The analysis focuses on the effect of explanatory variables on the FLFP rate in the
chosen countries and whether the significance of the impact is large or minimal. Table 1
provides summarizes statistics for the data used in this study. The dependent variable
is Female labor force participation, which gives the number of women who are active in
the labor force as a percentage of the total labor force. This definition is different than
9

the definition of the international labor organization which also includes those women
who are looking for job as well. In what follows, we describe the variables used and our
hypothesis regarding the sign of its effect on FLFP.
The literacy rate gives the percentage of females age 15 and above who can, with
understanding, read and write a short, simple statement on their everyday life, over
the population in that age group. Generally, literacy also encompasses ”numeracy”, the
ability to make simple arithmetic calculations. A priori, we hypothesize that this variable
will have a positive effect as women literacy would provide more opportunities for female
to access the labor market.
For the fertility rate variable, defined as the total number of births per woman, we
expect a negative relationship. In some studies, it controls for population growth, but in
most FLFP studies, it shows the extent to which women are engaged with raising
children and therefore will have less time to join the labor force or attend school. We
expect the fertility rate to reduce the contribution of women to the labor market, but be
highly correlated to the female education where education occupy women and prolong
their unwed time and hence reduce the fertility rate.
In terms of female education, there are different ways to define education functionally.
As an indicator of access to schooling, school enrolment ratios capture recent progress
more suitably than school attainment measures (Saith and Harriss-white, 1999). Hence,
the functional definition of education is the primary, secondary, and tertiary school enroll-
ment rates of female using gross ratio (defined by the World Bank). We hypothesized that
some level of education can help women participate in the labor market. This hypothesis
takes into account the family structure and the per capita income in each country where
countries with higher per capita GDP with traditional family structure tend to have less
FLFP rate relative to countries with lower GDP and similar traditions.
Rural and Urban population growth (annual%): In recent studies of FLFP, urbaniza-
tion process has been used and considered as a significant factor of low FLFP in some
countries like, Turkey, Iran, and Egypt where low-skilled woman are unwilling to work
10

due to low wage or difficult work conditions, or it is hard to find a job with their limited
skills. We expect, based on previous studies that in some countries where most women
are employed in the agricultural sector and their education level is low, the urbanization
process to have negative effects on FLFP rate and discourage women to participate in
the labor market. The lack of skill of these women prevents them from entering the man-
ufacturing and the service sectors. The low wage effect and the high opportunity cost of
working outside home have been blamed for the cause in numerous studies, especially in
countries with higher per capita GDP and traditional family values like, Turkey.
Trade openness, a most widely used indicator of trade liberalization is trade openness
in terms of trade intensity, measures the trade flows in relation to GDP. However, this
measure reflects trade volume without capturing trade policy directly (Bussmann, 2008).
Hence, we use the widely available trade/GDP ratio, that is, the sum of exports and
imports over GDP. We hypothesized that trade openness in general, helps women improve
their status in the society by gaining higher level of education and new skills for the job
created in different sectors of the economy and by helping states with higher revenue that
enables governments to spend more in the welfare programs.
GDP per capita: Studies have shown that women in countries with higher per capita
GDP with more conservative cultures tend to work less and afford to stay home, whereas
this phenomenon loose its intensity in countries with low per capita GDP.
4 Results
Table 2 presents the results of the three models: pooled model, fixed effects model,
random effects model. Overall, the random effects model and the fixed effects model
outperform the pooled model. In fact the R2 for the pooled model is 0.4982, compared
to the fixed effects model, where the explanatory power is more than 94%. In addition,
the root mean square error for the pooled model is more than ten times the one for
the two other model. Therefore, pooling the data and ignoring the country effect is not
11

appropriate in this case.
In terms of panel data models (fixed and random effects), the Hausman specification
test fails to reject the null hypothesis that the parameter estimates from the fixed effects
model and those from the random effects model are equal. Thus, we are indifferent
between using the fixed effects model results or the random effects results. In what
follows, we interpret the random effect results.
The results of the random effects model indicate that the literacy rate variable is
positive statistically significant, indicating that as the rate of literacy increases, the rate of
female labor participation increases. The same positive and significant effect is observed
for the urbanization variable. As the rate of urbanization increases in the countries
considered, the rate of female labor participation increases as the mass manufacturing
(textile, garments, food industries) is exclusively based in big metropolitan cities. Unlike
the previous two variables, the trade openness is positive but not significant as we we
expected.
Furthermore, the fertility rate has, as expected, a negative and statistically significant
impact on female labor participation. As the number of births per woman goes down,
time becomes available for females to access the labor market and participate in improving
the welfare of their households.
Education is another factor that improves women opportunities to access the labor
market. The results of this study does not support this tendency as indicated by the
negative and relatively not significant effect of the education variables included. Hence,
the female secondary education enrollment has a negative and statistically significant
effect on the rate of female labor participation. Similarly, the tertiary education enroll-
ment has a negative but not significant effect. This could be explained by the fact that
opportunities offered by the labor market for women does not need higher technical skills
(textile, for example) and many times households direct their daughter to career where
education is not necessary. In the same line, we expect the gross domestic product to
improve female conditions in accessing the labor market. However, the results indicate
12
that as GDP increases the rate of FLFP decreases.
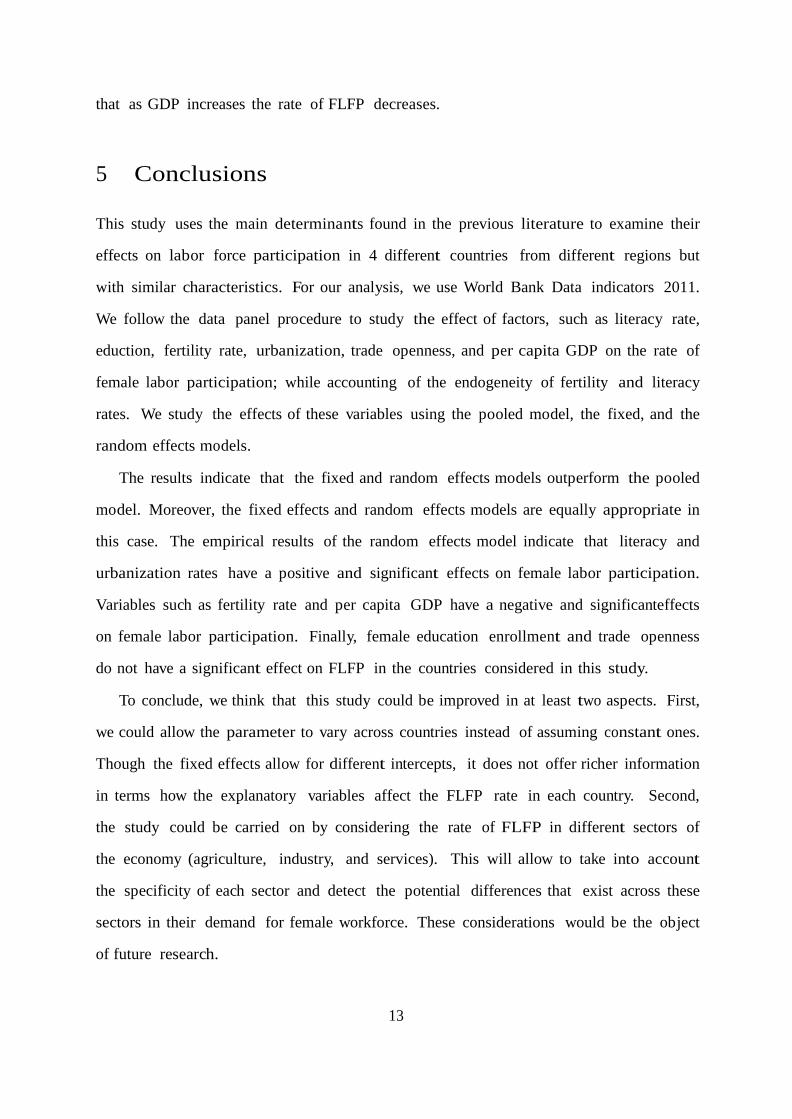
5 Conclusions
This study uses the main determinants found in the previous literature to examine their
effects on labor force participation in 4 different countries from different regions but
with similar characteristics. For our analysis, we use World Bank Data indicators 2011.
We follow the data panel procedure to study the effect of factors, such as literacy rate,
eduction, fertility rate, urbanization, trade openness, and per capita GDP on the rate of
female labor participation; while accounting of the endogeneity of fertility and literacy
rates. We study the effects of these variables using the pooled model, the fixed, and the
random effects models.
The results indicate that the fixed and random effects models outperform the pooled
model. Moreover, the fixed effects and random effects models are equally appropriate in
this case. The empirical results of the random effects model indicate that literacy and
urbanization rates have a positive and significant effects on female labor participation.
Variables such as fertility rate and per capita GDP have a negative and significanteffects
on female labor participation. Finally, female education enrollment and trade openness
do not have a significant effect on FLFP in the countries considered in this study.
To conclude, we think that this study could be improved in at least two aspects. First,
we could allow the parameter to vary across countries instead of assuming constant ones.
Though the fixed effects allow for different intercepts, it does not offer richer information
in terms how the explanatory variables affect the FLFP rate in each country. Second,
the study could be carried on by considering the rate of FLFP in different sectors of
the economy (agriculture, industry, and services). This will allow to take into account
the specificity of each sector and detect the potential differences that exist across these
sectors in their demand for female workforce. These considerations would be the object
of future research.
13

FL
FP
Ra
te (
%)
Figure 1: Evolution of the FLFP Rate across the Four Countries, 1990-2008
40
35
30
25
20
15
10
1990 1991 1992 1993 1994 1995 1996 1997 1998 1999 2000 2001 2002 2003 2004 2005 2006 2007 2008
Egypt Morocco Pakistan Turkey
14

15
Table 1: Summary Statistics
Egypt Morocco Pakistan Turkey
Variable Mean St.dev. Mean St.dev. Mean St.dev. Mean St.dev.
FLFP 22.6684 1.8959 28.7579 1.4789 16.6000 2.8427 29.9474 3.5276
Literacy Rate 2.7408 1.6056 34.0714 5.7399 30.4902 5.6201 75.5928 4.4074
Secondary Education 71.3706 8.5684 38.3063 11.6717 21.7401 4.3936 59.3682 15.3625
Tertiary Education 18.5463 6.3915 9.1242 1.1634 2.2900 1.3178 19.6991 7.7718
Fertility Rate 3.4362 0.4479 2.9575 0.5507 4.7074 0.8362 2.5037 0.3129
Urbanization 1.7566 0.2212 2.1808 0.6370 3.0797 0.4132 2.4430 0.4559
Trade Openness 0.4835 0.1294 0.5833 0.0967 0.3303 0.0316 0.3910 0.1028
Per capita 1421.8370 213.6424 1345.0810 187.5422 525.5044 59.1670 4168.2200 613.2935

Table 2: Parameter Estimates for the Three Models Pooled Model Fixed Effects Random Effects
Variable Estimate t-value Estimate t-value Estimate t-value
Intercept -52.0539 -1.6844 43.3219 7.7029 35.3329 5.0140
Egypt fixed Effect NA NA -3.0370 -0.6485 NA NA
Morocco Fixed Effect NA NA -8.4139 -2.3098 NA NA
Pakistan Fixed Effect NA NA -20.2018 -5.1359 NA NA
Literacy Rate 1.4620 4.8667 0.1882 3.5383 0.1869 3.5806
Fertility Rate 16.5889 3.1738 -3.0142 -4.3792 -3.0591 -4.4999
Secondary Education 1.3288 3.6698 -0.0623 -1.8049 -0.0624 -1.8311
Tertiary Education -0.8981 -0.9948 -0.0963 -0.9088 -0.1077 -1.0342
Urbanization -3.8716 -0.5667 1.5933 2.3148 1.6218 2.3892
Trade Openness -33.7005 -1.5586 4.4511 1.5659 4.2182 1.5119
Per capita GDP -0.0185 -2.6557 0.0048 -3.3636 -0.0046 -3.3116
R2 0.4982 0.9423 0.6728
Root MSE 16.7138 1.5287 1.5123
F test for
H0 : N o F ixed Ef f ects
44.84 Reject H0
Hausman specification test
H0 : βF E = βRE
0.6425 Fail to reject H0
16

References
[1] Abu Nasr, J., Azzam, H., and Khoury, N., 1985. Women and Development in the
Arab World. Leiden: Mouton.
[2] Ameen, Y., 2012. Pakistan Labor Force Participation Lowest in the Region. Re-
trieved Aug 16, 2012, from http://www.economistan.com.
[3] Assaad, R., 2004. Why did Economic Liberalization Lead to Feminization of the
Labor Force in Morocco and De-feminization in Egypt? Humphrey Institute of
Public Affairs.
[4] Baslevent, C., Onaran, ., 2003. Are Married Women in Turkey More Likely to
Become Added or Discouraged Workers? Provided by CEIS in its journal Labor
17, 439-458.
[5] Bloom, D., Canning, D., Fink, Gnther., and Finlay, J., 2009. Fertility, Female Labor
Force Participation, and the Demographic Dividend. Journal of Economic Growth,
79-101.
[6] Bussmann, M., 2009. The Effect of Trade Openness on women’s Welfare and Work
Life. World Development 6, 1027-1038.
[7] Chamlou, N., Muzi, S., and Ahmed, H., 2011. Understanding the Determinants
of Female Labor Force Participation in the Middle East and North Africa Region:
The Role of Education and Social Norms in Amman. The World Bank. AlmaLaurea
Working papers series.
[8] Clark, R., et al., 1991. Culture, Gender, and Labor Force Participation: A Cross-
National Study. Gender and Society 1, 47-66.
[9] El-Hamidi, F., 2007. Trade Liberalization, Gender Segmentation, and Wage Dis-
crimination: Evidence from Egypt. Department of Economics and GSPIA Univer-
17

sity of Pittsburgh. 14th Annual Conferene of the Economic Research Forum (ERF),
2007.
[10] Fraker, A., and zdemir, D.,2001. Female Labor Force Participation, How Does
Turkey Compare? TEPAV Research Association and Harvard University Research
Association.
[11] Hyder, A., and Behrman, Jere R., 2010. International Trade Openness and Gender
Gaps in Pakistani Labor Force Participation Rates Over 57 Years. PSC Working
Paper Series, PSC 11-01. Available online at: repository.upenn.edu.
[12] Karshenas, M., and Moghadam, V., 2001. Female Labor Force Participation and
Economic Adjustment in the MENA Region. The Economics of Women and Work
in the Middle East and North Africa 4, 51-74.
[13] Klasen, S., 2002. Low Schooling for Girls, Slower Growth for All? Cross-Country
Evidence on the Effect of Gender Inequality in Education on Economics Develop-
ment. The World Bank Economic Review 3, 345-373.
[14] Muleh-Ud, D., Ghani, E., and Siddique, O., 2003. Openness and Economic Growth
in Pakistan. The Pakistan Development Review, 795-807.
[15] Pervaiz, Z., Chani, M., Ahmad Jan, S., and Chaudhary, A., 2011. Gender Inequality
and Economic Growth: A Time Series Analysis for Pakistan. Middle East Journal
of Scientific Research 10 (4): 434-439.
[16] Ramjoue, M., 2010. Can Trade Plicies Promote Gender Equality? Exploring The
Trade-Growth-Gender Nexus. World Economic Forum, P. 3-7.
[17] Saith, R., and Harris-White, B., 1999. The gender Sensitivity of well-being indica-
tors. Development and Change, 465-479.
[18] Salehi Esfahani, H., and Shajari,P.,2010. http://iraneconomy.csames.illinois.edu.
Retrieved November, 2012.
18

[19] Tansel, A., 2002. Economic Development and Female Labor Force Participation in
Turkey: Time-Series Evidence and Cross-Province Estimates. Ankara: Economic
Research Center in Middle East Technical University.
[20] The World Bank, 2007. Economic Developments and Prospects: Job Creation in
an Era of High Growth, PP. xvii, 34.
[21] Uraz, A., et al., 2010. Recent Trends in Female Labor Force Participation in Turkey.
Working paper, State Planing Organization of the Republic of Turkey and World
Bank.
[22] Yussef, N. H., 1971. Social Structure and The Female Labor Force: The Case of
Women Workers in Muslim Middle Eastern Countries. Demography, 427-439.
19