Embed Size (px)
Citation preview
1
ERF Workshop on Education in the ERF Region
Session: Incentives and Challenges of Education in MENA
Identifying Sources of Inefficiency among Students of Five MENA Countries
Mohamed Ayadi and Abdelali Ben Mbarka
(University of Tunis, Tunisia)

2
0. Motivation
3
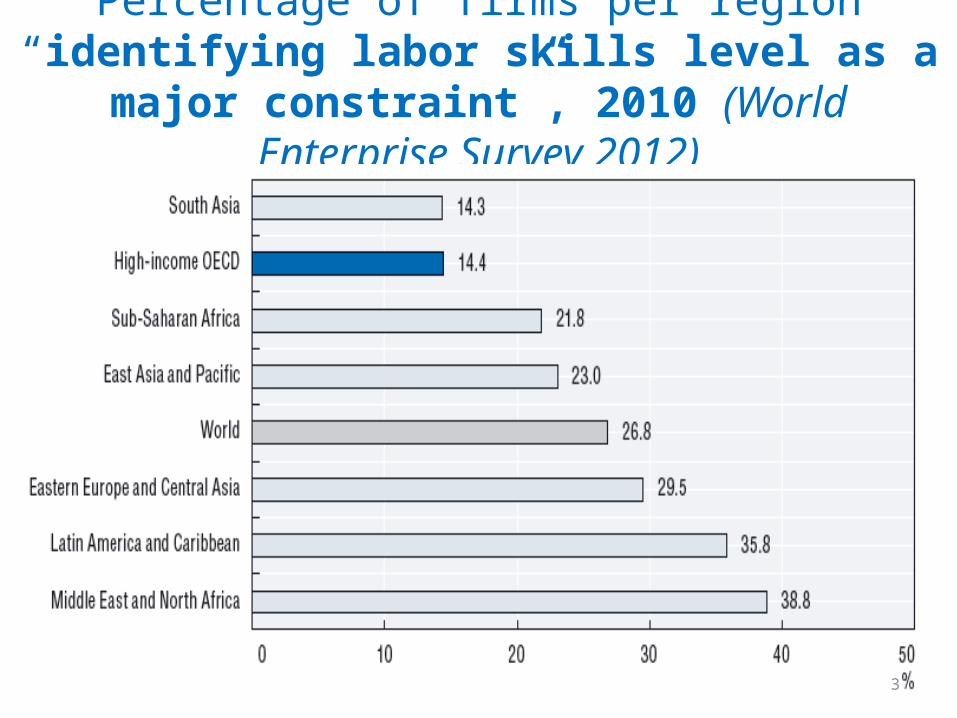
Percentage of firms per region “identifying labor skills level as a
major constraint”, 2010 (World Enterprise Survey 2012)
4
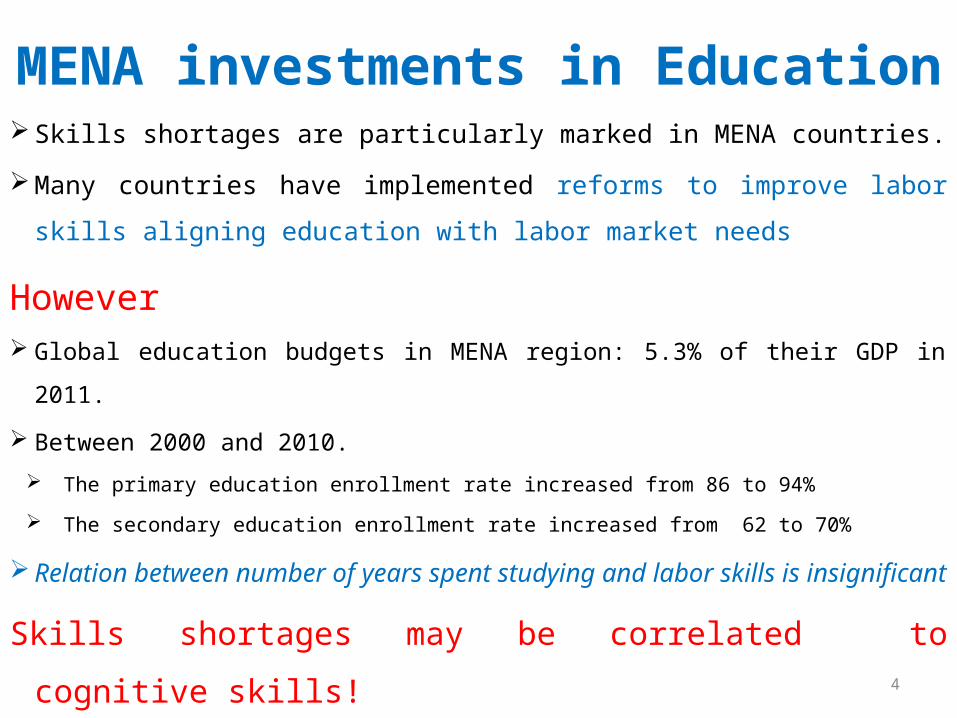
MENA investments in Education Skills shortages are particularly marked in MENA countries.
Many countries have implemented reforms to improve labor skills
aligning education with labor market needs
However Global education budgets in MENA region: 5.3% of their GDP in 2011.
Between 2000 and 2010.
The primary education enrollment rate increased from 86 to 94%
The secondary education enrollment rate increased from 62 to 70%
Relation between number of years spent studying and labor skills is
insignificant
Skills shortages may be correlated to cognitive skills!

5
Cognitive skills
Access to basic education is a necessary but insufficient condition to
acquire cognitive skills!
“Cognitive skills” do not limit itself to push the pupil to learn by rote.
It must develop the pupil’s cognitive achievements, pupils might be
able to:Interpret the received information. Learn to integrate and act in his environment.
• According to PISA , in MENA more than 60 % of pupils were unable to answer simple questions (level 1) and very simple one (level 0) !
6
Cognitive skills measurement
• Measures of “cognitive skills“: "scores" on the basis of surveys (PISA, TIMMS) done on pupils and schools.
• In 2012, Tunisia, Turkey, Jordan, Qatar and United Arabs Emirates done PISA survey.
• Scores of MENA countries are under “mean score”• Tunisia, Jordan and Qatar are among the last ten
(on a total of 65 countries)• South Asian countries are at the top of ordering
7
Causes of lower Cognitive skills levels
• Bad ordering of MENA countries may be correlated with the decrease of their education inputs quality.
• But input transformation on Cognitive skills may be affected by schools and pupils efficiency!
• besides the education inputs, several ‘non tangible’ variables (governance, incentives of the agents involved in the education process) affect cognitive skills.
• They lead to an inefficiency of the education system.
8
Identifying Sources of Inefficiency among Students of MENA Countries
Outline
I. Education and Efficiency measurementII. Analysis of MENA results in PISA2012III. Estimation Results of Education output
distance functionIV. Conclusions and policy recommendations
9
I. Education and Efficiency
measurement
10
Outline
I.1. Estimating an Educational production function through distance functions
I.2. The parametric stochastic distance function
11
I.1. Estimating an Educational production function through distance functions(1)
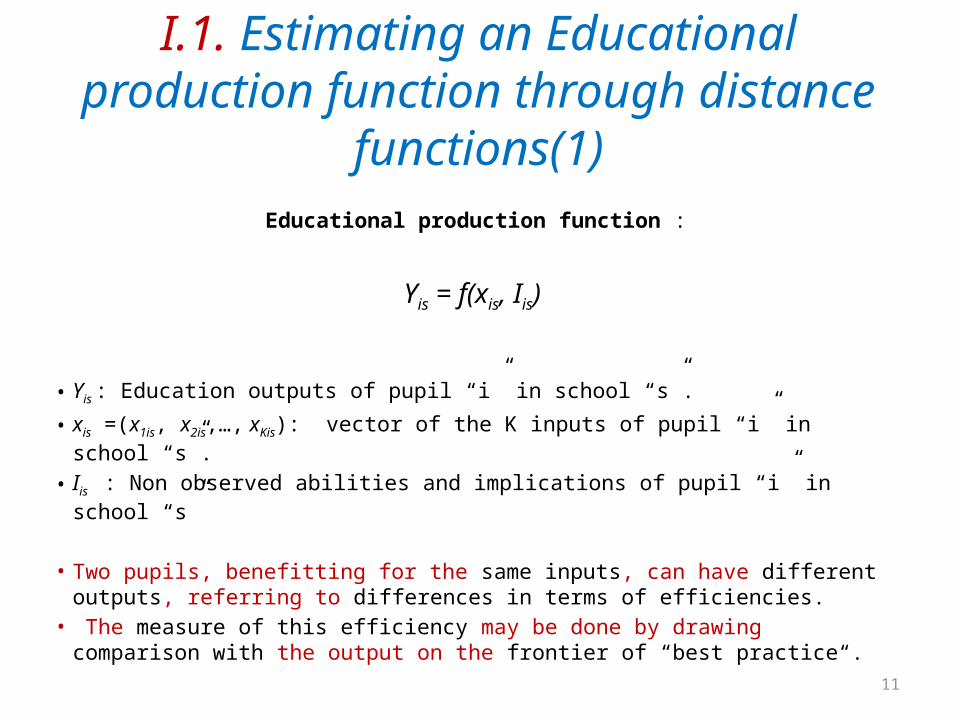
Educational production function :
Yis = f(xis, Iis)
• Yis : Education outputs of pupil “i” in school “s”.
• xis =(x1is, x2is,…, xKis): vector of the K inputs of pupil “i” in school “s”.
• Iis : Non observed abilities and implications of pupil “i” in school “s”
• Two pupils, benefitting for the same inputs, can have different outputs, referring to differences in terms of efficiencies.
• The measure of this efficiency may be done by drawing comparison with the output on the frontier of “best practice“.
12
I.1. Estimating an Educational production function through distance functions(2)
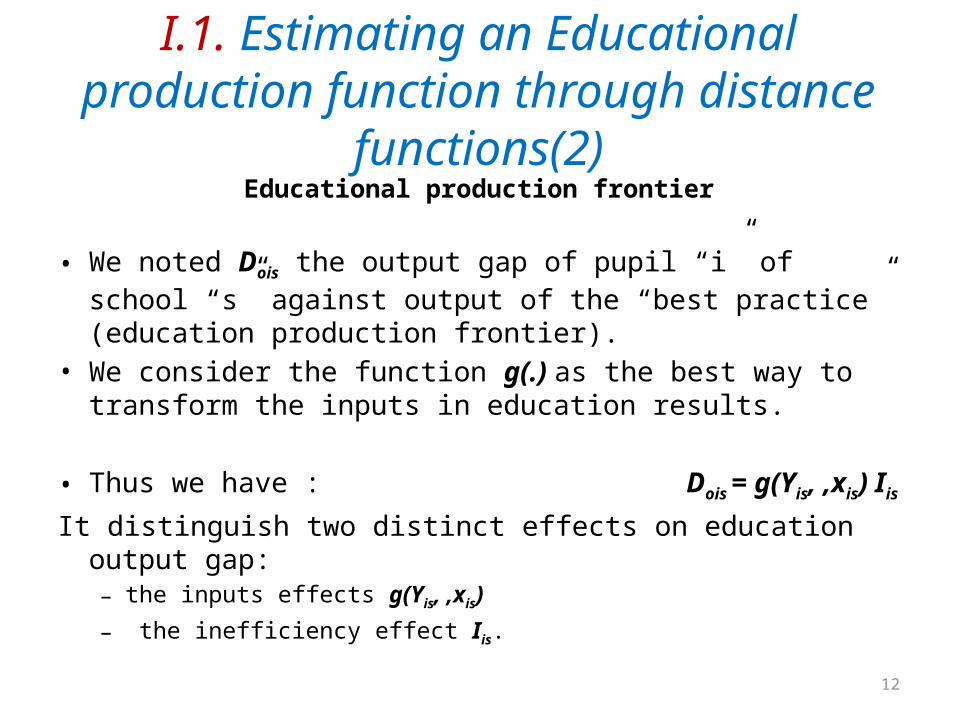
Educational production frontier
• We noted Dois the output gap of pupil “i” of school “s” against output of the “best practice” (education production frontier).
• We consider the function g(.) as the best way to transform the inputs in education results.
• Thus we have : Dois = g(Yis, ,xis) Iis
It distinguish two distinct effects on education output gap: – the inputs effects g(Yis, ,xis)
– the inefficiency effect Iis.
13
I.1. Estimating an Educational production function through distance functions (3)
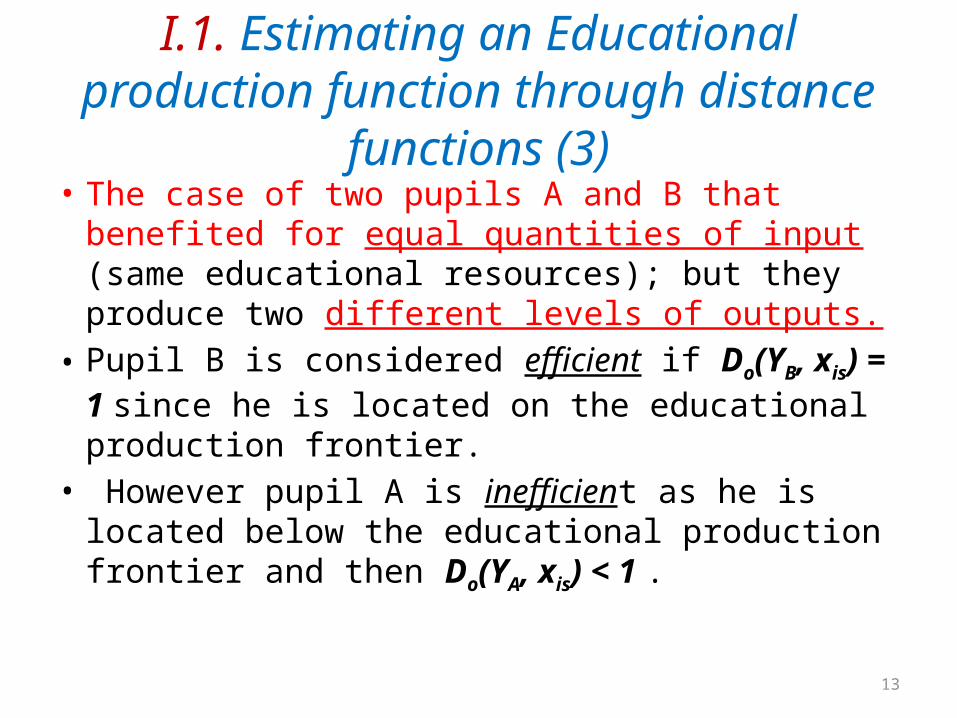
• The case of two pupils A and B that benefited for equal quantities of input (same educational resources); but they produce two different levels of outputs.
• Pupil B is considered efficient if Do(YB, xis) = 1 since he is located on the educational production frontier.
• However pupil A is inefficient as he is located below the educational production frontier and then Do(YA, xis) < 1 .
14
I.2. The parametric stochastic distance function (1)
The parametric Stochastic Frontier Analysis(SFA Approach)
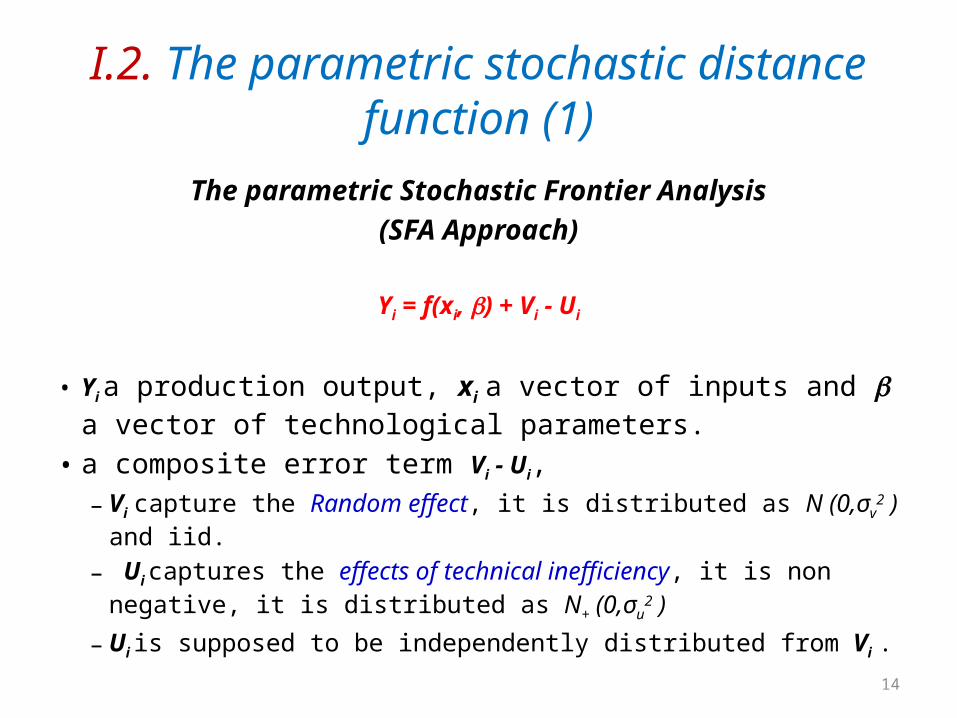
Yi = f(xi, ) + Vi - Ui
• Yi a production output, xi a vector of inputs and a vector of technological parameters.
• a composite error term Vi - Ui, – Vi capture the Random effect, it is distributed as N (0,σv
2 ) and iid.
– Ui captures the effects of technical inefficiency, it is non negative, it is distributed as N+ (0,σu
2 )
– Ui is supposed to be independently distributed from Vi .
15
I.2. The parametric stochastic distance function (2)
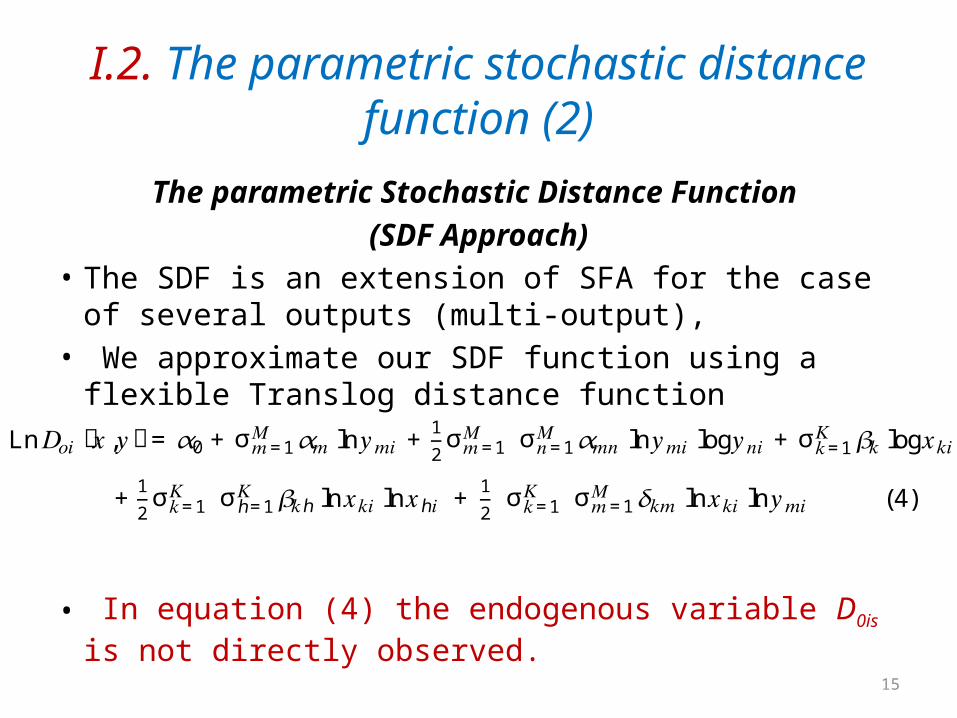
The parametric Stochastic Distance Function (SDF Approach)
• The SDF is an extension of SFA for the case of several outputs (multi-output),
• We approximate our SDF function using a flexible Translog distance function
• In equation (4) the endogenous variable D0is is not directly observed.
Ln 𝐷𝑜𝑖 ሺ𝑥,𝑦ሻ= 𝛼0 + σ 𝛼𝑚𝑀𝑚=1 ln𝑦𝑚𝑖 + 12σ 𝑀𝑚=1 σ 𝛼𝑚𝑛𝑀𝑛=1 ln𝑦𝑚𝑖 log𝑦𝑛𝑖 + σ 𝛽𝑘𝐾𝑘=1 log𝑥𝑘𝑖 +12σ 𝐾𝑘=1 σ 𝛽𝑘ℎ𝐾ℎ=1 ln𝑥𝑘𝑖 ln𝑥ℎ𝑖 + 12 σ 𝐾𝑘=1 σ 𝛿𝑘𝑚𝑀𝑚=1 ln𝑥𝑘𝑖 ln𝑦𝑚𝑖 (4)
16
I.2. The parametric stochastic distance function (3)
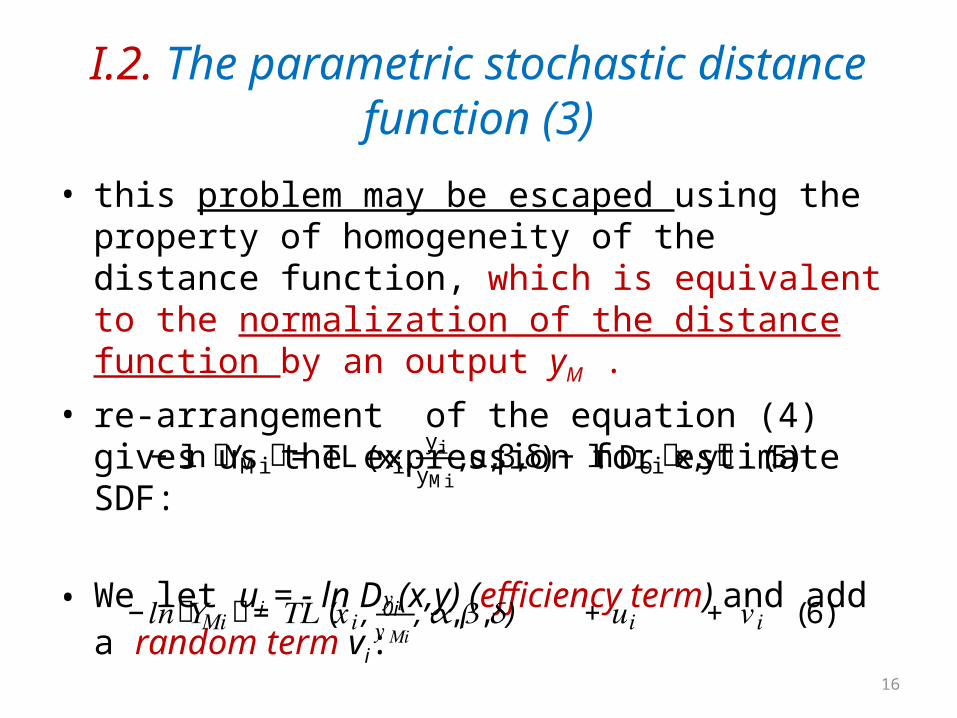
• this problem may be escaped using the property of homogeneity of the distance function, which is equivalent to the normalization of the distance function by an output yM .
• re-arrangement of the equation (4) gives us the expression for estimate SDF:
• We let ui = - ln D0i(x,y) (efficiency term) and add a random term vi:
− ln ሺYMiሻ= TL (xi, yiyMi , α,β,δ) − ln Doiሺx,yሻ (5)
−𝑙𝑛ሺ𝑌𝑀𝑖ሻ= 𝑇𝐿 (𝑥𝑖, 𝑦𝑖𝑦𝑀𝑖 , 𝛼,𝛽,𝛿) + 𝑢𝑖 + 𝑣𝑖 (6)
17
I.2. The parametric stochastic distance function (4)
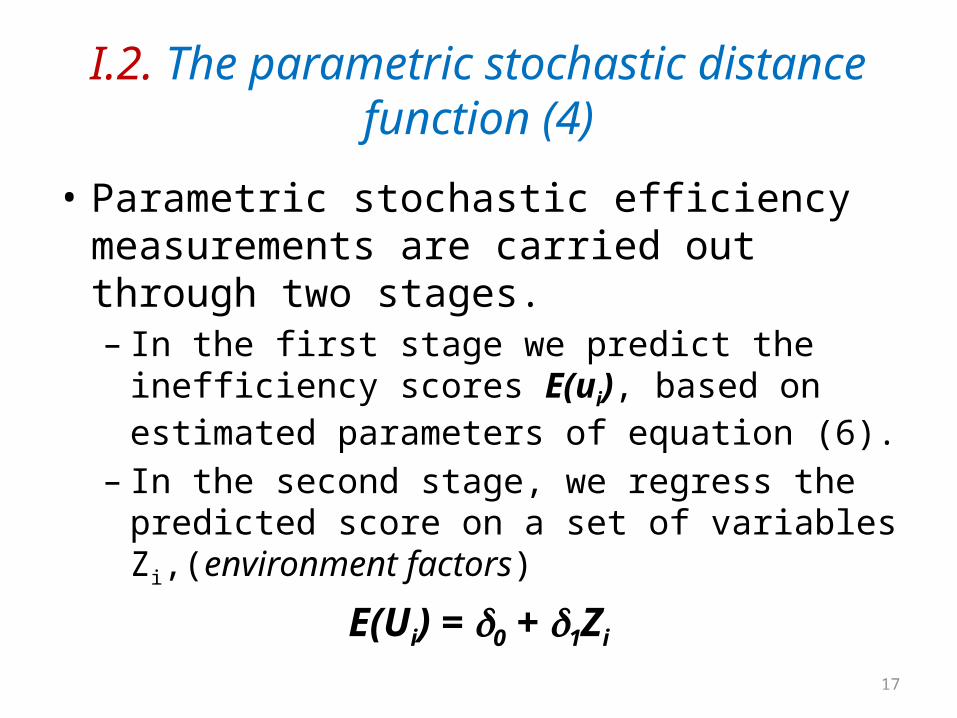
• Parametric stochastic efficiency measurements are carried out through two stages. – In the first stage we predict the inefficiency scores
E(ui), based on estimated parameters of equation (6).
– In the second stage, we regress the predicted score on a set of variables Zi,(environment factors)
E(Ui) = 0 + 1Zi
18
II. Analysis of MENA results in PISA2012
19
Outline
II.1. The PISA data baseII.2. MENA countries surveysII.3. Selection of our model variables
20
II.1. The PISA data base (1) : the sample
• PISA surveys consider three education fields: Mathematics, Science and Reading.
• PISA surveys were based on pupils aged between 15 years and 3 months and 16 years and 2 months in the beginning of the survey.
• The surveys' sample sizes are between 4,000 and 10,000 pupils.

21
II.1. The PISA data base (2): three components
1. cognitive acquirements test evaluate education skills,
2. pupil questionnaire, filled by the pupil information on the pupils and on their families.
3. School questionnaire, filled by the school director information on their school’s resources, their teachers, and school governance.
22
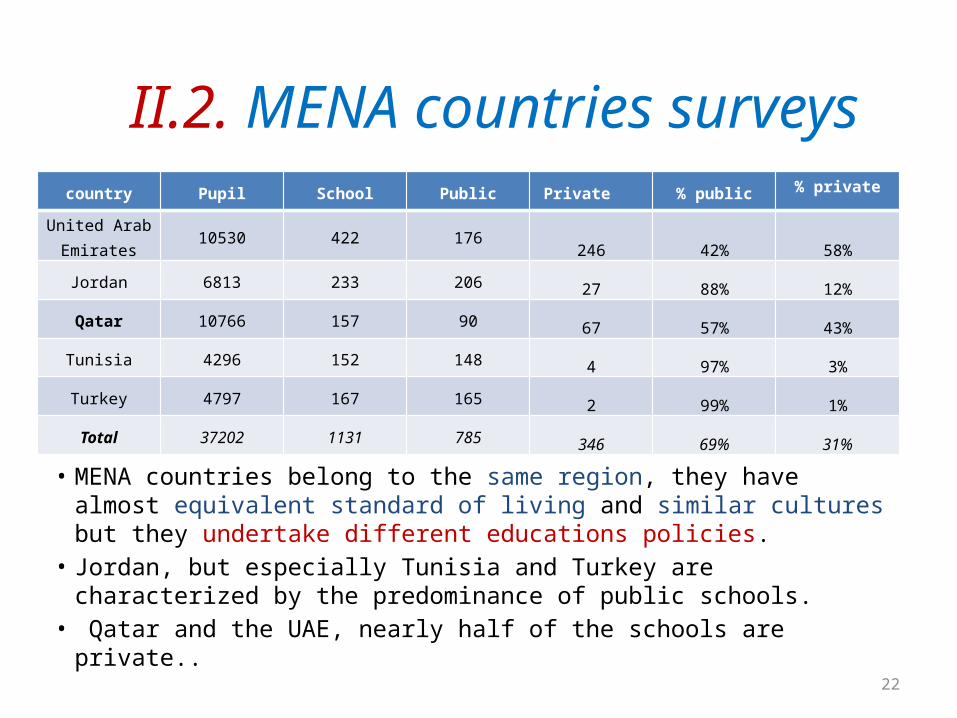
country Pupil School Public Private % public% private
United Arab Emirates
10530 422 176246 42% 58%
Jordan 6813 233 20627 88% 12%
Qatar 10766 157 9067 57% 43%
Tunisia 4296 152 1484 97% 3%
Turkey 4797 167 1652 99% 1%
Total 37202 1131 785346 69% 31%
II.2. MENA countries surveys
• MENA countries belong to the same region, they have almost equivalent standard of living and similar cultures but they undertake different educations policies.
• Jordan, but especially Tunisia and Turkey are characterized by the predominance of public schools.
• Qatar and the UAE, nearly half of the schools are private..
23
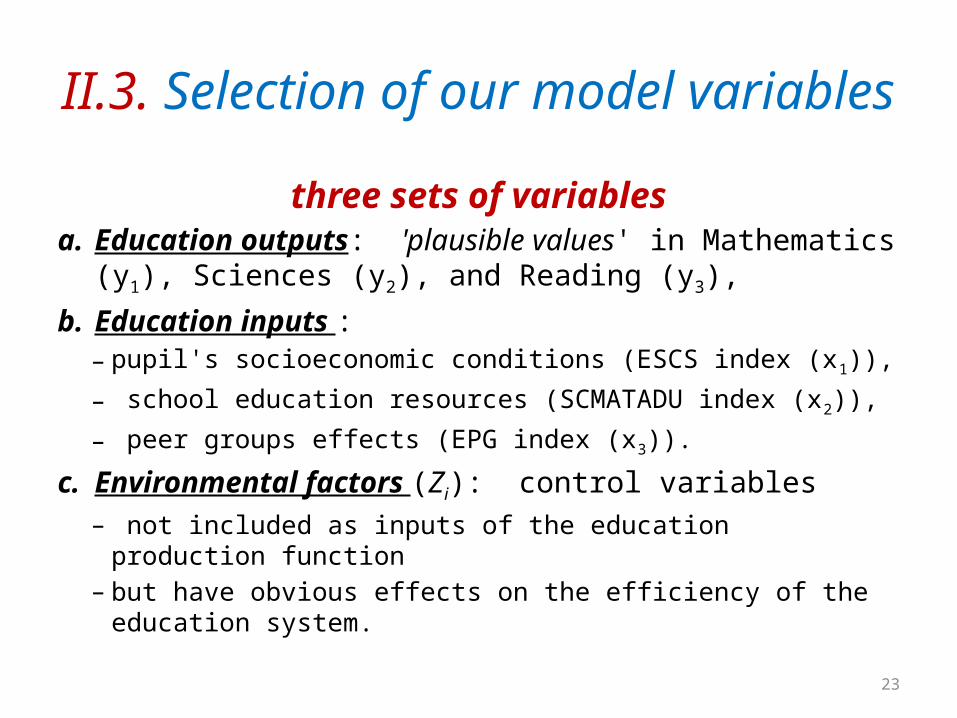
II.3. Selection of our model variables
three sets of variablesa. Education outputs: 'plausible values' in Mathematics (y1),
Sciences (y2), and Reading (y3),
b. Education inputs : – pupil's socioeconomic conditions (ESCS index (x1)),
– school education resources (SCMATADU index (x2)),
– peer groups effects (EPG index (x3)).
c. Environmental factors (Zi): control variables– not included as inputs of the education production function – but have obvious effects on the efficiency of the education system.
24
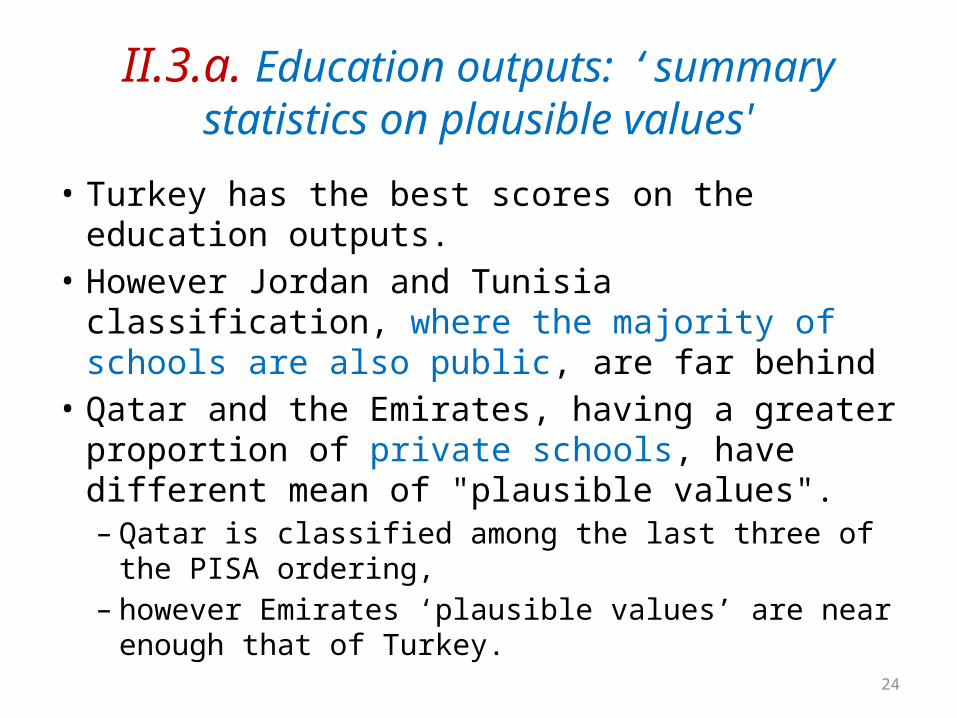
II.3.a. Education outputs: ‘ summary statistics on plausible values'
• Turkey has the best scores on the education outputs. • However Jordan and Tunisia classification, where the
majority of schools are also public, are far behind• Qatar and the Emirates, having a greater proportion of
private schools, have different mean of "plausible values". – Qatar is classified among the last three of the PISA
ordering, – however Emirates ‘plausible values’ are near enough that
of Turkey.
25
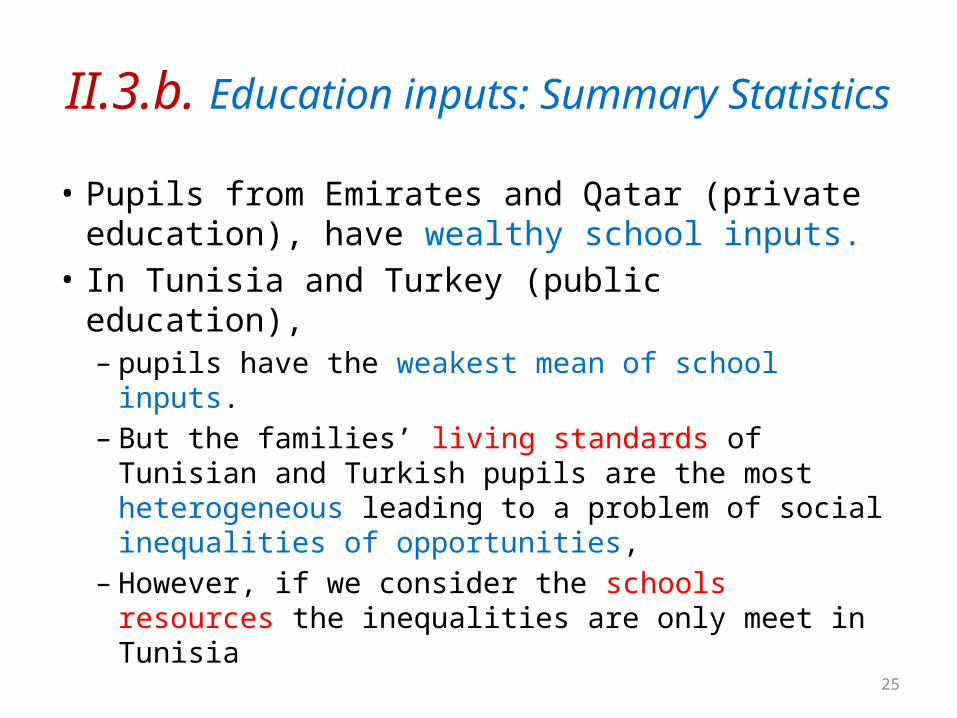
II.3.b. Education inputs: Summary Statistics
• Pupils from Emirates and Qatar (private education), have wealthy school inputs.
• In Tunisia and Turkey (public education), – pupils have the weakest mean of school inputs. – But the families’ living standards of Tunisian and
Turkish pupils are the most heterogeneous leading to a problem of social inequalities of opportunities,
– However, if we consider the schools resources the inequalities are only meet in Tunisia
26
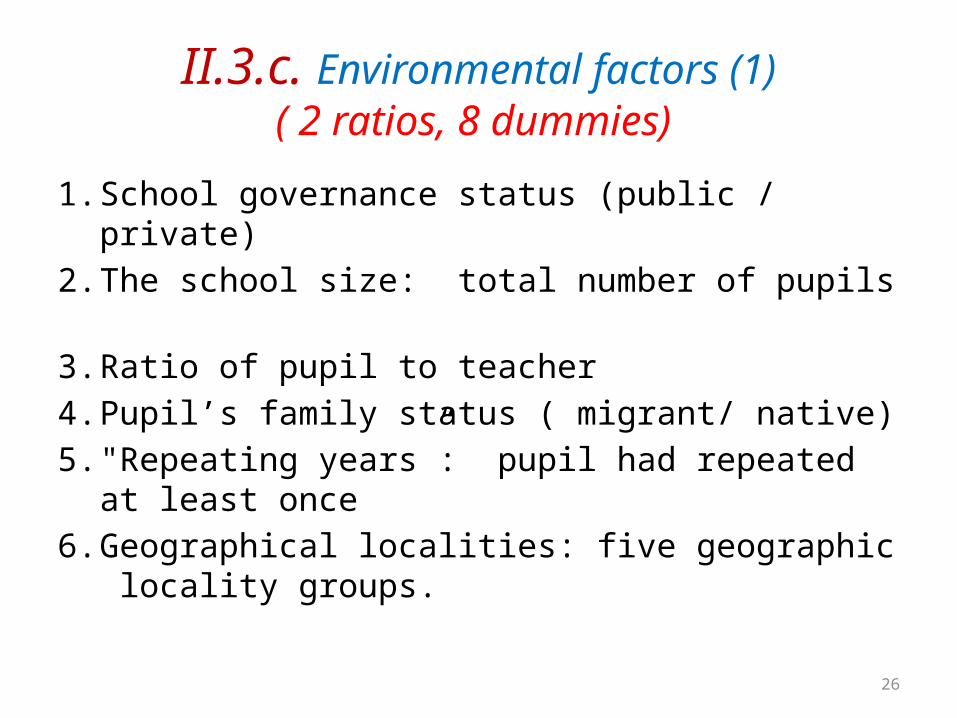
II.3.c. Environmental factors (1)( 2 ratios, 8 dummies)
1. School governance status (public / private)2. The school size: total number of pupils 3. Ratio of pupil to teacher4. Pupil’s family status ( migrant/ native)5. "Repeating years”: pupil had repeated at
least once6. Geographical localities: five geographic
locality groups.
27
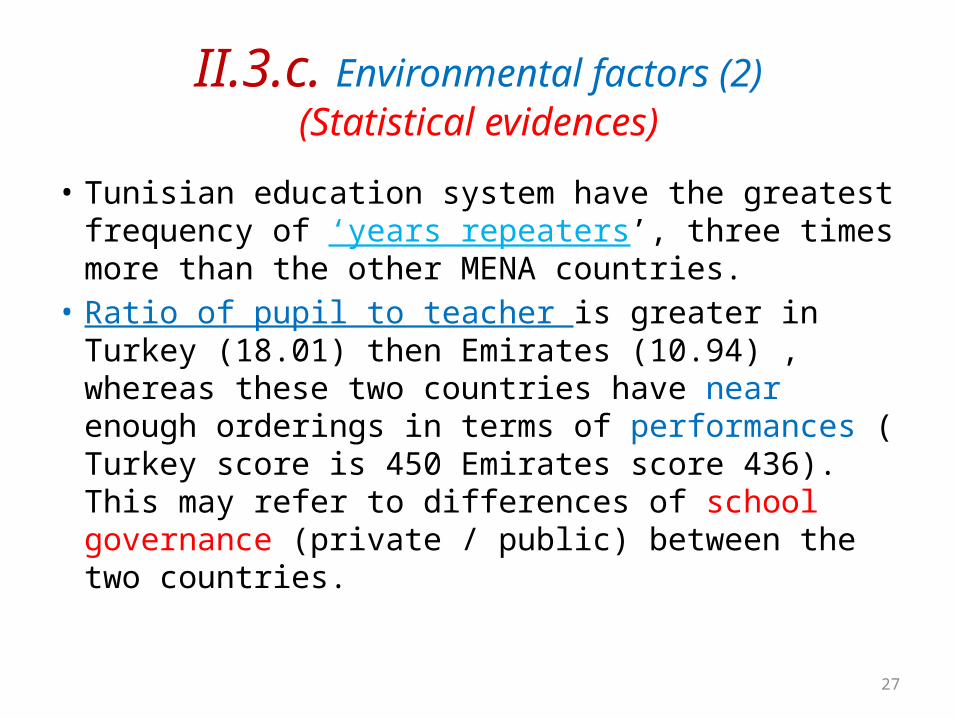
II.3.c. Environmental factors (2)(Statistical evidences)
• Tunisian education system have the greatest frequency of ‘years repeaters’, three times more than the other MENA countries.
• Ratio of pupil to teacher is greater in Turkey (18.01) then Emirates (10.94) , whereas these two countries have near enough orderings in terms of performances ( Turkey score is 450 Emirates score 436). This may refer to differences of school governance (private / public) between the two countries.
28
II.3.b. Environmental factors (3)(Statistical evidences)
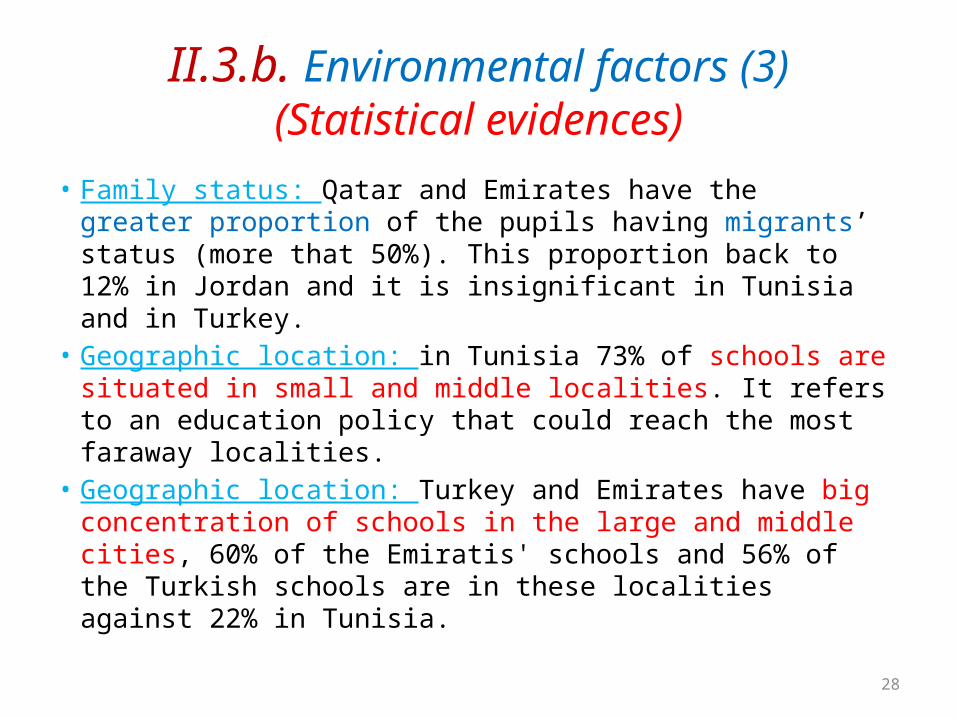
• Family status: Qatar and Emirates have the greater proportion of the pupils having migrants’ status (more that 50%). This proportion back to 12% in Jordan and it is insignificant in Tunisia and in Turkey.
• Geographic location: in Tunisia 73% of schools are situated in small and middle localities. It refers to an education policy that could reach the most faraway localities.
• Geographic location: Turkey and Emirates have big concentration of schools in the large and middle cities, 60% of the Emiratis' schools and 56% of the Turkish schools are in these localities against 22% in Tunisia.
29
III. Estimation Results of Education output
distance function
30
Outline
III.1. Comments on the estimations of the distance function parameters
III.2. Analysis of the global efficiency levels
31
III.1. Comments on estimations of the distance function parameters (1)
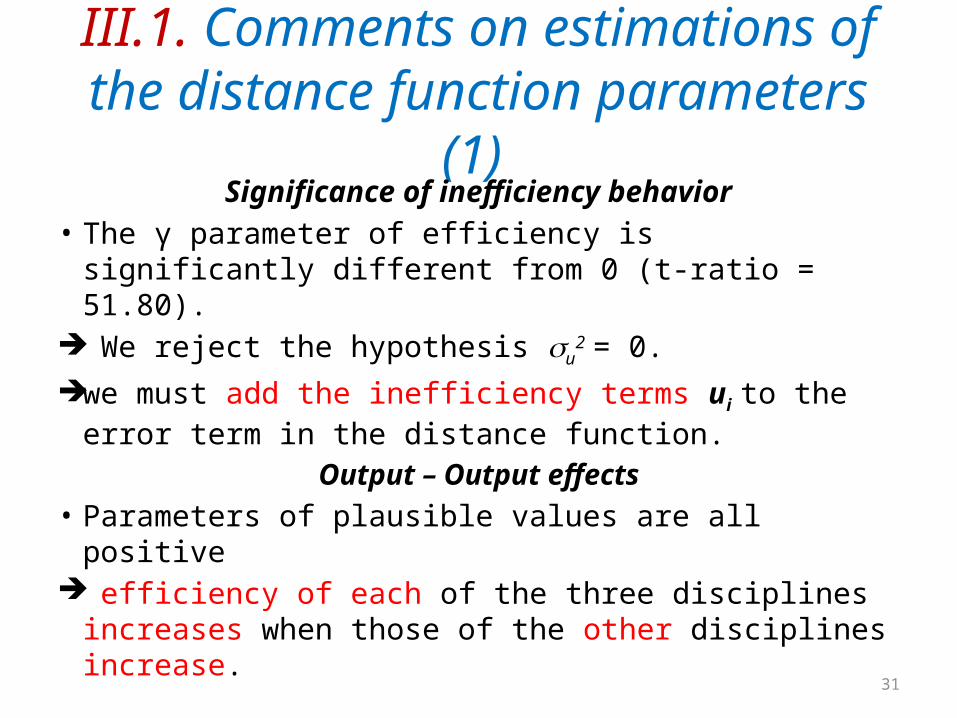
Significance of inefficiency behavior• The γ parameter of efficiency is significantly
different from 0 (t-ratio = 51.80). We reject the hypothesis u
2 = 0. we must add the inefficiency terms ui to the error
term in the distance function.Output – Output effects
• Parameters of plausible values are all positive efficiency of each of the three disciplines increases
when those of the other disciplines increase.
32
III.1. Comments on estimations of the distance function parameters (2)
Environmental factors effects
• an increase of school size contributes to inefficiency reduction.
• ratio of pupil by teacher increases inefficiency.• “repeating years” increases inefficiency. • if pupil's parents are descended of migration
drives reduction of inefficiency. migrants’ families may consider education as a social elevator.
33
III.1. Comments on estimations of the distance function parameter (3)
• access to the private school permits a reduction of the pupil's inefficiency.
• if we keep all variables unchanged, the Turkish and Tunisian pupils are more efficient. – This result makes evidence of the previous acts of the public
education policies in Turkey and in Tunisia. – the first date of launching these education policies.
• efficiency levels change within countries according to the geographical localization sheltering schools. Pupils in big cities are less inefficient than those of the small and middle cities or small localities.
34
III.2. Analysis of the global efficiency levels (1) : (Score of global efficiency)• The estimation of the distance function
parameters helps to identify scores of efficiency assigned to each pupil.
• The scores vary between 0 and 1. • When this score equal zero, the education
system is totally inefficient. • if the score is equal one, we have perfect
efficiency.
35
III.2. Analysis of the global efficiency levels (2) (Results on All MENA countries)
• the mean level of efficiency of the MENA countries pupils is 0.731, which means that the pupils are considered efficient to 73.1% in relation to the "best practices”.
• Thus pupils of the MENA region may increase their education performances by 26.9%.
36
III.2. Analysis of the global efficiency levels (3) (Results among MENA countries)
• Turkish education system have a mean efficiency level of 89.1% and a minimal efficiency level around 57%.
• Global efficiency of Emiratis pupils (71.8%) and of Jordanian pupils (70.2%) are nearer the MENA average.
• Global efficiency of Tunisian pupils (76.2%) is slightly above the MENA average.
• Qataris pupils are the least efficient: efficiency mean equal to 61.5% and a minimum of 28.3%.
37
III.2. Analysis of the global efficiency levels (4) (Results according to schools status)
• pupils of private schools record a mean efficiency rate slightly superior to public schools.
• However if we differentiate our analyses by country and by school status, we find that in Tunisia public schools are on average more efficient (0.762) then private schools (0.60).
38
III.2. Analysis of the global efficiency levels (5): Results according to the residence status
(native / immigrant)
• In the golf countries we found the greater number of pupils whose parents are migrant (about 50%) .
• A gap in favor of migrants in terms of global efficiency (differential of more than 10 %):– in Qatar (55% for the natives , 67% for migrants) – In Emirates (66% for the natives,76% for migrants).
39
III.2. Analysis of the global efficiency levels (6): Results according to pupil's status
(repeater / non repeater)
There is a gap of 8.5 % between the repeaters and the non repeaters in terms of global efficiency.
40
III.2. Analysis of the global efficiency levels (7): Results according to the geographical
locality• A gap of 6.5 % between pupils of big cities and
those of the small localities. • The residence locality size may improve global
efficiency of pupils. • Big city allows an easier access to medical care
and to some public services but also to better educations of the children.

41
IV. Conclusions and Policy
Recommendations
42
• The paper identify determinants of the cognitive achievements in five MENA countries.
• We considered an education production function separating inefficiency from input effects.
Conclusion….
43
• We validate the existence of inefficiency in the MENA countries education systems.
• The mean global efficiency is about 73%, pupils of the region can increase their performance by
27%. • divergences – between the five countries, – between the different geographical localities within
these countries – among school status, pupil status and their family
status.
Conclusion….
44
• school size contributes to the reduction of inefficiency. disregards education policy that pushes to reduce
sizes of schools.
• However, there will be an increase of inefficiency when – the ratio of pupils to teacher increases, – the number of students ‘repeating the year’ increases.
Specific effects of environmental factors….
45
Specific policies increasing the number of teachers by pupil and improving teachers skills will help pupils in difficulties thanks to a specific support but not through ‘repeating years’.
‘year repeating’ didn't bring the obvious proof to improved education performance. Besides, it is an expensive solution against pupil’s difficulty: – the repeaters are more exposed to the school unhooking risk or
to remain longer in the school system, – which delays their entry in the active life.
Policies through environmental factors….
46
• For constant inputs, the Turkish and the Tunisian pupils appear more efficient. This efficiency is due to the forwardness of the educational policies in the two countries.
• However the gap of efficiency and school performance is counterbalanced in the Golf countries by the increase of input given to pupils, families and schools.
• Qatar and the UAE tried also to reduce education system inefficiency through private governance of their schools.
Success Stories….

47
• We should have a positive discrimination toward the least efficient pupils in Tunisia and in Turkey, where the school inputs are limited.
• The improvement of the school inputs quality should target mainly the small geographic localities.
• Within geographic localities we calls to the emergency of a positive discrimination toward the most underprivileged schools.
Positive discrimination ….

48
Thanks for your
attention

49
50
II.3.a. Education outputs (1): 'plausible values'
• The measurement of cognitive skills structure is very diffuse, including errors
• PISA analyze uses measures based on the model of Rasch (1960), using “plausible values" instead of the mean values of pupil's cognition.
• The "plausible values" are representations of the extended cognition component of each pupil