Embed Size (px)
DESCRIPTION
Memory Forensics Cheat Sheet v1
Citation preview
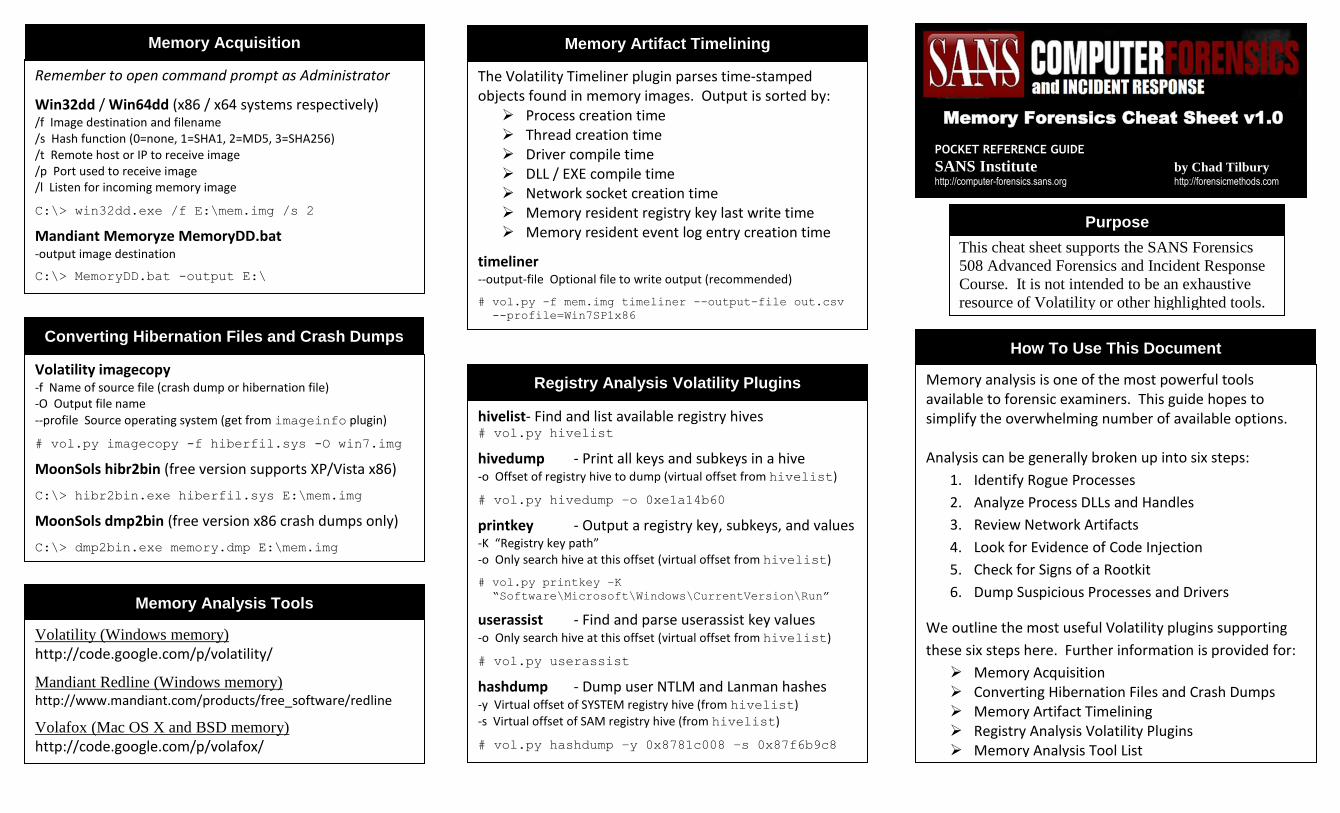
This cheat sheet supports the SANS Forensics
508 Advanced Forensics and Incident Response
Course. It is not intended to be an exhaustive
resource of Volatility or other highlighted tools.
The Volatility Timeliner plugin parses time-stamped objects found in memory images. Output is sorted by:
Process creation time Thread creation time Driver compile time DLL / EXE compile time Network socket creation time Memory resident registry key last write time Memory resident event log entry creation time
timeliner --output-file Optional file to write output (recommended)
# vol.py -f mem.img timeliner --output-file out.csv
--profile=Win7SP1x86
Memory Artifact Timelining
Purpose
How To Use This Document
Memory analysis is one of the most powerful tools available to forensic examiners. This guide hopes to simplify the overwhelming number of available options. Analysis can be generally broken up into six steps:
1. Identify Rogue Processes
2. Analyze Process DLLs and Handles
3. Review Network Artifacts
4. Look for Evidence of Code Injection
5. Check for Signs of a Rootkit
6. Dump Suspicious Processes and Drivers
We outline the most useful Volatility plugins supporting
these six steps here. Further information is provided for:
Memory Acquisition Converting Hibernation Files and Crash Dumps Memory Artifact Timelining Registry Analysis Volatility Plugins Memory Analysis Tool List
Remember to open command prompt as Administrator
Win32dd / Win64dd (x86 / x64 systems respectively) /f Image destination and filename /s Hash function (0=none, 1=SHA1, 2=MD5, 3=SHA256) /t Remote host or IP to receive image /p Port used to receive image /l Listen for incoming memory image
C:\> win32dd.exe /f E:\mem.img /s 2
Mandiant Memoryze MemoryDD.bat -output image destination
C:\> MemoryDD.bat -output E:\
Memory Acquisition
Volatility imagecopy -f Name of source file (crash dump or hibernation file) -O Output file name
--profile Source operating system (get from imageinfo plugin)
# vol.py imagecopy -f hiberfil.sys -O win7.img
MoonSols hibr2bin (free version supports XP/Vista x86)
C:\> hibr2bin.exe hiberfil.sys E:\mem.img
MoonSols dmp2bin (free version x86 crash dumps only)
C:\> dmp2bin.exe memory.dmp E:\mem.img
Converting Hibernation Files and Crash Dumps
Memory Forensics Cheat Sheet v1.0
POCKET REFERENCE GUIDE
SANS Institute by Chad Tilbury http://computer-forensics.sans.org http://forensicmethods.com
hivelist- Find and list available registry hives # vol.py hivelist
hivedump - Print all keys and subkeys in a hive -o Offset of registry hive to dump (virtual offset from hivelist)
# vol.py hivedump –o 0xe1a14b60
printkey - Output a registry key, subkeys, and values -K “Registry key path” -o Only search hive at this offset (virtual offset from hivelist)
# vol.py printkey –K
“Software\Microsoft\Windows\CurrentVersion\Run”
userassist - Find and parse userassist key values -o Only search hive at this offset (virtual offset from hivelist)
# vol.py userassist
hashdump - Dump user NTLM and Lanman hashes -y Virtual offset of SYSTEM registry hive (from hivelist)
-s Virtual offset of SAM registry hive (from hivelist)
# vol.py hashdump –y 0x8781c008 –s 0x87f6b9c8
Registry Analysis Volatility Plugins
Memory Analysis Tools
Volatility (Windows memory)
http://code.google.com/p/volatility/
Mandiant Redline (Windows memory) http://www.mandiant.com/products/free_software/redline
Volafox (Mac OS X and BSD memory)
http://code.google.com/p/volafox/
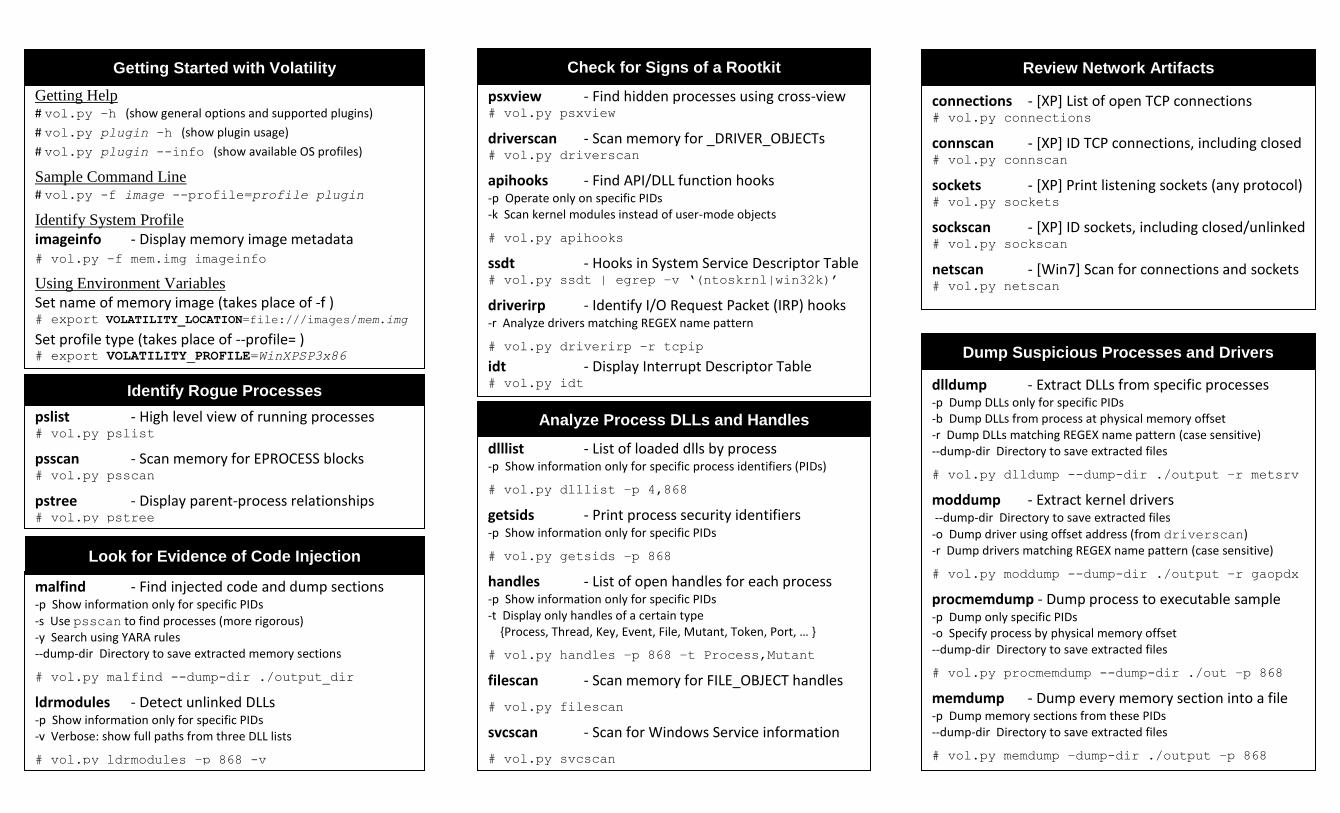
Dump Suspicious Processes and Drivers
pslist - High level view of running processes # vol.py pslist
psscan - Scan memory for EPROCESS blocks # vol.py psscan
pstree - Display parent-process relationships # vol.py pstree
Identify Rogue Processes
dlllist - List of loaded dlls by process -p Show information only for specific process identifiers (PIDs)
# vol.py dlllist –p 4,868
getsids - Print process security identifiers -p Show information only for specific PIDs
# vol.py getsids –p 868
handles - List of open handles for each process -p Show information only for specific PIDs -t Display only handles of a certain type {Process, Thread, Key, Event, File, Mutant, Token, Port, … }
# vol.py handles –p 868 –t Process,Mutant
filescan - Scan memory for FILE_OBJECT handles
# vol.py filescan
svcscan - Scan for Windows Service information
# vol.py svcscan
Analyze Process DLLs and Handles
dlldump - Extract DLLs from specific processes -p Dump DLLs only for specific PIDs -b Dump DLLs from process at physical memory offset -r Dump DLLs matching REGEX name pattern (case sensitive) --dump-dir Directory to save extracted files
# vol.py dlldump --dump-dir ./output –r metsrv
moddump - Extract kernel drivers --dump-dir Directory to save extracted files
-o Dump driver using offset address (from driverscan) -r Dump drivers matching REGEX name pattern (case sensitive)
# vol.py moddump --dump-dir ./output –r gaopdx
procmemdump - Dump process to executable sample -p Dump only specific PIDs -o Specify process by physical memory offset --dump-dir Directory to save extracted files
# vol.py procmemdump --dump-dir ./out –p 868
memdump - Dump every memory section into a file -p Dump memory sections from these PIDs --dump-dir Directory to save extracted files
# vol.py memdump –dump-dir ./output –p 868
connections - [XP] List of open TCP connections # vol.py connections
connscan - [XP] ID TCP connections, including closed # vol.py connscan
sockets - [XP] Print listening sockets (any protocol) # vol.py sockets
sockscan - [XP] ID sockets, including closed/unlinked # vol.py sockscan
netscan - [Win7] Scan for connections and sockets # vol.py netscan
Review Network Artifacts
malfind - Find injected code and dump sections -p Show information only for specific PIDs
-s Use psscan to find processes (more rigorous) -y Search using YARA rules --dump-dir Directory to save extracted memory sections
# vol.py malfind --dump-dir ./output_dir
ldrmodules - Detect unlinked DLLs -p Show information only for specific PIDs -v Verbose: show full paths from three DLL lists
# vol.py ldrmodules –p 868 -v
Look for Evidence of Code Injection
psxview - Find hidden processes using cross-view # vol.py psxview
driverscan - Scan memory for _DRIVER_OBJECTs # vol.py driverscan
apihooks - Find API/DLL function hooks -p Operate only on specific PIDs -k Scan kernel modules instead of user-mode objects
# vol.py apihooks
ssdt - Hooks in System Service Descriptor Table # vol.py ssdt | egrep –v ‘(ntoskrnl|win32k)’
driverirp - Identify I/O Request Packet (IRP) hooks -r Analyze drivers matching REGEX name pattern
# vol.py driverirp –r tcpip
idt - Display Interrupt Descriptor Table # vol.py idt
Check for Signs of a Rootkit
Getting Help # vol.py –h (show general options and supported plugins)
# vol.py plugin –h (show plugin usage)
# vol.py plugin --info (show available OS profiles)
Sample Command Line # vol.py -f image --profile=profile plugin
Identify System Profile
imageinfo - Display memory image metadata # vol.py –f mem.img imageinfo
Using Environment Variables
Set name of memory image (takes place of -f ) # export VOLATILITY_LOCATION=file:///images/mem.img
Set profile type (takes place of --profile= ) # export VOLATILITY_PROFILE=WinXPSP3x86
Getting Started with Volatility