Embed Size (px)
Citation preview

1
AAA Memorial Day
CONFIDENTIAL FOR INTERNAL USE ONLY
Memorial Day 2012 Travel Forecast
Prepared for:
American Automobile Association
FOR INTERNAL USE ONLY
Travel Forecast
Prepared for:
American Automobile Association
May 15, 2012
1 IHS Global Insight / AAA Memorial Day 2012 Forecast
Table of Contents
Table of Contents .................................................................................................................................................................... 1
Holiday Forecast Methodology: A Brief Overview................................................................................................................... 2
Memorial Day Holiday, 2012 Travel Forecast......................................................................................................................... 3
Travel by Mode of Transportation ........................................................................................................................................... 5
Travel by Region: East South Central................................................................................................................................... 10
Travel by Region: Middle Atlantic ......................................................................................................................................... 12
Travel by Region: Mountain .................................................................................................................................................. 14
Travel by Region: New England............................................................................................................................................ 16
Travel by Region: Pacific ...................................................................................................................................................... 18
Travel by Region: South Atlantic........................................................................................................................................... 20
Travel by Region: West North Central .................................................................................................................................. 22
Travel by Region: West South Central.................................................................................................................................. 24
Memorial Day 2012 Holiday Traveler Profile Survey Methodology ...................................................................................... 26
Change in the Average Memorial Day Traveler.................................................................................................................... 27
Travel Distances ................................................................................................................................................................... 28
Total Spending ...................................................................................................................................................................... 29
Party Composition................................................................................................................................................................. 31
Activities ................................................................................................................................................................................ 32
The Impact of Rising Fuel Prices on Travel Plans ................................................................................................................ 34
Addendum 1: US Economic Forecast Summary: Training Wheels Coming Off?................................................................. 36
Addendum 2: US Regional Forecast Summary: Training Wheels Coming Off? .................................................................. 38
Regional definitions used throughout the report:
East North Central (ENC): IL, IN, MI, OH, WI
East South Central (ESC): AL, KY, MS, TN
Middle Atlantic (MATL): NJ, NY, PA
Mountain (MTN): AZ, CO, ID, MT, NM, NV, UT, WY
New England (NENG): CT, MA, ME, NH, RI, VT
South Atlantic (SATL): DC, DE, FL, GA, MD, NC, SC, VA, WV
West South Central (WSC): AR, LA, OK, TX
West North Central (WNC): IA, KS, MN, MO, ND, NE, SD
Pacific (PAC): AK, CA, HI, OR, WA
2 IHS Global Insight / AAA Memorial Day 2012 Forecast
Holiday Forecast Methodology: A Brief Overview
The AAA Memorial Day 2012 Travel Forecast combines information from several sources to provide a prospective
assessment of likely travel patterns for the upcoming holiday weekend. This report comprises two key components: the
travel forecast and the holiday traveler profile. The travel forecast is based on economic conditions while the holiday
traveler profile is developed employing survey data on travel behaviors. This approach provides the most comprehensive
and detailed understanding of holiday travel at both the national and regional levels. In addition, the regional travel
sections in this report have been enhanced to incorporate information about the state of the local tourism industries
throughout the United States.
Holiday Travel Forecast
In cooperation with AAA, IHS Global Insight developed an approach to forecast domestic travel volumes. The economic
variables used to forecast travel for the current holiday are leveraged from IHS Global Insight. These data include
macroeconomic drivers such as employment, output, household net worth, asset prices including stock indices, interest
rates, housing market indicators, and variables related to travel and tourism, including prices of gasoline, airline travel,
and hotel stays.
The historical travel volume estimates come from the ongoing travel survey database of D.K. Shifflet & Associates, the
premier source of US resident travel volume and behavior. DKSA interviews over 50,000 US households per month
tracking trip incidence, party composition, traveler behavior, and spending—all after the trips have been taken.
Holiday travel is forecast by person-trips, where a person-trip is defined as a trip that involves travel of 50 miles or more
away from home. In particular, AAA and IHS Global Insight forecasts total US holiday travel, travel by mode of
transportation, and travel by US census region. The Travel Forecast presented in this report was prepared the week of
April 23.
Holiday Traveler Profile
The Holiday Traveler Profile is a survey of intended travel behaviors related to party composition, travel distances, trip
expenditures, and vacation activities conducted by D.K. Shifflet & Associates. The initial survey includes 1,351
households, out of which only the respondents intending to travel during the designated holiday are interviewed in detail
about their anticipated trips. For Memorial Day 2012, 315 respondents were interviewed in detail about their intended
trips. The survey was in the field from Friday, April 20 to Tuesday, April 24, 2012.
Memorial Day Holiday Travel Period
For purposes of this forecast the Memorial Day holiday travel period is defined as trips that include travel of 50 miles or
more away from home during the five-day period from Thursday, May 24 to Monday, May 28.
3
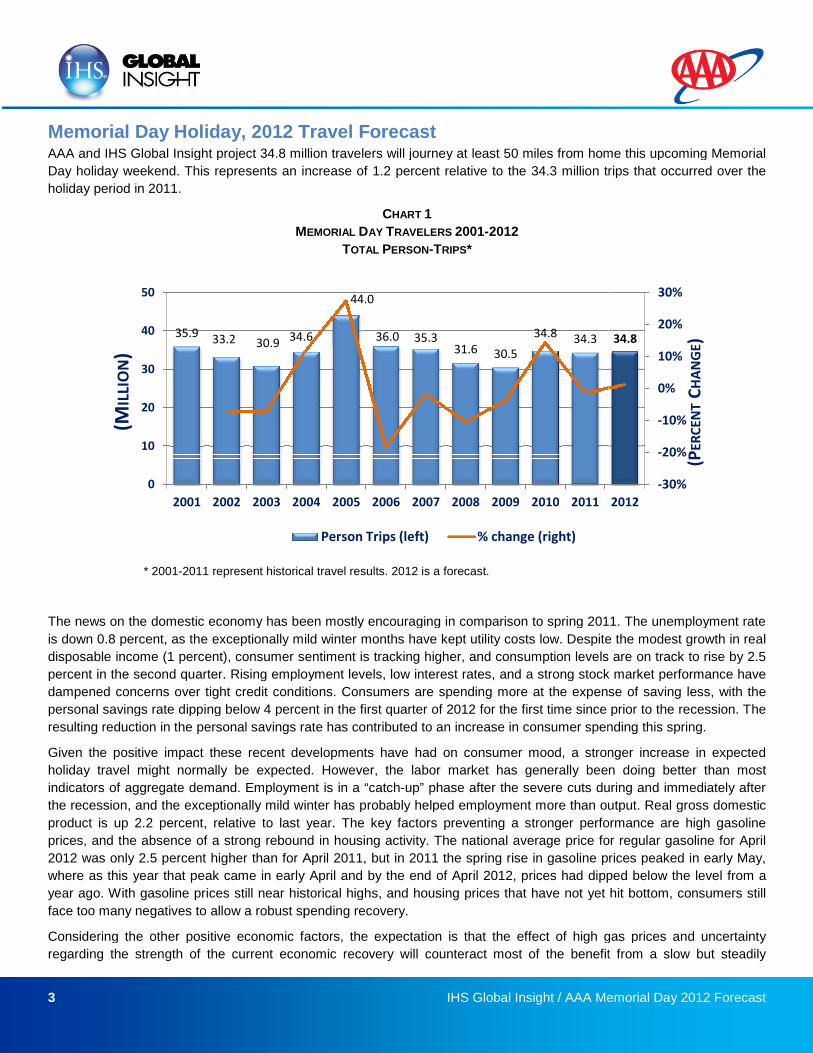
Memorial Day Holiday, 2012 Travel ForecastAAA and IHS Global Insight project 34.8 million travelers will journey at least 50 miles from home this upcoming Memorial
Day holiday weekend. This represents an increase of 1.2 percent relative to the 34.3 million trips that occurred over the
holiday period in 2011.
M
* 2001-2011 represent historical
The news on the domestic economy has been mostly encouraging in comparison to spring 2011. The unemployment rate
is down 0.8 percent, as the exceptionally mild winter months have kept utility costs low. Despite the modest growth in rea
disposable income (1 percent), consumer sentiment is tracking higher, and consumption levels are on track to rise by 2.5
percent in the second quarter. Rising employment levels, low interest rates
dampened concerns over tight credit conditions
personal savings rate dipping below 4 percent in the first quarter of 2012 for the first time since prior to the recession. T
resulting reduction in the personal savings rate has contributed to an increase in consumer spending this spring.
Given the positive impact these recent developments have had on consumer mood, a stronger increase in expected
holiday travel might normally be expected. However, the
indicators of aggregate demand. Employment
the recession, and the exceptionally mild winter has probably helped employment m
product is up 2.2 percent, relative to last year. The key factors preventing a stronger performance are high gasoline
prices, and the absence of a strong rebound in housing activity. The national average price for regul
2012 was only 2.5 percent higher than for April 2011, but
where as this year that peak came in early April and by the end of April 2012, prices had dipped below the level
year ago. With gasoline prices still near historical highs
face too many negatives to allow a robust spending recovery.
Considering the other positive economic factors, the expectati
regarding the strength of the current economic
35.9 33.2 30.9 34.6
0
10
20
30
40
50
2001 2002 2003 2004
(MIL
LIO
N)
IHS Global Insight / AAA Memorial Day 2012 Forecast
12 Travel ForecastAAA and IHS Global Insight project 34.8 million travelers will journey at least 50 miles from home this upcoming Memorial
sents an increase of 1.2 percent relative to the 34.3 million trips that occurred over the
CHART 1
MEMORIAL DAY TRAVELERS 2001-2012
TOTAL PERSON-TRIPS*
historical travel results. 2012 is a forecast.
The news on the domestic economy has been mostly encouraging in comparison to spring 2011. The unemployment rate
is down 0.8 percent, as the exceptionally mild winter months have kept utility costs low. Despite the modest growth in rea
percent), consumer sentiment is tracking higher, and consumption levels are on track to rise by 2.5
percent in the second quarter. Rising employment levels, low interest rates, and a strong stock market performance have
erns over tight credit conditions. Consumers are spending more at the expense of saving less,
personal savings rate dipping below 4 percent in the first quarter of 2012 for the first time since prior to the recession. T
e personal savings rate has contributed to an increase in consumer spending this spring.
Given the positive impact these recent developments have had on consumer mood, a stronger increase in expected
holiday travel might normally be expected. However, the labor market has generally been doing better than most
indicators of aggregate demand. Employment is in a “catch-up” phase after the severe cuts during and immediately after
the recession, and the exceptionally mild winter has probably helped employment more than output. Real gross domestic
product is up 2.2 percent, relative to last year. The key factors preventing a stronger performance are high gasoline
prices, and the absence of a strong rebound in housing activity. The national average price for regul
percent higher than for April 2011, but in 2011 the spring rise in gasoline prices peaked in early May,
where as this year that peak came in early April and by the end of April 2012, prices had dipped below the level
still near historical highs, and housing prices that have not yet hit bottom, consumers still
face too many negatives to allow a robust spending recovery.
Considering the other positive economic factors, the expectation is that the effect of high gas prices and uncertaint
economic recovery will counteract most of the benefit from a slow but steadily
34.6
44.0
36.0 35.331.6 30.5
34.8 34.3
2004 2005 2006 2007 2008 2009 2010 2011
Person Trips (left) % change (right)
IHS Global Insight / AAA Memorial Day 2012 Forecast
AAA and IHS Global Insight project 34.8 million travelers will journey at least 50 miles from home this upcoming Memorial
sents an increase of 1.2 percent relative to the 34.3 million trips that occurred over the
The news on the domestic economy has been mostly encouraging in comparison to spring 2011. The unemployment rate
is down 0.8 percent, as the exceptionally mild winter months have kept utility costs low. Despite the modest growth in real
percent), consumer sentiment is tracking higher, and consumption levels are on track to rise by 2.5
and a strong stock market performance have
Consumers are spending more at the expense of saving less, with the
personal savings rate dipping below 4 percent in the first quarter of 2012 for the first time since prior to the recession. The
e personal savings rate has contributed to an increase in consumer spending this spring.
Given the positive impact these recent developments have had on consumer mood, a stronger increase in expected
labor market has generally been doing better than most
up” phase after the severe cuts during and immediately after
re than output. Real gross domestic
product is up 2.2 percent, relative to last year. The key factors preventing a stronger performance are high gasoline
prices, and the absence of a strong rebound in housing activity. The national average price for regular gasoline for April
in 2011 the spring rise in gasoline prices peaked in early May,
where as this year that peak came in early April and by the end of April 2012, prices had dipped below the level from a
prices that have not yet hit bottom, consumers still
gas prices and uncertainty
recovery will counteract most of the benefit from a slow but steadily
34.8
-30%
-20%
-10%
0%
10%
20%
30%
2012
(PER
CEN
TC
HA
NG
E)

4 IHS Global Insight / AAA Memorial Day 2012 Forecast
improving labor market. That is supported by the expectations of travelers for this holiday, who have planned shorter
distance trips this holiday period, as rising gasoline prices are squeezing consumers’ spending power this spring.
The Memorial Day holiday typically serves as the “unofficial start” of the summer travel season, while also serving as a
needed remembrance of those who have died in military service.
5 IHS Global Insight / AAA Memorial Day 2012 Forecast
“Going on 10 day cruise this
year. Went on long weekend
while driving last year.”
New England Respondent
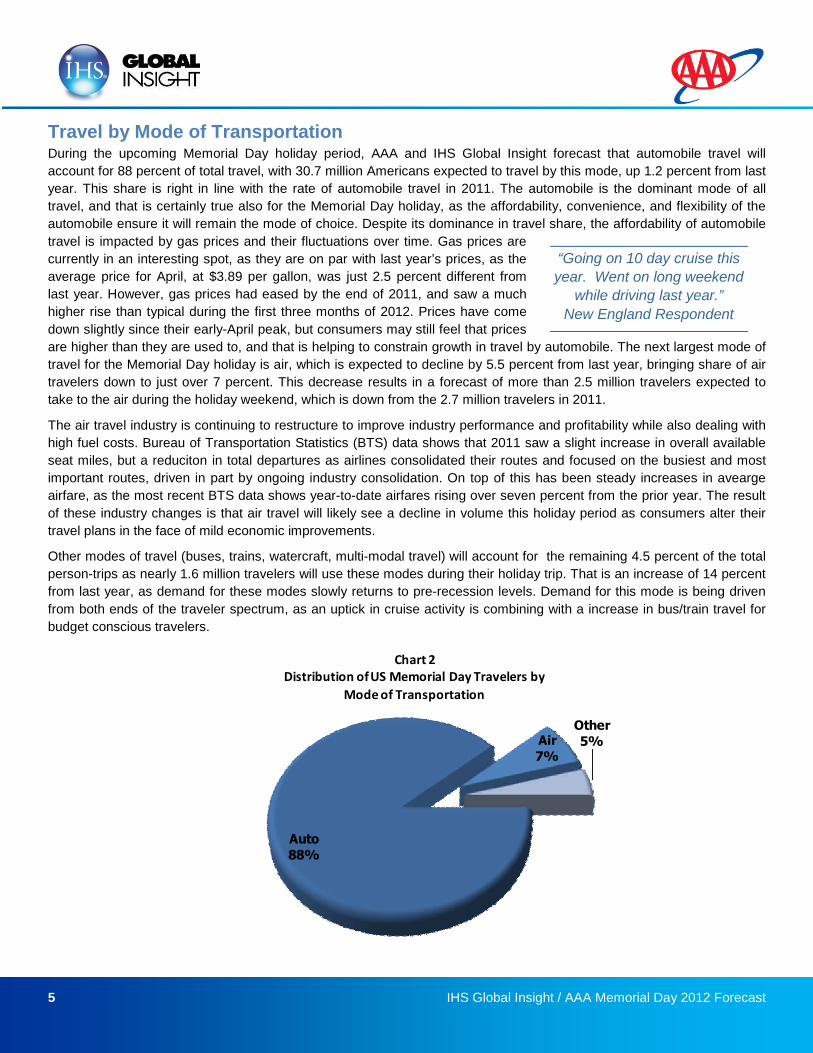
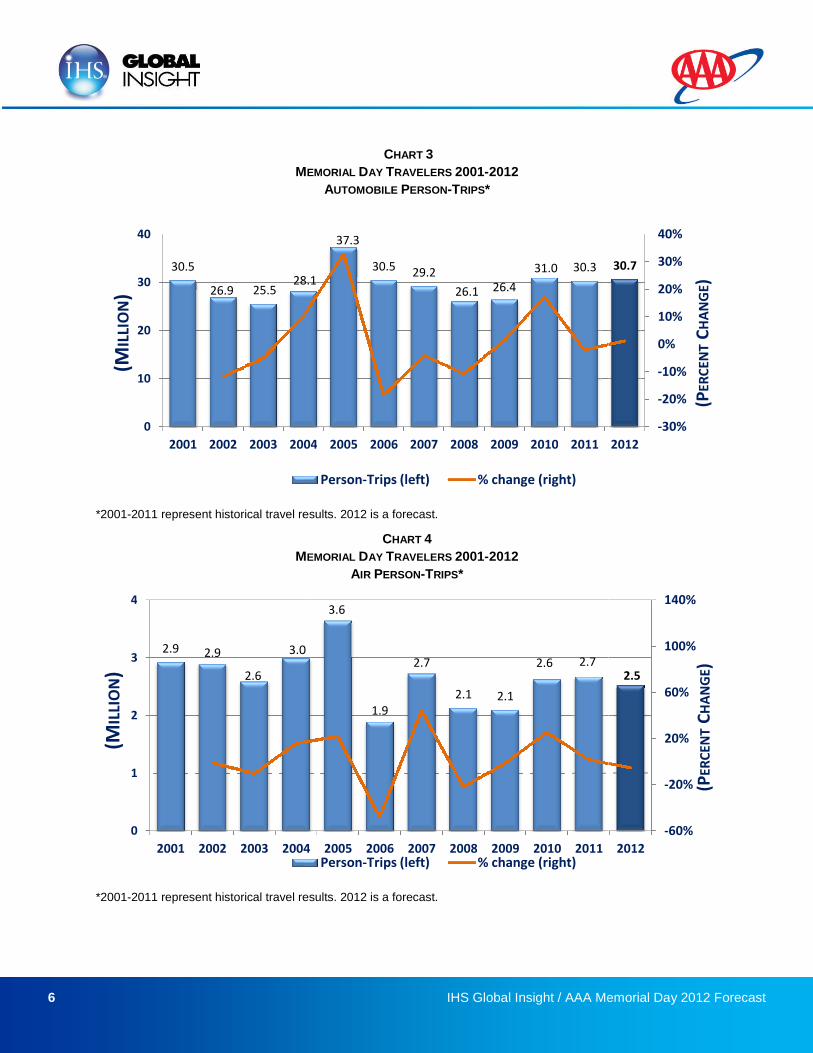
Travel by Mode of TransportationDuring the upcoming Memorial Day holiday period, AAA and IHS Global Insight forecast that automobile travel will
account for 88 percent of total travel, with 30.7 million Americans expected to travel by this mode, up 1.2 percent from last
year. This share is right in line with the rate of automobile travel in 2011. The automobile is the dominant mode of all
travel, and that is certainly true also for the Memorial Day holiday, as the affordability, convenience, and flexibility of the
automobile ensure it will remain the mode of choice. Despite its dominance in travel share, the affordability of automobile
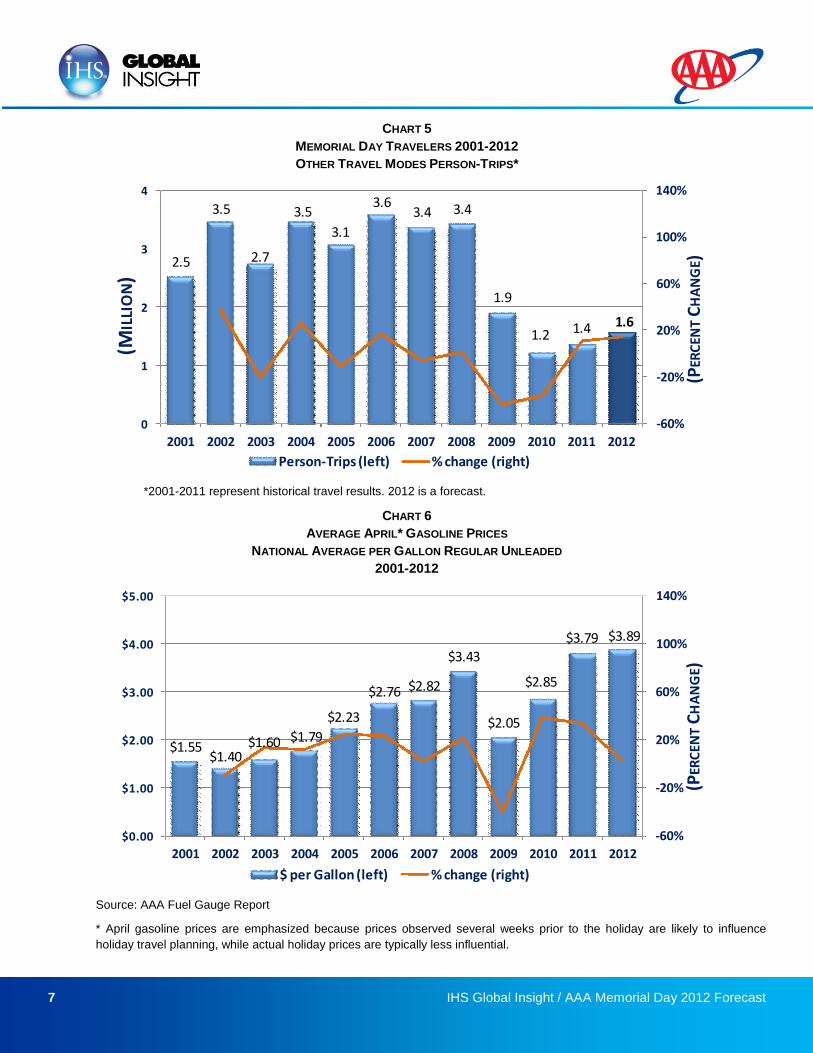
travel is impacted by gas prices and their fluctuations over time. Gas prices are
currently in an interesting spot, as they are on par with last year’s prices, as the
average price for April, at $3.89 per gallon, was just 2.5 percent different from
last year. However, gas prices had eased by the end of 2011, and saw a much
higher rise than typical during the first three months of 2012. Prices have come
down slightly since their early-April peak, but consumers may still feel that prices
are higher than they are used to, and that is helping to constrain growth in travel by automobile. The next largest mode of
travel for the Memorial Day holiday is air, which is expected to decline by 5.5 percent from last year, bringing share of air
travelers down to just over 7 percent. This decrease results in a forecast of more than 2.5 million travelers expected to
take to the air during the holiday weekend, which is down from the 2.7 million travelers in 2011.
The air travel industry is continuing to restructure to improve industry performance and profitability while also dealing with
high fuel costs. Bureau of Transportation Statistics (BTS) data shows that 2011 saw a slight increase in overall available
seat miles, but a reduciton in total departures as airlines consolidated their routes and focused on the busiest and most
important routes, driven in part by ongoing industry consolidation. On top of this has been steady increases in avearge
airfare, as the most recent BTS data shows year-to-date airfares rising over seven percent from the prior year. The result
of these industry changes is that air travel will likely see a decline in volume this holiday period as consumers alter their
travel plans in the face of mild economic improvements.
Other modes of travel (buses, trains, watercraft, multi-modal travel) will account for the remaining 4.5 percent of the total
person-trips as nearly 1.6 million travelers will use these modes during their holiday trip. That is an increase of 14 percent
from last year, as demand for these modes slowly returns to pre-recession levels. Demand for this mode is being driven
from both ends of the traveler spectrum, as an uptick in cruise activity is combining with a increase in bus/train travel for
budget conscious travelers.
Auto88%
Air7%
Other5%
Chart 2Distribution ofUS Memorial Day Travelers by
Mode of Transportation
6
M
*2001-2011 represent historical travel results.
M
*2001-2011 represent historical travel results.
30.5
26.9 25.528.1
0
10
20
30
40
2001 2002 2003 2004
(MIL
LIO
N)
2.9 2.9
2.6
3.0
0
1
2
3
4
2001 2002 2003 2004
(MIL
LIO
N)
IHS Global Insight / AAA Memorial Day 2012 Forecast
CHART 3
MEMORIAL DAY TRAVELERS 2001-2012
AUTOMOBILE PERSON-TRIPS*
l travel results. 2012 is a forecast.
CHART 4
MEMORIAL DAY TRAVELERS 2001-2012
AIR PERSON-TRIPS*
travel results. 2012 is a forecast.
28.1
37.3
30.5 29.2
26.1 26.4
31.0 30.3
2004 2005 2006 2007 2008 2009 2010 2011
Person-Trips (left) % change (right)
3.0
3.6
1.9
2.7
2.1 2.1
2.6 2.7
2004 2005 2006 2007 2008 2009 2010 2011Person-Trips (left) % change (right)
IHS Global Insight / AAA Memorial Day 2012 Forecast
30.7
-30%
-20%
-10%
0%
10%
20%
30%
40%
2012
(PER
CEN
TC
HA
NG
E)
2.5
-60%
-20%
20%
60%
100%
140%
2012
(PER
CEN
TC
HA
NG
E)
7 IHS Global Insight / AAA Memorial Day 2012 Forecast
CHART 5
MEMORIAL DAY TRAVELERS 2001-2012
OTHER TRAVEL MODES PERSON-TRIPS*
*2001-2011 represent historical travel results. 2012 is a forecast.
CHART 6
AVERAGE APRIL* GASOLINE PRICES
NATIONAL AVERAGE PER GALLON REGULAR UNLEADED
2001-2012
Source: AAA Fuel Gauge Report
* April gasoline prices are emphasized because prices observed several weeks prior to the holiday are likely to influence
holiday travel planning, while actual holiday prices are typically less influential.
2.5
3.5
2.7
3.5
3.1
3.63.4 3.4
1.9
1.2 1.4 1.6
-60%
-20%
20%
60%
100%
140%
0
1
2
3
4
2001 2002 2003 2004 2005 2006 2007 2008 2009 2010 2011 2012
(PER
CEN
TC
HA
NG
E)
(MIL
LIO
N)
Person-Trips (left) % change (right)
$1.55$1.40
$1.60 $1.79
$2.23
$2.76 $2.82
$3.43
$2.05
$2.85
$3.79 $3.89
-60%
-20%
20%
60%
100%
140%
$0.00
$1.00
$2.00
$3.00
$4.00
$5.00
2001 2002 2003 2004 2005 2006 2007 2008 2009 2010 2011 2012
(PER
CEN
TC
HA
NG
E)
$ per Gallon (left) % change (right)
8 IHS Global Insight / AAA Memorial Day 2012 Forecast
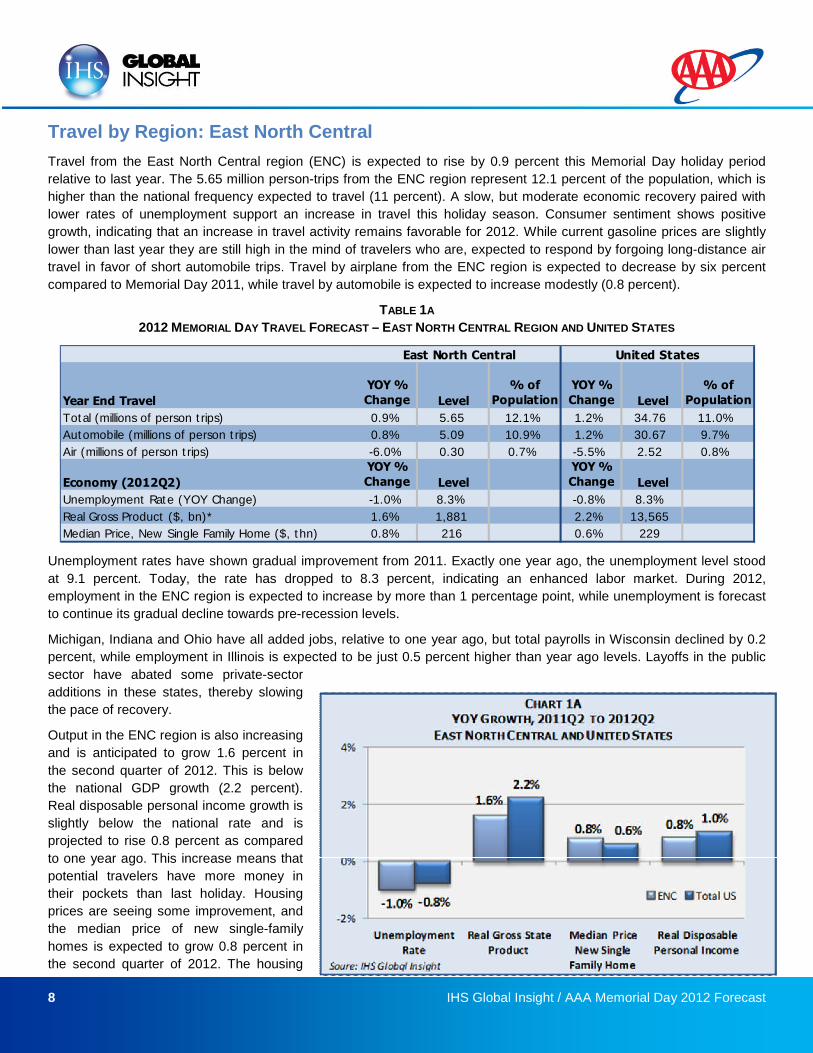
Travel by Region: East North Central
Travel from the East North Central region (ENC) is expected to rise by 0.9 percent this Memorial Day holiday period
relative to last year. The 5.65 million person-trips from the ENC region represent 12.1 percent of the population, which is
higher than the national frequency expected to travel (11 percent). A slow, but moderate economic recovery paired with
lower rates of unemployment support an increase in travel this holiday season. Consumer sentiment shows positive
growth, indicating that an increase in travel activity remains favorable for 2012. While current gasoline prices are slightly
lower than last year they are still high in the mind of travelers who are, expected to respond by forgoing long-distance air
travel in favor of short automobile trips. Travel by airplane from the ENC region is expected to decrease by six percent
compared to Memorial Day 2011, while travel by automobile is expected to increase modestly (0.8 percent).
TABLE 1A
2012 MEMORIAL DAY TRAVEL FORECAST – EAST NORTH CENTRAL REGION AND UNITED STATES
Unemployment rates have shown gradual improvement from 2011. Exactly one year ago, the unemployment level stood
at 9.1 percent. Today, the rate has dropped to 8.3 percent, indicating an enhanced labor market. During 2012,
employment in the ENC region is expected to increase by more than 1 percentage point, while unemployment is forecast
to continue its gradual decline towards pre-recession levels.
Michigan, Indiana and Ohio have all added jobs, relative to one year ago, but total payrolls in Wisconsin declined by 0.2
percent, while employment in Illinois is expected to be just 0.5 percent higher than year ago levels. Layoffs in the public
sector have abated some private-sector
additions in these states, thereby slowing
the pace of recovery.
Output in the ENC region is also increasing
and is anticipated to grow 1.6 percent in
the second quarter of 2012. This is below
the national GDP growth (2.2 percent).
Real disposable personal income growth is
slightly below the national rate and is
projected to rise 0.8 percent as compared
to one year ago. This increase means that
potential travelers have more money in
their pockets than last holiday. Housing
prices are seeing some improvement, and
the median price of new single-family
homes is expected to grow 0.8 percent in
the second quarter of 2012. The housing
Year End Travel
YOY %
Change Level
% of
Population
YOY %
Change Level
% of
Population
Total (millions of person trips) 0.9% 5.65 12.1% 1.2% 34.76 11.0%
Automobile (millions of person trips) 0.8% 5.09 10.9% 1.2% 30.67 9.7%
Air (millions of person trips) -6.0% 0.30 0.7% -5.5% 2.52 0.8%
Economy (2012Q2)
YOY %
Change Level
YOY %
Change Level
Unemployment Rate (YOY Change) -1.0% 8.3% -0.8% 8.3%
Real Gross Product ($, bn)* 1.6% 1,881 2.2% 13,565
Median Price, New Single Family Home ($, thn) 0.8% 216 0.6% 229
East North Central United States
9 IHS Global Insight / AAA Memorial Day 2012 Forecast
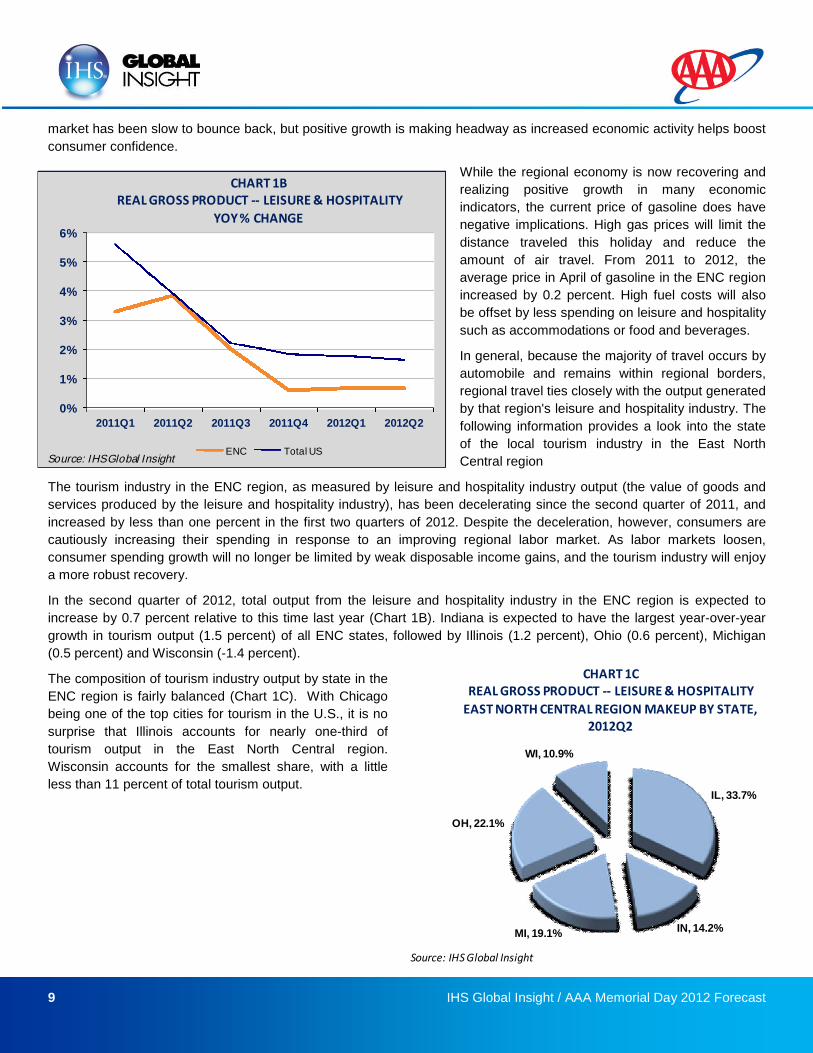
market has been slow to bounce back, but positive growth is making headway as increased economic activity helps boost
consumer confidence.
While the regional economy is now recovering and
realizing positive growth in many economic
indicators, the current price of gasoline does have
negative implications. High gas prices will limit the
distance traveled this holiday and reduce the
amount of air travel. From 2011 to 2012, the
average price in April of gasoline in the ENC region
increased by 0.2 percent. High fuel costs will also
be offset by less spending on leisure and hospitality
such as accommodations or food and beverages.
In general, because the majority of travel occurs by
automobile and remains within regional borders,
regional travel ties closely with the output generated
by that region's leisure and hospitality industry. The
following information provides a look into the state
of the local tourism industry in the East North
Central region
The tourism industry in the ENC region, as measured by leisure and hospitality industry output (the value of goods and
services produced by the leisure and hospitality industry), has been decelerating since the second quarter of 2011, and
increased by less than one percent in the first two quarters of 2012. Despite the deceleration, however, consumers are
cautiously increasing their spending in response to an improving regional labor market. As labor markets loosen,
consumer spending growth will no longer be limited by weak disposable income gains, and the tourism industry will enjoy
a more robust recovery.
In the second quarter of 2012, total output from the leisure and hospitality industry in the ENC region is expected to
increase by 0.7 percent relative to this time last year (Chart 1B). Indiana is expected to have the largest year-over-year
growth in tourism output (1.5 percent) of all ENC states, followed by Illinois (1.2 percent), Ohio (0.6 percent), Michigan
(0.5 percent) and Wisconsin (-1.4 percent).
The composition of tourism industry output by state in the
ENC region is fairly balanced (Chart 1C). With Chicago
being one of the top cities for tourism in the U.S., it is no
surprise that Illinois accounts for nearly one-third of
tourism output in the East North Central region.
Wisconsin accounts for the smallest share, with a little
less than 11 percent of total tourism output.
0%
1%
2%
3%
4%
5%
6%
2011Q1 2011Q2 2011Q3 2011Q4 2012Q1 2012Q2
CHART 1BREAL GROSS PRODUCT -- LEISURE & HOSPITALITY
YOY % CHANGE
ENC Total USSource: IHS Global Insight
IL, 33.7%
IN, 14.2%MI, 19.1%
OH, 22.1%
WI, 10.9%
CHART 1CREAL GROSS PRODUCT -- LEISURE & HOSPITALITY
EAST NORTH CENTRAL REGION MAKEUP BY STATE,2012Q2
Source: IHS Global Insight
10 IHS Global Insight / AAA Memorial Day 2012 Forecast
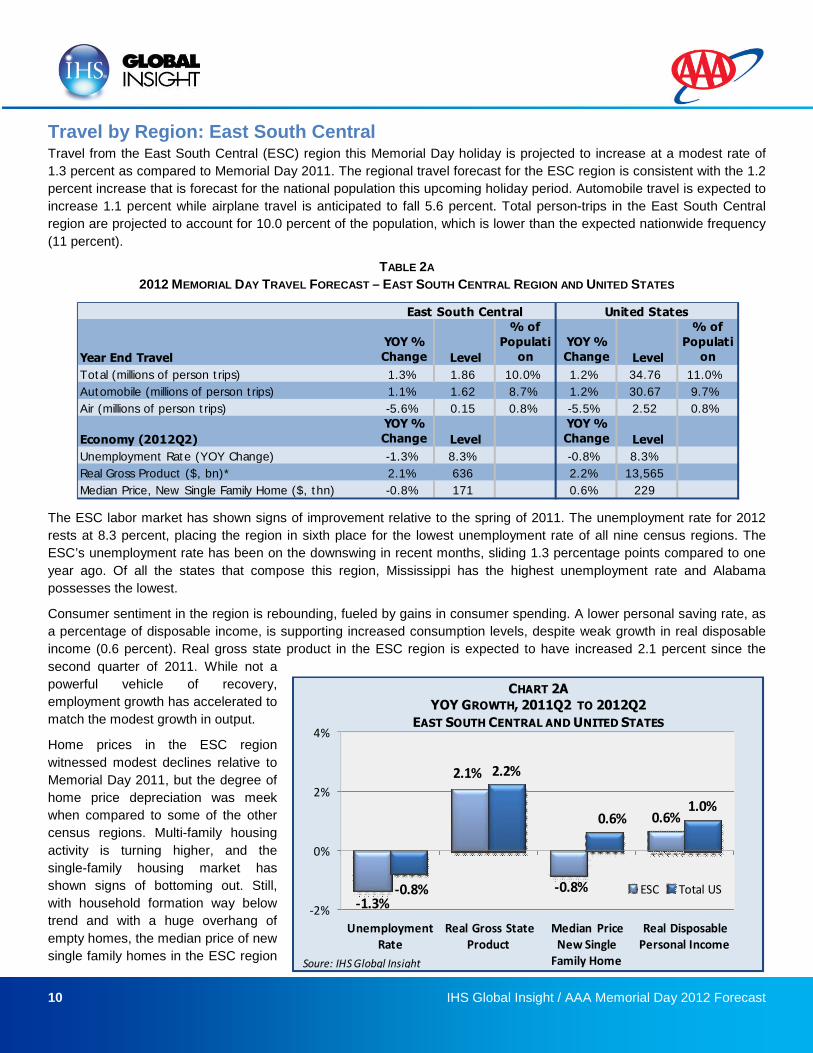
Travel by Region: East South CentralTravel from the East South Central (ESC) region this Memorial Day holiday is projected to increase at a modest rate of
1.3 percent as compared to Memorial Day 2011. The regional travel forecast for the ESC region is consistent with the 1.2
percent increase that is forecast for the national population this upcoming holiday period. Automobile travel is expected to
increase 1.1 percent while airplane travel is anticipated to fall 5.6 percent. Total person-trips in the East South Central
region are projected to account for 10.0 percent of the population, which is lower than the expected nationwide frequency
(11 percent).
TABLE 2A
2012 MEMORIAL DAY TRAVEL FORECAST – EAST SOUTH CENTRAL REGION AND UNITED STATES
The ESC labor market has shown signs of improvement relative to the spring of 2011. The unemployment rate for 2012
rests at 8.3 percent, placing the region in sixth place for the lowest unemployment rate of all nine census regions. The
ESC’s unemployment rate has been on the downswing in recent months, sliding 1.3 percentage points compared to one
year ago. Of all the states that compose this region, Mississippi has the highest unemployment rate and Alabama
possesses the lowest.
Consumer sentiment in the region is rebounding, fueled by gains in consumer spending. A lower personal saving rate, as
a percentage of disposable income, is supporting increased consumption levels, despite weak growth in real disposable
income (0.6 percent). Real gross state product in the ESC region is expected to have increased 2.1 percent since the
second quarter of 2011. While not a
powerful vehicle of recovery,
employment growth has accelerated to
match the modest growth in output.
Home prices in the ESC region
witnessed modest declines relative to
Memorial Day 2011, but the degree of
home price depreciation was meek
when compared to some of the other
census regions. Multi-family housing
activity is turning higher, and the
single-family housing market has
shown signs of bottoming out. Still,
with household formation way below
trend and with a huge overhang of
empty homes, the median price of new
single family homes in the ESC region
Year End Travel
YOY %Change Level
% of
Population
YOY %Change Level
% of
Population
Total (millions of person trips) 1.3% 1.86 10.0% 1.2% 34.76 11.0%
Automobile (millions of person trips) 1.1% 1.62 8.7% 1.2% 30.67 9.7%
Air (millions of person trips) -5.6% 0.15 0.8% -5.5% 2.52 0.8%
Economy (2012Q2)
YOY %Change Level
YOY %Change Level
Unemployment Rate (YOY Change) -1.3% 8.3% -0.8% 8.3%
Real Gross Product ($, bn)* 2.1% 636 2.2% 13,565
Median Price, New Single Family Home ($, thn) -0.8% 171 0.6% 229
East South Central United States
-1.3%
2.1%
-0.8%
0.6%
-0.8%
2.2%
0.6%1.0%
-2%
0%
2%
4%
UnemploymentRate
Real Gross StateProduct
Median PriceNew Single
Family Home
Real DisposablePersonal Income
CHART 2AYOY GROWTH, 2011Q2 TO 2012Q2
EAST SOUTH CENTRAL AND UNITED STATES
ESC Total US
Soure: IHS Globql Insight
11 IHS Global Insight / AAA Memorial Day 2012 Forecast
is expected to have decreased 0.8 percent in the second quarter of 2012, relative to year ago prices. With credit
conditions still very tight, and with the excess in available housing, the housing market remains a negative force on
household net worth, and subsequently, on consumer finances.
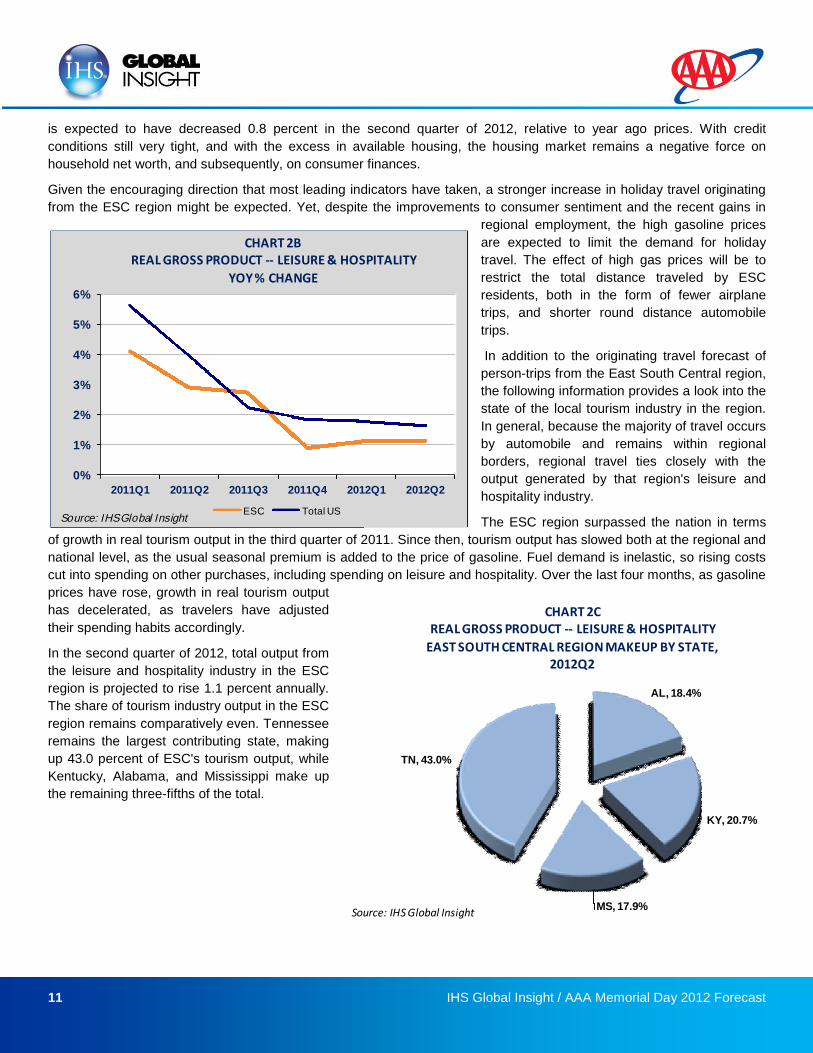
Given the encouraging direction that most leading indicators have taken, a stronger increase in holiday travel originating
from the ESC region might be expected. Yet, despite the improvements to consumer sentiment and the recent gains in
regional employment, the high gasoline prices
are expected to limit the demand for holiday
travel. The effect of high gas prices will be to
restrict the total distance traveled by ESC
residents, both in the form of fewer airplane
trips, and shorter round distance automobile
trips.
In addition to the originating travel forecast of
person-trips from the East South Central region,
the following information provides a look into the
state of the local tourism industry in the region.
In general, because the majority of travel occurs
by automobile and remains within regional
borders, regional travel ties closely with the
output generated by that region's leisure and
hospitality industry.
The ESC region surpassed the nation in terms
of growth in real tourism output in the third quarter of 2011. Since then, tourism output has slowed both at the regional and
national level, as the usual seasonal premium is added to the price of gasoline. Fuel demand is inelastic, so rising costs
cut into spending on other purchases, including spending on leisure and hospitality. Over the last four months, as gasoline
prices have rose, growth in real tourism output
has decelerated, as travelers have adjusted
their spending habits accordingly.
In the second quarter of 2012, total output from
the leisure and hospitality industry in the ESC
region is projected to rise 1.1 percent annually.
The share of tourism industry output in the ESC
region remains comparatively even. Tennessee
remains the largest contributing state, making
up 43.0 percent of ESC's tourism output, while
Kentucky, Alabama, and Mississippi make up
the remaining three-fifths of the total.
AL, 18.4%
KY, 20.7%
MS, 17.9%
TN, 43.0%
CHART 2CREAL GROSS PRODUCT -- LEISURE & HOSPITALITY
EAST SOUTH CENTRAL REGION MAKEUP BY STATE,2012Q2
Source: IHS Global Insight
0%
1%
2%
3%
4%
5%
6%
2011Q1 2011Q2 2011Q3 2011Q4 2012Q1 2012Q2
CHART 2BREAL GROSS PRODUCT -- LEISURE & HOSPITALITY
YOY % CHANGE
ESC Total USSource: IHS Global Insight
12 IHS Global Insight / AAA Memorial Day 2012 Forecast
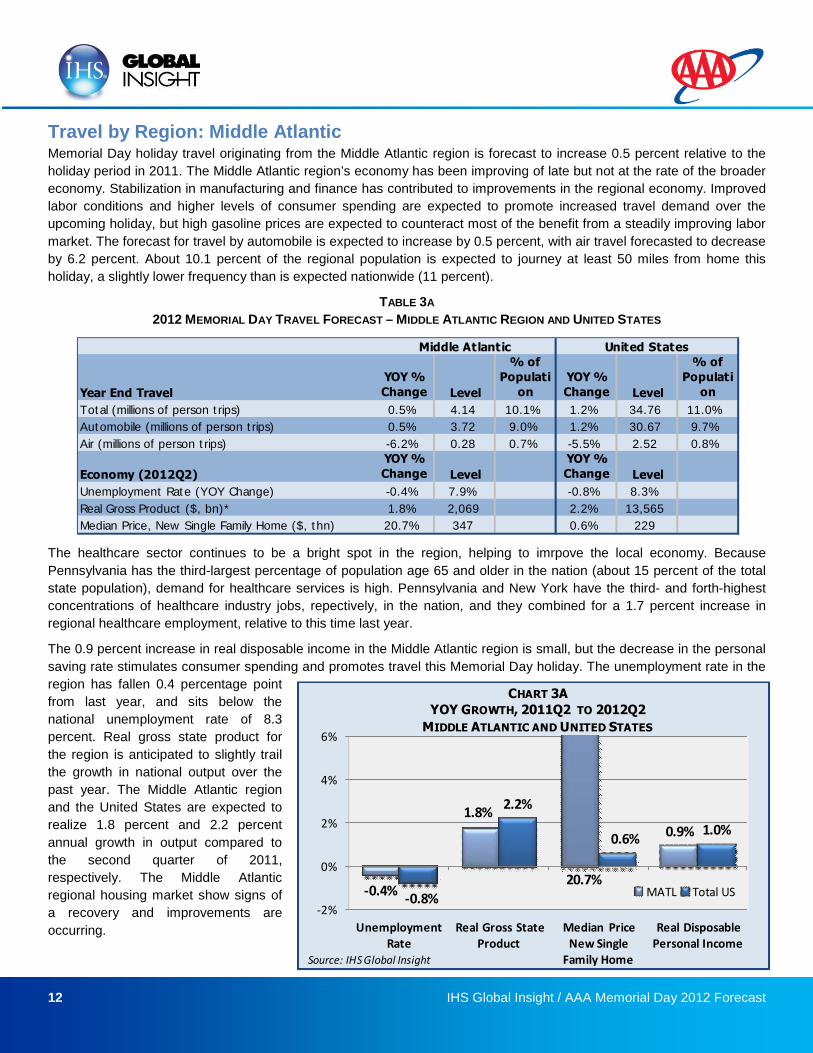
Travel by Region: Middle AtlanticMemorial Day holiday travel originating from the Middle Atlantic region is forecast to increase 0.5 percent relative to the
holiday period in 2011. The Middle Atlantic region’s economy has been improving of late but not at the rate of the broader
economy. Stabilization in manufacturing and finance has contributed to improvements in the regional economy. Improved
labor conditions and higher levels of consumer spending are expected to promote increased travel demand over the
upcoming holiday, but high gasoline prices are expected to counteract most of the benefit from a steadily improving labor
market. The forecast for travel by automobile is expected to increase by 0.5 percent, with air travel forecasted to decrease
by 6.2 percent. About 10.1 percent of the regional population is expected to journey at least 50 miles from home this
holiday, a slightly lower frequency than is expected nationwide (11 percent).
TABLE 3A
2012 MEMORIAL DAY TRAVEL FORECAST – MIDDLE ATLANTIC REGION AND UNITED STATES
The healthcare sector continues to be a bright spot in the region, helping to imrpove the local economy. Because
Pennsylvania has the third-largest percentage of population age 65 and older in the nation (about 15 percent of the total
state population), demand for healthcare services is high. Pennsylvania and New York have the third- and forth-highest
concentrations of healthcare industry jobs, repectively, in the nation, and they combined for a 1.7 percent increase in
regional healthcare employment, relative to this time last year.
The 0.9 percent increase in real disposable income in the Middle Atlantic region is small, but the decrease in the personal
saving rate stimulates consumer spending and promotes travel this Memorial Day holiday. The unemployment rate in the
region has fallen 0.4 percentage point
from last year, and sits below the
national unemployment rate of 8.3
percent. Real gross state product for
the region is anticipated to slightly trail
the growth in national output over the
past year. The Middle Atlantic region
and the United States are expected to
realize 1.8 percent and 2.2 percent
annual growth in output compared to
the second quarter of 2011,
respectively. The Middle Atlantic
regional housing market show signs of
a recovery and improvements are
occurring.
Year End Travel
YOY %
Change Level
% of
Populati
on
YOY %
Change Level
% of
Populati
on
Total (millions of person trips) 0.5% 4.14 10.1% 1.2% 34.76 11.0%
Automobile (millions of person trips) 0.5% 3.72 9.0% 1.2% 30.67 9.7%
Air (millions of person trips) -6.2% 0.28 0.7% -5.5% 2.52 0.8%
Economy (2012Q2)
YOY %
Change Level
YOY %
Change Level
Unemployment Rate (YOY Change) -0.4% 7.9% -0.8% 8.3%
Real Gross Product ($, bn)* 1.8% 2,069 2.2% 13,565
Median Price, New Single Family Home ($, thn) 20.7% 347 0.6% 229
Middle Atlantic United States
-0.4%
1.8%
0.9%
-0.8%
2.2%
0.6%1.0%
-2%
0%
2%
4%
6%
UnemploymentRate
Real Gross StateProduct
Median PriceNew Single
Family Home
Real DisposablePersonal Income
CHART 3AYOY GROWTH, 2011Q2 TO 2012Q2
MIDDLE ATLANTIC AND UNITED STATES
MATL Total US20.7%
Source: IHS Global Insight
13 IHS Global Insight / AAA Memorial Day 2012 Forecast
Increased economic activity and employment growth has boosted consumer spending. Higher home prices indicate that
the excess supply of vacant homes is decreasing. Relative to the second quarter of 2011, the median price of new single-
family homes in the Middle Atlantic is forecast to have increased by 20.7 percent, well above the national average.
Although the economic landscape in the Middle Atlantic region has improved, the effect of high gasoline prices will
counteract some of the positive news coming
out of the economy. The effect of high gas
prices on holiday travel will be to encourage
shorter-distance trips, either through forgoing air
travel, or taking shorter distance automobile trip,
so as to escape the higher pump prices.
In addition to the originating travel forecast of
person-trips from the Middle Atlantic region, the
following information provides a look into the
state of the local tourism industry in the region.
In general, because the majority of travel occurs
by automobile and remains within regional
borders, regional travel ties closely with the
output generated by that region's leisure and
hospitality industry.
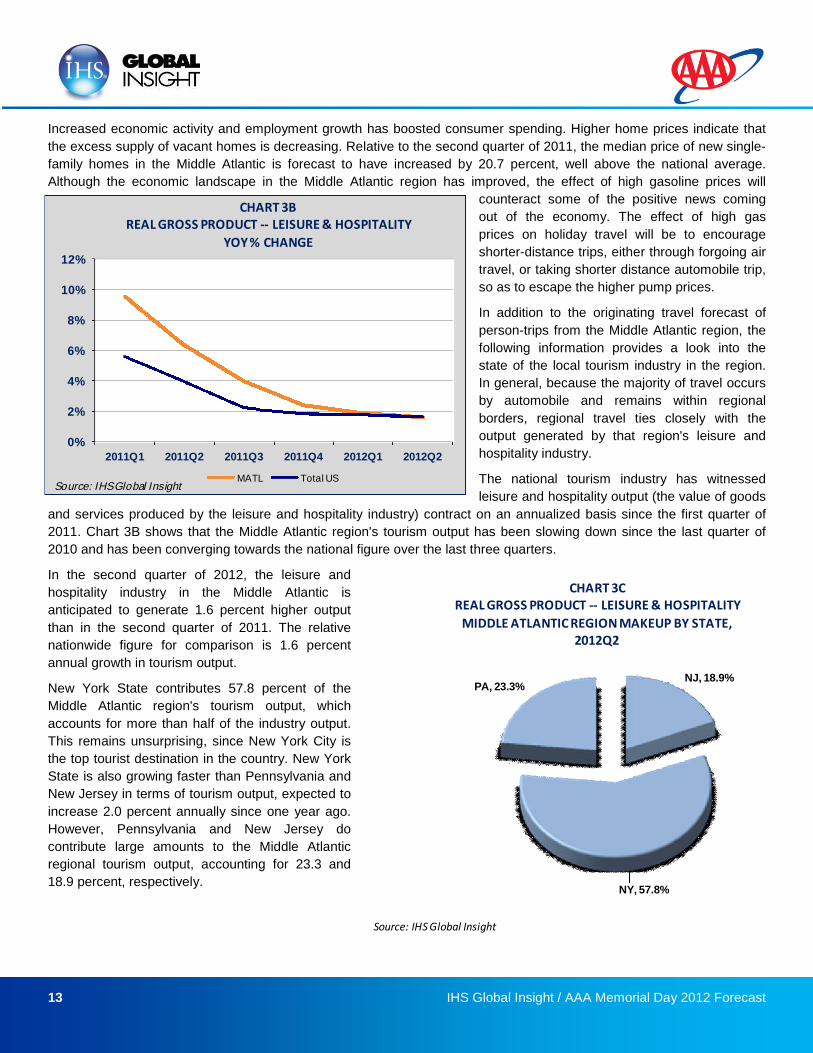
The national tourism industry has witnessed
leisure and hospitality output (the value of goods
and services produced by the leisure and hospitality industry) contract on an annualized basis since the first quarter of
2011. Chart 3B shows that the Middle Atlantic region's tourism output has been slowing down since the last quarter of
2010 and has been converging towards the national figure over the last three quarters.
In the second quarter of 2012, the leisure and
hospitality industry in the Middle Atlantic is
anticipated to generate 1.6 percent higher output
than in the second quarter of 2011. The relative
nationwide figure for comparison is 1.6 percent
annual growth in tourism output.
New York State contributes 57.8 percent of the
Middle Atlantic region's tourism output, which
accounts for more than half of the industry output.
This remains unsurprising, since New York City is
the top tourist destination in the country. New York
State is also growing faster than Pennsylvania and
New Jersey in terms of tourism output, expected to
increase 2.0 percent annually since one year ago.
However, Pennsylvania and New Jersey do
contribute large amounts to the Middle Atlantic
regional tourism output, accounting for 23.3 and
18.9 percent, respectively.
0%
2%
4%
6%
8%
10%
12%
2011Q1 2011Q2 2011Q3 2011Q4 2012Q1 2012Q2
CHART 3BREAL GROSS PRODUCT -- LEISURE & HOSPITALITY
YOY % CHANGE
MATL Total USSource: IHS Global Ins ight
NJ, 18.9%
NY, 57.8%
PA, 23.3%
CHART 3CREAL GROSS PRODUCT -- LEISURE & HOSPITALITY
MIDDLE ATLANTIC REGION MAKEUP BY STATE,2012Q2
Source: IHS Global Insight
14 IHS Global Insight / AAA Memorial Day 2012 Forecast
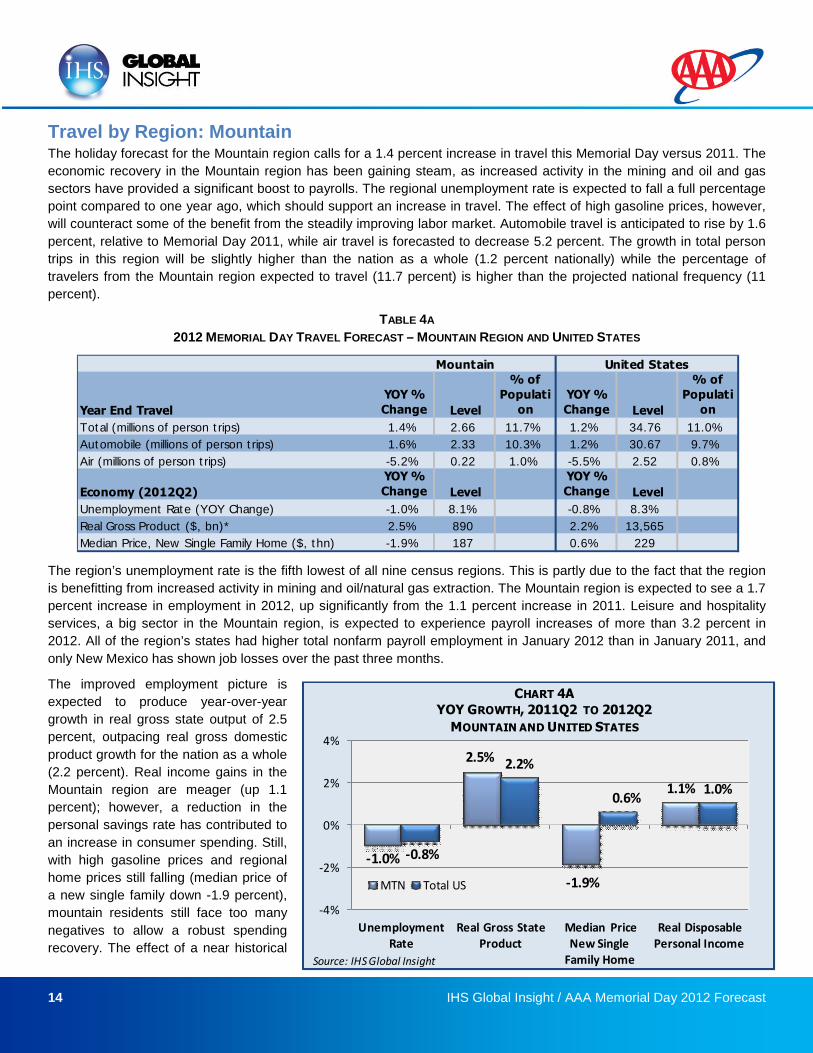
Travel by Region: MountainThe holiday forecast for the Mountain region calls for a 1.4 percent increase in travel this Memorial Day versus 2011. The
economic recovery in the Mountain region has been gaining steam, as increased activity in the mining and oil and gas
sectors have provided a significant boost to payrolls. The regional unemployment rate is expected to fall a full percentage
point compared to one year ago, which should support an increase in travel. The effect of high gasoline prices, however,
will counteract some of the benefit from the steadily improving labor market. Automobile travel is anticipated to rise by 1.6
percent, relative to Memorial Day 2011, while air travel is forecasted to decrease 5.2 percent. The growth in total person
trips in this region will be slightly higher than the nation as a whole (1.2 percent nationally) while the percentage of
travelers from the Mountain region expected to travel (11.7 percent) is higher than the projected national frequency (11
percent).
TABLE 4A
2012 MEMORIAL DAY TRAVEL FORECAST – MOUNTAIN REGION AND UNITED STATES
The region’s unemployment rate is the fifth lowest of all nine census regions. This is partly due to the fact that the region
is benefitting from increased activity in mining and oil/natural gas extraction. The Mountain region is expected to see a 1.7
percent increase in employment in 2012, up significantly from the 1.1 percent increase in 2011. Leisure and hospitality
services, a big sector in the Mountain region, is expected to experience payroll increases of more than 3.2 percent in
2012. All of the region’s states had higher total nonfarm payroll employment in January 2012 than in January 2011, and
only New Mexico has shown job losses over the past three months.
The improved employment picture is
expected to produce year-over-year
growth in real gross state output of 2.5
percent, outpacing real gross domestic
product growth for the nation as a whole
(2.2 percent). Real income gains in the
Mountain region are meager (up 1.1
percent); however, a reduction in the
personal savings rate has contributed to
an increase in consumer spending. Still,
with high gasoline prices and regional
home prices still falling (median price of
a new single family down -1.9 percent),
mountain residents still face too many
negatives to allow a robust spending
recovery. The effect of a near historical
Year End Travel
YOY %
Change Level
% of
Populati
on
YOY %
Change Level
% of
Populati
on
Total (millions of person trips) 1.4% 2.66 11.7% 1.2% 34.76 11.0%
Automobile (millions of person trips) 1.6% 2.33 10.3% 1.2% 30.67 9.7%
Air (millions of person trips) -5.2% 0.22 1.0% -5.5% 2.52 0.8%
Economy (2012Q2)
YOY %
Change Level
YOY %
Change Level
Unemployment Rate (YOY Change) -1.0% 8.1% -0.8% 8.3%
Real Gross Product ($, bn)* 2.5% 890 2.2% 13,565
Median Price, New Single Family Home ($, thn) -1.9% 187 0.6% 229
Mountain United States
-1.0%
2.5%
-1.9%
1.1%
-0.8%
2.2%
0.6%1.0%
-4%
-2%
0%
2%
4%
UnemploymentRate
Real Gross StateProduct
Median PriceNew Single
Family Home
Real DisposablePersonal Income
CHART 4AYOY GROWTH, 2011Q2 TO 2012Q2
MOUNTAIN AND UNITED STATES
MTN Total US
Source: IHS Global Insight
15 IHS Global Insight / AAA Memorial Day 2012 Forecast
high in gasoline prices, despite being on par to last year, will reduce the demand for air travel this Memorial Day, and lead
to consumer’s taking shorter-distance automobile trips.
In addition to the originating travel forecast of
person-trips from the Mountain region, the
following information provides a look into the
state of the local tourism industry. In general,
because the majority of travel occurs by
automobile and remains within regional borders,
regional travel ties closely with the output
generated by that region's leisure and hospitality
industry.
The tourism industry in the Mountain region, as
measured by leisure and hospitality industry real
gross product (the value of goods and services
produced by the leisure and hospitality industry),
has been accelerating since the third quarter of
2011. Moreover, the Mountain region's tourism
industry has been outperforming the nation's
tourism recovery for over that same time span.
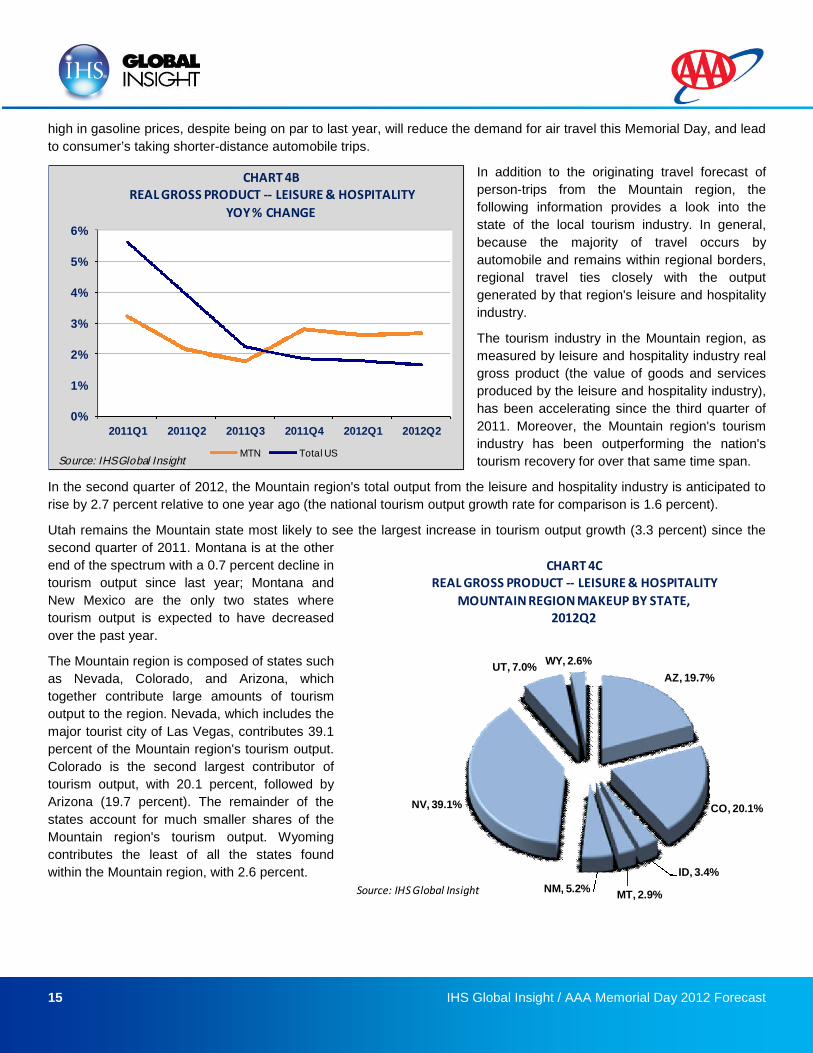
In the second quarter of 2012, the Mountain region's total output from the leisure and hospitality industry is anticipated to
rise by 2.7 percent relative to one year ago (the national tourism output growth rate for comparison is 1.6 percent).
Utah remains the Mountain state most likely to see the largest increase in tourism output growth (3.3 percent) since the
second quarter of 2011. Montana is at the other
end of the spectrum with a 0.7 percent decline in
tourism output since last year; Montana and
New Mexico are the only two states where
tourism output is expected to have decreased
over the past year.
The Mountain region is composed of states such
as Nevada, Colorado, and Arizona, which
together contribute large amounts of tourism
output to the region. Nevada, which includes the
major tourist city of Las Vegas, contributes 39.1
percent of the Mountain region's tourism output.
Colorado is the second largest contributor of
tourism output, with 20.1 percent, followed by
Arizona (19.7 percent). The remainder of the
states account for much smaller shares of the
Mountain region's tourism output. Wyoming
contributes the least of all the states found
within the Mountain region, with 2.6 percent.
0%
1%
2%
3%
4%
5%
6%
2011Q1 2011Q2 2011Q3 2011Q4 2012Q1 2012Q2
CHART 4BREAL GROSS PRODUCT -- LEISURE & HOSPITALITY
YOY % CHANGE
MTN Total USSource: IHS Global Ins ight
AZ, 19.7%
CO, 20.1%
ID, 3.4%
MT, 2.9%NM, 5.2%
NV, 39.1%
UT, 7.0%WY, 2.6%
CHART 4CREAL GROSS PRODUCT -- LEISURE & HOSPITALITY
MOUNTAIN REGION MAKEUP BY STATE,2012Q2
Source: IHS Global Insight
16 IHS Global Insight / AAA Memorial Day 2012 Forecast
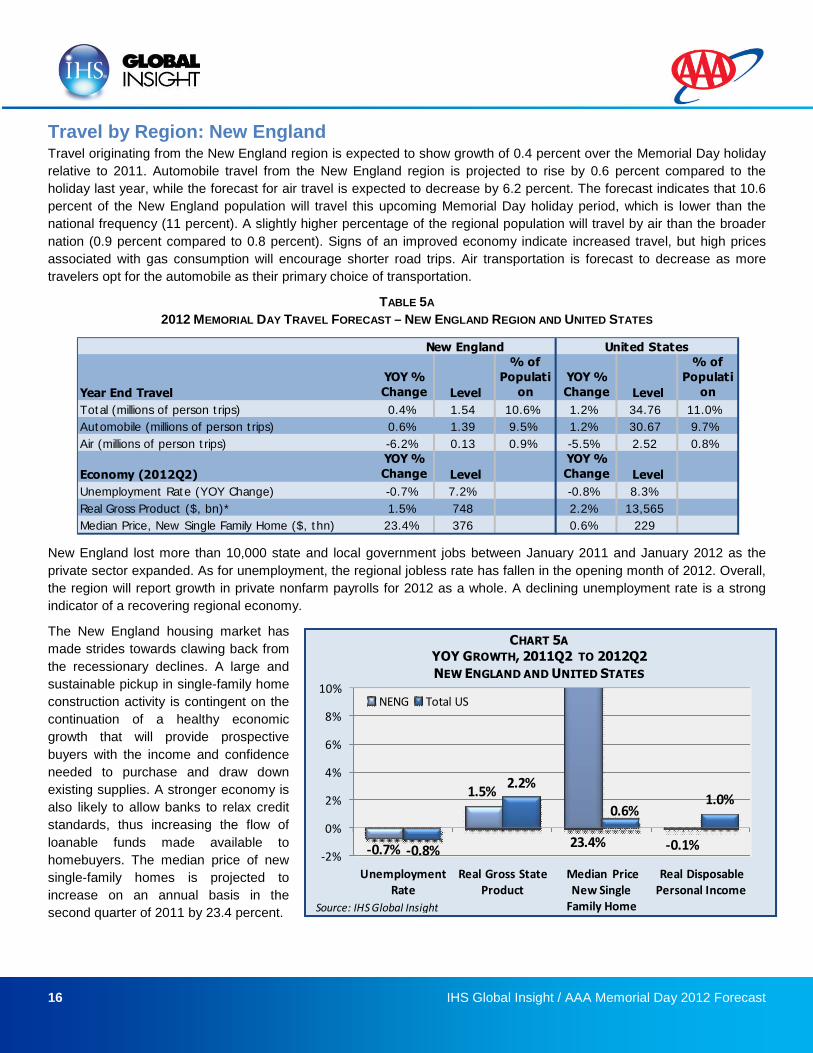
Travel by Region: New EnglandTravel originating from the New England region is expected to show growth of 0.4 percent over the Memorial Day holiday
relative to 2011. Automobile travel from the New England region is projected to rise by 0.6 percent compared to the
holiday last year, while the forecast for air travel is expected to decrease by 6.2 percent. The forecast indicates that 10.6
percent of the New England population will travel this upcoming Memorial Day holiday period, which is lower than the
national frequency (11 percent). A slightly higher percentage of the regional population will travel by air than the broader
nation (0.9 percent compared to 0.8 percent). Signs of an improved economy indicate increased travel, but high prices
associated with gas consumption will encourage shorter road trips. Air transportation is forecast to decrease as more
travelers opt for the automobile as their primary choice of transportation.
TABLE 5A
2012 MEMORIAL DAY TRAVEL FORECAST – NEW ENGLAND REGION AND UNITED STATES
New England lost more than 10,000 state and local government jobs between January 2011 and January 2012 as the
private sector expanded. As for unemployment, the regional jobless rate has fallen in the opening month of 2012. Overall,
the region will report growth in private nonfarm payrolls for 2012 as a whole. A declining unemployment rate is a strong
indicator of a recovering regional economy.
The New England housing market has
made strides towards clawing back from
the recessionary declines. A large and
sustainable pickup in single-family home
construction activity is contingent on the
continuation of a healthy economic
growth that will provide prospective
buyers with the income and confidence
needed to purchase and draw down
existing supplies. A stronger economy is
also likely to allow banks to relax credit
standards, thus increasing the flow of
loanable funds made available to
homebuyers. The median price of new
single-family homes is projected to
increase on an annual basis in the
second quarter of 2011 by 23.4 percent.
Year End Travel
YOY %
Change Level
% of
Populati
on
YOY %
Change Level
% of
Populati
on
Total (millions of person trips) 0.4% 1.54 10.6% 1.2% 34.76 11.0%
Automobile (millions of person trips) 0.6% 1.39 9.5% 1.2% 30.67 9.7%
Air (millions of person trips) -6.2% 0.13 0.9% -5.5% 2.52 0.8%
Economy (2012Q2)
YOY %
Change Level
YOY %
Change Level
Unemployment Rate (YOY Change) -0.7% 7.2% -0.8% 8.3%
Real Gross Product ($, bn)* 1.5% 748 2.2% 13,565
Median Price, New Single Family Home ($, thn) 23.4% 376 0.6% 229
New England United States
-0.7%
1.5%
-0.1%-0.8%
2.2%
0.6%1.0%
-2%
0%
2%
4%
6%
8%
10%
UnemploymentRate
Real Gross StateProduct
Median PriceNew Single
Family Home
Real DisposablePersonal Income
CHART 5A
YOY GROWTH, 2011Q2 TO 2012Q2
NEW ENGLAND AND UNITED STATES
NENG Total US
23.4%
Source: IHS Global Insight
17 IHS Global Insight / AAA Memorial Day 2012 Forecast
Real disposable personal income shows a contraction of 0.1 percent. Unemployment rates have declined by 0.7 percent.
The region’s unemployment rate of 7.2 percent is less than the national figure (8.3 percent). Gross real state product
increased by 1.5 percent slightly lower the national figure.
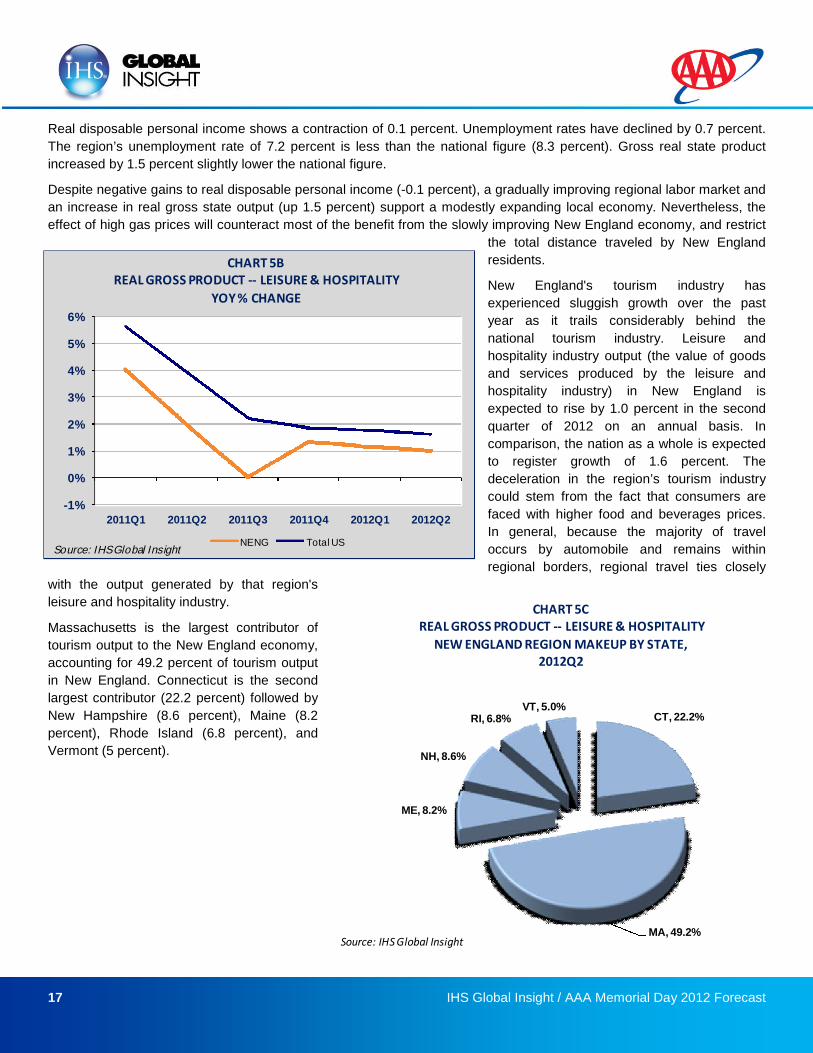
Despite negative gains to real disposable personal income (-0.1 percent), a gradually improving regional labor market and
an increase in real gross state output (up 1.5 percent) support a modestly expanding local economy. Nevertheless, the
effect of high gas prices will counteract most of the benefit from the slowly improving New England economy, and restrict
the total distance traveled by New England
residents.
New England's tourism industry has
experienced sluggish growth over the past
year as it trails considerably behind the
national tourism industry. Leisure and
hospitality industry output (the value of goods
and services produced by the leisure and
hospitality industry) in New England is
expected to rise by 1.0 percent in the second
quarter of 2012 on an annual basis. In
comparison, the nation as a whole is expected
to register growth of 1.6 percent. The
deceleration in the region’s tourism industry
could stem from the fact that consumers are
faced with higher food and beverages prices.
In general, because the majority of travel
occurs by automobile and remains within
regional borders, regional travel ties closely
with the output generated by that region's
leisure and hospitality industry.
Massachusetts is the largest contributor of
tourism output to the New England economy,
accounting for 49.2 percent of tourism output
in New England. Connecticut is the second
largest contributor (22.2 percent) followed by
New Hampshire (8.6 percent), Maine (8.2
percent), Rhode Island (6.8 percent), and
Vermont (5 percent).
-1%
0%
1%
2%
3%
4%
5%
6%
2011Q1 2011Q2 2011Q3 2011Q4 2012Q1 2012Q2
CHART 5BREAL GROSS PRODUCT -- LEISURE & HOSPITALITY
YOY % CHANGE
NENG Total USSource: IHS Global Ins ight
CT, 22.2%
MA, 49.2%
ME, 8.2%
NH, 8.6%
RI, 6.8%VT, 5.0%
CHART 5CREAL GROSS PRODUCT -- LEISURE & HOSPITALITY
NEW ENGLAND REGION MAKEUP BY STATE,2012Q2
Source: IHS Global Insight
18 IHS Global Insight / AAA Memorial Day 2012 Forecast
Travel by Region: PacificThe Pacific region is projected to see Memorial Day travel rise by 1.5 percent since the holiday last year. The region’s
economy continues to recover, realizing positive growth in many economic indicators. A high regional price of gasoline,
however, is expected to curb not only the total demand, but the distance traveled during the regional holiday period. The
forecast calls for air travel to decrease 5.2 percent and automobile travel to increase 1.6 percent compared to last year.
The forecast projects 10.9 percent of Pacific region residents to travel this holiday, which is slightly below the percentage
of the national population expected to travel. The Pacific region typically sees a higher than average share of its
population expected to travel by air, and this is the case for Memorial Day (1.0 percent compared to the national figure of
0.8 percent).
TABLE 6A
2012 MEMORIAL DAY TRAVEL FORECAST – PACIFIC REGION AND UNITED STATES
While the unemployment rate in the Pacific region remains the highest of any census region at 10.1 percent, the
unemployment rate is anticipated to have fallen by 1.0 percent since the second quarter of 2011. A drop in the
unemployment rate and an increase in consumer sentiment abet a slow, but recovering economy.
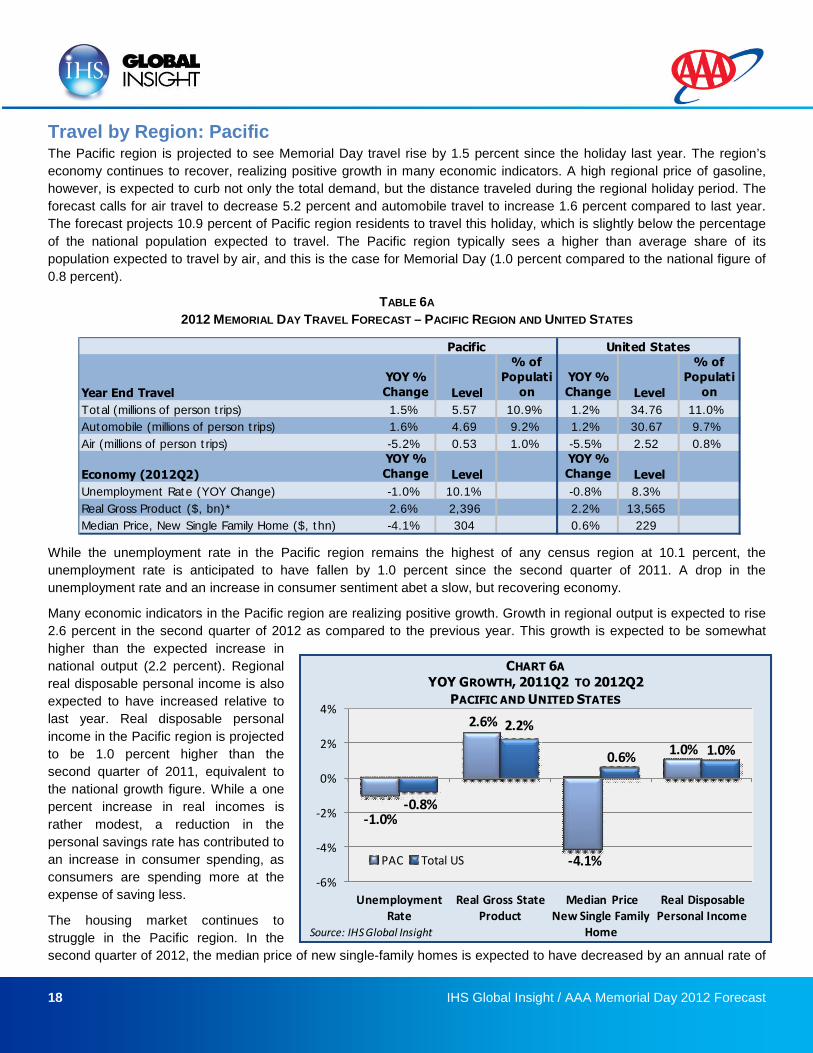
Many economic indicators in the Pacific region are realizing positive growth. Growth in regional output is expected to rise
2.6 percent in the second quarter of 2012 as compared to the previous year. This growth is expected to be somewhat
higher than the expected increase in
national output (2.2 percent). Regional
real disposable personal income is also
expected to have increased relative to
last year. Real disposable personal
income in the Pacific region is projected
to be 1.0 percent higher than the
second quarter of 2011, equivalent to
the national growth figure. While a one
percent increase in real incomes is
rather modest, a reduction in the
personal savings rate has contributed to
an increase in consumer spending, as
consumers are spending more at the
expense of saving less.
The housing market continues to
struggle in the Pacific region. In the
second quarter of 2012, the median price of new single-family homes is expected to have decreased by an annual rate of
Year End Travel
YOY %
Change Level
% of
Populati
on
YOY %
Change Level
% of
Populati
on
Total (millions of person trips) 1.5% 5.57 10.9% 1.2% 34.76 11.0%
Automobile (millions of person trips) 1.6% 4.69 9.2% 1.2% 30.67 9.7%
Air (millions of person trips) -5.2% 0.53 1.0% -5.5% 2.52 0.8%
Economy (2012Q2)
YOY %
Change Level
YOY %
Change Level
Unemployment Rate (YOY Change) -1.0% 10.1% -0.8% 8.3%
Real Gross Product ($, bn)* 2.6% 2,396 2.2% 13,565
Median Price, New Single Family Home ($, thn) -4.1% 304 0.6% 229
Pacific United States
-1.0%
2.6%
-4.1%
1.0%
-0.8%
2.2%
0.6% 1.0%
-6%
-4%
-2%
0%
2%
4%
UnemploymentRate
Real Gross StateProduct
Median PriceNew Single Family
Home
Real DisposablePersonal Income
CHART 6A
YOY GROWTH, 2011Q2 TO 2012Q2
PACIFIC AND UNITED STATES
PAC Total US
Source: IHS Global Insight
19 IHS Global Insight / AAA Memorial Day 2012 Forecast
4.1 percent. Home prices remain relatively low due to the huge overhang of empty dwellings. As lending standards
tighten, less credit is available to finance home ownership. A growing economy will provide consumers with the income
and confidence to purchase the excess supply
available in the housing market and hopefully,
drive prices back to prerecession levels. Despite
the housing woes, the Pacific region is on its way
to undoing most of the damage done since the
Great Recession.
A lower personal savings rate as a percentage of
disposable income, and increased real gross
state output promise higher levels of travel traffic
this Memorial Day weekend. The impact of gas
prices will be to restrict the distance traveled by
those residents who choose to travel, and to
prevent a larger increase in travel volumes that
might otherwise be expected, considering the
positive direction of the regional economy.
In addition to the originating travel forecast of
person-trips from the Pacific region, the following
information provides a look into the state of the local tourism industry in the region. In general, because the majority of
travel occurs by automobile and remains within regional borders, regional travel ties closely with the output generated by
that region's leisure and hospitality industry.
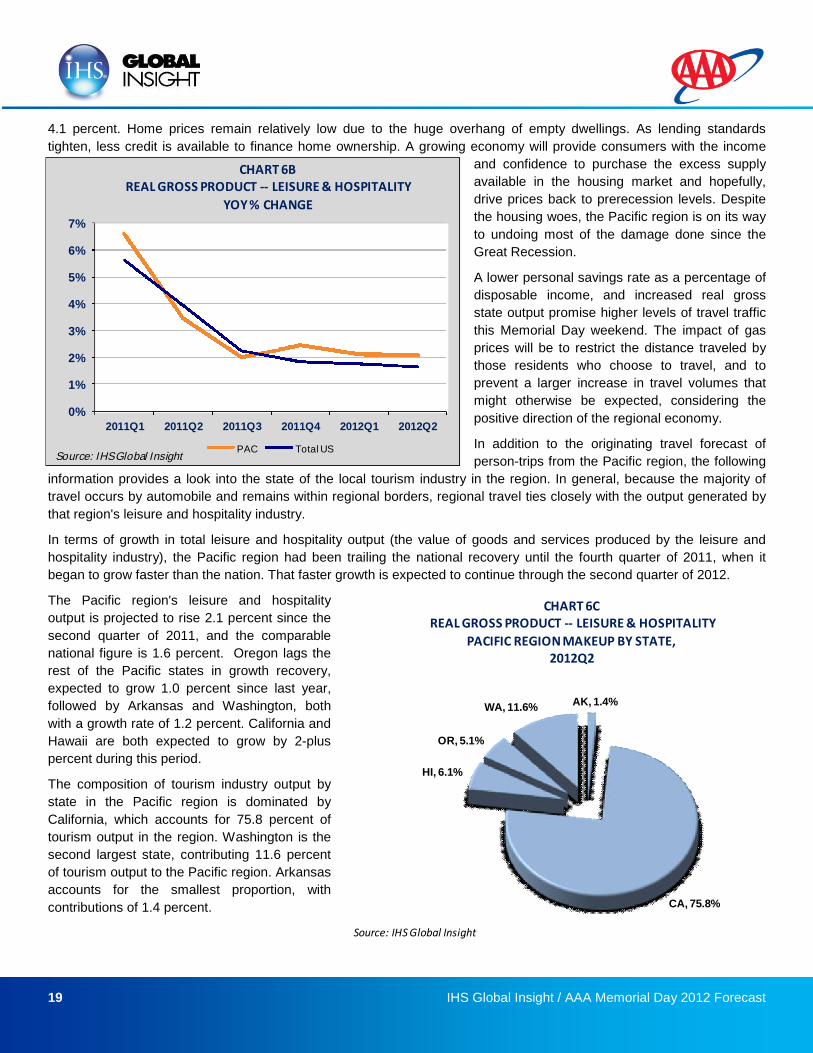
In terms of growth in total leisure and hospitality output (the value of goods and services produced by the leisure and
hospitality industry), the Pacific region had been trailing the national recovery until the fourth quarter of 2011, when it
began to grow faster than the nation. That faster growth is expected to continue through the second quarter of 2012.
The Pacific region's leisure and hospitality
output is projected to rise 2.1 percent since the
second quarter of 2011, and the comparable
national figure is 1.6 percent. Oregon lags the
rest of the Pacific states in growth recovery,
expected to grow 1.0 percent since last year,
followed by Arkansas and Washington, both
with a growth rate of 1.2 percent. California and
Hawaii are both expected to grow by 2-plus
percent during this period.
The composition of tourism industry output by
state in the Pacific region is dominated by
California, which accounts for 75.8 percent of
tourism output in the region. Washington is the
second largest state, contributing 11.6 percent
of tourism output to the Pacific region. Arkansas
accounts for the smallest proportion, with
contributions of 1.4 percent.
0%
1%
2%
3%
4%
5%
6%
7%
2011Q1 2011Q2 2011Q3 2011Q4 2012Q1 2012Q2
CHART 6BREAL GROSS PRODUCT -- LEISURE & HOSPITALITY
YOY % CHANGE
PAC Total USSource: IHS Global Insight
AK, 1.4%
CA, 75.8%
HI, 6.1%
OR, 5.1%
WA, 11.6%
CHART 6CREAL GROSS PRODUCT -- LEISURE & HOSPITALITY
PACIFIC REGION MAKEUP BY STATE,2012Q2
Source: IHS Global Insight
20 IHS Global Insight / AAA Memorial Day 2012 Forecast
Travel by Region: South AtlanticMemorial Day travel growth from the South Atlantic (SATL) region is estimated at 1.2 percent this Memorial Day holiday
as compared to 2011. The South Atlantic regional economy is rebounding slowly, and travel demand is expected to be
stimulated by economic improvement, but the rising price of fuel will counteract most of the benefit from a steadily
improving regional economy. Air travel is projected to fall by 5.6 percent, while automobile travel is expected to rise by 1.2
percent. The forecast calls for 10.7 percent of the regional population to travel this Memorial Day holiday period.
TABLE 7A
2012 MEMORIAL DAY TRAVEL FORECAST – SOUTH ATLANTIC REGION AND UNITED STATES
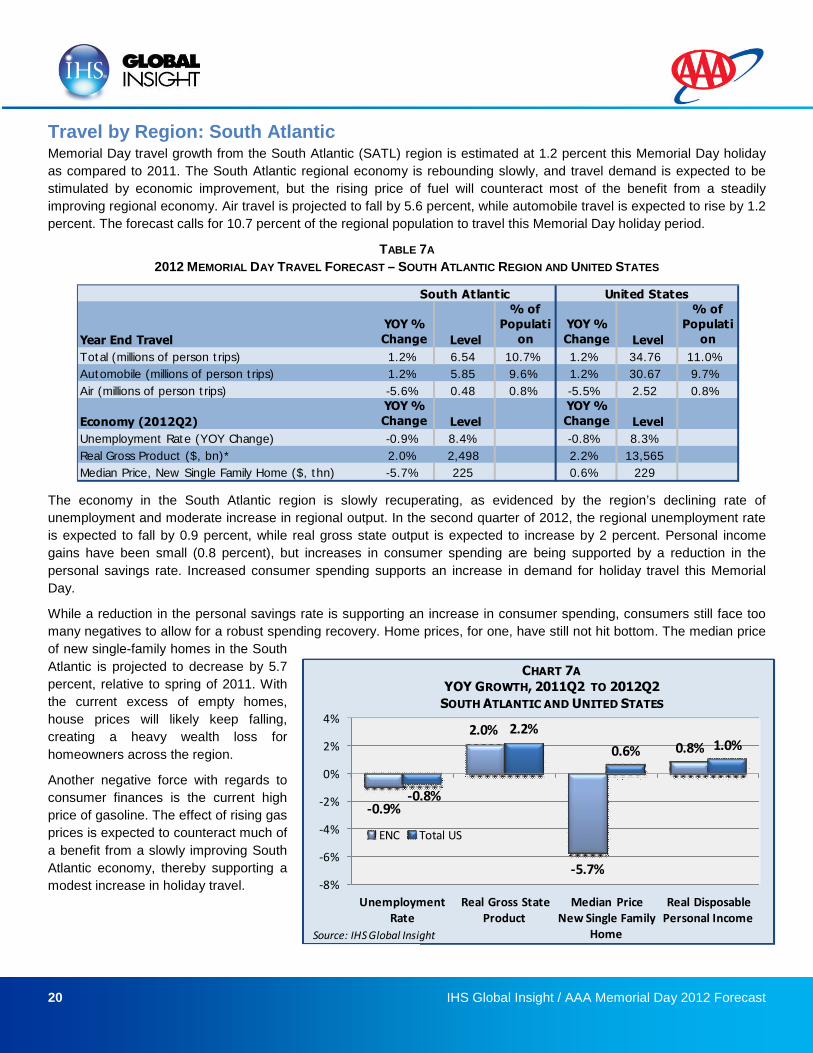
The economy in the South Atlantic region is slowly recuperating, as evidenced by the region’s declining rate of
unemployment and moderate increase in regional output. In the second quarter of 2012, the regional unemployment rate
is expected to fall by 0.9 percent, while real gross state output is expected to increase by 2 percent. Personal income
gains have been small (0.8 percent), but increases in consumer spending are being supported by a reduction in the
personal savings rate. Increased consumer spending supports an increase in demand for holiday travel this Memorial
Day.
While a reduction in the personal savings rate is supporting an increase in consumer spending, consumers still face too
many negatives to allow for a robust spending recovery. Home prices, for one, have still not hit bottom. The median price
of new single-family homes in the South
Atlantic is projected to decrease by 5.7
percent, relative to spring of 2011. With
the current excess of empty homes,
house prices will likely keep falling,
creating a heavy wealth loss for
homeowners across the region.
Another negative force with regards to
consumer finances is the current high
price of gasoline. The effect of rising gas
prices is expected to counteract much of
a benefit from a slowly improving South
Atlantic economy, thereby supporting a
modest increase in holiday travel.
Year End Travel
YOY %
Change Level
% of
Populati
on
YOY %
Change Level
% of
Populati
on
Total (millions of person trips) 1.2% 6.54 10.7% 1.2% 34.76 11.0%
Automobile (millions of person trips) 1.2% 5.85 9.6% 1.2% 30.67 9.7%
Air (millions of person trips) -5.6% 0.48 0.8% -5.5% 2.52 0.8%
Economy (2012Q2)
YOY %
Change Level
YOY %
Change Level
Unemployment Rate (YOY Change) -0.9% 8.4% -0.8% 8.3%
Real Gross Product ($, bn)* 2.0% 2,498 2.2% 13,565
Median Price, New Single Family Home ($, thn) -5.7% 225 0.6% 229
South Atlantic United States
-0.9%
2.0%
-5.7%
0.8%
-0.8%
2.2%
0.6% 1.0%
-8%
-6%
-4%
-2%
0%
2%
4%
UnemploymentRate
Real Gross StateProduct
Median PriceNew Single Family
Home
Real DisposablePersonal Income
CHART 7A
YOY GROWTH, 2011Q2 TO 2012Q2
SOUTH ATLANTIC AND UNITED STATES
ENC Total US
Source: IHS Global Insight
21 IHS Global Insight / AAA Memorial Day 2012 Forecast
In addition to the originating travel forecast of
person-trips from the South Atlantic region,
the following information provides a look into
the state of the local tourism industry in the
region. In general, because the majority of
travel occurs by automobile and remains
within regional borders, regional travel ties
closely with the output generated by that
region's leisure and hospitality industry.
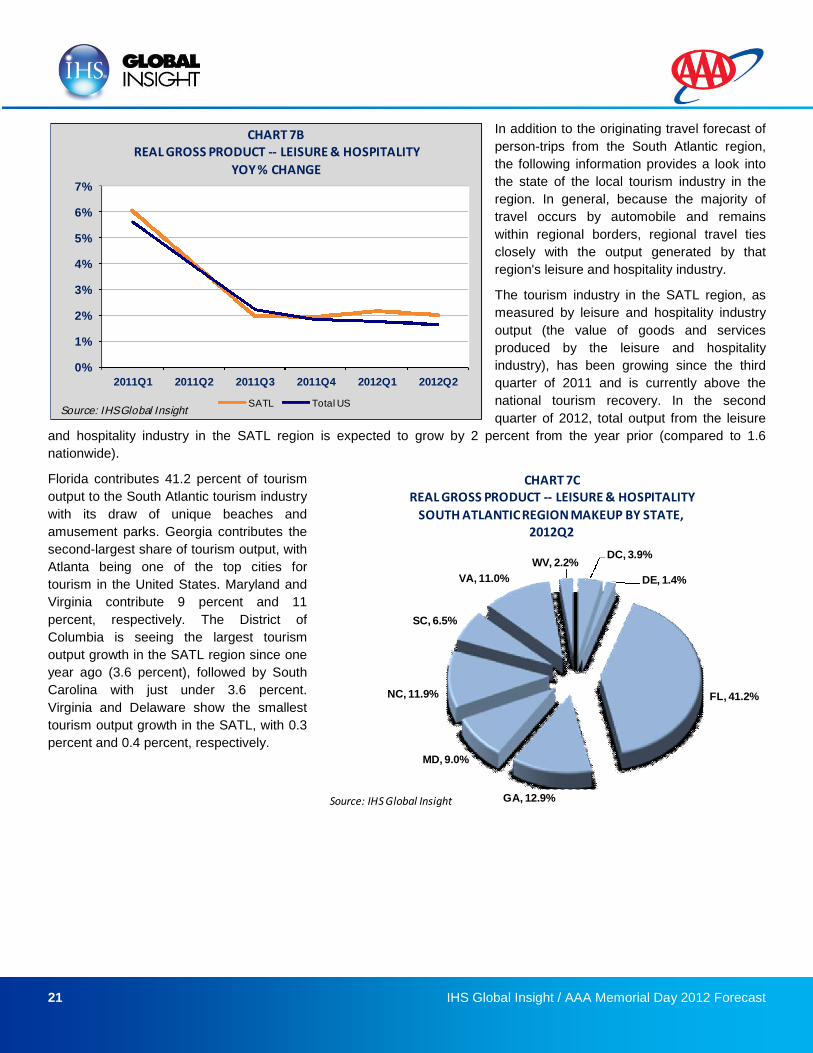
The tourism industry in the SATL region, as
measured by leisure and hospitality industry
output (the value of goods and services
produced by the leisure and hospitality
industry), has been growing since the third
quarter of 2011 and is currently above the
national tourism recovery. In the second
quarter of 2012, total output from the leisure
and hospitality industry in the SATL region is expected to grow by 2 percent from the year prior (compared to 1.6
nationwide).
Florida contributes 41.2 percent of tourism
output to the South Atlantic tourism industry
with its draw of unique beaches and
amusement parks. Georgia contributes the
second-largest share of tourism output, with
Atlanta being one of the top cities for
tourism in the United States. Maryland and
Virginia contribute 9 percent and 11
percent, respectively. The District of
Columbia is seeing the largest tourism
output growth in the SATL region since one
year ago (3.6 percent), followed by South
Carolina with just under 3.6 percent.
Virginia and Delaware show the smallest
tourism output growth in the SATL, with 0.3
percent and 0.4 percent, respectively.
DC, 3.9%
DE, 1.4%
FL, 41.2%
GA, 12.9%
MD, 9.0%
NC, 11.9%
SC, 6.5%
VA, 11.0%
WV, 2.2%
CHART 7CREAL GROSS PRODUCT -- LEISURE & HOSPITALITY
SOUTH ATLANTICREGION MAKEUP BY STATE,2012Q2
Source: IHS Global Insight
0%
1%
2%
3%
4%
5%
6%
7%
2011Q1 2011Q2 2011Q3 2011Q4 2012Q1 2012Q2
CHART 7BREAL GROSS PRODUCT -- LEISURE & HOSPITALITY
YOY % CHANGE
SATL Total USSource: IHS Global Insight
22 IHS Global Insight / AAA Memorial Day 2012 Forecast
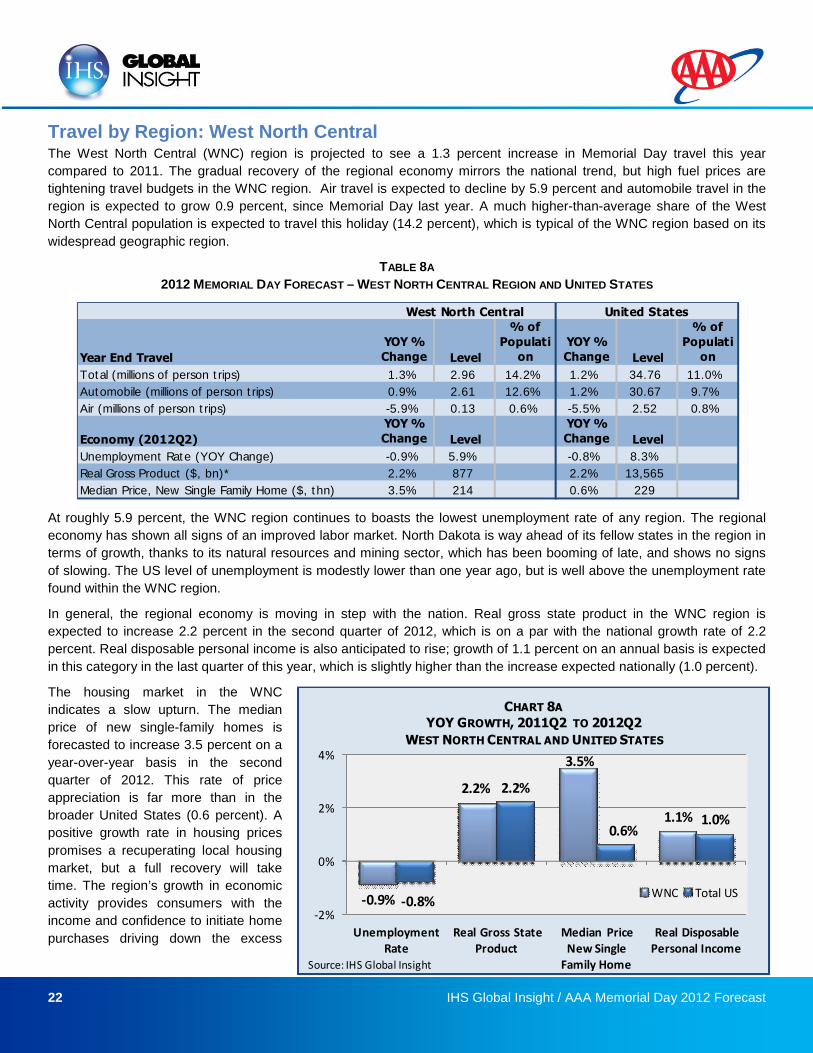
Travel by Region: West North CentralThe West North Central (WNC) region is projected to see a 1.3 percent increase in Memorial Day travel this year
compared to 2011. The gradual recovery of the regional economy mirrors the national trend, but high fuel prices are
tightening travel budgets in the WNC region. Air travel is expected to decline by 5.9 percent and automobile travel in the
region is expected to grow 0.9 percent, since Memorial Day last year. A much higher-than-average share of the West
North Central population is expected to travel this holiday (14.2 percent), which is typical of the WNC region based on its
widespread geographic region.
TABLE 8A
2012 MEMORIAL DAY FORECAST – WEST NORTH CENTRAL REGION AND UNITED STATES
At roughly 5.9 percent, the WNC region continues to boasts the lowest unemployment rate of any region. The regional
economy has shown all signs of an improved labor market. North Dakota is way ahead of its fellow states in the region in
terms of growth, thanks to its natural resources and mining sector, which has been booming of late, and shows no signs
of slowing. The US level of unemployment is modestly lower than one year ago, but is well above the unemployment rate
found within the WNC region.
In general, the regional economy is moving in step with the nation. Real gross state product in the WNC region is
expected to increase 2.2 percent in the second quarter of 2012, which is on a par with the national growth rate of 2.2
percent. Real disposable personal income is also anticipated to rise; growth of 1.1 percent on an annual basis is expected
in this category in the last quarter of this year, which is slightly higher than the increase expected nationally (1.0 percent).
The housing market in the WNC
indicates a slow upturn. The median
price of new single-family homes is
forecasted to increase 3.5 percent on a
year-over-year basis in the second
quarter of 2012. This rate of price
appreciation is far more than in the
broader United States (0.6 percent). A
positive growth rate in housing prices
promises a recuperating local housing
market, but a full recovery will take
time. The region’s growth in economic
activity provides consumers with the
income and confidence to initiate home
purchases driving down the excess
Year End Travel
YOY %Change Level
% of
Population
YOY %Change Level
% of
Population
Total (millions of person trips) 1.3% 2.96 14.2% 1.2% 34.76 11.0%
Automobile (millions of person trips) 0.9% 2.61 12.6% 1.2% 30.67 9.7%
Air (millions of person trips) -5.9% 0.13 0.6% -5.5% 2.52 0.8%
Economy (2012Q2)
YOY %Change Level
YOY %Change Level
Unemployment Rate (YOY Change) -0.9% 5.9% -0.8% 8.3%
Real Gross Product ($, bn)* 2.2% 877 2.2% 13,565
Median Price, New Single Family Home ($, thn) 3.5% 214 0.6% 229
West North Central United States
-0.9%
2.2%
3.5%
1.1%
-0.8%
2.2%
0.6%1.0%
-2%
0%
2%
4%
UnemploymentRate
Real Gross StateProduct
Median PriceNew Single
Family Home
Real DisposablePersonal Income
CHART 8A
YOY GROWTH, 2011Q2 TO 2012Q2
WEST NORTH CENTRAL AND UNITED STATES
WNC Total US
Source: IHS Global Insight
23 IHS Global Insight / AAA Memorial Day 2012 Forecast
supply. As the supply of homes contracts, prices climb.
Although the economic setting in the WNC region is expected to have improved in the second quarter of 2012, the effect
of high gasoline prices will influence the distance traveled this holiday. Nonetheless, the WNC region will experience an
increase in travel demand, spurred by an improved local economy. The increase in the regional fuel price is expected to
reduce air travel and lower total holiday spending on leisure and hospitality.
In addition to the originating travel forecast of
person-trips from the West North Central region,
the following information provides a look into the
state of the local tourism industry in the region.
In general, because the majority of travel occurs
by automobile and remains within regional
borders, regional travel ties closely with the
output generated by that region's leisure and
hospitality industry.
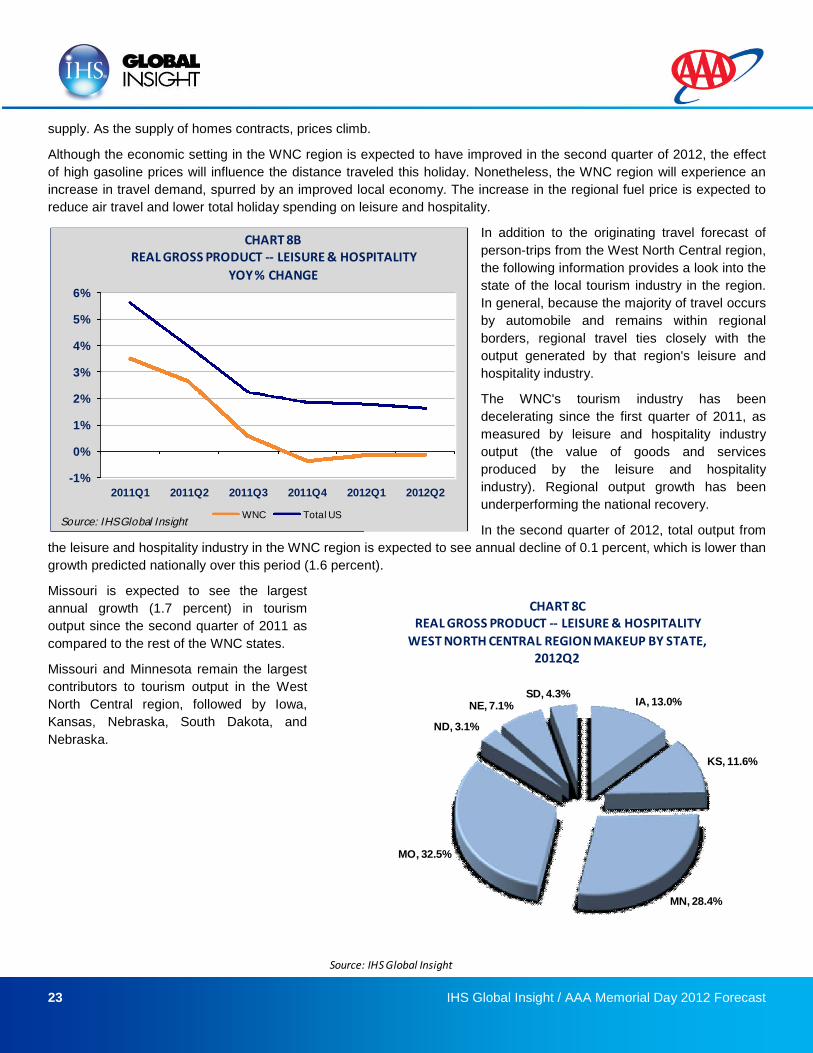
The WNC's tourism industry has been
decelerating since the first quarter of 2011, as
measured by leisure and hospitality industry
output (the value of goods and services
produced by the leisure and hospitality
industry). Regional output growth has been
underperforming the national recovery.
In the second quarter of 2012, total output from
the leisure and hospitality industry in the WNC region is expected to see annual decline of 0.1 percent, which is lower than
growth predicted nationally over this period (1.6 percent).
Missouri is expected to see the largest
annual growth (1.7 percent) in tourism
output since the second quarter of 2011 as
compared to the rest of the WNC states.
Missouri and Minnesota remain the largest
contributors to tourism output in the West
North Central region, followed by Iowa,
Kansas, Nebraska, South Dakota, and
Nebraska.
-1%
0%
1%
2%
3%
4%
5%
6%
2011Q1 2011Q2 2011Q3 2011Q4 2012Q1 2012Q2
CHART 8BREAL GROSS PRODUCT -- LEISURE & HOSPITALITY
YOY % CHANGE
WNC Total USSource: IHS Global Insight
IA, 13.0%
KS, 11.6%
MN, 28.4%
MO, 32.5%
ND, 3.1%
NE, 7.1%SD, 4.3%
CHART 8CREAL GROSS PRODUCT -- LEISURE & HOSPITALITY
WEST NORTH CENTRAL REGION MAKEUP BY STATE,2012Q2
Source: IHS Global Insight
24 IHS Global Insight / AAA Memorial Day 2012 Forecast
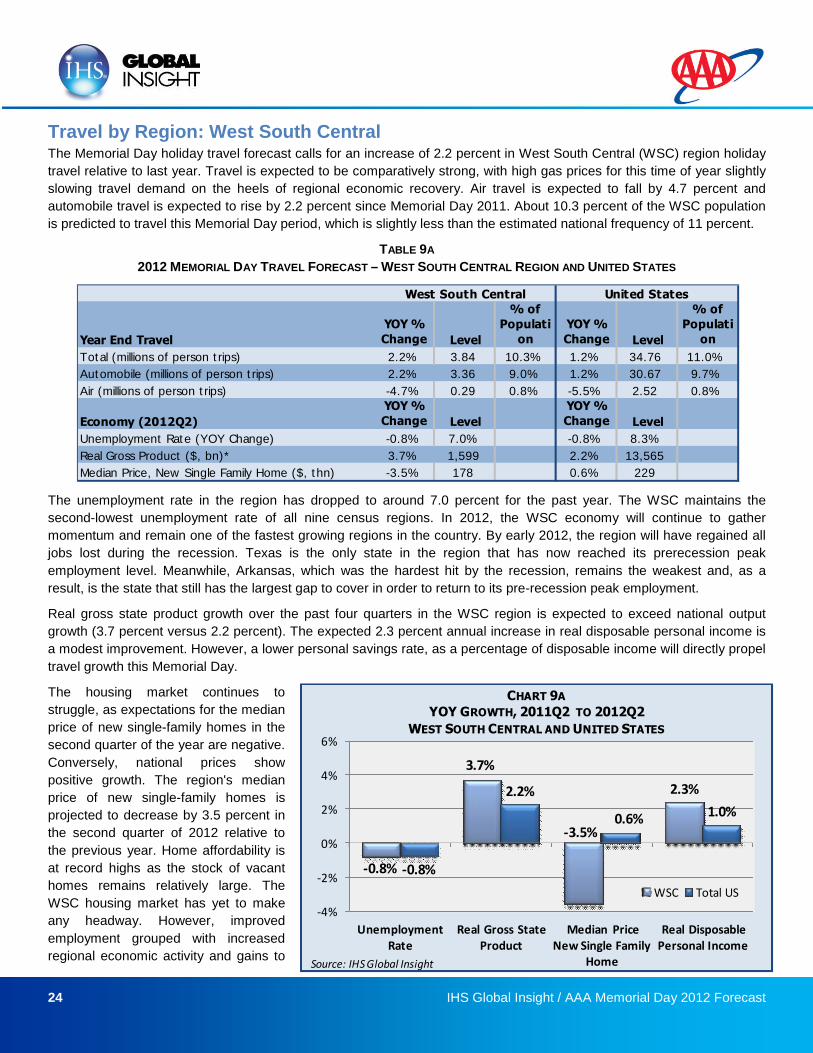
Travel by Region: West South CentralThe Memorial Day holiday travel forecast calls for an increase of 2.2 percent in West South Central (WSC) region holiday
travel relative to last year. Travel is expected to be comparatively strong, with high gas prices for this time of year slightly
slowing travel demand on the heels of regional economic recovery. Air travel is expected to fall by 4.7 percent and
automobile travel is expected to rise by 2.2 percent since Memorial Day 2011. About 10.3 percent of the WSC population
is predicted to travel this Memorial Day period, which is slightly less than the estimated national frequency of 11 percent.
TABLE 9A
2012 MEMORIAL DAY TRAVEL FORECAST – WEST SOUTH CENTRAL REGION AND UNITED STATES
The unemployment rate in the region has dropped to around 7.0 percent for the past year. The WSC maintains the
second-lowest unemployment rate of all nine census regions. In 2012, the WSC economy will continue to gather
momentum and remain one of the fastest growing regions in the country. By early 2012, the region will have regained all
jobs lost during the recession. Texas is the only state in the region that has now reached its prerecession peak
employment level. Meanwhile, Arkansas, which was the hardest hit by the recession, remains the weakest and, as a
result, is the state that still has the largest gap to cover in order to return to its pre-recession peak employment.
Real gross state product growth over the past four quarters in the WSC region is expected to exceed national output
growth (3.7 percent versus 2.2 percent). The expected 2.3 percent annual increase in real disposable personal income is
a modest improvement. However, a lower personal savings rate, as a percentage of disposable income will directly propel
travel growth this Memorial Day.
The housing market continues to
struggle, as expectations for the median
price of new single-family homes in the
second quarter of the year are negative.
Conversely, national prices show
positive growth. The region's median
price of new single-family homes is
projected to decrease by 3.5 percent in
the second quarter of 2012 relative to
the previous year. Home affordability is
at record highs as the stock of vacant
homes remains relatively large. The
WSC housing market has yet to make
any headway. However, improved
employment grouped with increased
regional economic activity and gains to
Year End Travel
YOY %
Change Level
% of
Populati
on
YOY %
Change Level
% of
Populati
on
Total (millions of person trips) 2.2% 3.84 10.3% 1.2% 34.76 11.0%
Automobile (millions of person trips) 2.2% 3.36 9.0% 1.2% 30.67 9.7%
Air (millions of person trips) -4.7% 0.29 0.8% -5.5% 2.52 0.8%
Economy (2012Q2)
YOY %
Change Level
YOY %
Change Level
Unemployment Rate (YOY Change) -0.8% 7.0% -0.8% 8.3%
Real Gross Product ($, bn)* 3.7% 1,599 2.2% 13,565
Median Price, New Single Family Home ($, thn) -3.5% 178 0.6% 229
West South Central United States
-0.8%
3.7%
-3.5%
2.3%
-0.8%
2.2%
0.6% 1.0%
-4%
-2%
0%
2%
4%
6%
UnemploymentRate
Real Gross StateProduct
Median PriceNew Single Family
Home
Real DisposablePersonal Income
CHART 9A
YOY GROWTH, 2011Q2 TO 2012Q2
WEST SOUTH CENTRAL AND UNITED STATES
WSC Total US
Source: IHS Global Insight
25 IHS Global Insight / AAA Memorial Day 2012 Forecast
personal income give consumers the confidence to buy down the excess supply of housing found in the WSC region. This
chain of events will hopefully lead to higher prices in the foreseeable future.
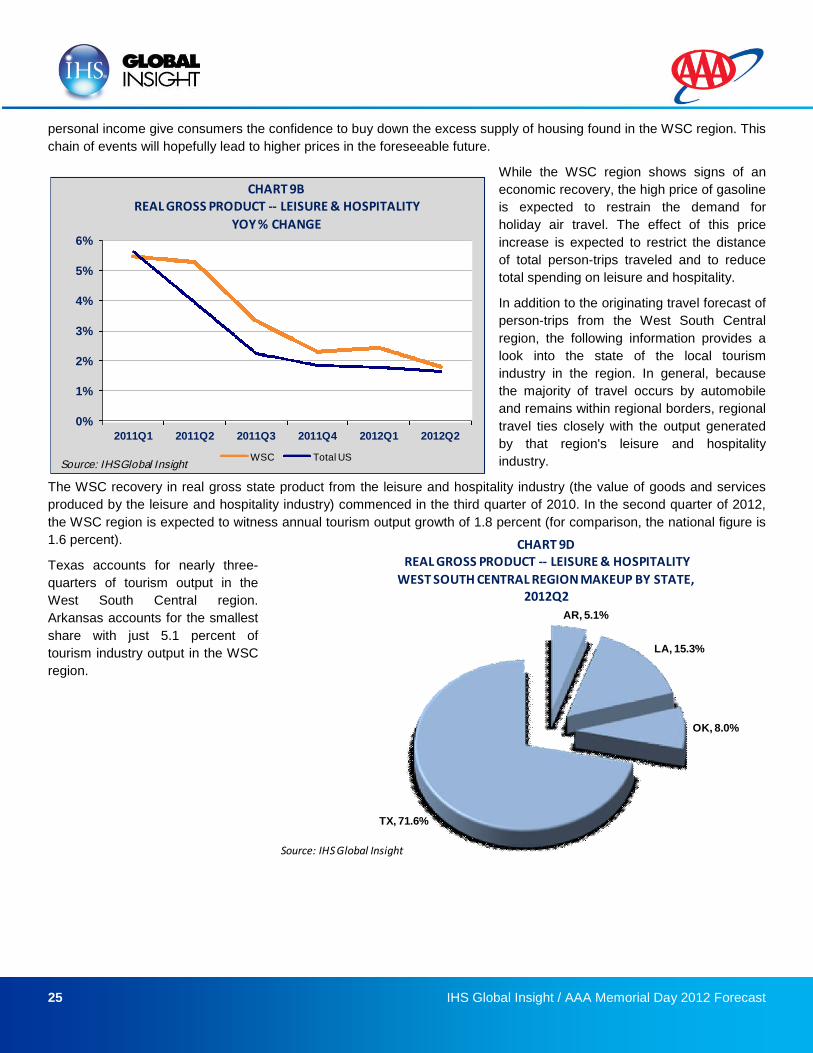
While the WSC region shows signs of an
economic recovery, the high price of gasoline
is expected to restrain the demand for
holiday air travel. The effect of this price
increase is expected to restrict the distance
of total person-trips traveled and to reduce
total spending on leisure and hospitality.
In addition to the originating travel forecast of
person-trips from the West South Central
region, the following information provides a
look into the state of the local tourism
industry in the region. In general, because
the majority of travel occurs by automobile
and remains within regional borders, regional
travel ties closely with the output generated
by that region's leisure and hospitality
industry.
The WSC recovery in real gross state product from the leisure and hospitality industry (the value of goods and services
produced by the leisure and hospitality industry) commenced in the third quarter of 2010. In the second quarter of 2012,
the WSC region is expected to witness annual tourism output growth of 1.8 percent (for comparison, the national figure is
1.6 percent).
Texas accounts for nearly three-
quarters of tourism output in the
West South Central region.
Arkansas accounts for the smallest
share with just 5.1 percent of
tourism industry output in the WSC
region.
0%
1%
2%
3%
4%
5%
6%
2011Q1 2011Q2 2011Q3 2011Q4 2012Q1 2012Q2
CHART 9BREAL GROSS PRODUCT -- LEISURE & HOSPITALITY
YOY % CHANGE
WSC Total USSource: IHS Global Insight
AR, 5.1%
LA, 15.3%
OK, 8.0%
TX, 71.6%
CHART 9DREAL GROSS PRODUCT -- LEISURE & HOSPITALITY
WEST SOUTH CENTRAL REGION MAKEUP BY STATE,2012Q2
Source: IHS Global Insight
26 IHS Global Insight / AAA Memorial Day 2012 Forecast
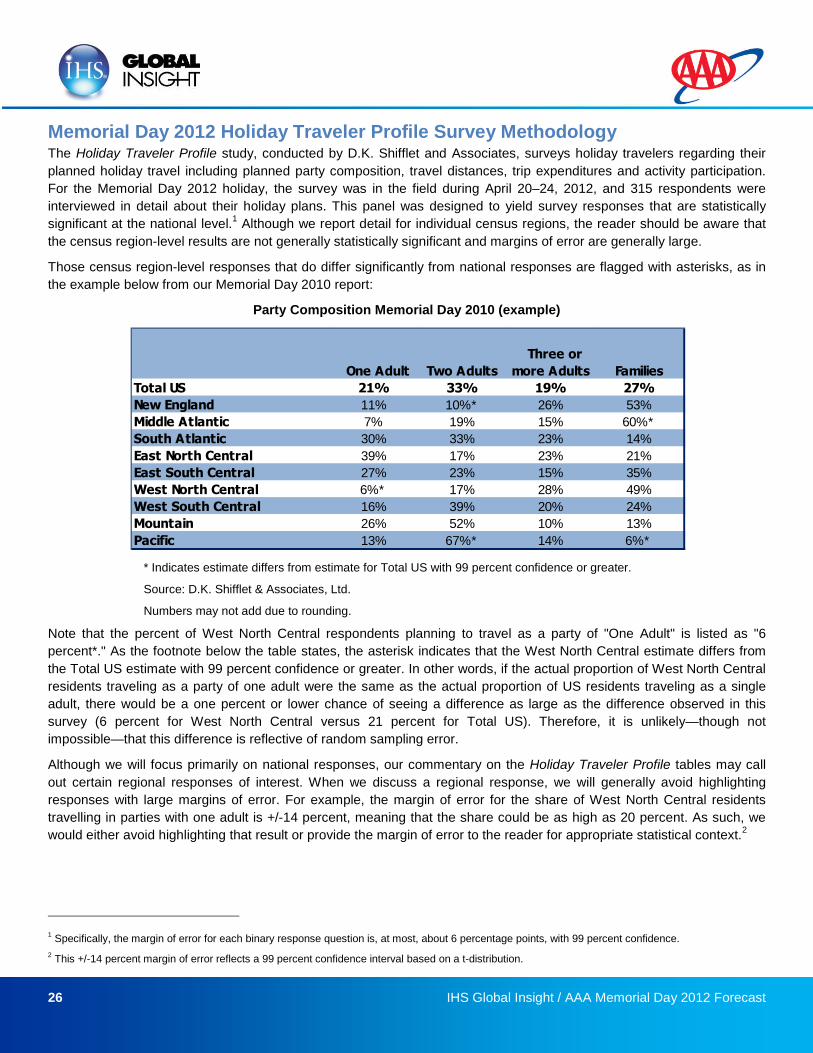
Memorial Day 2012 Holiday Traveler Profile Survey MethodologyThe Holiday Traveler Profile study, conducted by D.K. Shifflet and Associates, surveys holiday travelers regarding their
planned holiday travel including planned party composition, travel distances, trip expenditures and activity participation.
For the Memorial Day 2012 holiday, the survey was in the field during April 20–24, 2012, and 315 respondents were
interviewed in detail about their holiday plans. This panel was designed to yield survey responses that are statistically
significant at the national level.1
Although we report detail for individual census regions, the reader should be aware that
the census region-level results are not generally statistically significant and margins of error are generally large.
Those census region-level responses that do differ significantly from national responses are flagged with asterisks, as in
the example below from our Memorial Day 2010 report:
Party Composition Memorial Day 2010 (example)
* Indicates estimate differs from estimate for Total US with 99 percent confidence or greater.
Source: D.K. Shifflet & Associates, Ltd.
Numbers may not add due to rounding.
Note that the percent of West North Central respondents planning to travel as a party of "One Adult" is listed as "6
percent*." As the footnote below the table states, the asterisk indicates that the West North Central estimate differs from
the Total US estimate with 99 percent confidence or greater. In other words, if the actual proportion of West North Central
residents traveling as a party of one adult were the same as the actual proportion of US residents traveling as a single
adult, there would be a one percent or lower chance of seeing a difference as large as the difference observed in this
survey (6 percent for West North Central versus 21 percent for Total US). Therefore, it is unlikely—though not
impossible—that this difference is reflective of random sampling error.
Although we will focus primarily on national responses, our commentary on the Holiday Traveler Profile tables may call
out certain regional responses of interest. When we discuss a regional response, we will generally avoid highlighting
responses with large margins of error. For example, the margin of error for the share of West North Central residents
travelling in parties with one adult is +/-14 percent, meaning that the share could be as high as 20 percent. As such, we
would either avoid highlighting that result or provide the margin of error to the reader for appropriate statistical context.2
1 Specifically, the margin of error for each binary response question is, at most, about 6 percentage points, with 99 percent confidence.
2 This +/-14 percent margin of error reflects a 99 percent confidence interval based on a t-distribution.
One Adult Two Adults
Three or
more Adults Families
Total US 21% 33% 19% 27%
New England 11% 10%* 26% 53%
Middle Atlantic 7% 19% 15% 60%*
South Atlantic 30% 33% 23% 14%
East North Central 39% 17% 23% 21%
East South Central 27% 23% 15% 35%
West North Central 6%* 17% 28% 49%
West South Central 16% 39% 20% 24%
Mountain 26% 52% 10% 13%
Pacific 13% 67%* 14% 6%*
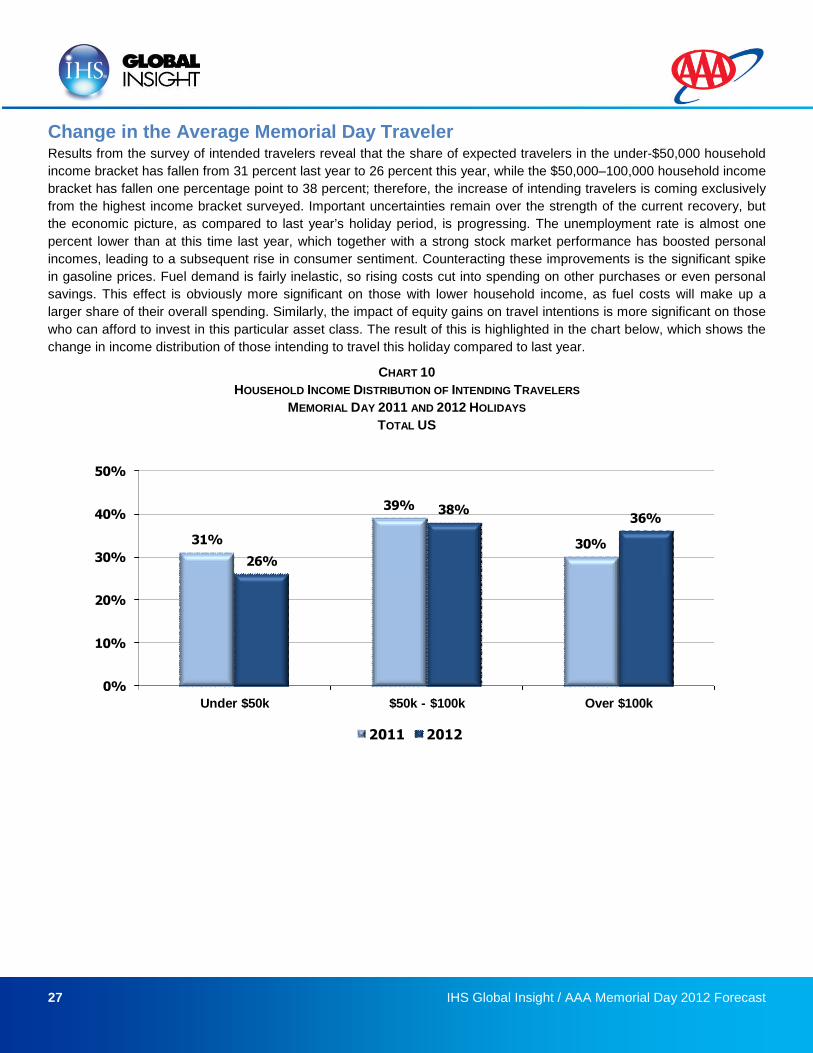
27 IHS Global Insight / AAA Memorial Day 2012 Forecast
Change in the Average Memorial Day TravelerResults from the survey of intended travelers reveal that the share of expected travelers in the under-$50,000 household
income bracket has fallen from 31 percent last year to 26 percent this year, while the $50,000–100,000 household income
bracket has fallen one percentage point to 38 percent; therefore, the increase of intending travelers is coming exclusively
from the highest income bracket surveyed. Important uncertainties remain over the strength of the current recovery, but
the economic picture, as compared to last year’s holiday period, is progressing. The unemployment rate is almost one
percent lower than at this time last year, which together with a strong stock market performance has boosted personal
incomes, leading to a subsequent rise in consumer sentiment. Counteracting these improvements is the significant spike
in gasoline prices. Fuel demand is fairly inelastic, so rising costs cut into spending on other purchases or even personal
savings. This effect is obviously more significant on those with lower household income, as fuel costs will make up a
larger share of their overall spending. Similarly, the impact of equity gains on travel intentions is more significant on those
who can afford to invest in this particular asset class. The result of this is highlighted in the chart below, which shows the
change in income distribution of those intending to travel this holiday compared to last year.
CHART 10
HOUSEHOLD INCOME DISTRIBUTION OF INTENDING TRAVELERS
MEMORIAL DAY 2011 AND 2012 HOLIDAYS
TOTAL US
31%
39%
30%
26%
38%36%
0%
10%
20%
30%
40%
50%
Under $50k $50k - $100k Over $100k
2011 2012
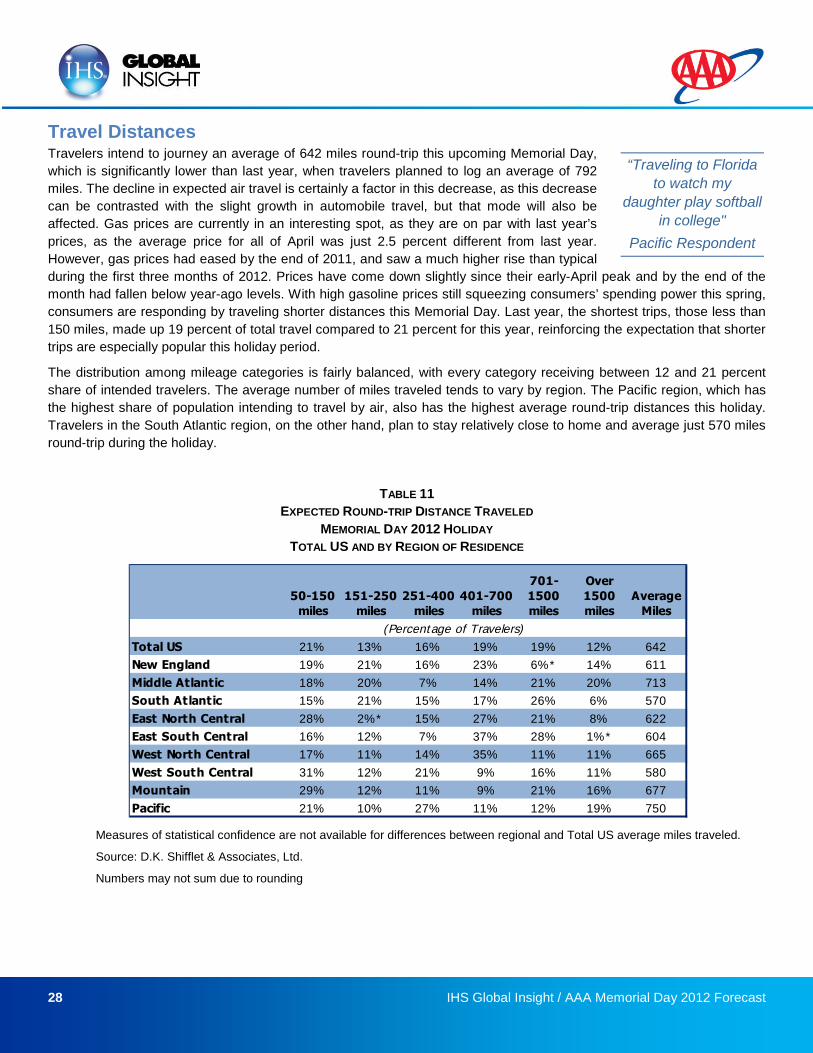
28 IHS Global Insight / AAA Mem
Travel DistancesTravelers intend to journey an average of 642 miles round-trip this upcoming Memorial Day,
which is significantly lower than last year, when travelers planned to log an average of 792
miles. The decline in expected air travel is certainly a factor in this decrease, as this decrease
can be contrasted with the slight growth in automobile travel, but that mode will also be
affected. Gas prices are currently in an interesting spot, as they are on par with last year’s
prices, as the average price for all of April was just 2.5 percent different from last year.
However, gas prices had eased by the end of 2011, and saw a much higher rise than typical
during the first three months of 2012. Prices have come down slightly since their early-April pea
month had fallen below year-ago levels. With high gasoline prices still squeezing consumers’ spe
consumers are responding by traveling shorter distances this Memorial Day. Last year, the short
150 miles, made up 19 percent of total travel compared to 21 percent for this year, reinforcing the
trips are especially popular this holiday period.
The distribution among mileage categories is fairly balanced, with every category receiving betw
share of intended travelers. The average number of miles traveled tends to vary by region. The P
the highest share of population intending to travel by air, also has the highest average round-tri
Travelers in the South Atlantic region, on the other hand, plan to stay relatively close to home an
round-trip during the holiday.
TABLE 11
EXPECTED ROUND-TRIP DISTANCE TRAVELED
MEMORIAL DAY 2012 HOLIDAY
TOTAL US AND BY REGION OF RESIDENCE
Measures of statistical confidence are not available for differences between regional and Total US a
Source: D.K. Shifflet & Associates, Ltd.
Numbers may not sum due to rounding
50-150
miles
151-250
miles
251-400
miles
401-700
miles
701-
1500
miles
Over
1500
miles
Total US 21% 13% 16% 19% 19% 12%
New England 19% 21% 16% 23% 6%* 14%
Middle Atlantic 18% 20% 7% 14% 21% 20%
South Atlantic 15% 21% 15% 17% 26% 6%
East North Central 28% 2%* 15% 27% 21% 8%
East South Central 16% 12% 7% 37% 28% 1%*
West North Central 17% 11% 14% 35% 11% 11%
West South Central 31% 12% 21% 9% 16% 11%
Mountain 29% 12% 11% 9% 21% 16%
Pacific 21% 10% 27% 11% 12% 19%
(Percentage of Travelers)
“Traveling to Florida
to watch my
daughter play softball
in college"
orial Day 2012 Forecast
Pacific Respondent
k and by the end of the
nding power this spring,
est trips, those less than
expectation that shorter
een 12 and 21 percent
acific region, which has
p distances this holiday.
d average just 570 miles
verage miles traveled.
Average
Miles
642
611
713
570
622
604
665
580
677
750
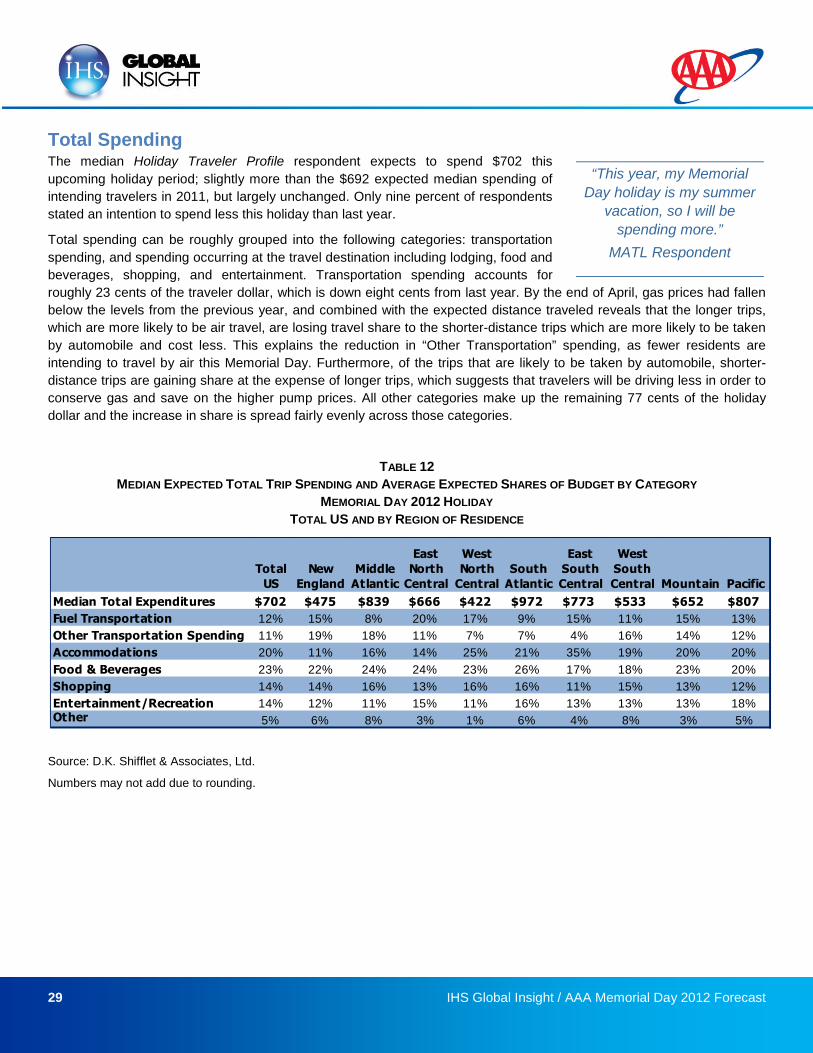
29 IHS Global Insight / AAA Memorial Day 2012 Forecast
“This year, my Memorial
Day holiday is my summer
vacation, so I will be
spending more.”
MATL Respondent
Total SpendingThe median Holiday Traveler Profile respondent expects to spend $702 this
upcoming holiday period; slightly more than the $692 expected median spending of
intending travelers in 2011, but largely unchanged. Only nine percent of respondents
stated an intention to spend less this holiday than last year.
Total spending can be roughly grouped into the following categories: transportation
spending, and spending occurring at the travel destination including lodging, food and
beverages, shopping, and entertainment. Transportation spending accounts for
roughly 23 cents of the traveler dollar, which is down eight cents from last year. By the end of April, gas prices had fallen
below the levels from the previous year, and combined with the expected distance traveled reveals that the longer trips,
which are more likely to be air travel, are losing travel share to the shorter-distance trips which are more likely to be taken
by automobile and cost less. This explains the reduction in “Other Transportation” spending, as fewer residents are
intending to travel by air this Memorial Day. Furthermore, of the trips that are likely to be taken by automobile, shorter-
distance trips are gaining share at the expense of longer trips, which suggests that travelers will be driving less in order to
conserve gas and save on the higher pump prices. All other categories make up the remaining 77 cents of the holiday
dollar and the increase in share is spread fairly evenly across those categories.
TABLE 12
MEDIAN EXPECTED TOTAL TRIP SPENDING AND AVERAGE EXPECTED SHARES OF BUDGET BY CATEGORY
MEMORIAL DAY 2012 HOLIDAY
TOTAL US AND BY REGION OF RESIDENCE
Source: D.K. Shifflet & Associates, Ltd.
Numbers may not add due to rounding.
Total
US
New
England
Middle
Atlantic
East
North
Central
West
North
Central
South
Atlantic
East
South
Central
West
South
Central Mountain Pacific
Median Total Expenditures $702 $475 $839 $666 $422 $972 $773 $533 $652 $807
Fuel Transportation 12% 15% 8% 20% 17% 9% 15% 11% 15% 13%
Other Transportation Spending 11% 19% 18% 11% 7% 7% 4% 16% 14% 12%
Accommodations 20% 11% 16% 14% 25% 21% 35% 19% 20% 20%
Food & Beverages 23% 22% 24% 24% 23% 26% 17% 18% 23% 20%
Shopping 14% 14% 16% 13% 16% 16% 11% 15% 13% 12%
Entertainment/Recreation 14% 12% 11% 15% 11% 16% 13% 13% 13% 18%Other 5% 6% 8% 3% 1% 6% 4% 8% 3% 5%
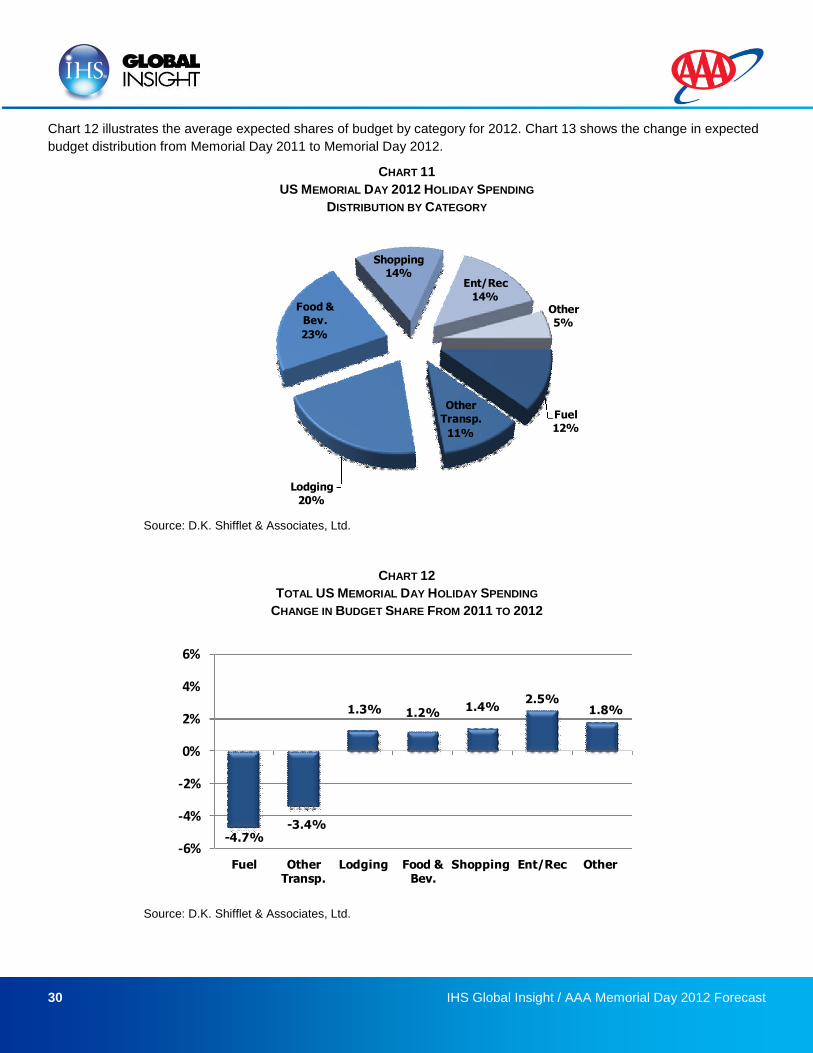
30 IHS Global Insight / AAA Memorial Day 2012 Forecast
Chart 12 illustrates the average expected shares of budget by category for 2012. Chart 13 shows the change in expected
budget distribution from Memorial Day 2011 to Memorial Day 2012.
CHART 11
US MEMORIAL DAY 2012 HOLIDAY SPENDING
DISTRIBUTION BY CATEGORY
Source: D.K. Shifflet & Associates, Ltd.
CHART 12
TOTAL US MEMORIAL DAY HOLIDAY SPENDING
CHANGE IN BUDGET SHARE FROM 2011 TO 2012
Source: D.K. Shifflet & Associates, Ltd.
Fuel12%
OtherTransp.
11%
Lodging20%
Food &Bev.
23%
Shopping14%
Ent/Rec14%
Other5%
-4.7%-3.4%
1.3% 1.2% 1.4%2.5%
1.8%
-6%
-4%
-2%
0%
2%
4%
6%
Fuel OtherTransp.
Lodging Food &Bev.
Shopping Ent/Rec Other
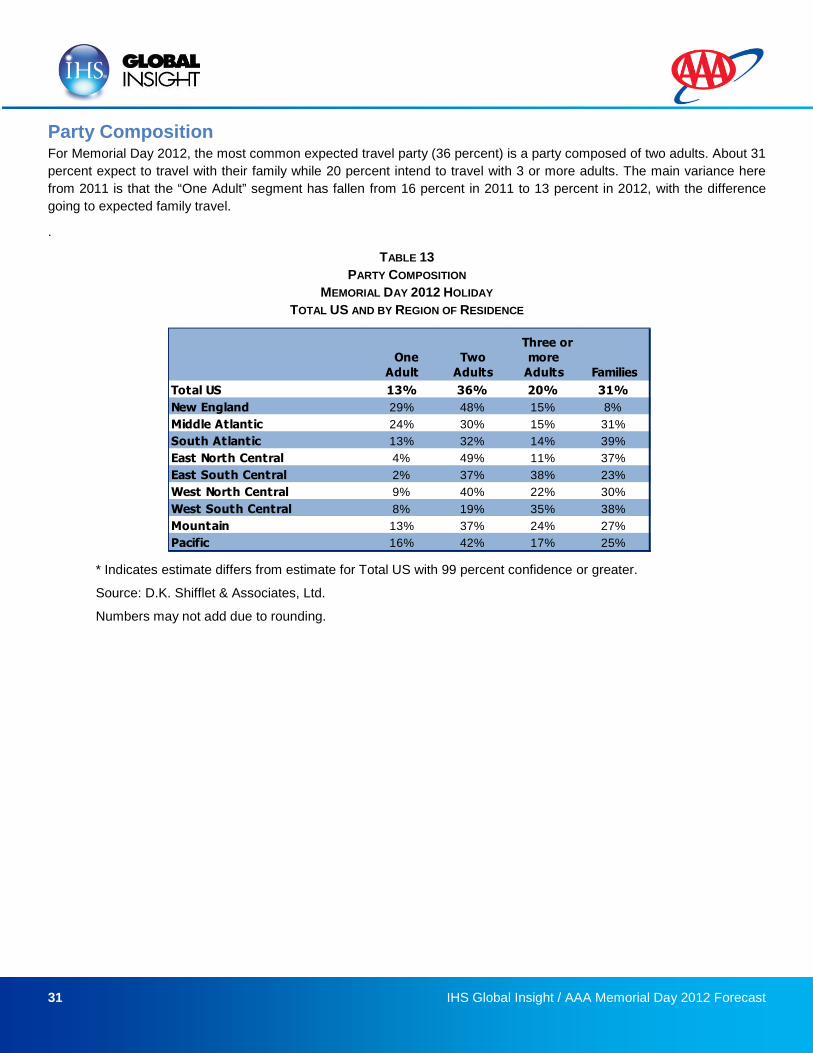
31 IHS Global Insight / AAA Memorial Day 2012 Forecast
Party CompositionFor Memorial Day 2012, the most common expected travel party (36 percent) is a party composed of two adults. About 31
percent expect to travel with their family while 20 percent intend to travel with 3 or more adults. The main variance here
from 2011 is that the “One Adult” segment has fallen from 16 percent in 2011 to 13 percent in 2012, with the difference
going to expected family travel.
.
TABLE 13
PARTY COMPOSITION
MEMORIAL DAY 2012 HOLIDAY
TOTAL US AND BY REGION OF RESIDENCE
* Indicates estimate differs from estimate for Total US with 99 percent confidence or greater.
Source: D.K. Shifflet & Associates, Ltd.
Numbers may not add due to rounding.
One
Adult
Two
Adults
Three ormore
Adults Families
Total US 13% 36% 20% 31%
New England 29% 48% 15% 8%
Middle Atlantic 24% 30% 15% 31%
South Atlantic 13% 32% 14% 39%
East North Central 4% 49% 11% 37%
East South Central 2% 37% 38% 23%
West North Central 9% 40% 22% 30%
West South Central 8% 19% 35% 38%
Mountain 13% 37% 24% 27%
Pacific 16% 42% 17% 25%
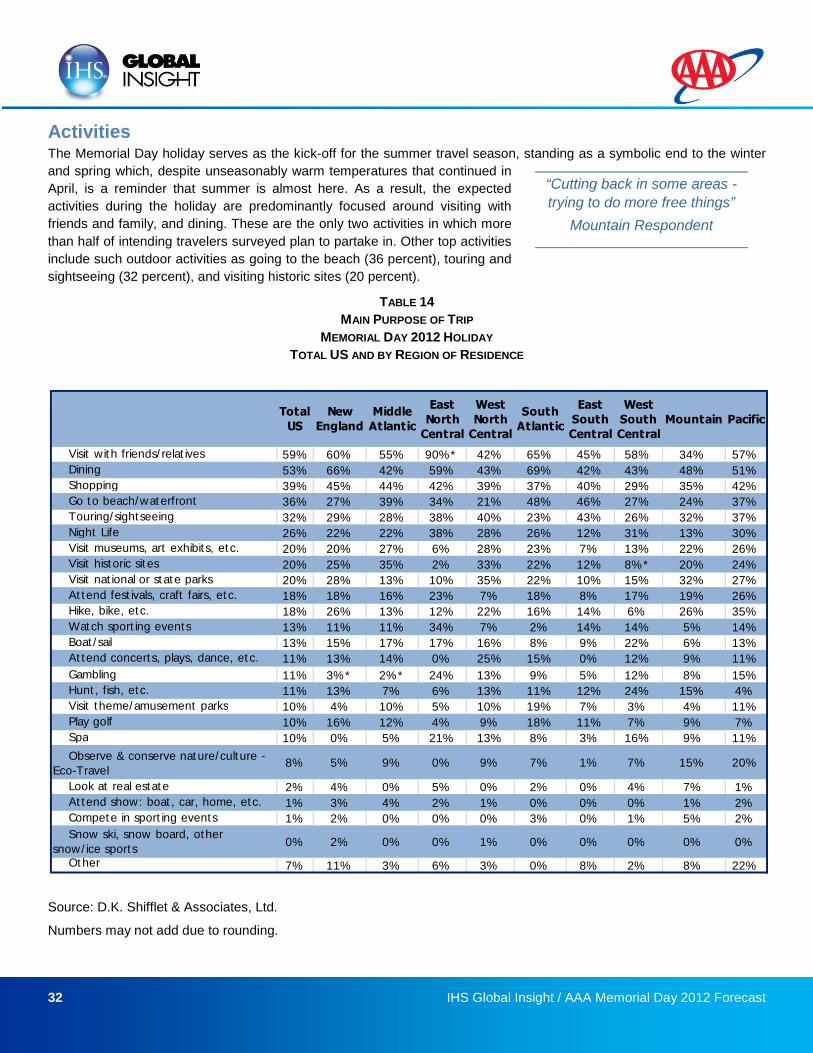
32 IHS Global Insight / AAA Memorial Day 2012 Forecast
“Cutting back in some areas -
trying to do more free things”
Mountain Respondent
ActivitiesThe Memorial Day holiday serves as the kick-off for the summer travel season, standing as a symbolic end to the winter
and spring which, despite unseasonably warm temperatures that continued in
April, is a reminder that summer is almost here. As a result, the expected
activities during the holiday are predominantly focused around visiting with
friends and family, and dining. These are the only two activities in which more
than half of intending travelers surveyed plan to partake in. Other top activities
include such outdoor activities as going to the beach (36 percent), touring and
sightseeing (32 percent), and visiting historic sites (20 percent).
TABLE 14
MAIN PURPOSE OF TRIP
MEMORIAL DAY 2012 HOLIDAY
TOTAL US AND BY REGION OF RESIDENCE
Source: D.K. Shifflet & Associates, Ltd.
Numbers may not add due to rounding.
TotalUS
NewEngland
MiddleAtlantic
EastNorth
Central
WestNorth
Central
SouthAtlantic
EastSouthCentral
WestSouthCentral
Mountain Pacific
Visit with friends/relatives 59% 60% 55% 90%* 42% 65% 45% 58% 34% 57%
Dining 53% 66% 42% 59% 43% 69% 42% 43% 48% 51%Shopping 39% 45% 44% 42% 39% 37% 40% 29% 35% 42%Go to beach/waterfront 36% 27% 39% 34% 21% 48% 46% 27% 24% 37%Touring/sightseeing 32% 29% 28% 38% 40% 23% 43% 26% 32% 37%Night Life 26% 22% 22% 38% 28% 26% 12% 31% 13% 30%Visit museums, art exhibits, etc. 20% 20% 27% 6% 28% 23% 7% 13% 22% 26%Visit historic sites 20% 25% 35% 2% 33% 22% 12% 8%* 20% 24%Visit national or state parks 20% 28% 13% 10% 35% 22% 10% 15% 32% 27%Attend festivals, craft fairs, etc. 18% 18% 16% 23% 7% 18% 8% 17% 19% 26%Hike, bike, etc. 18% 26% 13% 12% 22% 16% 14% 6% 26% 35%
Watch sporting events 13% 11% 11% 34% 7% 2% 14% 14% 5% 14%Boat/sail 13% 15% 17% 17% 16% 8% 9% 22% 6% 13%Attend concerts, plays, dance, etc. 11% 13% 14% 0% 25% 15% 0% 12% 9% 11%
Gambling 11% 3%* 2%* 24% 13% 9% 5% 12% 8% 15%Hunt, fish, etc. 11% 13% 7% 6% 13% 11% 12% 24% 15% 4%Visit theme/amusement parks 10% 4% 10% 5% 10% 19% 7% 3% 4% 11%
Play golf 10% 16% 12% 4% 9% 18% 11% 7% 9% 7%Spa 10% 0% 5% 21% 13% 8% 3% 16% 9% 11%
Observe & conserve nature/culture -Eco-Travel
8% 5% 9% 0% 9% 7% 1% 7% 15% 20%
Look at real estate 2% 4% 0% 5% 0% 2% 0% 4% 7% 1%Attend show: boat, car, home, etc. 1% 3% 4% 2% 1% 0% 0% 0% 1% 2%Compete in sporting events 1% 2% 0% 0% 0% 3% 0% 1% 5% 2%
Snow ski, snow board, othersnow/ice sports
0% 2% 0% 0% 1% 0% 0% 0% 0% 0%
Other 7% 11% 3% 6% 3% 0% 8% 2% 8% 22%
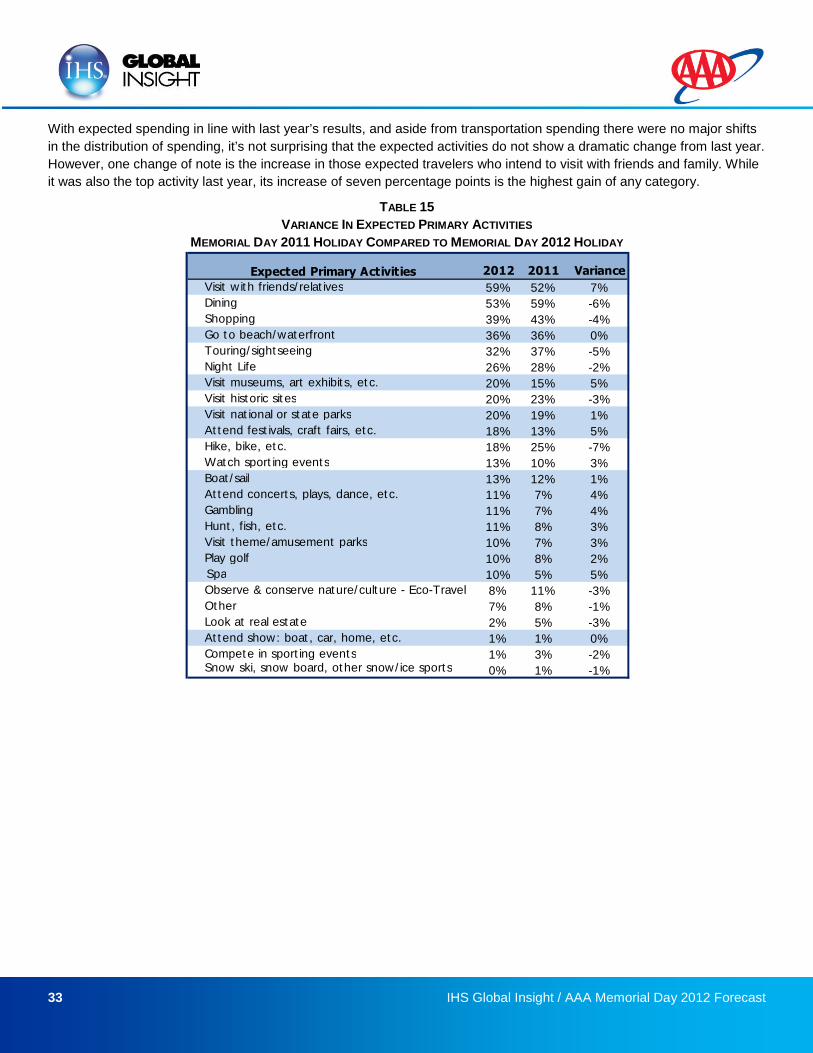
33 IHS Global Insight / AAA Memorial Day 2012 Forecast
With expected spending in line with last year’s results, and aside from transportation spending there were no major shifts
in the distribution of spending, it’s not surprising that the expected activities do not show a dramatic change from last year.
However, one change of note is the increase in those expected travelers who intend to visit with friends and family. While
it was also the top activity last year, its increase of seven percentage points is the highest gain of any category.
TABLE 15
VARIANCE IN EXPECTED PRIMARY ACTIVITIES
MEMORIAL DAY 2011 HOLIDAY COMPARED TO MEMORIAL DAY 2012 HOLIDAY
Expected Primary Activities 2012 2011 Variance
Visit with friends/relatives 59% 52% 7%
Dining 53% 59% -6%
Shopping 39% 43% -4%
Go to beach/waterfront 36% 36% 0%
Touring/sightseeing 32% 37% -5%
Night Life 26% 28% -2%Visit museums, art exhibits, etc. 20% 15% 5%Visit historic sites 20% 23% -3%Visit national or state parks 20% 19% 1%Attend festivals, craft fairs, etc. 18% 13% 5%Hike, bike, etc. 18% 25% -7%Watch sport ing events 13% 10% 3%Boat/sail 13% 12% 1%Attend concerts, plays, dance, etc. 11% 7% 4%
Gambling 11% 7% 4%
Hunt, fish, etc. 11% 8% 3%
Visit theme/amusement parks 10% 7% 3%
Play golf 10% 8% 2%
Spa 10% 5% 5%
Observe & conserve nature/culture - Eco-Travel 8% 11% -3%
Other 7% 8% -1%
Look at real estate 2% 5% -3%
Attend show: boat, car, home, etc. 1% 1% 0%
Compete in sporting events 1% 3% -2%Snow ski, snow board, other snow/ice sports 0% 1% -1%
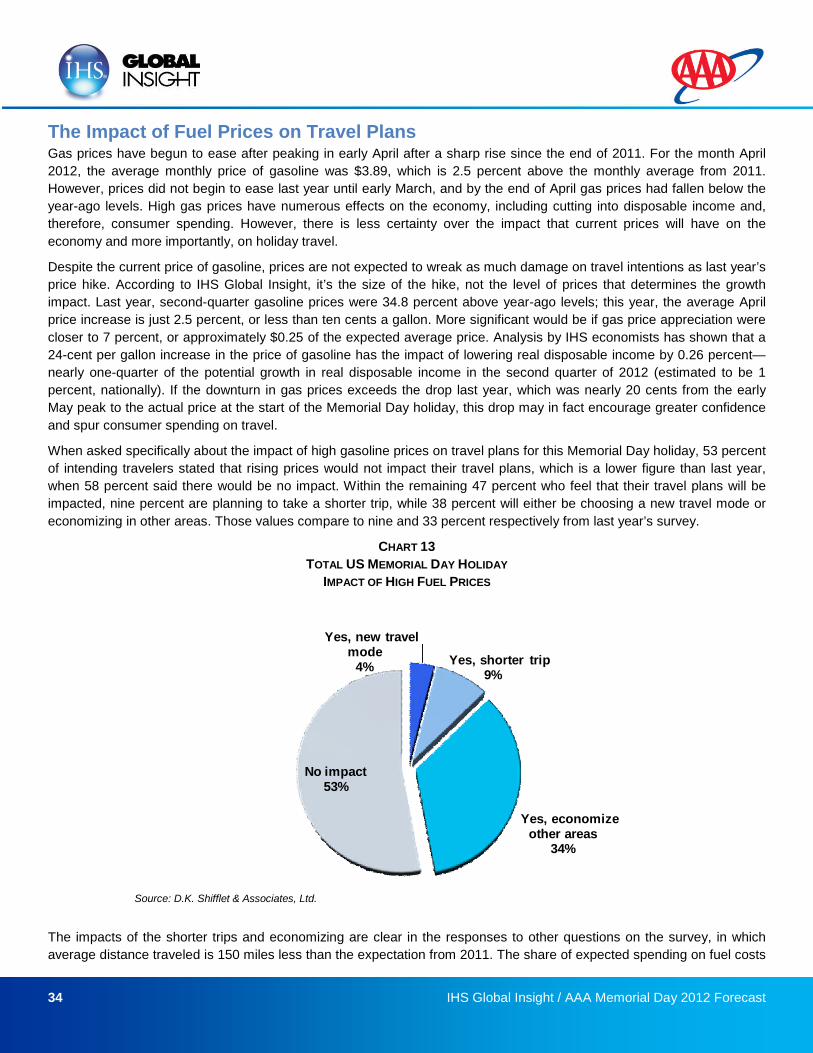
34 IHS Global Insight / AAA Memorial Day 2012 Forecast
The Impact of Fuel Prices on Travel PlansGas prices have begun to ease after peaking in early April after a sharp rise since the end of 2011. For the month April
2012, the average monthly price of gasoline was $3.89, which is 2.5 percent above the monthly average from 2011.
However, prices did not begin to ease last year until early March, and by the end of April gas prices had fallen below the
year-ago levels. High gas prices have numerous effects on the economy, including cutting into disposable income and,
therefore, consumer spending. However, there is less certainty over the impact that current prices will have on the
economy and more importantly, on holiday travel.
Despite the current price of gasoline, prices are not expected to wreak as much damage on travel intentions as last year’s
price hike. According to IHS Global Insight, it’s the size of the hike, not the level of prices that determines the growth
impact. Last year, second-quarter gasoline prices were 34.8 percent above year-ago levels; this year, the average April
price increase is just 2.5 percent, or less than ten cents a gallon. More significant would be if gas price appreciation were
closer to 7 percent, or approximately $0.25 of the expected average price. Analysis by IHS economists has shown that a
24-cent per gallon increase in the price of gasoline has the impact of lowering real disposable income by 0.26 percent—
nearly one-quarter of the potential growth in real disposable income in the second quarter of 2012 (estimated to be 1
percent, nationally). If the downturn in gas prices exceeds the drop last year, which was nearly 20 cents from the early
May peak to the actual price at the start of the Memorial Day holiday, this drop may in fact encourage greater confidence
and spur consumer spending on travel.
When asked specifically about the impact of high gasoline prices on travel plans for this Memorial Day holiday, 53 percent
of intending travelers stated that rising prices would not impact their travel plans, which is a lower figure than last year,
when 58 percent said there would be no impact. Within the remaining 47 percent who feel that their travel plans will be
impacted, nine percent are planning to take a shorter trip, while 38 percent will either be choosing a new travel mode or
economizing in other areas. Those values compare to nine and 33 percent respectively from last year’s survey.
CHART 13
TOTAL US MEMORIAL DAY HOLIDAY
IMPACT OF HIGH FUEL PRICES
The impacts of the shorter trips and economizing are clear in the responses to other questions on the survey, in which
average distance traveled is 150 miles less than the expectation from 2011. The share of expected spending on fuel costs
Yes, new travelmode
4%Yes, shorter trip
9%
Yes, economizeother areas
34%
No impact53%
Source: D.K. Shifflet & Associates, Ltd.

35 IHS Global Insight / AAA Memorial Day 2012 Forecast
has declined by almost five percent, relative to last year, as many travelers are avoiding air travel altogether, or taking
shorter distance automobile trips to avoid the high price of gasoline. Many travelers may feel strongly that rising gas
prices won’t affect their travel plans, but for those who are affected, their changes will be significant. For the majority who
feel it won’t impact their travel plans, it is possible that their planning process has already been impacted and the
constrained growth in disposable income has manifested itself from the start in terms of how they planned out their trip.
36 IHS Global Insight / AAA Memorial Day 2012 Forecast
Addendum 1: US Economic Forecast Summary:Published 5/10/2012
Another Summer Slowdown?The clear downshift in employment growth during March and April has raised the question of whether this year will see a
marked summer slowdown in the recovery, similar to 2011. Our view is that the underlying path of growth was never that
robust to begin with—as illustrated by the 2.2% growth rate in GDP during the first quarter. Employment gains around
250,000 per month over the three months through February, partly helped by the unseasonably warm weather, was
inconsistent with the growth picture. It now seems that job growth is decelerating to meet GDP growth, rather than GDP
picking up to meet employment. But since we had never bought into the view that the recovery was "taking off," the
employment slowdown does not change our outlook. Our GDP growth forecasts were already cautious, and we see no
extra reasons for pessimism yet, so we remain at 2.2% for 2012 and 2.4% for 2013.
The economy was hit by multiple shocks in 2011—the surge in oil prices resulting from the Arab spring; the shock to
global supply chains, especially automotive, from the Japanese earthquake and tsunami; the deteriorating Eurozone
sovereign-debt crisis; and the brush with US sovereign-debt default caused by the prolonged deadlock over raising the
debt ceiling.
Although risks still abound in 2012, we have not yet been hit by similar-sized shocks. Oil prices have moved up
again, but not enough to move gasoline prices to new highs. We have had no natural disaster of the order of Japan's last
year. In Europe, the sovereign-debt crisis and the Eurozone recession are both deepening, but markets are now more
confident that the crisis will not morph into a global banking-sector meltdown, largely because of aggressive liquidity
injections by the European Central Bank. At home, the United States still faces huge fiscal uncertainty, but we are hopeful
this time it will be resolved without taking the federal government to the brink of default.
It is also important to remember that the fundamentals of the US economy look better now than in 2011. One more
year of deleveraging is now behind us, and one more year of pent-up demand has built up, some of which is now
translating into stronger demand, notably in the vehicles sector. We also have one more year's worth of housing
adjustment behind us, which is bringing down vacancy rates in both the rental and the homeowner markets, setting the
stage for a future recovery in housing activity.
We expect GDP growth to hold at or just above 2% for the rest of 2012. We cannot expect inventory accumulation to
keep boosting growth, as it did in the fourth and first quarters, but we think that the slowdown in business fixed investment
(which actually fell in the first quarter) is just temporary. And although the long-term path of real federal spending remains
downward, we now expect some bounce in defense spending after two successive quarters of steep declines.
Consumer spending grew 2.9% in the first quarter, better than expected. Stronger vehicle sales, helped by pent-up
demand, were a key driver of first-quarter spending. Our light-vehicle sales forecast for 2012 has been raised slightly to
14.3-million units (previously 14.2 million). Our 2013 projection remains 14.9 million.
But consumers still face too many negatives to allow a robust spending recovery—high debt burdens, low house prices,
price increases that have outpaced wage growth, and a lack of confidence in the government's ability to make things
better. Overall, we expect consumer spending growth of 2.2% in 2012, the same as in 2011, and not a powerful driver of
recovery.
We believe that the employment picture is still gradually improving, which will help consumer incomes. Payroll
employment growth in the three months to February averaged 252,000, helped by warm weather, but it then decelerated
to an average 135,000 in March and April. Over the rest of 2012, we anticipate job growth in the 150,000–200,000/month
range. What that does to the unemployment rate depends on the labor-force response. If rising employment fails to attract
job seekers back into the labor force, the unemployment rate will keep falling sharply, but our forecast assumes faster
labor-force growth, so the jobless rate edges down only a little further to 7.9% by year-end, from 8.1% in April.
37 IHS Global Insight / AAA Memorial Day 2012 Forecast
Pent-up demand for housing is building as young adults stay at home, and at some point (helped by job growth) will
spark a major revival in housing activity. We expect a modest improvement in housing starts during 2012 (742,000 units,
compared with 610,000 in 2011), concentrated in the multifamily segment, where pent-up demand is already helping the
rental market. Recent evidence suggests that home prices are beginning to stabilize. We expect only a 0.6% house-price
decline in 2012, as measured by the FHFA purchase-only index, fourth quarter to fourth quarter.
Capital equipment remains an important driver of GDP growth. Business equipment and software spending growth
slowed sharply in the first quarter, to just 1.7%, but we believe that represents only a pause. Firms remain flush with cash
and want to address replacement needs neglected during the recession and to improve productivity, so we expect
average spending growth of 8.0% in 2012.
On the business structures side, spending on buildings fell back 5.3% in the first quarter. We think this represents a
correction after three quarterly increases, not the start of a new downtrend, but do not expect to see sustained strong
improvement until 2013. Oil and gas drilling activity has retreated. While higher oil prices have led to a surge in
petroleum drilling, natural gas drilling is now in retreat in the face of exceptionally low prices. We expect an overall 5.7%
decline in drilling for 2012.
In the state and local government sector, the pace of budget tightening is easing as revenues have begun to improve.
We expect real state and local government spending to decline 1.6% in calendar 2012, after a 2.2% decline in calendar
2011.
The federal budget deficit came in at $1.3 trillion in fiscal 2011 (8.7% of GDP), roughly the same as fiscal 2010. Federal
fiscal policy is tightening, as stimulus fades away and spending cuts take effect. We expect the deficit to decline to $1.1
trillion in fiscal 2012 (7.2% of GDP).
Key fiscal deadlines are looming. If nothing is done, automatic spending cuts will kick in at the beginning of 2013, and
all of the Bush tax cuts and the payroll tax cut and emergency unemployment insurance benefits will expire at the same
time, before the winners in the November elections have taken office. In addition, the debt ceiling will need to be raised
again, probably in the first half of 2013. We assume that the lame-duck Congress will extend the deadlines for a short
period, passing the problem on to the new Congress and president. We assume that a compromise involving entitlement
spending cuts and tax increases, phased in over many years, will replace what would be a catastrophic fiscal tightening.
The exact nature of that compromise will depend on the balance of power in Washington after the elections.
We believe that the Eurozone slipped into recession during the fourth quarter. In addition, emerging markets’ growth has
slowed, and the dollar is stronger than a year ago. This combination is bad news for US export growth, which will likely
decelerate from 6.7% in 2011 to 4.5% in 2012.
Even though gasoline prices and food prices have been running higher than a year ago, their rate of increase in 2012 is
much lower than in 2011, which means that headline CPI inflation should slow to 2.2% in 2012, from 3.1% in 2011. In
addition, in the face of sluggish demand growth and some pullback in commodity prices, we expect core inflation to ease
gradually during the year.
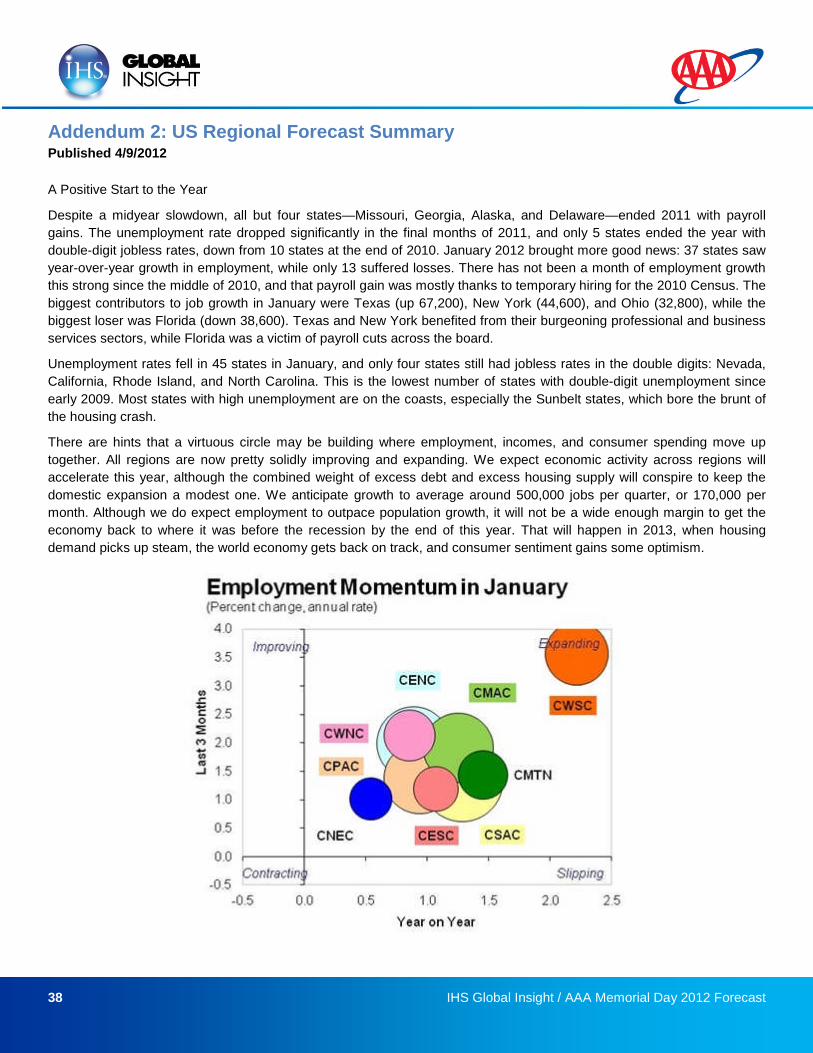
38 IHS Global Insight / AAA Memorial Day 2012 Forecast
Addendum 2: US Regional Forecast SummaryPublished 4/9/2012
A Positive Start to the Year
Despite a midyear slowdown, all but four states—Missouri, Georgia, Alaska, and Delaware—ended 2011 with payroll
gains. The unemployment rate dropped significantly in the final months of 2011, and only 5 states ended the year with
double-digit jobless rates, down from 10 states at the end of 2010. January 2012 brought more good news: 37 states saw
year-over-year growth in employment, while only 13 suffered losses. There has not been a month of employment growth
this strong since the middle of 2010, and that payroll gain was mostly thanks to temporary hiring for the 2010 Census. The
biggest contributors to job growth in January were Texas (up 67,200), New York (44,600), and Ohio (32,800), while the
biggest loser was Florida (down 38,600). Texas and New York benefited from their burgeoning professional and business
services sectors, while Florida was a victim of payroll cuts across the board.
Unemployment rates fell in 45 states in January, and only four states still had jobless rates in the double digits: Nevada,
California, Rhode Island, and North Carolina. This is the lowest number of states with double-digit unemployment since
early 2009. Most states with high unemployment are on the coasts, especially the Sunbelt states, which bore the brunt of
the housing crash.
There are hints that a virtuous circle may be building where employment, incomes, and consumer spending move up
together. All regions are now pretty solidly improving and expanding. We expect economic activity across regions will
accelerate this year, although the combined weight of excess debt and excess housing supply will conspire to keep the
domestic expansion a modest one. We anticipate growth to average around 500,000 jobs per quarter, or 170,000 per
month. Although we do expect employment to outpace population growth, it will not be a wide enough margin to get the
economy back to where it was before the recession by the end of this year. That will happen in 2013, when housing
demand picks up steam, the world economy gets back on track, and consumer sentiment gains some optimism.
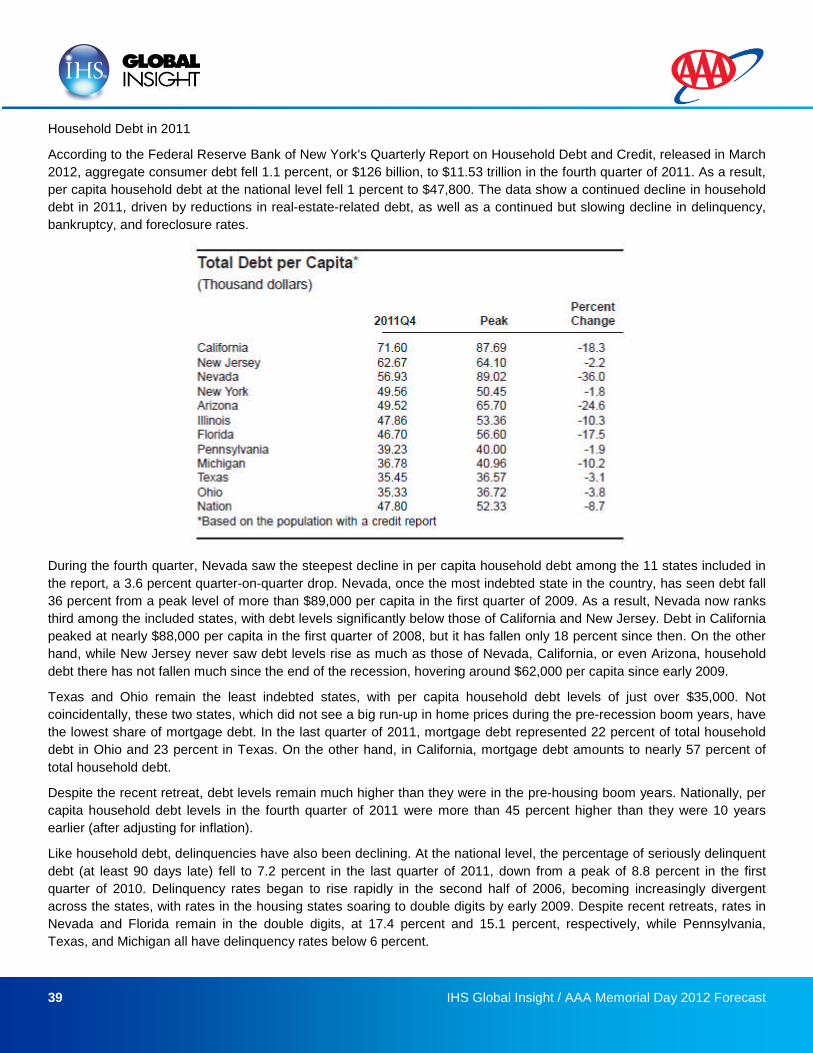
39 IHS Global Insight / AAA Memorial Day 2012 Forecast
Household Debt in 2011
According to the Federal Reserve Bank of New York's Quarterly Report on Household Debt and Credit, released in March
2012, aggregate consumer debt fell 1.1 percent, or $126 billion, to $11.53 trillion in the fourth quarter of 2011. As a result,
per capita household debt at the national level fell 1 percent to $47,800. The data show a continued decline in household
debt in 2011, driven by reductions in real-estate-related debt, as well as a continued but slowing decline in delinquency,
bankruptcy, and foreclosure rates.
During the fourth quarter, Nevada saw the steepest decline in per capita household debt among the 11 states included in
the report, a 3.6 percent quarter-on-quarter drop. Nevada, once the most indebted state in the country, has seen debt fall
36 percent from a peak level of more than $89,000 per capita in the first quarter of 2009. As a result, Nevada now ranks
third among the included states, with debt levels significantly below those of California and New Jersey. Debt in California
peaked at nearly $88,000 per capita in the first quarter of 2008, but it has fallen only 18 percent since then. On the other
hand, while New Jersey never saw debt levels rise as much as those of Nevada, California, or even Arizona, household
debt there has not fallen much since the end of the recession, hovering around $62,000 per capita since early 2009.
Texas and Ohio remain the least indebted states, with per capita household debt levels of just over $35,000. Not
coincidentally, these two states, which did not see a big run-up in home prices during the pre-recession boom years, have
the lowest share of mortgage debt. In the last quarter of 2011, mortgage debt represented 22 percent of total household
debt in Ohio and 23 percent in Texas. On the other hand, in California, mortgage debt amounts to nearly 57 percent of
total household debt.
Despite the recent retreat, debt levels remain much higher than they were in the pre-housing boom years. Nationally, per
capita household debt levels in the fourth quarter of 2011 were more than 45 percent higher than they were 10 years
earlier (after adjusting for inflation).
Like household debt, delinquencies have also been declining. At the national level, the percentage of seriously delinquent
debt (at least 90 days late) fell to 7.2 percent in the last quarter of 2011, down from a peak of 8.8 percent in the first
quarter of 2010. Delinquency rates began to rise rapidly in the second half of 2006, becoming increasingly divergent
across the states, with rates in the housing states soaring to double digits by early 2009. Despite recent retreats, rates in
Nevada and Florida remain in the double digits, at 17.4 percent and 15.1 percent, respectively, while Pennsylvania,
Texas, and Michigan all have delinquency rates below 6 percent.
40 IHS Global Insight / AAA Memorial Day 2012 Forecast
The return of household debt to more sustainable levels is essential for the recovery, as it will allow consumer spending to
gain some much-needed momentum. The decline in the delinquency rate is also important, as it signals a decline in the
foreclosure rate. Elevated rates of foreclosures are one of the main factors weighing the housing market down by keeping
home prices depressed.
Personal Income
According to the latest figures published by the Bureau of Economic Analysis (BEA), state personal income expanded 5.1
percent in 2011, an acceleration from a 3.7 percent increase in 2010. All states saw personal income rise in 2011, and all
three major components of income—earnings, property income, and transfer receipts—expanded last year.
At the national level, only the state and local government sector saw earnings fall during 2011. Among the private sectors,
the construction industry remained the weakest link; however, the 1.2 percent expansion in construction sector earnings
was a welcome improvement from the four years of consecutive drops. The decline in government earnings was the main
contributor to slower-than-average growth in Maine and Mississippi, while big drops in construction sector earnings placed
Alabama and Nevada towards the bottom of the rankings in terms of net earnings growth. The continued weakness of the
construction industry and its importance to the Nevada economy have made the Silver State the only one where personal
income levels have not yet surpassed their pre-recession peak. In terms of earnings, five states—Nevada, Arizona,
Florida, Michigan, and Oklahoma—have still not returned to their pre-recession levels.