Embed Size (px)
Citation preview

MEMORANDUM May 3, 2016 TO: Natalie Blasingame Assistant Superintendent, Interventions Office FROM: Carla Stevens Assistant Superintendent, Research and Accountability
SUBJECT: 2015 SUMMER SCHOOL EDUCATION PROGRAM Background
Each year, the Houston Independent School District (HISD) offers a summer education program designed to assist students with a variety of instructional needs. The 2015 summer education program allowed students the opportunity to repeat required courses needed for promotion, to get ahead by taking required courses before the next school year, or to receive specialized instruction on the basis of eligibility. Summer school programs in 2015 included accelerated instruction for STAAR and EOC retesters; credit accrual/recovery for students needing to graduate; remediation for secondary English-language learners (ELL); SAT/PSAT preparatory classes; and other school-based programs. The summer education program supports HISD’s Strategic Direction Core Initiative 3: Rigorous Instructional Standards and Supports.
Findings
The attached tables and figures show student enrollment and outcomes for students who attended summer school in 2015. The tables and figures are arranged in four groups:
Tables 1–12 and Figures 1–4 describe the students who were promoted or retained after spring 2015 and summer 2015.
• A total of 127,536 students were enrolled in grades 1–8 in HISD in the spring semester of 2015 (Table 1). Of these students, 77 percent were promoted on meeting promotion standards or by committee decision in the spring of 2015. This compares to 73 percent who were promoted in spring 2014 (Tables 2a and 2b).
• Of the 29,576 students in grades 1–8 who were retained after the spring of 2015, 94.4 percent (27,931 students) enrolled in summer school (Table 4). This is almost one percentage point increase from 2014, when 93.5 percent enrolled.
• Of the students in grades EE–8 who attended summer school in 2015, a total of 30,421 students (78%) attended due to promotion standards, including 30,337 Title I students (78%) and 84 non-Title I students (46%). Twenty-two percent of students (8,681), including 8,583 Title I (22%) and 98 non-Title I (54%) students, attended for campus enrichment. Ten percent attended for special education and less than one percent was enrolled for extended primary year (Tables 5a and 5b).
• Of the students in grades 1–8 who enrolled in summer school in 2015, 55 percent were promoted based on promotion standards, 34 percent were promoted based on committee decision, and 11 percent were retained based on promotion standards (Table 6a). This was an increase in retention rates from summer 2014 of 0.1 percentage points.

• Of the 127,536 students enrolled in grades 1–8 in the spring of 2015, 77 percent were
promoted based on promotion standards, 19 percent were promoted by committee decision, and four percent were retained by promotion standards either at the end of the spring semester or after summer school. In 2014, 78 percent were promoted based on promotion standards, 18 percent by committee decision, and five percent were retained based on promotion standards (Tables 7a, 7b, and Figure 3).
• Overall in 2015, 77 percent of students in grades 1–8 were promoted in the spring, and 96 percent were promoted by the end of the summer. These rates are higher than those from 2014, when 73 percent of students were promoted in the spring and 95 percent were promoted by the end of the summer (Figure 2).
• Based on valid recorded grade levels in 2014–2015 and 2015–2016, 97 percent of students in grades 1–8 during 2014–2015 returned and were promoted for the 2015–2016 school year. The promotion rates were lower for high school students with 91 percent of students in grades 9–12 promoted or graduating (Tables 9a and 9b).
• Of the students enrolled in grades 1–8 during the spring semester of 2015, 14,452 students (11%) were at least two years overage. Of these, 32 percent were LEP students and 24 percent were in special education (Table 10a).
• Of the students enrolled in grades 1–8 during the spring semester of 2015, 853 students (0.7%) were retained in 2015 and at least one year overage. Of these, 33 percent were LEP students and 21 percent were in special education (Table 11a).
• Summer school attendance was more consistent for students in grades EE–8 in 2015 than in 2014. The attendance rate was highest for students attending for extended primary year (99 percent), followed by promotion standards (94%), special education (93%), and campus enrichment (91%) (Table 12).
Table 13 describes elementary and middle school outcomes as assessed by the posttests associated with the curriculum resources.
• Of the 37,072 students in grades K–8 who attended summer school in 2015, 15,037 (41%) completed a mathematics posttest, and 12,638 (34%) completed a reading posttest. The average mathematics score was 43 percent. The average reading score was 54 percent.
• With a passing score of 70 percent, 15 percent of students passed the mathematics test, with kindergarten having the highest passing rate (54%) and second grade having the lowest (4%).
• With a passing score of 70 percent, 26 percent of students passed the reading test, with kindergarten having the highest passing rate (83%) and second grade having the lowest (9%).
Tables 14–15 describe the performance of retesters on the summer administrations of the STAAR grades 5 and 8 and STAAR End-of-Course exams.

• In 2015, 2,439 fifth-grade students and 1,808 eighth-grade students received the third administration of the STAAR reading test. Of those students, the passing rate was 19 percent for fifth-graders and 17 percent for eighth-graders. This represents a four percentage point decrease for fifth-graders and no change for eighth-graders from the third administration in 2014 (Table 14).
• On the July 2015 administration of the STAAR End-of-Course exams, the greatest number of students were administered the English I exam (N = 4,140), followed by English II (N = 3,082), Algebra I (N = 2,388), Biology (N = 1,326), and U.S. History (N = 801) (Table 15).
• The passing rates remained constant, at 27 percent, on the Algebra I exam from 2014 to 2015. Passing rates decreased by two percentage points on the Biology exam, from 36 to 34 percent, 11 percentage points on the English I exam, from 32 to 21 percent, and two percentage points on the English II exam, from 27 to 25 percent. In contrast, the passing rate on the U.S. History exam increased 19 percentage points, from 23 to 42 percent.
Tables 16–17 describe the courses enrolled in and completed by high school students.
• A total of 13,619 high school students enrolled in regular summer school in 2015. The greatest percentage of courses were “other” (non-core) courses (22%), followed by non-EOC mathematics (19%), non-EOC social studies (12%), Algebra I (9%), non-EOC science (9%), and Biology (8%) courses (Table 16a).
• In 2015, summer school completion rates (passing score of 70 or above) were the highest for “other” (non-core) courses (92%), followed by U.S. History (91%), non-EOC English and language arts (91%), non-EOC mathematics (90%), non-EOC social studies (88%), and non-EOC science (85%) courses (Table 16a).
• HISD data for online courses indicates that 1,173 online courses were completed during summer school in 2015 with at least one half credit earned, a decrease of 719 (38%) from 1,892 online courses completed in 2014.
Further distribution of this report is at your discretion. Should you have any further questions, please contact me at 713-556-6700.
cc: Andrew Houlihan
Mark Smith

RESEARCHEducational Program Report
2015 Summer school Education program
H o u s t o n I n d e p e n d e n t S c h o o l D i s t r i c t

2016 Board of Education
Manuel Rodriguez, Jr. President
Wanda Adams First Vice President
Diana DávilaSecond Vice President
Jolanda Jones Secretary
Rhonda Skillern-Jones Assistant Secretary
Anna Eastman Michael L. Lunceford Greg Meyers Harvin C. Moore
Kenneth Huewitt Interim Superintendent of Schools
Carla StevensAssistant SuperintendentDepartment of Research and Accountability
Kevin Mulqueeny, Ph.D. Research Specialist
Elizabeth Heckelman, Ph.D. Research Manager
Houston Independent School DistrictHattie Mae White Educational Support Center4400 West 18th StreetHouston, Texas 77092-8501
www.HoustonISD.org
It is the policy of the Houston Independent School District not to discriminate on the basis of age, color, handicap or disability, ancestry, national origin, marital status, race, religion, sex, veteran status, political affi liation, sexual orientation, gender identity and/or gender expression in its educational or employment programs and activities.
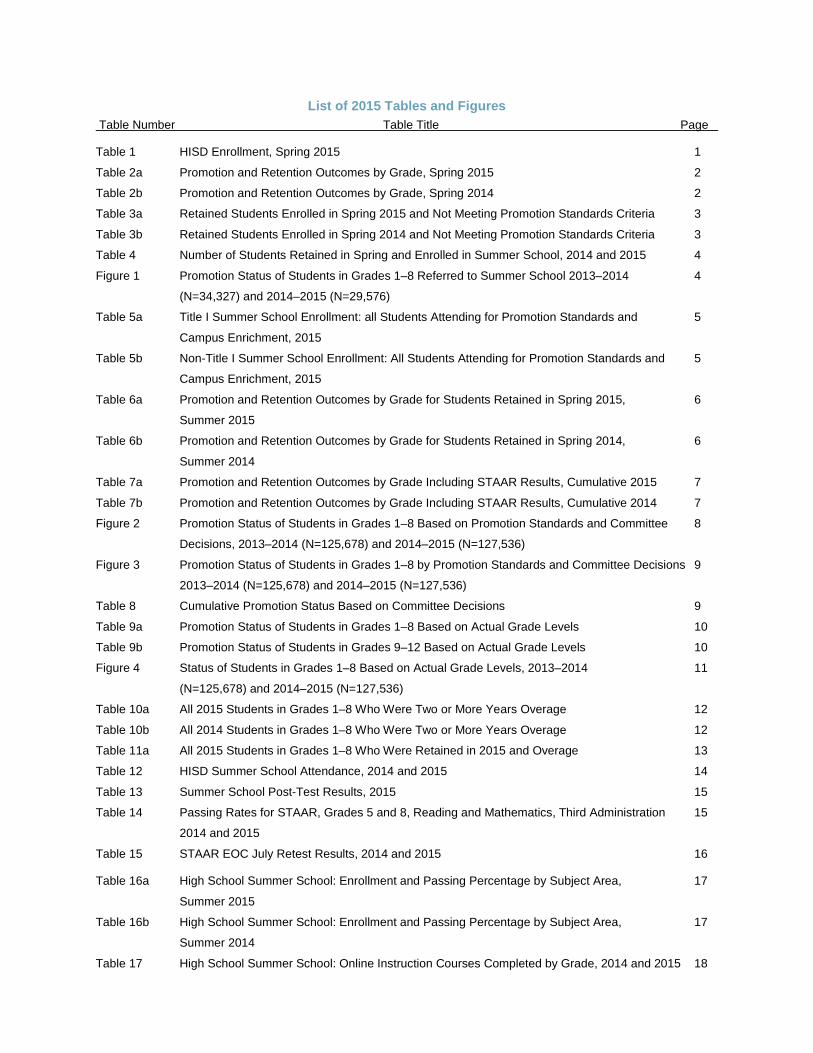
List of 2015 Tables and Figures Table Number Table Title Page
Table 1 HISD Enrollment, Spring 2015 1
Table 2a Promotion and Retention Outcomes by Grade, Spring 2015 2
Table 2b Promotion and Retention Outcomes by Grade, Spring 2014 2
Table 3a Retained Students Enrolled in Spring 2015 and Not Meeting Promotion Standards Criteria 3
Table 3b Retained Students Enrolled in Spring 2014 and Not Meeting Promotion Standards Criteria 3
Table 4 Number of Students Retained in Spring and Enrolled in Summer School, 2014 and 2015 4
Figure 1 Promotion Status of Students in Grades 1–8 Referred to Summer School 2013–2014 4
(N=34,327) and 2014–2015 (N=29,576)
Table 5a Title I Summer School Enrollment: all Students Attending for Promotion Standards and 5
Campus Enrichment, 2015
Table 5b Non-Title I Summer School Enrollment: All Students Attending for Promotion Standards and 5
Campus Enrichment, 2015
Table 6a Promotion and Retention Outcomes by Grade for Students Retained in Spring 2015, 6
Summer 2015
Table 6b Promotion and Retention Outcomes by Grade for Students Retained in Spring 2014, 6
Summer 2014
Table 7a Promotion and Retention Outcomes by Grade Including STAAR Results, Cumulative 2015 7
Table 7b Promotion and Retention Outcomes by Grade Including STAAR Results, Cumulative 2014 7
Figure 2 Promotion Status of Students in Grades 1–8 Based on Promotion Standards and Committee 8
Decisions, 2013–2014 (N=125,678) and 2014–2015 (N=127,536)
Figure 3 Promotion Status of Students in Grades 1–8 by Promotion Standards and Committee Decisions 9
2013–2014 (N=125,678) and 2014–2015 (N=127,536)
Table 8 Cumulative Promotion Status Based on Committee Decisions 9
Table 9a Promotion Status of Students in Grades 1–8 Based on Actual Grade Levels 10
Table 9b Promotion Status of Students in Grades 9–12 Based on Actual Grade Levels 10
Figure 4 Status of Students in Grades 1–8 Based on Actual Grade Levels, 2013–2014 11
(N=125,678) and 2014–2015 (N=127,536)
Table 10a All 2015 Students in Grades 1–8 Who Were Two or More Years Overage 12
Table 10b All 2014 Students in Grades 1–8 Who Were Two or More Years Overage 12
Table 11a All 2015 Students in Grades 1–8 Who Were Retained in 2015 and Overage 13
Table 12 HISD Summer School Attendance, 2014 and 2015 14
Table 13 Summer School Post-Test Results, 2015 15
Table 14 Passing Rates for STAAR, Grades 5 and 8, Reading and Mathematics, Third Administration 15
2014 and 2015
Table 15 STAAR EOC July Retest Results, 2014 and 2015 16
Table 16a High School Summer School: Enrollment and Passing Percentage by Subject Area, 17
Summer 2015
Table 16b High School Summer School: Enrollment and Passing Percentage by Subject Area, 17
Summer 2014
Table 17 High School Summer School: Online Instruction Courses Completed by Grade, 2014 and 2015 18

2015 SUMMER SCHOOL
HISD Research and Accountability__________________________________________________________________________________________________1
Table 1. HISD Enrollment, Spring 2015 2014–2015
Grade Asian/Pacific Islander African American White American Indian Hispanic Two or More Not Identified Total
N % N % N % N % N % N % N % N EE 36 4.5 169 21.2 122 15.3 2 0.3 461 57.7 9 1.1 --- --- 799 PK 329 2.3 3,631 24.9 471 3.2 13 0.1 10,026 68.9 87 0.6 --- --- 14,557 K 738 4.1 4,196 23.1 1,511 8.3 20 0.1 11,448 63.1 223 1.2 --- --- 18,136 1 792 4.2 4,452 23.5 1,445 7.6 23 0.1 11,990 63.4 219 1.2 --- --- 18,921 2 702 3.8 4,545 24.4 1,375 7.4 34 0.2 11,752 63.1 202 1.1 1 <.01 18,611 3 624 3.6 4,313 24.6 1,238 7.1 31 0.2 11,125 63.6 174 1.0 --- --- 17,505 4 568 3.3 4,317 25.4 1,215 7.1 28 0.2 10,694 62.9 181 1.1 --- --- 17,003 5 562 3.5 3,936 24.7 1,164 7.3 23 0.1 10,092 63.4 131 0.8 --- --- 15,908 6 474 3.6 3,454 26.0 991 7.4 28 0.2 8,250 62.0 106 0.8 --- --- 13,303 7 480 3.7 3,337 25.6 934 7.2 26 0.2 8,177 62.7 96 0.7 --- --- 13,050 8 482 3.6 3,422 25.9 929 7.0 22 0.2 8,286 62.6 94 0.7 --- --- 13,235 9 521 3.4 3,929 25.9 1,332 8.8 29 0.2 9,227 60.9 117 0.8 1 <.01 15,156 10 483 3.9 3,119 25.4 1,302 10.6 29 0.2 7,236 59.0 86 0.7 1 <.01 12,256 11 454 4.3 2,738 25.7 1,165 10.9 28 0.3 6,193 58.0 91 0.9 1 <.01 10,670 12 497 4.5 2,769 25.3 1,042 9.5 26 0.2 6,508 59.6 81 0.7 1 <.01 10,924
Total 7,742 3.7 52,327 24.9 16,236 7.7 362 0.2 131,465 62.6 1,897 0.9 5 <.01 210,034
Source: Chancery PSE File: November 5, 2015 and Cognos Chancery File: February 29, 2016
• A total of 210,034 students were active and enrolled in HISD in the spring of 2015. First grade had the largest number of students enrolled (N=18,921), andEarly Education had the fewest (N=799).
• The spring 2015 enrollment in grades 1–8 was 127,536 students.
• Hispanic students represented the largest ethnic group at 62.6 percent.

2015 SUMMER SCHOOL
HISD Research and Accountability__________________________________________________________________________________________________2
Table 2a. Promotion and Retention Outcomes by Grade, Spring 2015
2014–2015 Grade
Total Unduplicated N Promotion Standards Committee Decision
% Promoted % Retained % Promoted % Retained All Title I Non-Title I All Title I Non-Title I All Title I Non-Title I All Title I Non-Title I All Title I Non-Title I
1 18,921 18,174 747 81.2 80.7 95.3 13.8 14.2 2.9 4.8 5.0 1.7 0.2 0.2 --- 2 18,611 17,989 622 83.1 82.7 95.8 11.9 12.2 2.9 4.8 4.9 1.3 0.2 0.2 --- 3 17,505 16,913 592 62.7 61.8 90.4 30.0 30.9 5.1 7.0 7.1 4.6 0.3 0.3 --- 4 17,003 16,465 538 57.6 56.6 90.5 33.8 34.8 4.3 8.5 8.6 5.2 0.1 0.1 --- 5 15,908 15,818 90 70.6 70.5 90.0 18.2 18.2 7.8 11.0 11.0 * 0.2 0.2 --- 6 13,303 13,303 --- 51.6 51.6 --- 29.7 29.7 --- 17.9 17.9 --- 0.8 0.8 --- 7 13,050 13,047 * 49.7 49.7 * 29.5 29.5 * 20.0 20.0 --- 0.8 0.8 --- 8 13,235 13,234 * 54.8 54.8 * 19.6 19.6 --- 25.1 25.1 --- 0.5 0.5 ---
Total 127,536 124,943 2,593 65.4 64.9 93.1 22.8 23.2 3.9 11.4 11.6 3.1 0.3 0.4 --- Sources: Cognos Chancery File and Chancery PSE File: November 5, 2015 *Fewer than 5 students identified
Table 2b. Promotion and Retention Outcomes by Grade, Spring 2014
2013–2014 Grade
Total Unduplicated N Promotion Standards Committee Decision
% Promoted % Retained % Promoted % Retained All Title I Non-Title I All Title I Non-Title I All Title I Non-Title I All Title I Non-Title I All Title I Non-Title I
1 19,067 18,366 701 82.5 82.2 90.0 13.4 13.7 6.4 4.0 4.0 3.4 0.2 0.2 * 2 17,551 16,896 655 82.3 82.0 91.0 12.7 13.0 4.3 4.9 4.9 4.7 0.1 0.1 --- 3 17,486 16,879 610 54.8 53.9 80.7 38.8 39.7 13.9 6.1 6.1 5.4 0.3 0.3 --- 4 16,481 15,911 570 52.7 51.6 84.7 39.8 40.9 8.9 7.2 7.2 6.3 0.3 0.3 --- 5 15,618 15,134 484 72.7 72.2 88.6 21.4 21.8 7.9 5.7 5.8 3.5 0.2 0.2 --- 6 13,253 13,136 117 49.5 49.7 25.6 34.8 34.8 39.3 15.5 15.4 34.2 0.1 0.1 * 7 13,346 13,255 91 44.6 44.8 14.3 38.5 38.4 53.8 16.8 16.7 31.9 0.1 0.1 --- 8 12,876 12,794 82 57.2 57.5 17.1 22.3 22.2 37.8 20.3 20.2 43.9 0.1 0.1 *
Total 125,678 122,368 3,310 63.4 62.9 81.2 27.1 27.6 11.3 9.3 9.3 7.4 0.2 0.2 * Source: Chancery PSE File: November 17, 2014 *Fewer than 5 students identified
• At the end of spring 2015, 11.4 percent of HISD students were promoted based on committee decisions and 65.4 percent were promoted based on promotion
standards. Both were increases of two percentage points compared to 2014.
• As in 2014, in 2015 the percentage of Non-Title I students promoted by promotion standards was higher than that of Title I students.

2015 SUMMER SCHOOL
HISD Research and Accountability__________________________________________________________________________________________________3
Table 3a. Retained Students Enrolled in Spring 2015 and Not Meeting Promotion Standards Criteria
2014–2015 Grade Total High-Frequency Word Evaluation Course Grades Course Grades
Only STAAR
N % N % N % N % 1 2,635 1,374 52.1 2,179 82.7 1,109 42.1 --- --- 2 2,255 678 30.1 1,977 87.7 1,448 64.2 --- --- 3 5,300 --- --- 2,724 51.4 690 13.0 4,585 86.5 4 5,768 --- --- 2,193 38.0 407 7.1 5,338 92.5 5 2,927 --- --- 1,464 50.0 614 21.0 2,272 77.6 6 4,059 --- --- 1,099 27.1 334 8.2 3,668 90.4 7 3,965 --- --- 1,361 34.3 386 9.7 3,491 88.0 8 2,667 --- --- 1,334 50.0 778 29.2 1,652 61.9
Total 29,576 2,052 6.9 14,331 48.5 5,766 19.5 21,006 71.0
Source: Chancery PSE File: November 5, 2015 Note: The total numbers of students are unduplicated counts. However, students may be counted in multiple criteria. Note: STAAR Passing criteria was not available for math prior to summer school enrollment.
Table 3b. Retained Students Enrolled in Spring 2014 and Not Meeting Promotion Standards Criteria
2013–2014 Grade Total High-Frequency Word Evaluation Course Grades Course Grades
Only STAAR
N % N % N % N % 1 2,586 1,404 54.3 2,136 82.6 1,001 38.7 --- --- 2 2,252 733 32.5 1,931 85.7 1,346 59.8 --- --- 3 6,831 --- --- 2,590 37.9 170 2.5 6,643 97.2 4 6,604 --- --- 2,281 34.5 155 2.3 6,441 97.5 5 3,372 --- --- 1,541 45.7 409 12.1 2,921 86.6 6 4,635 --- --- 1,017 21.9 183 3.9 4,412 95.2 7 5,156 --- --- 1,204 23.4 159 3.1 4,956 96.1 8 2,891 --- --- 993 34.3 413 14.3 2,306 79.8
Total 34,327 2,137 6.2 13,693 39.9 3,836 11.2 27,679 80.6
Source: Chancery PSE File: November 17, 2014 Note: The total numbers of students are unduplicated counts. However, students may be counted in multiple criteria.
• Of the students who were retained in the spring of 2015, 48.5 percent of students were retained for not meeting course requirements. • The largest percentage of 2015 retentions for students in grades 3–8, 71.0 percent, were associated with STAAR performance, a decrease from 80.6 percent
in 2014, although mathematics results were not included in 2015 due to scores being unavailable from the state.
2015 SUMMER SCHOOL
HISD Research and Accountability__________________________________________________________________________________________________4
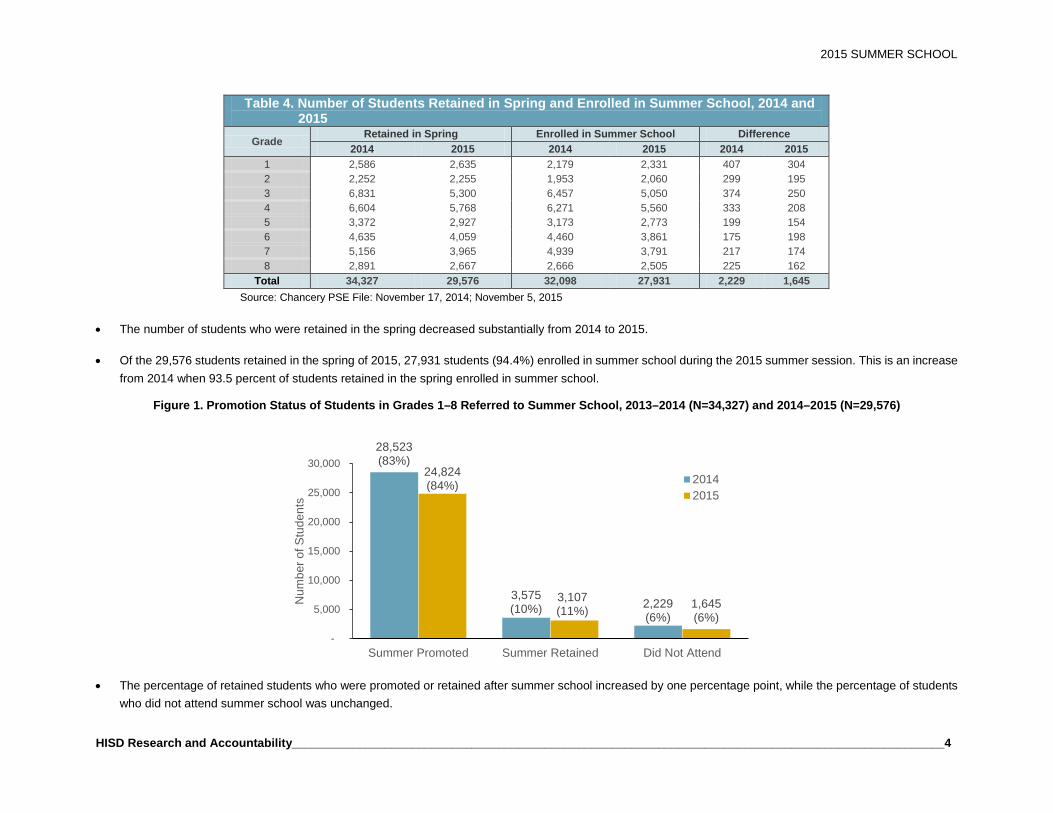
Table 4. Number of Students Retained in Spring and Enrolled in Summer School, 2014 and 2015
Grade Retained in Spring Enrolled in Summer School Difference
2014 2015 2014 2015 2014 2015 1 2,586 2,635 2,179 2,331 407 304 2 2,252 2,255 1,953 2,060 299 195 3 6,831 5,300 6,457 5,050 374 250 4 6,604 5,768 6,271 5,560 333 208 5 3,372 2,927 3,173 2,773 199 154 6 4,635 4,059 4,460 3,861 175 198 7 5,156 3,965 4,939 3,791 217 174 8 2,891 2,667 2,666 2,505 225 162
Total 34,327 29,576 32,098 27,931 2,229 1,645 Source: Chancery PSE File: November 17, 2014; November 5, 2015
• The number of students who were retained in the spring decreased substantially from 2014 to 2015.
• Of the 29,576 students retained in the spring of 2015, 27,931 students (94.4%) enrolled in summer school during the 2015 summer session. This is an increase from 2014 when 93.5 percent of students retained in the spring enrolled in summer school.
Figure 1. Promotion Status of Students in Grades 1–8 Referred to Summer School, 2013–2014 (N=34,327) and 2014–2015 (N=29,576)
• The percentage of retained students who were promoted or retained after summer school increased by one percentage point, while the percentage of students who did not attend summer school was unchanged.
28,523 (83%)
3,575 (10%) 2,229
(6%)
24,824 (84%)
3,107 (11%) 1,645
(6%)
-
5,000
10,000
15,000
20,000
25,000
30,000
Summer Promoted Summer Retained Did Not Attend
Num
ber o
f Stu
dent
s
20142015

2015 SUMMER SCHOOL
HISD Research and Accountability__________________________________________________________________________________________________5
Table 5a. Title I Summer School Enrollment: All Students Attending for Promotion Standards and Campus Enrichment, 2015 2014–2015 Grade Total Promotion Standards Campus Enrichment Extended Primary Year Special Education
N % N % N % N % EE 34 --- --- 32 94.1 * * 34 100.0 PK 1,830 * * 1,826 99.8 * * 90 4.9 KG 2,460 61 2.5 2,396 97.4 * * 136 5.5 1 3,649 2,553 70.0 1,093 30.0 * * 384 10.5 2 3,718 2,407 64.7 1,309 35.2 * * 382 10.3 3 6,004 5,237 87.2 765 12.7 * * 551 9.2 4 6,387 5,732 89.7 653 10.2 * * 614 9.6 5 3,579 3,351 93.6 228 6.4 --- --- 411 11.5 6 4,179 4,090 97.9 89 2.1 --- --- 454 10.9 7 4,164 4,051 97.3 113 2.7 --- --- 488 11.7 8 2,932 2,853 97.3 79 2.7 --- --- 328 11.2
Total 38,936 30,337 77.9 8,583 22.0 16 0.04 3,872 9.9
Table 5b. Non-Title I Summer School Enrollment: All Students Attending for Promotion Standards and Campus Enrichment, 2015 2014–2015 Grade Total Promotion Standards Campus Enrichment Extended Primary Year Special Education
N % N % N % N % EE 1 --- --- * * --- --- * * PK 8 --- --- 8 100.0 --- --- --- --- KG 41 --- --- 41 100.0 --- --- * * 1 29 19 65.5 10 34.5 --- --- * * 2 26 15 57.7 11 42.3 --- --- 6 23.1 3 41 29 70.7 12 29.3 --- --- * * 4 33 18 54.5 15 45.5 --- --- * * 5 2 * * --- --- --- --- --- --- 6 0 --- --- --- --- --- --- --- --- 7 1 * * --- --- --- --- --- --- 8 0 --- --- --- --- --- --- --- ---
Total 182 84 46.2 98 53.8 --- --- 16 8.8 Sources: Chancery PSE File and Cognos Chancery File: November 5, 2015 Notes: The total numbers of students are unduplicated counts. However, students may be counted in multiple criteria. Students who attended special education classes, in addition to any other
reason, were included under Special Education. *Fewer than 5 students identified
• The highest percentage of Title I students attending summer school due to promotion standards was from grade six (97.9%), and the highest percentage of Non-Title I students attending summer school due to promotion standards was from grade three (70.7%).
• The highest percentage of Title I students attending summer school for campus enrichment was from prekindergarten (99.8%), and for Non-Title I students the
highest percentage was for prekindergarten and kindergarten (100%).

2015 SUMMER SCHOOL
HISD Research and Accountability__________________________________________________________________________________________________6
Table 6a. Promotion and Retention Outcomes by Grade for Students Retained in Spring 2015, Summer 2015 (STAAR Retest Required for Grades 5 and 8 in Reading)
2014–2015 Grade
Total Unduplicated N Promotion Standards Committee Decision
% Promoted % Retained % Promoted % Retained All Title I Non-Title I All Title I Non-Title I All Title I Non-Title I All Title I Non-Title I All Title I Non-Title I
1 2,318 2,299 19 45.7 45.6 57.9 31.8 31.9 * 22.5 22.4 31.6 --- --- --- 2 2,048 2,033 15 50.5 50.4 60.0 25.0 25.1 * 24.5 24.4 * --- --- --- 3 5,023 4,994 29 54.8 54.9 34.5 10.5 10.5 20.7 34.7 34.6 44.8 --- --- --- 4 5,525 5,507 18 61.1 61.2 50.0 5.5 5.5 * 33.3 33.3 44.4 --- --- --- 5 2,772 2,770 * 36.0 36.0 --- 15.5 15.5 * 48.4 48.4 * --- --- --- 6 3,866 3,866 --- 69.2 69.2 --- 4.3 4.3 --- 26.5 26.5 --- --- --- --- 7 3,810 3,809 * 67.7 67.7 * 4.0 4.0 --- 28.3 28.3 --- --- --- --- 8 2,538 2,538 --- 37.4 37.4 --- 11.5 11.5 --- 50.9 50.9 --- --- --- ---
Total 27,900 27,816 84 55.3 55.3 47.6 11.2 11.2 14.3 33.5 33.5 38.1 --- --- --- Source: Chancery PSE File and Cognos Chancery File: November 5, 2015 *Fewer than 5 students identified
Note: Total unduplicated numbers include only students for whom final outcomes are documented; 31 students had missing outcomes
Table 6b. Promotion and Retention Outcomes by Grade for Students Retained in Spring 2014, Summer 2014 (STAAR Retest Required for Grades 5 and 8 in Reading and Math)
2013–2014 Grade
Total Unduplicated N Promotion Standards Committee Decision
% Promoted % Retained % Promoted % Retained All Title I Non-Title I All Title I Non-Title I All Title I Non-Title I All Title I Non-Title I All Title I Non-Title I
1 2,179 2,146 33 41.9 42.0 39.4 33.5 33.4 42.4 24.5 24.6 18.2 * * --- 2 1,953 1,932 21 47.2 47.1 52.4 22.6 22.7 * 30.2 30.2 28.6 * * --- 3 6,457 6,380 77 56.7 56.8 44.2 9.0 9.0 9.1 34.3 34.1 46.8 * * --- 4 6,271 6,230 41 58.5 58.6 39.0 6.0 6.0 * 35.4 35.3 51.2 * * --- 5 3,172 3,138 34 23.7 23.8 14.7 16.0 16.0 * 60.3 60.1 76.5 * * --- 6 4,460 4,419 41 72.3 72.4 63.4 5.4 5.4 * 22.2 22.1 29.3 * * --- 7 4,939 4,894 45 75.0 75.0 71.1 5.2 5.2 * 19.8 19.7 22.2 * * --- 8 2,666 2,638 28 38.8 38.7 42.9 15.8 15.7 25.0 45.4 45.5 32.1 * * ---
Total 32,097 31,777 320 55.7 55.8 46.6 11.1 11.1 14.1 33.2 33.1 39.4 <0.1 <0.1 --- Source: Chancery PSE File: November 17, 2014 *Fewer than 5 students identified • At the end of summer 2015, 33.5 percent of students enrolled in summer school were promoted based on committee decisions, and 55.3 percent were promoted
based on promotion standards. • In the summer of 2015, students in grades five and eight took the third administration of the Reading STAAR if they failed the previous two administrations and
were required to pass it to be promoted without a committee decision. Mathematics STAAR retests were not administered in 2015 because passing scores were not determined by the state until late in the summer.

2015 SUMMER SCHOOL
HISD Research and Accountability__________________________________________________________________________________________________7
Table 7a. Promotion and Retention Outcomes by Grade Including STAAR Results, Cumulative 2015
2014–2015 Grade
Total Unduplicated N Promotion Standards Committee Decision
% Promoted % Retained % Promoted % Retained All Title I Non-Title I All Title I Non-Title I All Title I Non-Title I All Title I Non-Title I All Title I Non-Title I
1 18,921 18,174 747 86.6 86.1 97.1 5.5 5.7 0.9 7.9 8.1 2.7 0.05 0.05 --- 2 18,611 17,989 622 88.4 88.1 97.4 3.8 3.9 1.0 7.8 8.0 1.9 0.04 0.04 --- 3 17,505 16,913 592 78.3 77.8 92.2 4.5 4.7 1.2 17.1 17.4 6.8 0.1 0.1 --- 4 17,003 16,465 538 77.4 76.9 92.4 3.2 3.3 1.1 19.4 19.8 6.7 * * --- 5 15,908 15,818 90 76.1 76.0 90.0 3.6 3.6 6.7 20.2 20.3 * 0.1 0.1 --- 6 13,303 13,303 --- 71.7 71.7 --- 2.6 2.6 --- 25.6 25.6 --- 0.1 0.1 --- 7 13,050 13,047 * 69.2 69.2 * 2.4 2.3 * 28.3 28.3 --- 0.1 0.1 --- 8 13,235 13,234 * 61.5 61.5 * 3.2 3.2 --- 35.1 35.1 --- 0.2 0.2 ---
Total 127,536 124,943 2,593 77.2 76.9 94.8 3.7 3.8 1.3 19.0 19.3 4.3 0.1 0.1 --- Source: Chancery PSE File and Cognos Chancery File: November 5, 2015 *Fewer than 5 students identified
Table 7b. Promotion and Retention Outcomes by Grade Including STAAR Results, Cumulative 2014
2014–2015 Grade
Total Unduplicated N Promotion Standards Committee Decision
% Promoted % Retained % Promoted % Retained All Title I Non-Title I All Title I Non-Title I All Title I Non-Title I All Title I Non-Title I All Title I Non-Title I
1 19,067 18,366 701 87.3 87.1 91.9 6.0 6.0 3.9 6.8 6.9 4.3 * * --- 2 17,551 16,896 655 87.6 87.4 92.7 4.2 4.3 1.7 8.2 8.3 5.6 * * --- 3 17,486 16,876 610 75.7 75.4 86.2 5.5 5.6 2.5 18.8 19.1 11.3 * * --- 4 16,481 15,911 570 75.0 74.5 87.5 4.3 4.4 2.5 20.7 21.1 10.0 * * --- 5 15,618 15,134 484 77.5 77.1 89.7 4.5 4.6 1.4 18.0 18.3 8.9 * * --- 6 13,253 13,136 117 73.8 74.1 47.9 3.1 3.1 7.7 23.0 22.8 44.4 <0.1 <0.1 --- 7 13,346 13,255 91 72.3 72.5 49.5 3.6 3.5 7.7 24.1 24.0 42.9 * * --- 8 12,876 12,794 82 65.3 65.5 31.7 5.0 4.9 13.4 29.7 29.6 54.9 * * ---
Total 125,678 122,368 3,310 77.6 77.4 85.7 4.6 4.6 3.1 17.8 17.9 11.2 <0.1 <0.1 --- Source: Chancery PSE File: November 17, 2014 *Fewer than 5 students identified • Overall, the cumulative promotion rate based on committee decisions increased from 17.8 percent in 2014 to 19.0 percent in 2015. The promotion rate based
on promotion standards decreased from 77.6 percent in 2014 to 77.2 percent in 2015.
• The percentage of Title I students promoted by committee decisions increased from 17.9 percent in 2014 to 19.3 percent in 2015, while the percentage of Non-Title I students promoted by committee decision decreased from 11.2 percent in 2014 to 4.3 percent in 2015.
• The percentage of Title I students promoted due to promotion standards decreased from 77.4 percent in 2014 to 76.9 percent in 2015, while the percentage of
Non-Title I students promoted based on promotion standards increased from 85.7 percent in 2014 to 94.8 percent in 2015.

2015 SUMMER SCHOOL
HISD Research and Accountability__________________________________________________________________________________________________8
Figure 2. Promotion Status of Students in Grades 1–8 Based on Promotion Standards and Committee Decisions, 2013–2014 (N=125,678) and 2014–2015 (N=127,536)
• Overall, the percentage of students promoted increased from 95 percent in 2014 to 96 percent in 2015.
• From 2014 to 2015, the percentage of students promoted in the spring increased from 73 to 77 percent, while the percentage promoted in the summer remained the same, at 89 percent.
91,352 (73%)
97,973 (77%)
28,522 (89%)
24,775 (89%)
119,874 (95%)
122,691 (96%)
34,326 (27%)
29,563 (23%)
3,575 (11%)
3,125 (11%)
5,804 (5%)
4,845 (4%)
0
20,000
40,000
60,000
80,000
100,000
120,000
140,000
2014 2015 2014 2015 2014 2015
Spring Summer Total
Num
ber o
f Stu
dent
s
Promoted Retained
2015 SUMMER SCHOOL
HISD Research and Accountability__________________________________________________________________________________________________9
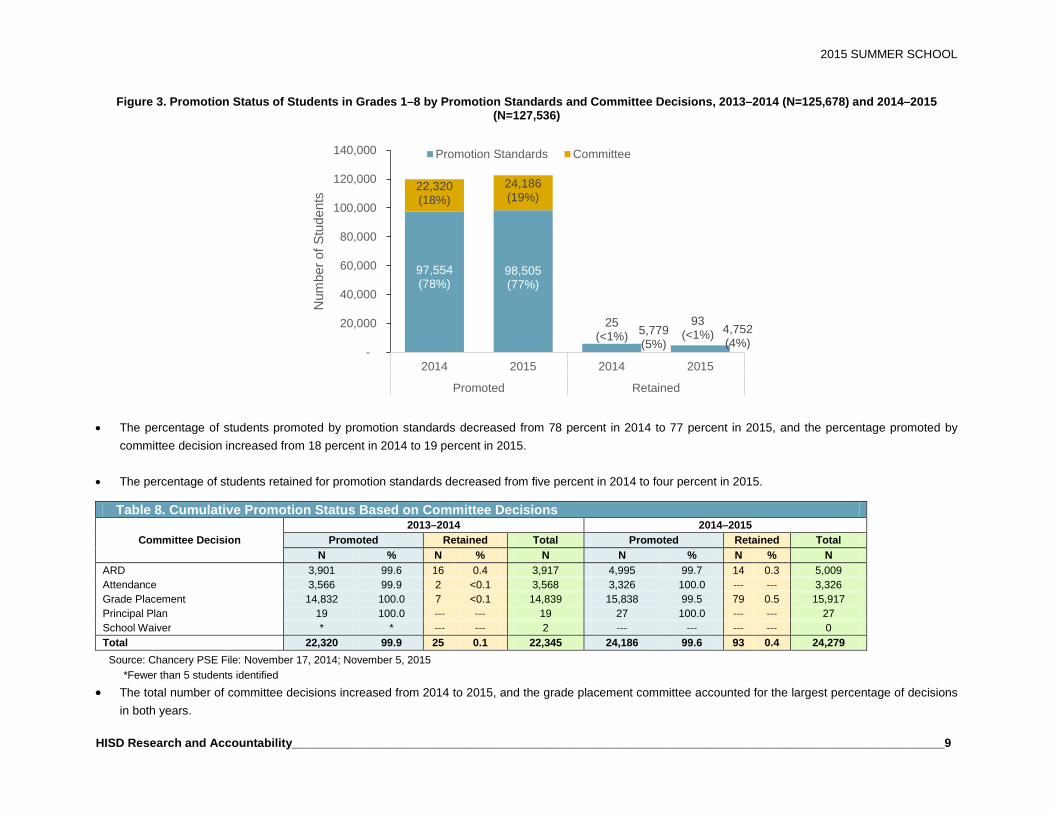
Figure 3. Promotion Status of Students in Grades 1–8 by Promotion Standards and Committee Decisions, 2013–2014 (N=125,678) and 2014–2015 (N=127,536)
• The percentage of students promoted by promotion standards decreased from 78 percent in 2014 to 77 percent in 2015, and the percentage promoted by committee decision increased from 18 percent in 2014 to 19 percent in 2015.
• The percentage of students retained for promotion standards decreased from five percent in 2014 to four percent in 2015.
Table 8. Cumulative Promotion Status Based on Committee Decisions
Committee Decision 2013–2014 2014–2015
Promoted Retained Total Promoted Retained Total N % N % N N % N % N
ARD 3,901 99.6 16 0.4 3,917 4,995 99.7 14 0.3 5,009 Attendance 3,566 99.9 2 <0.1 3,568 3,326 100.0 --- --- 3,326 Grade Placement 14,832 100.0 7 <0.1 14,839 15,838 99.5 79 0.5 15,917 Principal Plan 19 100.0 --- --- 19 27 100.0 --- --- 27 School Waiver * * --- --- 2 --- --- --- --- 0 Total 22,320 99.9 25 0.1 22,345 24,186 99.6 93 0.4 24,279 Source: Chancery PSE File: November 17, 2014; November 5, 2015 *Fewer than 5 students identified • The total number of committee decisions increased from 2014 to 2015, and the grade placement committee accounted for the largest percentage of decisions
in both years.
97,554 (78%)
98,505 (77%)
5,779 (5%)
4,752 (4%)
22,320 (18%)
24,186 (19%)
25 (<1%)
93 (<1%)
-
20,000
40,000
60,000
80,000
100,000
120,000
140,000
2014 2015 2014 2015
Promoted Retained
Num
ber o
f Stu
dent
s
Promotion Standards Committee

2015 SUMMER SCHOOL
HISD Research and Accountability__________________________________________________________________________________________________10
Table 9a. Promotion Status of Students in Grades 1–8 Based on Actual Grade Levels
Grade 2013–2014 Returning 2014–2015 2014–2015 Returning 2015–2016
Total Promoted Retained Total Promoted Retained N N % N % N N % N %
1 18,141 17,199 94.8 942 5.2 18,108 17,150 94.7 958 5.3 2 16,713 16,115 96.4 598 3.6 17,820 17,175 96.4 645 3.6 3 16,751 16,098 96.1 653 3.9 16,938 16,270 96.1 668 3.9 4 15,772 15,324 97.2 448 2.8 16,380 15,983 97.6 397 2.4 5 12,814 12,439 97.1 375 2.9 12,806 12,556 98.0 250 2.0 6 12,917 12,605 97.6 312 2.4 12,902 12,634 97.9 268 2.1 7 13,793 13,404 97.2 389 2.8 13,127 12,820 97.7 307 2.3 8 12,065 11,822 98.0 243 2.0 12,328 12,126 98.4 202 1.6
Total 118,966 115,006 96.7 3,960 3.3 120,409 116,714 96.9 3,695 3.1 Source: Chancery PSE File: November 17, 2014; Cognos Chancery File: November 5, 2015 Notes: Only students in grades 1–8 in 2014–2015 and who had a valid grade level for 2015–2016 were included in these calculations.
• Of students who were enrolled in spring 2014 and returned for the 2015–2016 school year, 96.9 percent were promoted and 3.1 percent were retained.
Table 9b. Promotion Status of Students in Grades 9–12 Based on Actual Grade Levels
Grade 2013–2014 Returning 2014–2015 2014–2015 Returning 2015–2016
Total Promoted Retained Total Promoted Retained N N % N % N N % N %
9 12,761 10,851 85.0 1910 15.0 12,980 11,065 85.2 1,915 14.8 10 10,803 9,956 92.2 847 7.8 10,741 9,898 92.2 843 7.8 11 9,567 8,965 93.7 602 6.3 9,718 9,203 94.7 515 5.3 12 10,880 10,120 93.0 760 7.0 10,247 9,374 91.5 873 8.5
Total 44,011 39,892 90.6 4,119 9.4 43,686 39,540 90.5 4,146 9.5 Source: PEIMS Fall Snapshot 2014–2015; Cognos Chancery File: January 8, 2016 Note: Includes high school graduates. Students who did not return, but did not graduate, were excluded.
• From 2013–2014 to 2014–2015, the promotion rate remained constant for 10th grade, increased for ninth and 11th grade, and decreased for 12th grade.

2015 SUMMER SCHOOL
HISD Research and Accountability__________________________________________________________________________________________________11
Figure 4. Status of Students in Grades 1–8 Based on Actual Grade Levels, 2013–2014 (N=125,678) and 2014–2015 (N=127,536)
• Based on actual fall 2015 grade levels, the percentage of students promoted and retained remained constant from 2014 to 2015, at 92 and three percent respectively.
• The percentage of students who did not return increased from five percent in 2014 to six percent in 2015.
115,006 (92%)
3,960 (3%)
6,712 (5%)
116,714 (92%)
3,695 (3%)
7,127 (6%)
0
20,000
40,000
60,000
80,000
100,000
120,000
140,000
Promoted Retained Did Not Return
Num
ber o
f Stu
dent
s
2014 2015

2015 SUMMER SCHOOL
HISD Research and Accountability__________________________________________________________________________________________________12
Table 10a. All 2015 Students in Grades 1–8 Who Were Two or More Years Overage
Spring 2015 Grade
Total 2 or More Years
Overage
American Indian
Asian / Pacific
Islander African
American Hispanic White Other LEP (N) LEP (%) Special
Education (N)
Special Education
(%)
1 850 3 17 267 509 48 6 325 38.2 190 22.4 2 1,298 --- 13 420 782 77 6 522 40.2 283 21.8 3 1,750 6 30 574 1,077 60 3 728 41.6 419 23.9 4 2,045 4 22 714 1,224 69 12 745 36.4 524 25.6 5 2,026 2 23 674 1,231 87 9 632 31.2 509 25.1 6 1,910 6 23 712 1,088 75 6 484 25.3 501 26.2 7 2,159 6 24 724 1,306 85 14 554 25.7 523 24.2 8 2,414 4 25 728 1,541 109 7 582 24.1 549 22.7
Total Overage 14,452 31 177 4,813 8,758 610 63 4,572 31.6 3,498 24.2 Total Enrolled 127,536 215 4,684 31,776 80,366 9,291 1,204 38,347 30.1 11,155 8.7
% Overage 11.3 14.4 3.8 15.1 10.9 6.6 5.2 11.9 31.4 Source: Cognos Chancery Extract: March 3, 2016
Table 10b. All 2014 Students in Grades 1–8 Who Were Two or More Years Overage
Spring 2014 Grade
Total 2 or More Years
Overage
American Indian
Asian / Pacific
Islander African
American Hispanic White Other LEP (N) LEP (%) Special
Education (N)
Special Education
(%)
1 810 1 11 265 460 67 6 282 34.8 216 26.7 2 1,201 6 19 407 716 49 4 460 38.3 357 29.7 3 1,770 3 20 607 1,056 75 9 617 34.9 484 27.3 4 1,946 1 22 665 1,175 74 9 582 29.9 544 28.0 5 1,939 3 24 680 1,145 83 4 487 25.1 540 27.8 6 2,177 4 26 741 1,304 94 8 510 23.4 563 25.9 7 2,443 2 22 809 1,510 95 5 509 20.8 565 23.1 8 2,351 4 35 687 1,498 112 15 465 19.8 536 22.8
Total Overage 14,637 24 179 4,861 8,864 649 60 3,912 26.7 3,805 26.0 Total Enrolled 125,678 227 4,417 31,591 79,039 9,349 1,055 42,608 33.9 10,662 8.5
% Overage 11.6 10.6 4.1 15.4 11.2 6.9 5.7 9.2 35.7 Source: Cognos Chancery Extract: March 2, 2016
Note: Students were included if they were two or more years overage for their grade level
• Among the students enrolled in grades 1–8 during the spring semester of 2015, 11.3 percent were two or more years overage. This is a decrease from 2014 when 11.6 percent were two or more years overage.
• Of the 14,452 students who were two or more years overage in 2015, 31.6 percent were LEP students and 24.2 percent were in special education.

2015 SUMMER SCHOOL
HISD Research and Accountability__________________________________________________________________________________________________13
Table 11. All 2015 Students in Grades 1–8 who were Retained in 2015 and Overage
Spring 2015 Grade
Total Retained 2
or More Times
American Indian
Asian / Pacific
Islander African
American Hispanic White Other LEP (N) LEP (%) Special Education (N)
Special Education (%)
1 41 1 --- 12 26 2 --- 12 29.3 6 14.6 2 68 --- 1 28 35 4 --- 26 38.2 15 22.1 3 86 1 --- 44 40 1 --- 28 32.6 19 22.1 4 90 --- --- 37 50 2 1 28 31.1 14 15.6 5 137 --- --- 50 86 --- 1 65 47.4 20 14.6 6 144 1 --- 73 66 2 2 33 22.9 30 20.8 7 123 --- --- 55 62 4 2 24 19.5 20 16.3 8 164 --- --- 59 100 5 --- 61 37.2 52 31.7
Total Retained 853 3 1 358 465 20 6 277 32.5 176 20.6 Total Enrolled 127,536 215 4,684 31,776 80,366 9,291 1,204 38,347 30.1 11,155 8.7
% Retained 0.7 1.4 <0.1 1.1 0.6 0.2 0.5 0.7 1.6 Source: Cognos Chancery Extract: March 3, 2016 Note: Students were included if they were retained in the spring or summer of 2015 and at least one year overage for their grade level. Comparable data was not available for 2014.
• Of the students enrolled in grades 1–8 during the spring semester of 2015, 0.7 percent were retained in 2015 and overage.
• Of the 853 students who were retained in 2015 and at least one year overage, 32.5 percent were LEP students and 20.6 percent were in special education.

2015 SUMMER SCHOOL
HISD Research and Accountability__________________________________________________________________________________________________14
Table 12. HISD Summer School Attendance, 2014 and 2015
2014–2015 Grade Promotion Standards
Campus Enrichment
Extended Primary Year Special Education
2014 2015 2014 2015 2014 2015 2014 2015 EE --- --- --- 88.7 --- 100.0 --- 90.6 PK --- 100.0 --- 90.1 --- 97.7 --- 91.5 KG --- 95.5 --- 91.1 --- 100.0 --- 91.9 1 90.3 91.9 89.6 90.8 87.2 --- 92.8 92.0 2 92.4 92.8 90.6 90.1 84.3 --- 85.8 91.8 3 94.8 95.5 90.2 91.2 88.2 95.5 88.7 93.6 4 95.8 95.7 90.3 91.2 --- --- 87.9 96.6 5 95.0 95.3 93.5 87.7 --- --- 82.7 93.2 6 93.6 94.3 96.8 97.0 100.0 --- 88.2 94.2 7 93.2 93.9 95.4 96.1 100.0 --- 93.8 92.5 8 91.2 92.9 88.1 96.7 89.4 --- 91.6 93.9
Total 93.9 94.4 90.8 90.8 86.7 98.5 88.5 93.0 Source: Chancery PSE: November 5, 2015
• In 2015, students who attended summer school for promotion standards had a higher attendance rate (94.4%) compared to students who attended for campus enrichment (90.8%).
• Attendance rates increased from 2014 to 2015 for students who attended for promotion standards (93.9% to 94.4%), extended primary year (86.7% to 98.5%), and special education (88.5% to 93.0%).

2015 SUMMER SCHOOL
HISD Research and Accountability__________________________________________________________________________________________________15
Table 13. Summer School Post-Test Results, 2015 Grade
Mathematics Reading N Average % % Passing N Average % % Passing
KG 1,566 67.3 54.0 1,658 83.4 83.2 1 1,383 56.2 27.6 1,765 52.5 22.8 2 1,350 35.6 4.3 1,663 41.8 8.8 3 2,363 40.9 8.3 3,062 50.5 19.7 4 2,352 40.0 8.3 3,322 48.6 14.8 5 1,069 35.0 4.9 1,168 51.9 22.9 6 1,911 37.9 8.5 --- --- --- 7 1,955 34.0 6.3 --- --- --- 8 1,088 43.0 18.5 --- --- ---
Total 15,037 42.9 14.7 12,638 53.6 26.0 Source: EdPlan: January 7, 2016 Note: A passing score was 70 percent or higher.
• In 2015, students were not given a pretest at the beginning of summer school. 15,037 students in grades K–8 completed the mathematics posttest and 12,638 students in grades K–5 completed the reading posttest.
• Kindergarten students had the highest average score on both the mathematics test (67.3%) and reading test (83.4%), as well as the highest passing rates (54.0% mathematics, 83.2% reading).
Table 14. Passing Rates for STAAR, Grades 5 and 8, Reading and Mathematics, Third Administration 2014 and 2015
Grade 2014 2015
N Tested % Met Standard N Tested % Met Standard Reading Mathematics Reading Mathematics Reading Mathematics Reading Mathematics
5 2,857 2,120 23 25 2,439 --- 19 --- 8 1,760 1,586 17 21 1,808 --- 17 ---
Source: STAAR 3–8: December 8, 2015; 2014 July District & School Read/Math Results of SSI 5&8 Grd STAAR: Third Admin
Note: Mathematics passing scores were not provided in 2015, and retests were not offered.
• The percentage passing in fifth grade on the third administration of the reading STAAR decreased four percentage points from 2014 to 2015.
• The passing rate in eighth grade on the third administration of the reading STAAR stayed consistent at 17 percent from 2014 to 2015.

2015 SUMMER SCHOOL
HISD Research and Accountability__________________________________________________________________________________________________16
Table 15. STAAR EOC July Retest Results, 2014 and 2015
Subject 2014 2015
N Tested % Met Standard N Tested % Met Standard Algebra I 1,725 27 2,388 27 Biology 869 36 1,326 34 English I 4,168 32 4,140 21 English II 3,007 27 3,082 25
U.S. History 516 23 801 42 Source: 2014 July End-of-Course Performance of All Students Who Took the July Retest; CognosSTAAR
End-of-Course: December 8, 2015
• On the July administration of the STAAR EOC exams, the passing rate on Algebra I remained constant at 27 percent from 2014 to 2015. The passing rate decreased by two points on the Biology exam, 11 points on the English I exam, and two points on the English II exam. The passing rate increased 19 percentage points on the U.S. History exam from 2014 to 2015.

2015 SUMMER SCHOOL
HISD Research and Accountability__________________________________________________________________________________________________17
• The total number of high school students enrolled in HISD summer school increased from 9,327 (20.0%) in 2014 to 13,619 (27.8%) in 2015. • In 2015, students were enrolled in an average of 1.7 courses per student, a decrease from the 2014 rate of 2.4 courses per student. • Within the "other" category, the majority of courses primarily consisted of STAAR review courses and college skill-building courses. • In 2015, summer school completion rates (passing score of 70 or above) were the highest for “other” (non-core) courses (91.6%), followed by U.S. History
(91.1%), and Non-EOC English and Language Arts courses (90.7%). The lowest passing rates were for Biology classes (77.5%) and Algebra I (77.6%). • The course passing rates ranged from 77.5 percent to 91.6 percent in summer 2015, which was a larger range compared to between 83.0 and 90.0 percent in
2014.
Summer Students
NN
Enroll%
PassN
Enroll%
PassN
Enroll%
PassN
Enroll%
PassN
Enroll%
PassN
Enroll%
PassN
Enroll%
PassN
Enroll%
PassN
Enroll%
PassN
Enroll%
PassN
Enroll%
Pass9 3,986 1,572 81.7 218 64.2 83 94.0 1,702 77.0 1,316 85.6 1,674 76.6 311 81.0 6 100.0 1,101 85.3 2,068 89.8 10,051 82.3
10 3,614 117 80.3 739 83.6 240 88.8 208 78.4 1,538 92.4 155 80.0 833 85.6 77 85.7 955 89.1 1,429 91.5 6,291 88.6
11 3,074 47 89.4 67 91.0 841 92.9 55 90.9 1,174 92.3 63 95.2 702 86.2 525 91.4 538 92.0 1,249 93.6 5,261 91.8
12 2,945 3 100.0 12 100.0 355 86.2 12 91.7 151 91.4 --- --- 123 90.2 19 100.0 72 88.9 241 97.5 988 91.0
Total 13,619 1,739 81.9 1,036 80.2 1,519 90.7 1,977 77.6 4,179 90.2 1,892 77.5 1,969 85.4 627 91.1 2,666 88.1 4,987 91.6 22,591 86.6
Summer Students
NN
Enroll%
PassN
Enroll%
PassN
Enroll%
PassN
Enroll%
PassN
Enroll%
PassN
Enroll%
PassN
Enroll%
PassN
Enroll%
PassN
Enroll%
PassN
Enroll%
PassN
Enroll%
Pass9 3,859 1,218 83.3 211 81.9 288 97.1 1,874 85.0 663 89.0 1,527 82.9 207 83.4 14 85.7 1,158 84.1 1,872 83.5 9,032 84.6
10 2,894 164 89.7 803 90.0 254 83.7 203 81.2 1,546 91.4 221 84.5 1,255 85.1 151 88.6 821 93.0 1,242 83.7 6,660 87.9
11 2,065 46 82.2 180 93.3 574 88.9 93 94.3 1,122 91.4 91 90.0 766 88.2 438 90.1 448 96.0 806 86.8 4,564 90.1
12 509 7 100.0 10 88.9 439 74.1 11 90.0 266 73.9 55 67.0 184 74.0 31 93.5 251 61.7 413 69.4 1667 71.5
Total 9,327 1,435 84.1 1,204 88.9 1,555 85.4 2,181 85.1 3,597 90 1,894 83 2,412 85.1 634 89.8 2,678 86.8 4,333 83.1 21,923 85.8
Total Courses
Total Courses
Bio Non-EOC Science
US History Non-EOC Social
Other
Source: Chancery: September 24, 2014
GradeEng I Eng II Non-EOC ELA Alg I Non-EOC
Math
US History Non-EOC Social
Other
Source: Chancery: September 17, 2015
Table 16b. High School Summer School: Enrollment and Passing Percentage by Subject Area, Summer 2014
Table 16a. High School Summer School: Enrollment and Passing Percentage by Subject Area, Summer 2015
GradeEng I Eng II Non-EOC ELA Alg I Non-EOC
MathBio Non-EOC
Science
2015 SUMMER SCHOOL
HISD Research and Accountability__________________________________________________________________________________________________18
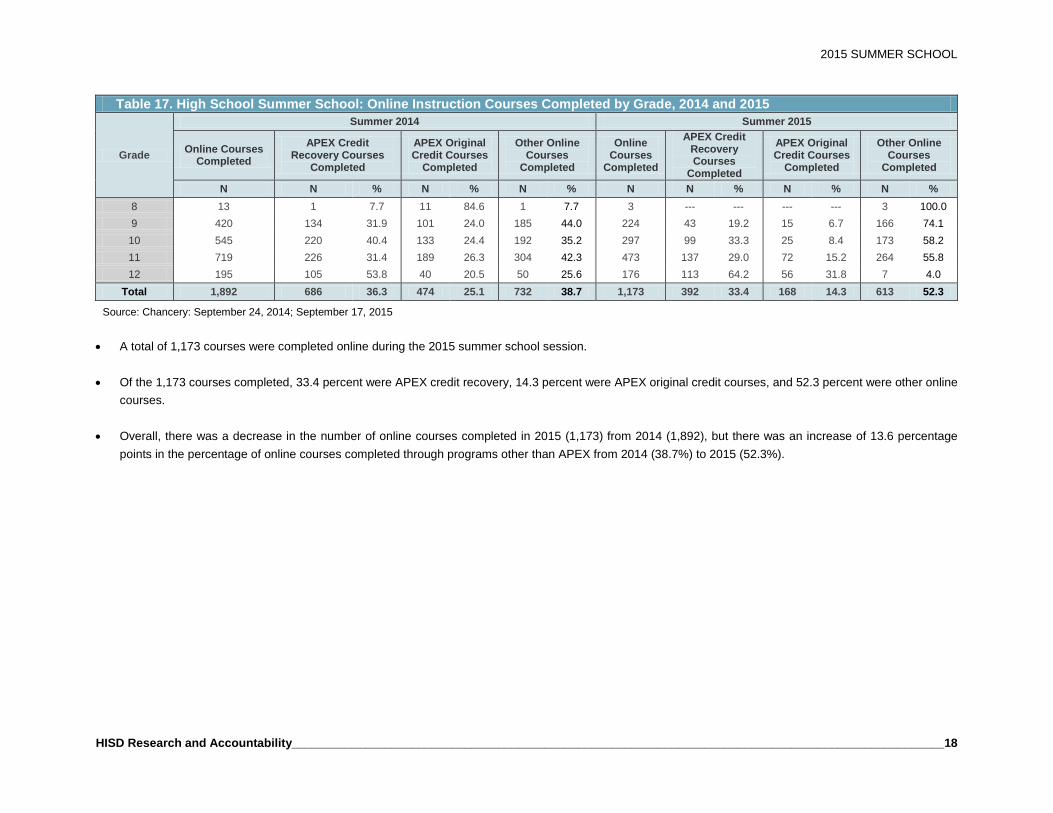
Table 17. High School Summer School: Online Instruction Courses Completed by Grade, 2014 and 2015
Grade
Summer 2014 Summer 2015
Online Courses Completed
APEX Credit Recovery Courses
Completed
APEX Original Credit Courses
Completed
Other Online Courses
Completed
Online Courses
Completed
APEX Credit Recovery Courses
Completed
APEX Original Credit Courses
Completed
Other Online Courses
Completed
N N % N % N % N N % N % N % 8 13 1 7.7 11 84.6 1 7.7 3 --- --- --- --- 3 100.0 9 420 134 31.9 101 24.0 185 44.0 224 43 19.2 15 6.7 166 74.1 10 545 220 40.4 133 24.4 192 35.2 297 99 33.3 25 8.4 173 58.2 11 719 226 31.4 189 26.3 304 42.3 473 137 29.0 72 15.2 264 55.8 12 195 105 53.8 40 20.5 50 25.6 176 113 64.2 56 31.8 7 4.0
Total 1,892 686 36.3 474 25.1 732 38.7 1,173 392 33.4 168 14.3 613 52.3
Source: Chancery: September 24, 2014; September 17, 2015
• A total of 1,173 courses were completed online during the 2015 summer school session.
• Of the 1,173 courses completed, 33.4 percent were APEX credit recovery, 14.3 percent were APEX original credit courses, and 52.3 percent were other online courses.
• Overall, there was a decrease in the number of online courses completed in 2015 (1,173) from 2014 (1,892), but there was an increase of 13.6 percentage
points in the percentage of online courses completed through programs other than APEX from 2014 (38.7%) to 2015 (52.3%).