Embed Size (px)
DESCRIPTION
A dissertation
Citation preview
INILAK (INDEPENDENT INSTITUTE OF LAY ADVENTISTS OF KIGALI)
P.O. Box. 6392 Kigali
Faculty of Economic Sciences
Department of Management
Option of Finance
IMPACT OF FINANCIAL ANALYSIS IN A
COMMERCIAL BANK’ HEALTH CHECK-UP IN
FRAMEWORK OF CAMELS Case study of Banque Commerciale du Rwanda (BCR Ltd)
Period: 2005-2010
A dissertation submitted to the Faculty of Economic Sciences and Management
as a partial fulfillment of the requirements for the award of a Bachelors’
degree in Business Administration (Finance)
By:
HABIYAREMYE Hyacinthe
Reg. No. 02573/03
Supervised by: Dr BIDERI ISHUHELI
Kigali, September 2012
DECLARATION
I, HABIYAREMYE Hyacinthe hereby declare that the work presented in this dissertation
entitled “Impact of financial analysis in a commercial bank’ health check up in framework
of CAMELS, Case study of BCR Ltd (2005-2010)” is my original work and has not been
presented elsewhere for any academic qualification. Any reference in terms of books or any
other written and electronic materials made concerning other people’s work are indicated in
the bibliography.
HABIYAREMYE Hyacinthe
……………………….………………………………
ii
CERTIFICATION
This is to certify that this research project entitled “Impact of financial analysis in a
commercial bank’ health check up in framework of CAMELS, Case study of BCR Ltd
(2005-2010)” was prepared by HABIYAREMYE Hyacinthe under my supervision.
Dr. BIDERI ISHUHERI
……………………..…………………..
iii

DEDICATION
To my beloved wife MUSABYEMARIYA Aline,
To my beloved daughter AMAREBE Mary Benitha,
To my parents HABIYAREMYE Anastase and Uzamukunda Odette,
To my brother and sister, Anicet and Marie Thérèse,
To my late brothers HABIYAREMYE Innocent and Vincent,
To all my family members,
To all my friends.
iv

ACKNOWLEDGEMENTS
I’m so thankful for the excellent support and help of different people without whom I would
not have a successful work.
I recognize that if God had not given me the ability and good health and had not arranged
circumstances I could not accomplish such a success.
I am thankful to my supervisor Dr. BIDERI ISHUHERI, for his advise during the course of
this work although he had a lot to do.
I appreciate the INILAK administration for what they have done for this historic
achievement of completion of my studies and their commitment to facilitate students by
providing the necessary support that has contributed to the success of this work.
I express the gratitude to the authorities of BCR Ltd., for having hosted me to carry out the
research and for their cooperation during data collection exercise.
I’m out of words to express the gratitude I feel towards my Dear wife MUSABYEMARIYA
Aline and my daughter AMAREBE Mary Benitha. I’m also thankful to my dear parents, my
late brothers and the rest of my family who supported both morally and materially in the
completion of this dissertation.
Special thanks go to my classmates who made life at the university so friendly.
HABIYAREMYE Hyacinthe
v
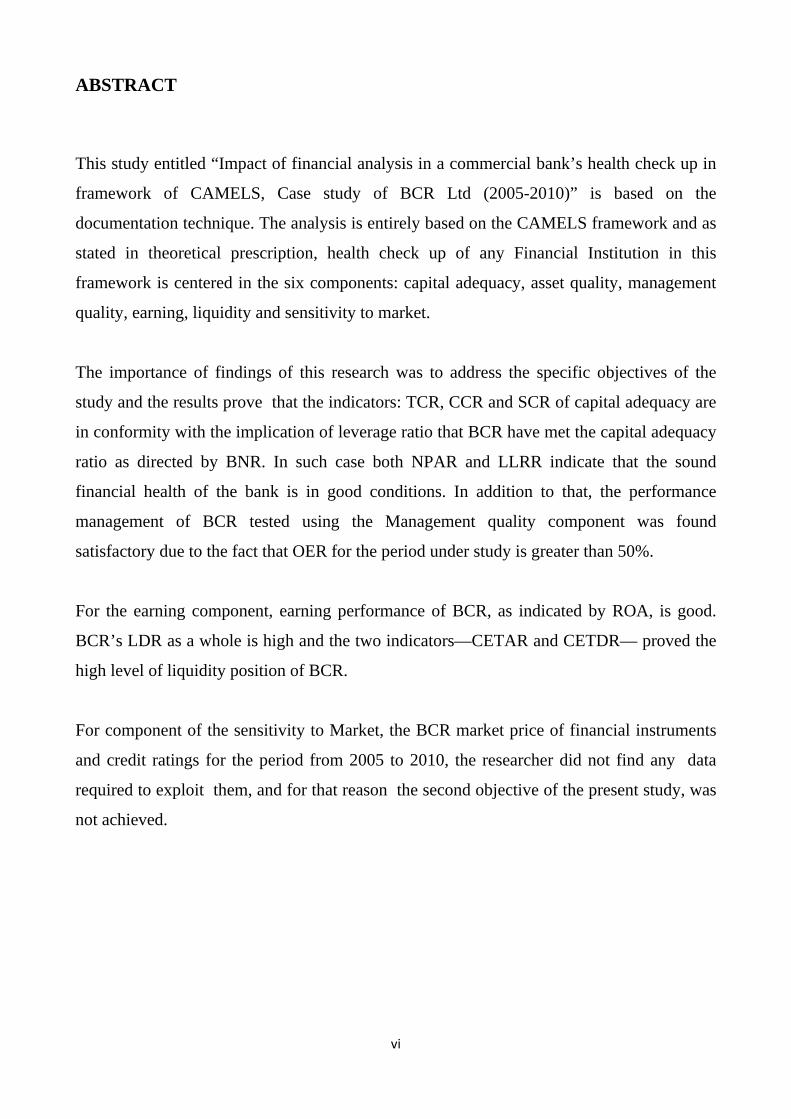
ABSTRACT
This study entitled “Impact of financial analysis in a commercial bank’s health check up in
framework of CAMELS, Case study of BCR Ltd (2005-2010)” is based on the
documentation technique. The analysis is entirely based on the CAMELS framework and as
stated in theoretical prescription, health check up of any Financial Institution in this
framework is centered in the six components: capital adequacy, asset quality, management
quality, earning, liquidity and sensitivity to market.
The importance of findings of this research was to address the specific objectives of the
study and the results prove that the indicators: TCR, CCR and SCR of capital adequacy are
in conformity with the implication of leverage ratio that BCR have met the capital adequacy
ratio as directed by BNR. In such case both NPAR and LLRR indicate that the sound
financial health of the bank is in good conditions. In addition to that, the performance
management of BCR tested using the Management quality component was found
satisfactory due to the fact that OER for the period under study is greater than 50%.
For the earning component, earning performance of BCR, as indicated by ROA, is good.
BCR’s LDR as a whole is high and the two indicators—CETAR and CETDR— proved the
high level of liquidity position of BCR.
For component of the sensitivity to Market, the BCR market price of financial instruments
and credit ratings for the period from 2005 to 2010, the researcher did not find any data
required to exploit them, and for that reason the second objective of the present study, was
not achieved.
vi
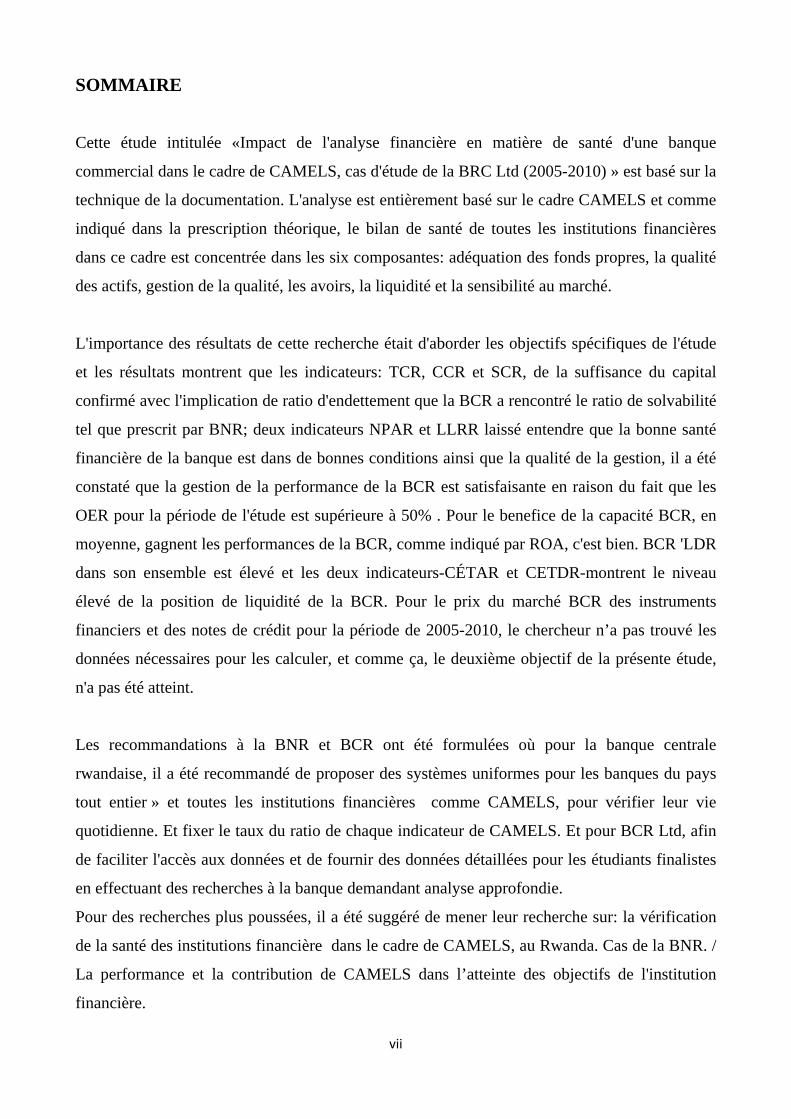
SOMMAIRE
Cette étude intitulée «Impact de l'analyse financière en matière de santé d'une banque
commercial dans le cadre de CAMELS, cas d'étude de la BRC Ltd (2005-2010) » est basé sur la
technique de la documentation. L'analyse est entièrement basé sur le cadre CAMELS et comme
indiqué dans la prescription théorique, le bilan de santé de toutes les institutions financières
dans ce cadre est concentrée dans les six composantes: adéquation des fonds propres, la qualité
des actifs, gestion de la qualité, les avoirs, la liquidité et la sensibilité au marché.
L'importance des résultats de cette recherche était d'aborder les objectifs spécifiques de l'étude
et les résultats montrent que les indicateurs: TCR, CCR et SCR, de la suffisance du capital
confirmé avec l'implication de ratio d'endettement que la BCR a rencontré le ratio de solvabilité
tel que prescrit par BNR; deux indicateurs NPAR et LLRR laissé entendre que la bonne santé
financière de la banque est dans de bonnes conditions ainsi que la qualité de la gestion, il a été
constaté que la gestion de la performance de la BCR est satisfaisante en raison du fait que les
OER pour la période de l'étude est supérieure à 50% . Pour le benefice de la capacité BCR, en
moyenne, gagnent les performances de la BCR, comme indiqué par ROA, c'est bien. BCR 'LDR
dans son ensemble est élevé et les deux indicateurs-CÉTAR et CETDR-montrent le niveau
élevé de la position de liquidité de la BCR. Pour le prix du marché BCR des instruments
financiers et des notes de crédit pour la période de 2005-2010, le chercheur n’a pas trouvé les
données nécessaires pour les calculer, et comme ça, le deuxième objectif de la présente étude,
n'a pas été atteint.
Les recommandations à la BNR et BCR ont été formulées où pour la banque centrale
rwandaise, il a été recommandé de proposer des systèmes uniformes pour les banques du pays
tout entier » et toutes les institutions financières comme CAMELS, pour vérifier leur vie
quotidienne. Et fixer le taux du ratio de chaque indicateur de CAMELS. Et pour BCR Ltd, afin
de faciliter l'accès aux données et de fournir des données détaillées pour les étudiants finalistes
en effectuant des recherches à la banque demandant analyse approfondie.
Pour des recherches plus poussées, il a été suggéré de mener leur recherche sur: la vérification
de la santé des institutions financière dans le cadre de CAMELS, au Rwanda. Cas de la BNR. /
La performance et la contribution de CAMELS dans l’atteinte des objectifs de l'institution
financière.
vii
TABLE OF CONTENTS
DECLARATION ..................................................................................................................... ii
CERTIFICATION .................................................................................................................... iii
DEDICATION .................................................................................................................... iv
ACKNOWLEDGEMENTS ....................................................................................................... v
ABSTRACT .................................................................................................................... vi
SOMMAIRE ................................................................................................................... vii
TABLE OF CONTENTS ........................................................................................................ viii
LIST OF ABBREVIATIONS .................................................................................................... x
LIST OF CHARTS ................................................................................................................... xii
LIST OF TABLES .................................................................................................................. xiii Chapter one: GENERAL INTRODUCTION ......................................................................... 1
1.1. Background of the study .................................................................................................... 1
1.2. Problem statement ............................................................................................................. 2
1.3. Objectives of the study ...................................................................................................... 3
1.3.1. General objective ........................................................................................................ 3
1.3.2. Specific objectives ...................................................................................................... 3
1.4. Research questions ............................................................................................................ 3
1.5. Scope of the study .............................................................................................................. 4
1.6. Significance of the study ................................................................................................... 4
1.6.1. To the researcher ......................................................................................................... 4
1.6.2. To BCR Ltd................................................................................................................. 4
1.6.3 To others researchers ................................................................................................... 5
1.7. Company profile ................................................................................................................ 5
1.7.1. Historical background ................................................................................................. 5
1.7.2. Vision .......................................................................................................................... 6
1.7.3. Mission statement ....................................................................................................... 6
1.8. Organization of the study .................................................................................................. 6
viii
Chapter two: LITERATURE REVIEW .................................................................................. 8
THEORIES ON FINANCIAL ANALYSIS ............................................................................. 8
Financial analysis versus situation development .................................................................. 9
Objectives of the Financial Analysis .................................................................................. 10
Basic State for Financial Analysis ...................................................................................... 11
THEORIES ON PERFORMANCE ....................................................................................... 11
Performance management ................................................................................................... 11
The purpose of performance management .......................................................................... 12
Performance measurement .................................................................................................. 12
How to measure performance ............................................................................................. 12
Aspects of the performance ................................................................................................ 14
CAMELS RATING SYSTEM TOWARDS BANK’S PERFORMANCE ............................ 15 Chapter three: RESEARCH METHODOLOGY ................................................................. 22 Chapter four: ANALYSIS OF THE DATA AND INTERPRETATION OF FINDINGS 23
4.1. BCR Ltd. Capital Adequacy ............................................................................................ 23
4.2. BCR Ltd. Asset quality .................................................................................................... 25
4.3. BCR Ltd. Management quality ........................................................................................ 26
4.4. BCR Ltd. earning performance ratios ............................................................................. 27
4.5. BCR Ltd. Liquidity .......................................................................................................... 29 Chapter five: SUMMARY OF FINDINGS, CONCLUSION AND SUGGESTIONS ....... 32
5.1. Summary of the major findings ....................................................................................... 32
5.2. Conclusion ....................................................................................................................... 33
5.3. Recommendations ........................................................................................................... 34
5.4. Suggestions for further studies ........................................................................................ 35 BIBLIOGRAPHY ................................................................................................................... 36
APPENDICES ................................................................................................................... 38
ix
LIST OF ABBREVIATIONS
BCR : Banque Commerciale du Rwanda
BNR : Banque Nationale du Rwanda
CB : Cash Balance
CBR : Cash Balance to Total Deposit Ratio
CC : Core Capital
CCR : Core Capital Ratio
CETAR : Cash and Equivalent to Total Asset Ratio
CETDR : Cash and Equivalent to Total Deposit
EPE : Earning per Employee
EU : European Union
FDICIA : Federal Deposit Insurance Corporation Improvement Act
FIs : Financial Institutions
FSC : Financial Stability Committee
http : Hyper Text Transfer Protocol
INILAK : Independent institute of Lay Adventists of Kigali
LDR : Loan to Deposit Ratio
LLR : Loan Loss Reserve
LLRR : Loan Loss Reserve Ratio
LR : Leverage Ratio
Ltd. : Limited
NI : Net Income
NOE : number of employees
NOI : net operating income
NPA : Non-Performing Assets
NPAR : Nonperforming Loan Ratio
OER : Operating Expenses Ratio
PM : Profit Margin
RDB : Rwanda Development board
ROA : Return On Assets
ROE : Return on Equity
x
RWA : Risk Weighted Assets
Rwf : Rwandan francs
SC : Supplementary Capital
SCP : Structure Conduct Performance
SCR : Supplementary Capital Ratio
SE : Shareholder Equity
TA : Total Assets
TA : Total Assets
TC : Total Capital
TCR : Total Capital Ratio
TD : Total Deposit
TLA : Total Loan and Advance
TLA : Total Loan and Advance
TOE : Total Operating Expenses
TOR : Total Operating Revenue
U.S.A. : United State of America
UNDP : United Nation Development Program
www : World Wide Web
xi

LIST OF CHARTS
Chart 1: BCR Capital Adequacy ratios evolution .................................................................. 24
Chart 2: Asset quality ratios evolution ................................................................................... 26
Chart 3: BCR profitability evolution ...................................................................................... 29
Chart 4: BCR Ltd. liquidity ratios evolution .......................................................................... 31
xii

LIST OF TABLES
Table 1: indicators of BCR’ Capital adequacy ratios ........................................................ 24
Table 2: Indicators of BCR Asset quality ratios ............................................................... 25
Table 3: Indicators of BCR Ltd. Management quality ratios ............................................ 27
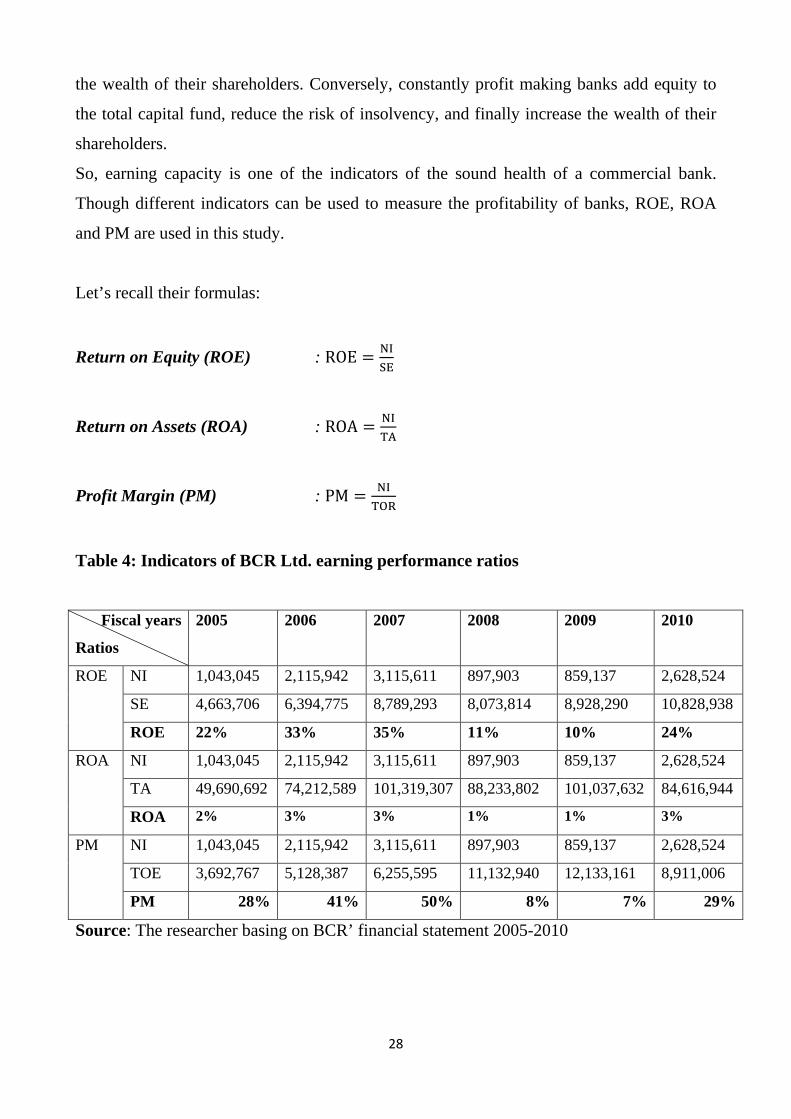
Table 4: Indicators of BCR Ltd. earning performance ratios ............................................ 28
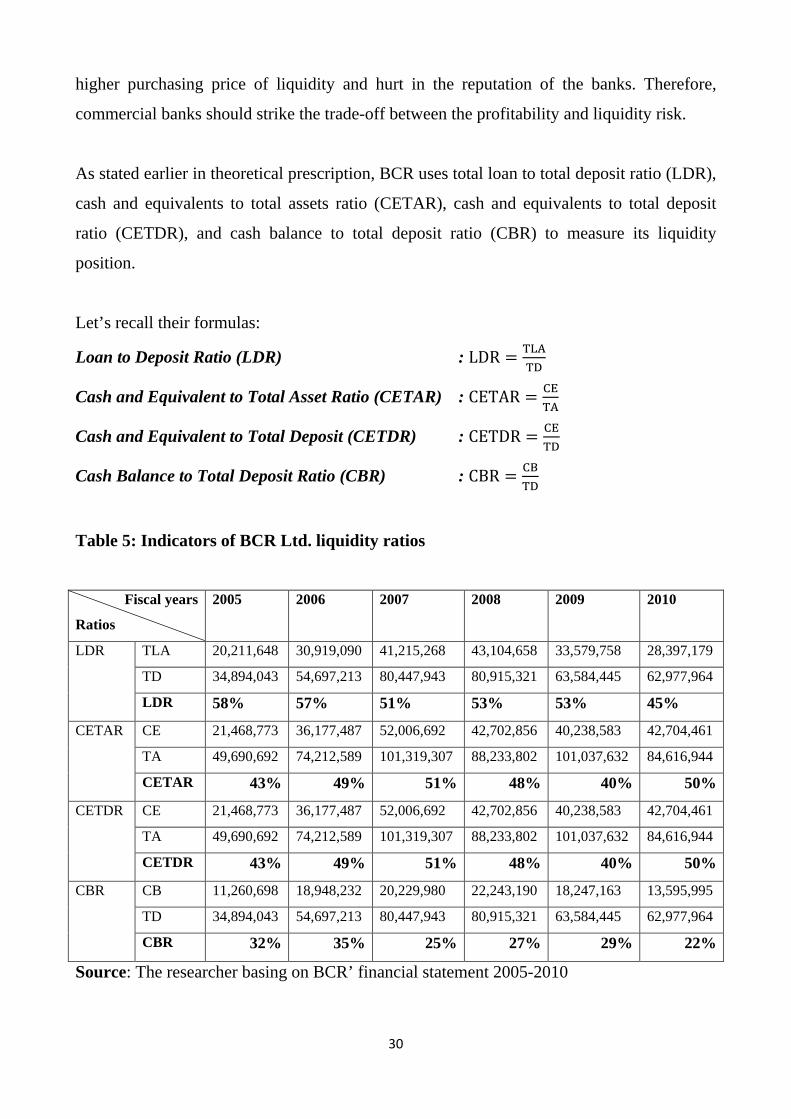
Table 5: Indicators of BCR Ltd. liquidity ratios ............................................................... 30
xiii
CHAPTER ONE: GENERAL INTRODUCTION
GENERAL INTRODUCTION
1.1. Background of the study
In Rwanda, in the period under review, the BNR continued to employ important reforms to
ensure that the financial system mainly composed of the banking system, microfinance and
non-banking financial institutions is robust and continue to show good financial health.
These reforms included the establishment of appropriate market infrastructure (efficient
legal and regulatory framework, supervisory tools, modern payment systems and the private
credit reference bureau). In addition, the BNR established the Financial Stability Committee
(FSC) in May 2012 with the mission to promote the stability of the Rwandan financial
system by analyzing the system in its environment on a permanent basis, and by identifying,
monitoring and publishing associated risks. The outcome of the 2011 financial stability
reports and first meeting of FSC substantiate that Rwanda’s financial system is sound and
stable and able to mitigate systemic risks. (BNR, 2012: 29)
The financial services sector in Europe has altered fundamentally in recent years. The
change has been caused by the increasing weight of the capital markets in mediating offer
and demand for capital (disintermediation), the enforced diffusion of IT in sales,
development and processing of financial services, fierce competition in national markets as
well as the rising globalization of the entire industry. The transformation of the banking
sector will be accelerated by the current financial market crisis. Additionally, the regulatory
environment has changed dramatically. This holds especially true for Europe. Economic and
political target of the process of deregulation and harmonization is to intensify competition
in a single and homogeneous European market for financial services (EU Commission
2005).
Bank’s overall performance or rather solvency or insolvency has been given much attention
both at the local and international level. Financial ratios are often used to measure the
overall financial soundness of a bank and the quality of its management.
1
Although, empirical research into explanatory factors of banks’ financial performance as
much as efficiency measurement in banking was and still is predominated by an economic
point of view. Numerous studies were performed to decide between the efficient structure
hypothesis and the Structure Conduct Performance (SCP) paradigm. While the first suggests
that high profitability, high market share, and high market concentration are results of high
efficiency, the latter attributes high profitability to anticompetitive collusion among market
participants (traditional SCP) or to the abuse of market power of large individual players
(relative market power hypothesis). Traditionally, theses hypotheses were tested without
any direct efficiency measure (Molyneux and Forbes 1995).
Not only the commercial banks but also any Financial Institutions (FIs) require regular self
health check up to maintain the confidence of private sector in financial system of the
country and protect the interest of depositors, lenders, shareholders and other stakeholders.
The gravity of the importance of sound financial sector has increased tremendously after the
international financial turmoil of the second half of the 1990s. International monetary
authorities such as International Monetary Fund and international FI like the World Bank
have underpinned the need of healthy financial sector to build up the confidence of private
sector in the liberalized financial system. Therefore, they have directed their member
countries to reform the financial sector and conduct the regular health checkup of Financial
Institutions through onsite and offsite supervision. (Keshar J. Baral, 2005: 42)
1.2. Problem statement
Health checkup of the banking and finance industry plays a significant role in determining
financial stability of any country. Furthermore, globalization and technological
advancement has created a highly competitive market. This affects all organizations
regardless of business emphasis. Banks are of no exception.
During the first half of 2012, the sector demonstrated good performance as a result of
strengthened legal and supervisory framework as well as good macroeconomic
environment. (BNR, 2012: 30)
2
Furthermore, total loans increased by 20% from RWF 631.2 billion in December 2011 to
RWF 757.1 billion in June 2012, while deposits have grown by 12.8% from RWF 716.5
billion in December 2011 to RWF 808.4 billion end June 2012. (BNR, 2012: 30)
While reviewing this situation, it points toward that there is a remarkable field of research
and therefore this has attracted the researcher’s attention to find out what impact can have a
financial analysis in BCR health check up in framework of CAMELS.
1.3. Objectives of the study
1.3.1. General objective
The general objective of the study is to assess the financial analysis based on CAMELS
framework in BCR health check up.
1.3.2. Specific objectives
The following specific objectives must be achieved.
• To assess BCR bank’ capital adequacy, asset quality, management soundness,
earning and profitability, liquidity, sensitivity to market risk for the period from
2005-2010.
• To assess BCR bank’ market based indicators like market price of financial
instruments and credit ratings for the period from 2005-2010.
1.4. Research questions
The following questions guide this research to achieve the above objectives:
• What is the situation of BCR bank’ health, in CAMELS’ framework, for the period
from 2005-2010?
• How is BCR Ltd. Sensitive to market risk for the period under study (2005-2010)?
3
1.5. Scope of the study
The study encompassed ideas concerning the financial management field, especially the
impact of a financial analysis utilized in BCR Ltd. to its overall performance in framework
of CAMELS; for a period of 5 years (2005-2010) and the study is carried out in BCR Ltd.
main branch, located in Kigali City. The area was chosen due to its accessibility to the
researcher.
1.6. Significance of the study
The study will benefit different groups of people and aims to get means and ways on how a
strong financial analysis can improve the performance of a commercial bank. The study
benefited the following groups of people in this order respectively.
1.6.1. To the researcher
• The study enabled the researcher to know the impact of a financial analysis to the
performance of BCR Ltd. and how that performance is calculated in framework of
CAMELS.
• The study benefited the researcher to gain more experience of coordinating other studies
and to add a pool of knowledge, especially when making other more research.
1.6.2. To BCR Ltd.
• The study aim at giving the recommendations on how BCR Ltd. can assist his financial
analysts to do their work well.
• The study will help the finance managers and others who are responsible in increasing
the performance of the company.
• The study will help the financial analysis department to know their weaknesses and
strength in increasing the performance of the bank.
4
1.6.3 To others researchers
• The report of this study will serve as basis and guide for future reference by other
researchers and other academic references;
• This research will also help other people especially on how they could improve their
methods of calculating the performance or profit by the use of CAMELS ratings system,
without forgetting, the way they will benefit explanations on the impact of a financial
analysis to the overall performance of BCR Ltd.
1.7. Company profile
1.7.1. Historical background
Banque Commerciale du Rwanda Limited (BCR) was incorporated on 25th May 1963 as
the first commercial bank in Rwanda. In December 2004, BCR marked another milestone
when it was privatized and acquired by Actis after recapitalization of the Company’s equity.
Actis (at that time Common Development Corporation) is owned 40% by the Government
of United Kingdom and 60 % privately owned by the partners of Actis. Since Actis’
acquisition of an 80% share in BCR, the Bank has grown rapidly over the last few years and
is now one of the foremost banking institutions in Rwanda. BCR has a strong reputation of
reliability, solidity and innovation with a passion to serve and satisfy its customers.
The bank has won several local and international awards, which include:
• Winner of the prestigious awards by The Banker magazine - awarded “Banker of the
year’’
• Winner of Best bank of the year in Rwanda by Global Finance 2008, 2009, 2010 &
2010
• Winner of the Best customer Service Bank by Rwanda Development board (RDB)
2009
5
BCR is the first bank to:
• To list a 10 year corporate bond on the Rwandan capital market,
• Introduce Mortgages to the Rwandan Market,
• Introduce Leasing to the Rwandan Market,
• Introduce and successfully conclude the largest size loan syndication in Rwanda,
• Introduce Online banking, SMS banking and Phone banking services,
• Launch mobile money transfer in partnership with a major mobile phone operator,
• Introduce forward Treasury products,
• Issue a Treasury Newsletter to customers,
• Offer dedicated counters to Institutional & VIP clients
1.7.2. Vision
“To be the most respected and leading provider of innovative financial services solutions in
the region”
1.7.3. Mission statement
BCR seeks to grow shareholder value while playing a key role in transforming the economy
and enhancing the well being of Rwandans.
• To support the development of the banking sector
• To support the drive for private sector investment for the development of the
economy
• To be the leading bank in Rwanda
• To offer our shareholders the best returns
1.8. Organization of the study
This research work is divided into five chapters.
Chapter one consists of the general introduction which comprises the background of the
study, statement of the problem, objectives of the study, research questions, scope of the
study, significance of the study, Company profile and organization of the study. Chapter
6

two presents a review of existing literature on financial analysis; overall performance
(health) and commercial banks as far as the financial analysis have an impact on the
performance of a commercial bank. Chapter three presents the methodology used for data
collection. Chapter four is the analysis of the data and interpretation of findings. And finally
chapter five is about the summary of research findings, conclusion and suggestions for
future research.
7
CHAPTER TWO: LITERATURE REVIEW LITERATURE REVIEW
The literature review provides a theoretical framework of the research topic related
literature. It is important for a researcher to show how his/ her research fits into the body of
knowledge generated over the ages.
This chapter provides explanation of the key concepts related to the impact of financial
analysis in a commercial bank’ health check up (overall performance) in framework of
CAMELS rating system and it portrays the views of different authors and researchers in the
discipline of financial analysis and performance in order to arrive at conceptual framework
of the study. It sets to find out their findings, arguments, ideas, and observation that are
available to this study.
THEORIES ON FINANCIAL ANALYSIS
According to Investopedia, financial analysis means the process of evaluating businesses,
projects, budgets and other finance-related entities to determine their suitability for
investment. Typically, financial analysis is used to analyze whether an entity is stable,
solvent, liquid, or profitable enough to be invested in. When looking at a specific company,
the financial analyst will often focus on the income statement, balance sheet, and cash flow
statement. In addition, one key area of financial analysis involves extrapolating the
company's past performance into an estimate of the company's future performance.
Investopedia continues explaining 'Financial Analysis' as one of the most common ways of
analyzing financial data is to calculate ratios from the data to compare against those of other
companies or against the company's own historical performance. For example, return on
assets is a common ratio used to determine how efficient a company is at using its assets
and as a measure of profitability. This ratio could be calculated for several similar
companies and compared as part of a larger analysis. (Investopedia, 2012)
According to the businessdictionary, Assessment of the (1) effectiveness with which funds
(investment and debt) are employed in a firm, (2) efficiency and profitability of its
8
operations, and (3) value and safety of debtors' claims against the firm's assets. It employs
techniques such as 'funds flow analysis' and financial ratios to understand the problems and
opportunities inherent in an investment or financing decision. (Business dictionary, 2012)
Financial analysis versus situation development
Users of this information are many and varied, from business managers interested in
evaluating it, financial managers about the viability of new investments, new projects and
what is the best way of financing to foreign banks on whether to grant credit or not to
undertake such investments.
From an external perspective, are very useful for anyone interested in knowing the situation
and expected development of the company, such as those listed below:
• Entities credit.
• Actions.
• Store of purchase.
• Customers.
• Employees, works councils and trade unions.
• Auditor of Accounts.
• Advice.
• Analyst Financial.
• Administration public.
• Competitors.
• Inverter and prospective buyers of the company.
Through the Financial Analysis can be diagnosed with the company, which is the result of
analysis of all relevant data and report the same weaknesses and strengths.
For diagnosis have been useful to give the following circumstances:
• Must be based on the analysis of all relevant data.
• Must be on time.
9
• It has to be right.
• Must be immediately accompanied by appropriate remedial measures to address
weaknesses and build on the strengths.
This diagnosis day to day business is a key tool for proper management. This helps to
achieve those objectives could be considered the majority of businesses
• Surviving: Continue running along the years, covering all the commitments.
• Be profitable, generate profits to reward shareholders adequately and properly fund
the necessary investments.
• Grow: Increase sales, market share, profits and company value.
Objectives of the Financial Analysis
Among the objectives to be taken into account in the Financial Analysis are:
• Assessing the results of the activity.
• To reveal the internal reserves in the enterprise.
• Achieve the increase in activity, while raising the quality of it.
• Increase the productivity of labor.
• Work efficiently represents means of fixed assets and inventories.
• Reduce the cost of services and achieve the planned efficiency.
Other important objectives of the analysis of economic activity fall below
• The search for internal reserves for further improvement work.
• The study of errors that occurred, in order to eliminate them in the future.
• The review of all information about the management aims of the work in the
company.
• The impact of social organizations in improving the financial activity of the
company.
To complement the goals is an analysis of all financial and economic process, starting from
the basic states for this analysis.
10
Basic State for Financial Analysis
The Financial Analysis is based on the use of information sources that provide data on past
and present of a company, allowing making predictions about the future of it, this source of
information are the Financial Statements. (Object guild, 2012)
THEORIES ON PERFORMANCE
According to Armstrong and Baron (1998:150), performance management is the strategic
and integrated approach to delivering sustained success to organizations by improving the
productivity and performance of people who work in them and by developing the
capabilities to teams and individual contributors.
In other words, performance can be referred to as the extent to which behavior results in the
attainment of work or organizational goals.
Decenzo and Robbins (1999:200) defined performance as a function of skill, abilities,
motivation and opportunity to perform.
According to Roger Moore (1993:159), performance management is therefore, a method of
connecting organizational objectives to people who are there to carry them out.
In this regard therefore, the managers’ responsibility is to coordinate resources in the most
effective and efficient manner to accomplish the institution’s goals and the analysis of
investment decision making in this context can be one of the criterions to evaluate the social
security performance as good or bad.
Performance management
Roger Mores (1993:5), defined performance management as a method of connecting an
organizations objective to the people who are there to carry them out. It makes the use of
procedures and communication drills the organization already has, it takes into account the 11
organizations culture, and establishes the key link between individual staff development and
corporate goals.
The purpose of performance management
It is the means of getting better results from the organization team and individuals trough
managing performance within an agreed framework of planned goals, standards, and
competence requirements. It is also a process, which establishes shares understanding about
what is to be achieved.
Performance management is also an approach to managing and developing people in a way
that increases the probability that it will be achieved in the short and longer term. It is
therefore concerned with performance improvement and individual effectiveness,
employee’s development by use of effective progress of continuous development and
satisfying their needs and expectations of all the organizations stakeholders whereby it
should recognize that these stakeholders’ needs and those of the organization will not
coincide.
Performance measurement
Performance measures will always be agreed upon when setting objectives since there is no
single measuring that can provide clear performance target or focuses attention on the
critical areas of business or work as commended by Kaplan and Orton (1992).
Therefore, a performance measure gives evidence or not intended results have been
achieved and show the extent to which the job holder has produced that result.
How to measure performance
Performance can be measured against four dimensions such as financial results, customer
services and internal process (how well things are done) and people management. The tools
12
that can be used when measuring performance are: finance, output or productivity, impact,
reaction and time.
Financial standard:
Some income of financial is invested in government enterprises and then managers should
compare the attained returns and costs incurred to measure the performance. The managers
here will be able to determine the performance after knowing the organizations costs benefit
during his operations.
Productivity (output):
This can be defined in different terms for example: the technical efficiency, which
maximizes output relation to input. The output attained is compare to the input and when
high and quality output was realized, and then the organizations performance is considered
good.
However Dalton (1988), argued that, as human factors are important in examining how
inputs are used to achieve results, output may likewise be interpreted as organizations
effectiveness and how both can be maximized is through employee or staff motivations, the
degree of staff development, participation ad consensus process
Impact on attainment of performance standards:
Managers will base on their motivation packages, staff development, and change of
behavior and level of innovation to measure performance. He will evaluate whether those
incentives have any positive impact on the attainment of standards like good quality
production, level of services, competition of work and ability to capture the customers.
13
Aspects of the performance
Economic performance:
It gets along like the profitability of the company. It resides in the service of the company is
its capacity to achieve the laid down goals. Some criteria of economic performance
evaluation.
• The productivity
• The quality of the products and services
• Economy of the resources
• Competitiveness
• Profitability
• The sales turnover
• Profit
• The respect of the deadlines
Organizational performance:
Marmuse (1997: 36) defines the organizational performance as being "the way in which it
manages to reach them its objectives and the way in which it arrives has to reach them".
Some criteria of organizational performance evaluation:
• The quality of the information flow
• Relations between the services
• Coordination
• The degree of control
• The communication
• Decentralization
• Flexibility
The human performance:
Martory and Crozet (1988: 45) affirm that the human performance is analyzed through the
resulting one obtained by the employees on the working stations in a group, a service or a
whole entity.
14
This result is expressed by the richness creates, the produced added value, the supplement of
value given to the unit and the improvement of the establishment in the environment. some
criteria of human performance evaluation.
• The productivity of the personnel,
• The engagement of the personnel,
• Job satisfaction,
• The initiative,
• Speed of decision-making
• Formation.
Let us recall that the performance is thus regarded as being the sum of satisfactions
(resulting financial and non-financial create for the whole of the parts fascinating is the
aptitude of the organization to produce these satisfactions in a durable way).
CAMELS RATING SYSTEM TOWARDS BANK’S PERFORMANCE
In 1979, the Uniform Financial Institutions Rating System was adopted to provide federal
bank regulatory agencies with a framework for rating financial condition and performance
of individual banks (Siems and Barr; 1998). Since then, the use of the CAMEL factors in
evaluating a bank’s financial health has become widespread among regulators.
Piyu (1992) notes “currently, financial ratios are often used to measure the overall financial
soundness of a bank and the quality of it management. Bank regulators, for example, use
financial ratios to help evaluate a bank’s performance as part of the CAMEL system”. The
evaluation factors are as follows;
C : Capital adequacy
A : Asset quality
M : Management quality
E : Earnings ability
L : Liquidity.
Each of the five factors is scored from one to five, with one being the strongest rating. An
overall composite CAMEL rating, also ranging from one to five, is then developed from this 15
evaluation. As a whole, the CAMEL rating, which is determined after an on-site
examination, provides a means to categorize banks based on their overall health, financial
status, and management.
The Basle Committee on Banking Supervision of the Bank of International Settlements
(BIS) has recommended using capital adequacy, assets quality, management quality, earnings
and liquidity (CAMEL) as criteria for assessing a FI in 1988 (ADB 2002). The sixth
component, market risk (S) was added to CAMEL in 1997 (Gilbert, Meyer and Vaughan 2000).
However, most of the developing countries are using CAMEL instead of CAMELS in the
performance evaluation of the FIs.
CAMELS’ framework is a common method for evaluating the soundness of Financial
Institutions. This system was developed by regulatory authorities of the U.S banks. The
Federal Reserve Bank, the Comptroller of the Currency and the Federal Deposit Insurance
Corporation all use this system (McNally 1996).
Monetary authorities in the most of the countries are using this system to check up the health
of an individual FI. In addition, International Monetary Fund also is using the aggregated
indicators of individual FIs to assess the financial system soundness of its member countries
as part of its surveillance work (Hilbers, Krueger and Moretti 2000).
Capital Adequacy
CAMELS’ framework system looks at six major aspects of any Financial Institution: capital
adequacy, asset quality, management soundness, earnings, liquidity, and sensitivity to
market risk (Hilbers, Krueger and Moretti 2000).
The first component, capital adequacy ultimately determines how well FIs can manage with
shocks to their balance sheets. Thus, it tracks capital adequacy ratios that take into account
the most important financial risks—foreign exchange, credit, and interest rate risks—by
assigning risk weightings to the institution's assets. For the purpose of capital adequacy
measurement, bank capital is divided into Tier I and Tier II. Tier I capital is primary capital
and Tier II capital is supplementary capital.
16
Leverage ratio can be used to measure the capital adequacy of a bank. This is the ratio of
bank's book value of core capital to the book value of its assets. The higher ratio shows the
higher level of capital adequacy. The U.S.A. Federal Deposit Insurance Corporation
Improvement Act (FDICIA) of 1991 has fixed the five target zones:
i. 5 percent and above
ii. 4 percent and above
iii. under 4 percent,
iv. under 3 percent,
v. 2 percent and less, of leverage ratio.
The leverage ratio falling in the first zone implies that bank is well capitalized. Similarly, the
leverage falling in the second zone shows that bank is adequately capitalized. The leverage
falling in the last three zones indicates that bank is inadequately capitalized and regulators
should take prompt corrective action to bring the capital to the desirable level (Saunders and
Cornett 2004).
The leverage ratio stated in the foregoing discussion is simple capital to assets ratio. In other
words, assets are not risk adjusted. The 1993 Basel Accord enforced the capital ratio to risk
adjusted assets of commercial banks. According to this accord, core capital must equal to or
exceed 4 percent of the risk weighted assets of the commercial banks. Similarly, the amount
of the supplementary capital should not exceed the amount of the core capital and the total
capital must equal or exceed 8 percent of risk weighted assets (Saunders and Cornett 2004).
The Following are the Capital Adequacy ratios formulas:
Leverage Ratio (LR)
𝐿𝑅 = 𝐶𝐶𝑇𝐴
…………………….……. (1.1)
Where : CC = core capital
: TA = total assets
17
Core Capital Ratio (CCR)
𝐶𝐶𝑅 = 𝐶𝐶𝑅𝑊𝐴
………………………… (1.2)
Where : RWA =risk weighted assets
Total Capital Ratio (TCR)
𝑇𝐶𝑅 = 𝑇𝐶𝑅𝑊𝐴
………………………… (1.3)
Where : TC = total capital (core capital plus supplementary capital)
Supplementary Capital Ratio (SCR)
𝑆𝐶𝑅 = 𝑆𝐶𝑅𝑊𝐴
…………………..…… (1.4)
Where : SC = supplementary capital
Asset Quality
Credit risk is one of the factors that affect the health of an individual FI. The extent of the
credit risk depends on the quality of assets held by an individual FI. The quality of assets held
by an FI depends on exposure to specific risks, trends in non-performing loans, and the health
and profitability of bank borrowers—especially the corporate sector. We can use a number of
measures to indicate the quality of assets held by FIs.
The following are Assets Quality ratios formulas:
Nonperforming Loan Ratio (NPAR)
NPAR = NPATLA
………………………. (2.1)
Where : NPA = nonperforming assets (loan and advance)
: TLA = total loan and advance
Loan Loss Reserve Ratio (LLRR)
LLRR = LLRTLA
……………………… (2.2)
Where : LLR = loan loss reserve
18
Management Quality
Sound management is key to bank performance but is difficult to measure. It is primarily a
qualitative factor applicable to individual institutions. Several indicators, however, can
jointly serve as an indicator of management soundness. Expenses ratio, earning per
employee, cost per loan, average loan size and cost per unit of money lent can be used as a proxy
of the management quality.
The following are Management Efficiency ratios formulas:
Operating Expenses Ratio (OER)
OER = TOETOR
………………………… (3.1)
Where : TOE = total operating expenses, and it includes interest expenses, employees
expenses, office operating expenses, currency exchange loss, bad
loan advance written off and loan loss provision.
: TOR = total operating revenue, and it includes interest income and non-
interest income.
Earning per Employee (EPE)
EPE = NOINOE
…………………………. (3.2)
Where : NOI = net operating income
: NOE = number of employees
Earning Performance
Earning capacity or profitability keeps up the sound health of an FI. Chronically unprofitable FI
risks insolvency on one hand and on the others, unusually high profitability can reflect
excessive risk taking of an FI. There are different indicators of profitability. Return on
assets, return on equity, interest-spread ratio, earning-spread ratio, gross margin, operating
profit margin and net profit margin are commonly used profitability indicators.
The following are Earning Performance ratios formulas:
19
Return on Equity (ROE)
ROE = NISE
…………………………….. (4.1)
Where : NI = net income
: SE = shareholder equity
Return on Assets (ROA)
ROA = NITA
……………………………. (4.2)
Where : TA = total assets
Profit Margin (PM)
PM = NITOR
……………………………. (4.3)
Liquidity
Liquidity risk threats the solvency of FIs. In the case of commercial banks, first type of
liquidity risk arises when depositors of commercial banks seek to withdraw their money and
the second type does when commitment holders want to exercise the commitments recorded
off the balance sheet. Commercial banks have to borrow the additional funds or sell the
assets at fire sale price to pay off the deposit liabilities. They become insolvent if sale price of
the assets are not enough to meet the liability withdrawals. The second type of liquidity risk
arises when demand for unexpected loans cannot be met due to the lack of the funds.
Commercial banks can raise the funds by running down their cash assets, borrowing additional
funds in the money markets and selling off other assets at distressed price.
Both liability side liquidity risk (first type risk) and asset side liquidity risk (second type
risk) affect the health of commercial banks adversely. But maintaining the high liquidity
position to minimize such risks also adversely affects the profitability of FIs. Return on highly
liquid assets is almost zero. Therefore, FIs should strike the tradeoff between liquidity
position and profitability so that they could maintain their health sound.
Commercial bank's liquidity exposure can be measured by analyzing the sources and uses of
liquidity. In this approach, total net liquidity is worked out by deducting the total of uses of
liquidity from the total of sources of liquidity. Similarly, BIS maturity laddering model can be
20
used to measure the liquidity of a commercial banks. In addition, different liquidity exposure
ratios such as borrowed funds to total assets, core deposit to total assets, loans to deposits, and
commitments to lend to total assets are used to measure the liquidity position of a commercial
bank (Saunders and Cornett 2004).
The following are Liquidity Position ratios formulas:
Loan to Deposit Ratio (LDR)
LDR = TLATD
……………………………. (51)
Where : TLA = total loan and advance (before deduction of loan loss reserve)
: TD = total deposit
Cash and Equivalent to Total Asset Ratio (CETAR)
CETAR = CETA
…………………………….. (5.2)
Cash and Equivalent to Total Deposit (CETDR)
CETDR = CETD
……………………………. (5.3)
Cash Balance to Total Deposit Ratio (CBR)
CBR = CBTD
……………………… (5.4)
Where : CB = cash balance
Sensitivity to Market Risk
Commercial banks are increasingly involved in diversified operations such as lending and
borrowing, transaction in foreign exchange, selling off assets pledged for securities and so on.
All these are subject to market risk like interest rate risk, foreign exchange rate risk, and
financial asset and commodity price risk. The health of an FI more sensitive to market risk
is more hazardous than that of less sensitive. Foreign exchange risk, interest rate risk,
equity price risk, and commodity price risk are the indicators of sensitivity to market risk.
21
CHAPTER THREE: RESEARCH METHODOLOGY RESEARCH METHODOLOGY
This chapter presents the methodological approach of data collection techniques for the
purpose of the study. According to the book of social research methods by Richard M.
HESSLER [1989:80] Research methodology is a science of how to make research decisions
and it includes the practice of evaluating the goodness or badness of decisions made in
course of research.
This study is based on the documentation technique where, the documents that have been
consulted include book, Internet websites, related to the topic under the study, and the report
published by BCR Ltd.
Carl and Roger (1991:41) defined data analysis as the next step after data have been
collected in the research process whose purpose is to interpret and draw conclusions from
the mass of collected data. Data collected were analyzed and edited using EXCEL software.
The process of data analysis will have to begin and this involves the following steps.
This study is based on the historical data disclosed by annual reports of BCR Ltd. BCR has
dictated its financial statements to disclose the financial information in the prescribed
format since the Fiscal Year 2005/2010.
The analysis of this study is entirely based on the CAMELS framework. As stated in
theoretical prescription, health check up of any Financial Institutions in this framework is
concentrated in the six components: capital adequacy, asset quality, management quality,
earning, liquidity and sensitivity to market.
But in this study, the last component has been dropped due to the presence of much more
complication.
So, analysis of financial health of BCR Ltd. bank is carried out in the framework of
CAMEL. Indicators of each component also have been used according to the financial data
disclosed in annual reports.
22
CHAPTER FOUR: ANALYSIS OF THE DATA AND INTERPRETATION OF FINDINGS
ANALYSIS OF THE DATA AND INTERPRETATION OF FINDINGS
This chapter analyses the indicators of BCR financial health in the CAMEL framework. As
stated in methodology, all indicators of the financial health have not be worked out and
analyzed; only the indicators permitted by the publicly available (given) comparable
financial data have been used to analyze the BCR Ltd. financial health. The ensuing section
presents the analysis of different indicators of sound health of BCR.
4.1. BCR Ltd. Capital Adequacy
As stated earlier, leverage ratio, core capital ratio, total capital ratio and supplementary
capital ratio are used as the indicators of capital adequacy of a financial institution. Let’s
recall the formulas of calculation:
Leverage Ratio (LR) : 𝐿𝑅 = 𝐶𝐶𝑇𝐴
Core Capital Ratio (CCR) : 𝐶𝐶𝑅 = 𝐶𝐶𝑅𝑊𝐴
Total Capital Ratio (TCR) : 𝑇𝐶𝑅 = 𝑇𝐶𝑅𝑊𝐴
Supplementary Capital Ratio (SCR) : 𝑆𝐶𝑅 = 𝑆𝐶𝑅𝑊𝐴
23
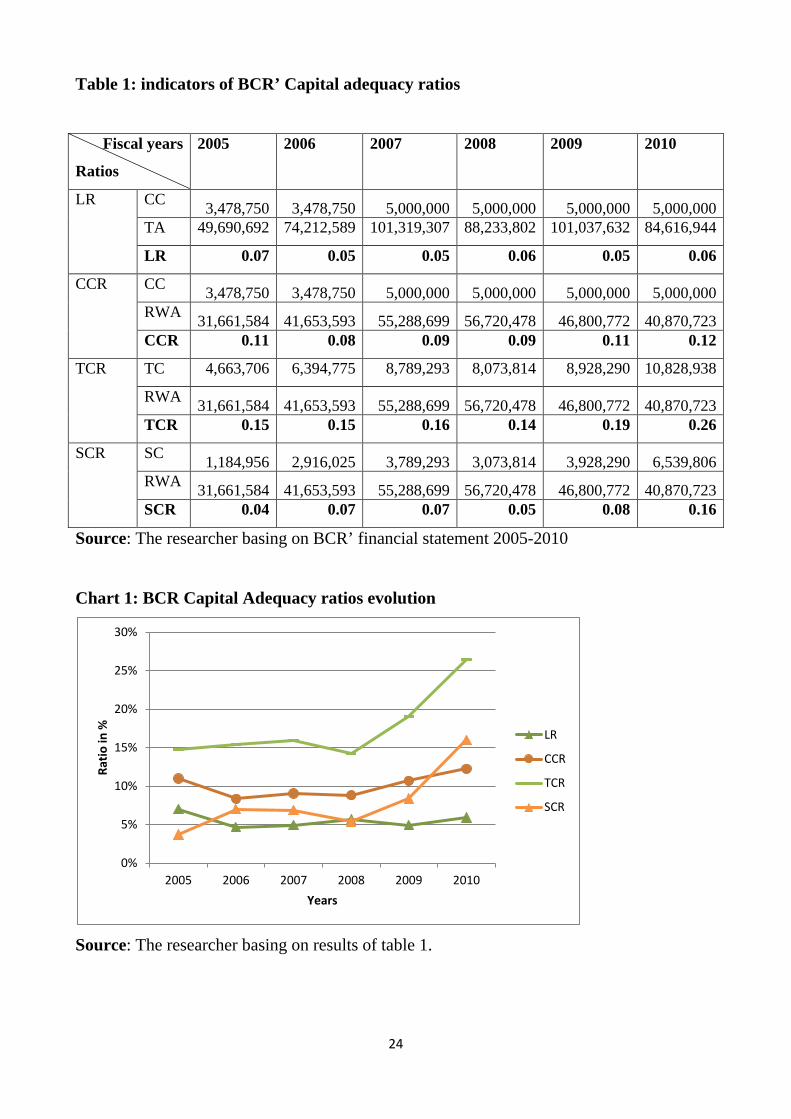
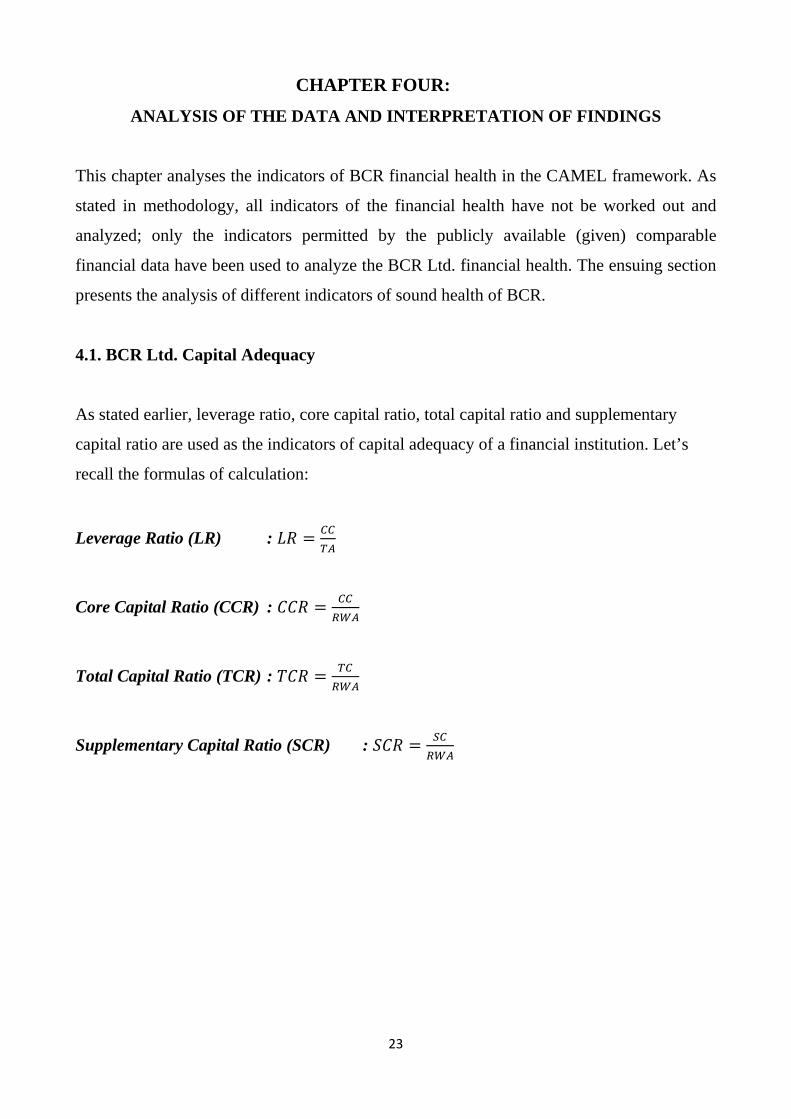
Table 1: indicators of BCR’ Capital adequacy ratios
Fiscal years
Ratios
2005 2006 2007 2008 2009 2010
LR CC 3,478,750 3,478,750 5,000,000 5,000,000 5,000,000 5,000,000 TA 49,690,692 74,212,589 101,319,307 88,233,802 101,037,632 84,616,944
LR 0.07 0.05 0.05 0.06 0.05 0.06
CCR CC 3,478,750 3,478,750 5,000,000 5,000,000 5,000,000 5,000,000 RWA 31,661,584 41,653,593 55,288,699 56,720,478 46,800,772 40,870,723 CCR 0.11 0.08 0.09 0.09 0.11 0.12
TCR TC 4,663,706 6,394,775 8,789,293 8,073,814 8,928,290 10,828,938
RWA 31,661,584 41,653,593 55,288,699 56,720,478 46,800,772 40,870,723 TCR 0.15 0.15 0.16 0.14 0.19 0.26
SCR SC 1,184,956 2,916,025 3,789,293 3,073,814 3,928,290 6,539,806 RWA 31,661,584 41,653,593 55,288,699 56,720,478 46,800,772 40,870,723 SCR 0.04 0.07 0.07 0.05 0.08 0.16
Source: The researcher basing on BCR’ financial statement 2005-2010
Chart 1: BCR Capital Adequacy ratios evolution
Source: The researcher basing on results of table 1.
0%
5%
10%
15%
20%
25%
30%
2005 2006 2007 2008 2009 2010
Ratio
in %
Years
LR
CCR
TCR
SCR
24
As it is shown by results from the table above and chart 1, BCR leverage ratios, in general,
show that the bank is well capitalized and it is strong enough to manage the shock to
balance sheet. Since the leverage ratios during the study periods are greater than 5 percent
(5%). Conventionally, leverage ratio of 5 percent or greater than 5 percent indicates that
commercial banks are well capitalized.
The indicators: TCR, CCR and SCR, of capital adequacy also confirm with the implication
of leverage ratio. In general, BCR have met the capital adequacy ratio as directed by BNR.
4.2. BCR Ltd. Asset quality
It is obvious from the theoretical prescription that the health of commercial banks largely
depends on the quality of assets held by them, and quality of the assets relies on the
financial health of their borrowers. As stated earlier, many indicators can be used to
measure the quality of assets held by BCR bank. But, here, only two simple indicators—
non-performing asset ratio and loan loss reserve ratio—are used to measure the quality of
assets being held by BCR Ltd. bank. Let’s recall the formulas of calculation:
Nonperforming Loan Ratio (NPAR) : NPAR = NPATLA
Loan Loss Reserve Ratio (LLRR) : LLRR = LLRTLA
Table 2: Indicators of BCR Asset quality ratios
Fiscal years
Ratios
2005 2006 2007 2008 2009 2010
NPAR NPA 8,871,853 7,060,380 13,293,678 13,883,650 10,040,337 8,125,012
TLA 20,211,648 30,919,090 41,215,268 43,104,658 33,579,758 28,397,179
NPAR 44% 23% 32% 32% 30% 29%
LLRR LLR 9,031,571 10,623,593 12,286,075 8,468,790 5,120,901 4,921,684
TLA 20,211,648 30,919,090 41,215,268 43,104,658 33,579,758 28,397,179
LLRR 45% 34% 30% 20% 15% 17%
Source: The researcher basing on BCR’ financial statement 2005-2010
25
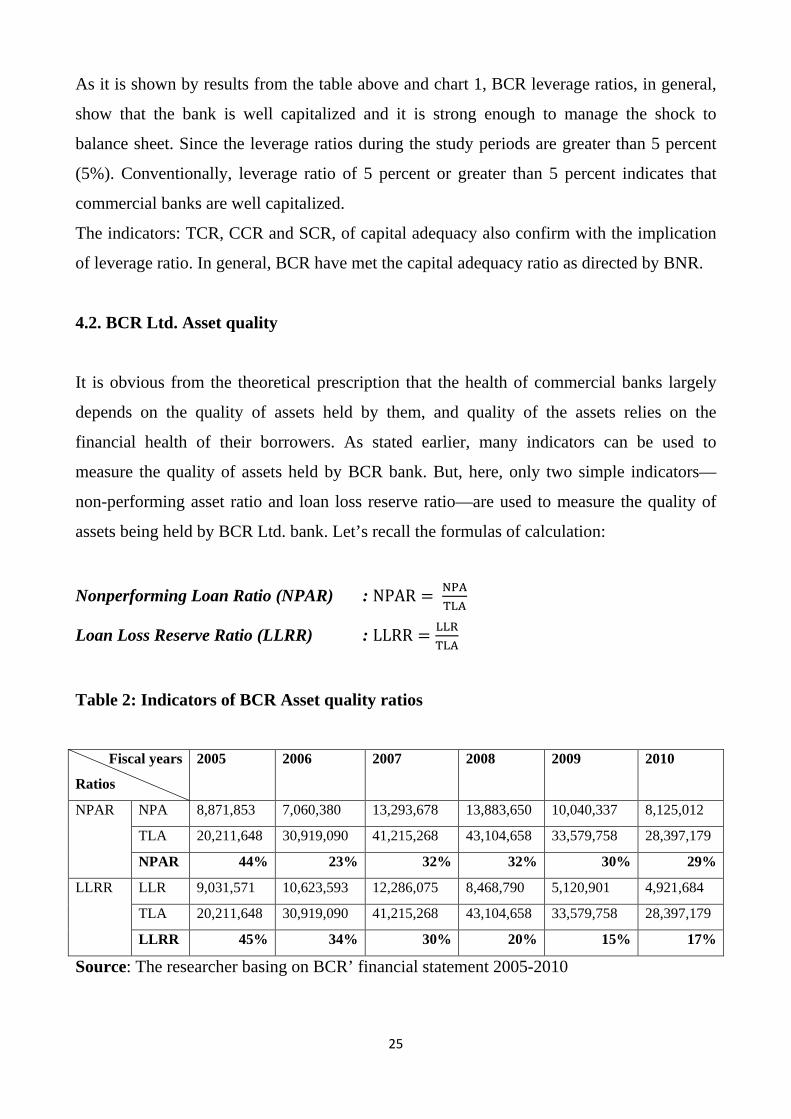
Chart 2: Asset quality ratios evolution
Source: The researcher basing on results of table 1.
The increasing trend of these ratios shows the deteriorating quality of commercial bank
assets. In general, 5 percent to 10 percent of non-performing assets is considered as
satisfactory level of quality of bank assets,
Therefore, as it is shown by the table and chart above, the ratios are represented from 2005
to 2010, respectively 44%, 23%, 32, 32%, 30% and 29% which implies that percent of BCR
Ltd. non-performing assets as a whole tends to decrease in the latter fiscal years, and they
are satisfactory. The satisfactory level of nonperforming assets in the total assets of BCR
Ltd as a whole is mainly due to the percent of non-performing assets.
BCR Ltd Nonperforming assets on the average are at satisfactory level, and the ratios
indictors show that BCR is improving the quality of its assets year by year. Overall, both
NPAR and LLRR imply the sound financial health of the bank is in good conditions. 4.3. BCR Ltd. Management quality
Sound management is key to the performance of any organizations but is difficult to
measure. It is primarily a qualitative factor applicable to individual institutions. As
discussed earlier, several indicators can jointly serve as an indicator of management
0%
5%
10%
15%
20%
25%
30%
35%
40%
45%
50%
2005 2006 2007 2008 2009 2010
Ratio
in %
Years
NPAR
LLRR
26
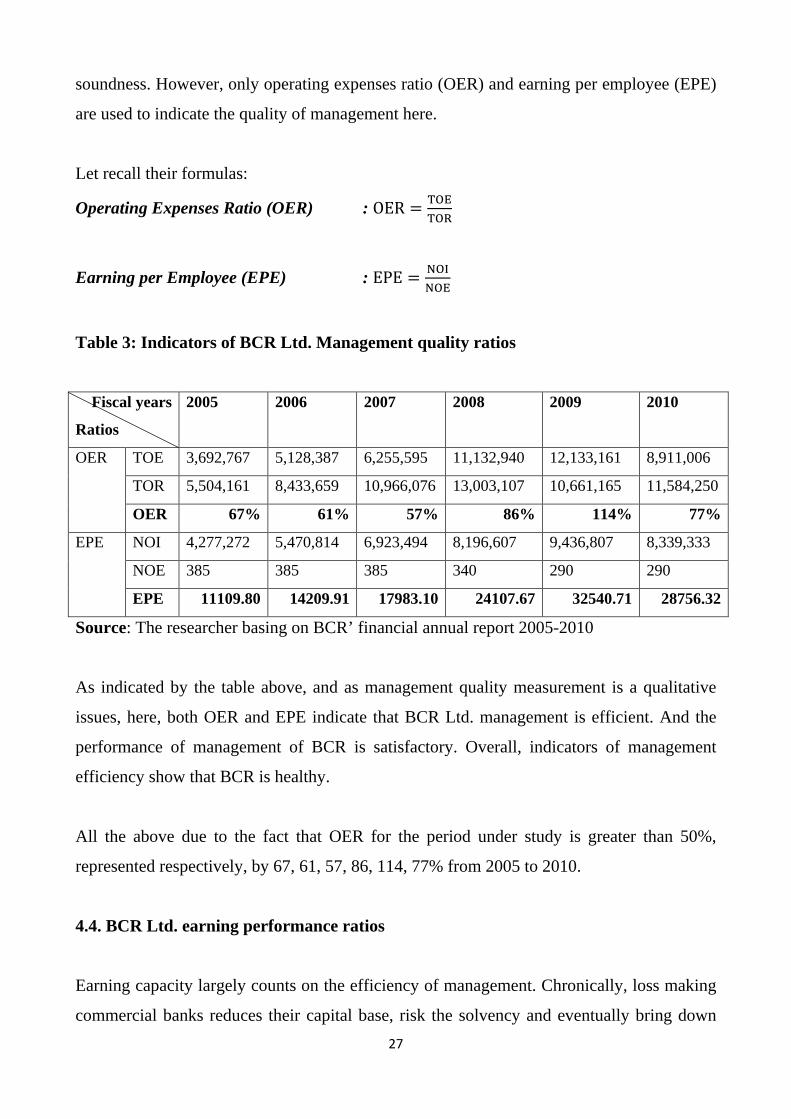
soundness. However, only operating expenses ratio (OER) and earning per employee (EPE)
are used to indicate the quality of management here.
Let recall their formulas:
Operating Expenses Ratio (OER) : OER = TOETOR
Earning per Employee (EPE) : EPE = NOINOE
Table 3: Indicators of BCR Ltd. Management quality ratios
Fiscal years
Ratios
2005 2006 2007 2008 2009 2010
OER TOE 3,692,767 5,128,387 6,255,595 11,132,940 12,133,161 8,911,006
TOR 5,504,161 8,433,659 10,966,076 13,003,107 10,661,165 11,584,250
OER 67% 61% 57% 86% 114% 77%
EPE NOI 4,277,272 5,470,814 6,923,494 8,196,607 9,436,807 8,339,333
NOE 385 385 385 340 290 290
EPE 11109.80 14209.91 17983.10 24107.67 32540.71 28756.32
Source: The researcher basing on BCR’ financial annual report 2005-2010
As indicated by the table above, and as management quality measurement is a qualitative
issues, here, both OER and EPE indicate that BCR Ltd. management is efficient. And the
performance of management of BCR is satisfactory. Overall, indicators of management
efficiency show that BCR is healthy.
All the above due to the fact that OER for the period under study is greater than 50%,
represented respectively, by 67, 61, 57, 86, 114, 77% from 2005 to 2010.
4.4. BCR Ltd. earning performance ratios
Earning capacity largely counts on the efficiency of management. Chronically, loss making
commercial banks reduces their capital base, risk the solvency and eventually bring down 27
the wealth of their shareholders. Conversely, constantly profit making banks add equity to
the total capital fund, reduce the risk of insolvency, and finally increase the wealth of their
shareholders.
So, earning capacity is one of the indicators of the sound health of a commercial bank.
Though different indicators can be used to measure the profitability of banks, ROE, ROA
and PM are used in this study.
Let’s recall their formulas:
Return on Equity (ROE) : ROE = NISE
Return on Assets (ROA) : ROA = NITA
Profit Margin (PM) : PM = NITOR
Table 4: Indicators of BCR Ltd. earning performance ratios
Fiscal years
Ratios
2005 2006 2007 2008 2009 2010
ROE NI 1,043,045 2,115,942 3,115,611 897,903 859,137 2,628,524
SE 4,663,706 6,394,775 8,789,293 8,073,814 8,928,290 10,828,938
ROE 22% 33% 35% 11% 10% 24%
ROA NI 1,043,045 2,115,942 3,115,611 897,903 859,137 2,628,524
TA 49,690,692 74,212,589 101,319,307 88,233,802 101,037,632 84,616,944
ROA 2% 3% 3% 1% 1% 3%
PM NI 1,043,045 2,115,942 3,115,611 897,903 859,137 2,628,524
TOE 3,692,767 5,128,387 6,255,595 11,132,940 12,133,161 8,911,006
PM 28% 41% 50% 8% 7% 29%
Source: The researcher basing on BCR’ financial statement 2005-2010
28
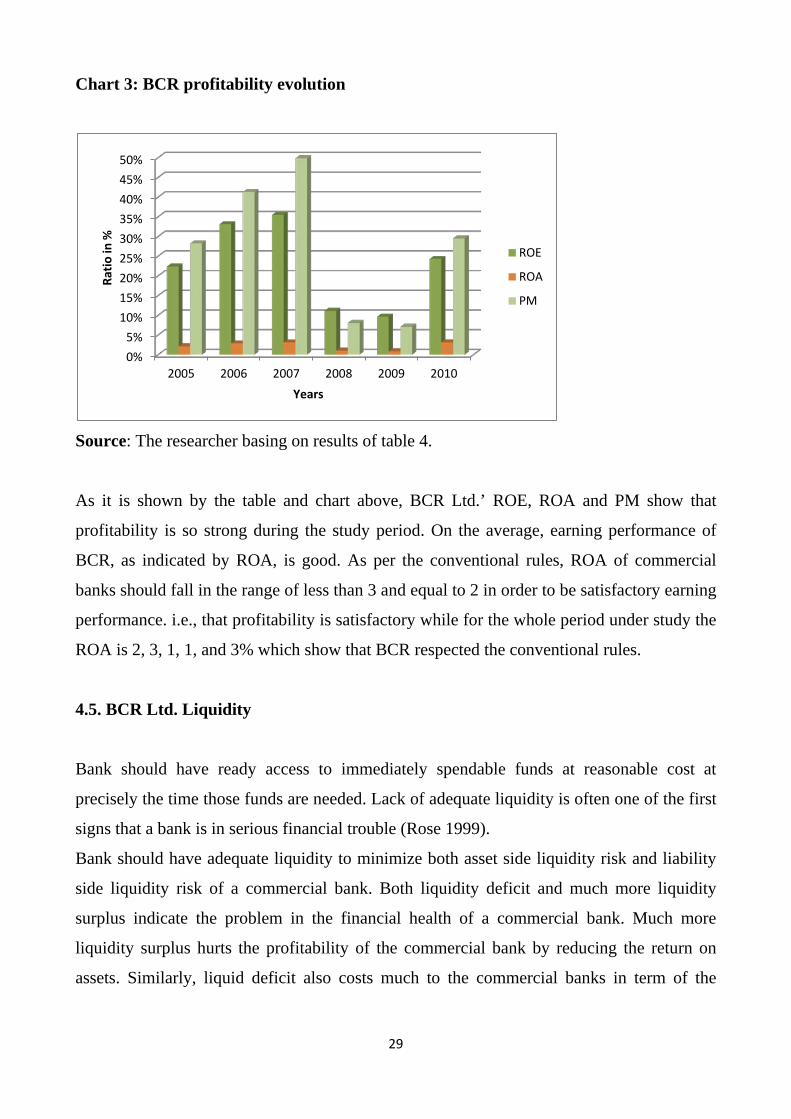
Chart 3: BCR profitability evolution
Source: The researcher basing on results of table 4.
As it is shown by the table and chart above, BCR Ltd.’ ROE, ROA and PM show that
profitability is so strong during the study period. On the average, earning performance of
BCR, as indicated by ROA, is good. As per the conventional rules, ROA of commercial
banks should fall in the range of less than 3 and equal to 2 in order to be satisfactory earning
performance. i.e., that profitability is satisfactory while for the whole period under study the
ROA is 2, 3, 1, 1, and 3% which show that BCR respected the conventional rules.
4.5. BCR Ltd. Liquidity
Bank should have ready access to immediately spendable funds at reasonable cost at
precisely the time those funds are needed. Lack of adequate liquidity is often one of the first
signs that a bank is in serious financial trouble (Rose 1999).
Bank should have adequate liquidity to minimize both asset side liquidity risk and liability
side liquidity risk of a commercial bank. Both liquidity deficit and much more liquidity
surplus indicate the problem in the financial health of a commercial bank. Much more
liquidity surplus hurts the profitability of the commercial bank by reducing the return on
assets. Similarly, liquid deficit also costs much to the commercial banks in term of the
0%5%
10%15%20%25%30%35%40%45%50%
2005 2006 2007 2008 2009 2010
Ratio
in %
Years
ROE
ROA
PM
29
higher purchasing price of liquidity and hurt in the reputation of the banks. Therefore,
commercial banks should strike the trade-off between the profitability and liquidity risk.
As stated earlier in theoretical prescription, BCR uses total loan to total deposit ratio (LDR),
cash and equivalents to total assets ratio (CETAR), cash and equivalents to total deposit
ratio (CETDR), and cash balance to total deposit ratio (CBR) to measure its liquidity
position.
Let’s recall their formulas:
Loan to Deposit Ratio (LDR) : LDR = TLATD
Cash and Equivalent to Total Asset Ratio (CETAR) : CETAR = CETA
Cash and Equivalent to Total Deposit (CETDR) : CETDR = CETD
Cash Balance to Total Deposit Ratio (CBR) : CBR = CBTD
Table 5: Indicators of BCR Ltd. liquidity ratios
Fiscal years
Ratios
2005 2006 2007 2008 2009 2010
LDR TLA 20,211,648 30,919,090 41,215,268 43,104,658 33,579,758 28,397,179
TD 34,894,043 54,697,213 80,447,943 80,915,321 63,584,445 62,977,964
LDR 58% 57% 51% 53% 53% 45%
CETAR CE 21,468,773 36,177,487 52,006,692 42,702,856 40,238,583 42,704,461
TA 49,690,692 74,212,589 101,319,307 88,233,802 101,037,632 84,616,944
CETAR 43% 49% 51% 48% 40% 50%
CETDR CE 21,468,773 36,177,487 52,006,692 42,702,856 40,238,583 42,704,461
TA 49,690,692 74,212,589 101,319,307 88,233,802 101,037,632 84,616,944
CETDR 43% 49% 51% 48% 40% 50%
CBR CB 11,260,698 18,948,232 20,229,980 22,243,190 18,247,163 13,595,995
TD 34,894,043 54,697,213 80,447,943 80,915,321 63,584,445 62,977,964
CBR 32% 35% 25% 27% 29% 22%
Source: The researcher basing on BCR’ financial statement 2005-2010
30
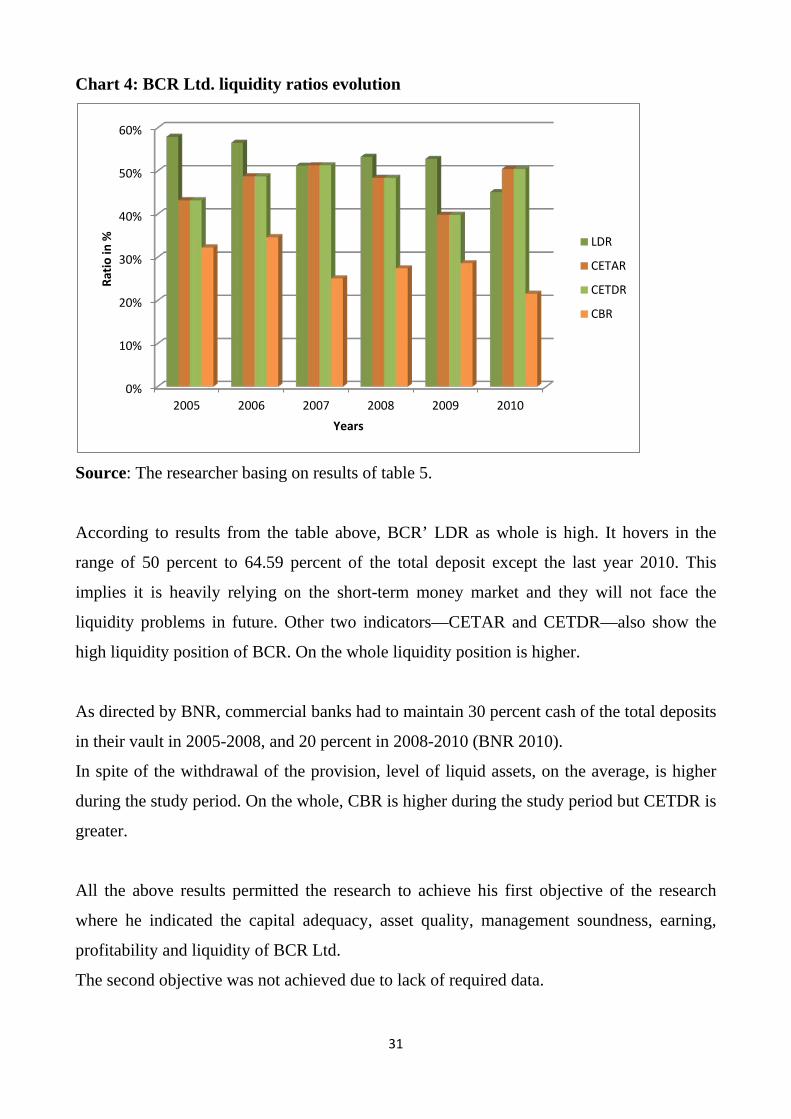
Chart 4: BCR Ltd. liquidity ratios evolution
Source: The researcher basing on results of table 5.
According to results from the table above, BCR’ LDR as whole is high. It hovers in the
range of 50 percent to 64.59 percent of the total deposit except the last year 2010. This
implies it is heavily relying on the short-term money market and they will not face the
liquidity problems in future. Other two indicators—CETAR and CETDR—also show the
high liquidity position of BCR. On the whole liquidity position is higher.
As directed by BNR, commercial banks had to maintain 30 percent cash of the total deposits
in their vault in 2005-2008, and 20 percent in 2008-2010 (BNR 2010).
In spite of the withdrawal of the provision, level of liquid assets, on the average, is higher
during the study period. On the whole, CBR is higher during the study period but CETDR is
greater.
All the above results permitted the research to achieve his first objective of the research
where he indicated the capital adequacy, asset quality, management soundness, earning,
profitability and liquidity of BCR Ltd.
The second objective was not achieved due to lack of required data.
0%
10%
20%
30%
40%
50%
60%
2005 2006 2007 2008 2009 2010
Ratio
in %
Years
LDR
CETAR
CETDR
CBR
31
CHAPTER FIVE: SUMMARY OF FINDINGS, CONCLUSION AND SUGGESTIONS
SUMMARY OF FINDINGS, CONCLUSION AND SUGGESTIONS
5.1. Summary of the major findings
Carrying out the study entitled “Impact of financial analysis in a commercial bank’ health
check up in framework of CAMELS, Case study of BCR Ltd (2005-2010)” the following
findings qualified as ‘major’ acquired the researchers’ attention:
While Health check up of the banking and finance industry plays a significant role in
determining financial stability of any country, analysis of financial health of BCR Ltd. bank
was carried out in the framework of CAMEL. And indicators of each component of
CAMEL have been used according to the financial data disclosed in annual reports.
Leverage ratio, core capital ratio, total capital ratio and supplementary capital ratio are used
as the indicators of capital adequacy of a financial institution, Case of BCR Ltd. And it has
been found that leverage ratios, in general, show that the bank is well capitalized and it is
strong enough to manage the shock to balance sheet.
The health of commercial banks largely depends on the quality of assets held by them, and
quality of the assets relies on the financial health of their borrowers. As stated earlier, many
indicators can be used to measure the quality of assets held by BCR bank. But, in this study
only two simple indicators: non-performing asset ratio and loan loss reserve ratio.
Sound management is a key to the performance of any organizations but is difficult to
measure. It is primarily a qualitative factor applicable to individual institutions. However,
only operating expenses ratio (OER) and earning per employee (EPE) were used to indicate
the quality of management in this study.
Earning capacity largely counts on the efficiency of management. Earning capacity as one
of the indicators of the sound health of a commercial bank, though different indicators used
32
to measure the profitability of banks would have been applied but for the case of this study
ROE, ROA and PM were used.
Lack of adequate liquidity is often one of the first signs that a bank is in serious financial
trouble. Both liquidity deficit and much more liquidity surplus indicate the problem in the
financial health of a commercial bank. While for the case of this study, total loan to total
deposit ratio (LDR), cash and equivalents to total assets ratio (CETAR), cash and
equivalents to total deposit ratio (CETDR), and cash balance to total deposit ratio (CBR)
were used to measure BCR Ltd. liquidity position.
Regarding the second objective of this study, while looking for data for BCR’ market price
of financial instruments and credit ratings for the period from 2005-2010 calculation the
researcher did not find them.
5.2. Conclusion
The importance of findings of this research was to address the specific objectives of the
study and results are as follow:
For BCR’ capital adequacy, the leverage ratios during the study periods are greater than 5
percent (5%) whereas conventionally, leverage ratio of 5 percent or greater than 5 percent
indicates that commercial banks are well capitalized. And as the indicators: TCR, CCR and
SCR, of capital adequacy confirmed with the implication of leverage ratio that BCR have
met the capital adequacy ratio as directed by BNR.
For the BCR’ quality assets, the non-performing asset ratio and loan loss reserve ratio, while
in general, 5 percent to 10 percent of non-performing assets is considered as satisfactory
level of quality of bank assets, results showed that BCR Ltd. non-performing assets as a
whole tends to decrease in the latter fiscal years, and the satisfactory level of nonperforming
assets in the total assets of BCR Ltd as a whole is mainly due to the percent of non-
performing assets. So, overall, both NPAR and LLRR implied that the sound financial
health of the bank is in good conditions. 33
While assessing the Management quality it was found that the performance management of
BCR is satisfactory, due to the indicators of management efficiency which show that BCR
is healthy, also due to the fact that OER (operating expenses ratio) for the period under
study is greater than 50%.
For the BCR earnings capacity, on the average, earning performance of BCR, as indicated
by ROA, is good while, as per the conventional rules, ROA of commercial banks should fall
in the range of less than 3 and equal to 2 in order to be satisfactory earning performance,
that profitability is satisfactory for the whole period under study the ROA is 2, 3, 1, 1, and
3% which show that BCR respected the conventional rules.
BCR’ LDR as whole is high. It hovers in the range of 50 percent to 64.59 percent of the
total deposit except the last year 2010. The two indicators—CETAR and CETDR—also
show the high liquidity position of BCR, while as directed by BNR, commercial banks had
to maintain 30 percent cash of the total deposits in their vault in 2005-2008, and 20 percent
in 2008-2010 (BNR 2010). In spite of the withdrawal of the provision, level of liquid assets,
on the average, is higher during the study period.
For BCR’ market price of financial instruments and credit ratings for the period from 2005-
2010 calculations, the researcher did not find the data required to calculate them, and like
that, the second objective of the present study, was not achieved.
5.3. Recommendations
According to the findings of this study and results obtained, the researcher recommends the
following:
To BNR, the Rwandan Central bank, to propose the uniformly systems for the whole
country’ banks and all financial institutions; like CAMELS to check up their daily life. And
Fix the rate of each CAMELS indicator’s ratio.
34
To BCR Ltd., the researcher recommended that, it should facilitate the access more data and
give detailed data to finalists’ students while carrying out research to the bank.
5.4. Suggestions for further studies
For further research, it is recommended that the following topics may be considered:
• Financial institutions health checks up in framework of CAMELS, in Rwanda. Case
of BNR.
• The performance and contribution of CAMEL in financial institution objectives
achievement.
35

BIBLIOGRAPHY
1. Books
1. Decenzo and Stephen p Robbins (1988) personnel/human resource management 3rd
edition prentice –hall inc Englewood.
2. Evan, Owns and others. 2000. "Macroprudential Indicators of Financial System
Soundness."Occasional Paper 192. Washington DC: International Monetary Fund.
3. Hessler Richard M. (1989), Social research methods, USA.
4. Hilbers, Paul, Russell Krueger, and Marina Moretti. 2000. New Tools for Assessing
Financial System Soundness. Finance and Development 37 :8-12
5. McNally, Edward A. 1996. "Basic Topics in Sound Bank Management." EDI Working
Paper, Washington DC: The World Bank.
6. Roger moores (1993) managing for higher performance.
7. Rogers bennette (1997) employee relations 2nd edition, p w s –kent publishing company
USA.
8. Saunders, Anthony and Marcia Millon Cornett. 2004. Financial Markets and
Institutions. New Delhi: Tata McGraw-Hill Publishing Company Limited.
2. Reports
1. BNR (2012), monetary policy and financial stability statement.
2. ADB (2002), Guidelines for the Financial Governance and Management of Investment
Projects Financed by the ADB. Manila: ADB.
3. Electronics references
1. Gilbert, R. Alton, Andrew P. Meyer and Mark D.Vaughan. 2000. "The Role of a CAMEL
Downgrade Model in Bank Surveillance." Working Paper 2000-021A, the Federal
Reserve Bank of St. Louis. Nov. 1, 2005 (http://research.stlouisfed.org/wp/2000/2000-
021.pdf).
2. http://fic.wharton.upenn.edu/fic/papers/95/9511b.pdf, accessed in August 2012.
36
3. http://fsi.imf.org/misc/FSI%20Concepts%20and%20Definitions.pdf, accessed in August
2012.
4. http://objectguild.com/financial-statement-analysis/importance-of-economic-and-
financial-analysis-for-decision-making/, accessed in August 2012.
5. http://pdf.usaid.gov/pdf_docs/PNADQ079.pdf, accessed in August 2012.
6. http://www.bis.org/ifc/publ/ifcb33n.pdf, accessed in August 2012.
7. http://www.businessdictionary.com/definition/financial-analysis.html#ixzz225L9Q8o8,
accessed in August 2012.
8. http://www.fdicoig.gov/reports02/02-033.pdf, accessed in August 2012.
9. http://www.imf.org/external/np/sta/fsi/eng/2003/051403bp.pdf, accessed in August
2012.
10. http://www.investopedia.com/terms/c/camelrating.asp, accessed in August 2012.
11. http://www.investopedia.com/terms/f/financial-analysis.asp#ixzz225GRMo1X, accessed
in August 2012.
12. http://www.kesdee.com/pdf/financialanalysis.pdf, accessed in August 2012.
13. http://www.mixmarket.org/sites/default/files/medialibrary/10011.150/CAMEL.pdf,
accessed in August 2012.
37

APPENDICES
38