Embed Size (px)
Citation preview
Proc. Nat!. Acad. Sci. USAVol. 91, pp. 5725-5729, June 1994Physiology
Membrane repolarization stops caffeine-induced Ca2+ release inskeletal muscle cells
(exctation-contraction coupfilg/sarcoplasmic reticulum/Ca2+-induced Ca2+ relese/patch camp/fura-2)
NORIO SUDA* AND REINHOLD PENNERMax-Planck-Institut fMr biophysikalische Chemie, Am Fassberg, 37077 Gdttingen, Germany
Communicated by E. Neher, January 31, 1994
ABSTRACT We have combined the patch-lamp tech-nique with fura-2 measurements to investigate whether theCa2+-induced Ca2+-release channel is under the control ofmembrane potential in rat skeletal myoballs. We report thatCa2+ release induced by 10 mM caffeine is turned off bymembrane repolarization, a phenomenon that we term RISC(repolarization-induced stop of Ca2+ release). The RISC phe-nomenon is voltage- and time-dependent. It is evident onlywhen the release channels are first transferred into a function-ally "voltage-activated" state through membrane depolariza-tion. The results demonstrate that membrane repolarizationactively closes the caffeine-activated release channels and sug-gest that the ryanodine receptor is actually the physiologicaldepolarization-induced Ca2+-release channel. Thus, our dataprovide compelling evidence for a bidirectional voltage control(depolarization and repolarization) ofthe Ca2+-release channelin the sarcoplasmic reticulum by a voltage sensor in thetransverse tubule membrane.
In skeletal muscle cells, depolarization of the transverse (T)tubular system induces Ca2+ release from the sarcoplasmicreticulum (SR), the internal Ca2+ store. The Ca2+ releasedfrom the SR causes muscle contraction (1). This initial stepof skeletal muscle excitation-contraction coupling does notseem to require second messengers such as calcium (2-8) orinositol 1,4,5-trisphosphate (9). It is not yet clear, however,how a change in potential across the T-tubule membraneleads to the release of Ca2+ from the SR. It is unlikely thatphysiological Ca2+ release is activated directly by the poten-tial change across the SR membrane (10, 11). The currentnotion about this process is that the dihydropyridine receptor(DHPR), located in the T-tubular membrane, senses a changein membrane voltage and undergoes a molecular rearrange-ment that is postulated to directly gate the Ca2+-releasechannel in SR membrane (12-16). Consistent with this is theexistence ofvoltage-dependent intramembrane charge move-ment (12, 13).The Ca2+-release channel protein has been purified as the
ryanodine receptor (RyR) (17, 18) and morphologically iden-tified with the "foot" structures (19), which span the junc-tional gap between the SR and T-tubule membranes. Studiesin skinned fibers (5, 20-22), fragmented SR vesicles (23, 24),and reconstituted RyR in lipid bilayer membranes (17, 25, 26)have shown that the Ca2+-release channel can be activated byan increase in cytoplasmic free Ca2+ (Ca2+-induced Ca2+release, CICR). However, there is no strict functional evi-dence that the CICR channel protein (RyR) functions as thephysiological depolarization-gated Ca2+-release channel.Therefore, it is possible to hypothesize that there exist twodifferent types of Ca2+-release channels in skeletal musclecells, the depolarization-induced Ca2+ release (DICR) chan-
nel and the CICR channel (27). In the case of cardiac musclecells, there seems to be no direct communication between thevoltage sensors and the CICR channels (28).
Caffeine is known to potentiate CICR such that restingintracellular Ca2+ concentration ([Ca2W]j) triggers Ca2+ re-lease from the SR (5, 20, 22). It is well established that the siteof action of caffeine is at the RyR (29). The present studyshows that Ca2+ release induced by caffeine is curtailed bymembrane repolarization, a phenomenon that we term RISC(repolarization-induced stop of Ca2+ release). The RISC isvoltage- and time-dependent and seems to occur only whenthe release channels are functionally in a "voltage-activated"state, suggesting that the release channel is under bidirec-tional voltage control of a voltage sensor and that the RyR isindeed the physiological DICR channel.
METHODS
Primary cultures of rat skeletal myoblasts were preparedfrom forelimbs and hindlimbs of newborn rats (1-3 days old)by slightly modifying the procedure of Beam and Knudson(30). Two to 3 days after fusing the myoblasts to form themyotubes, 25 nM colchicine was added for 2 days to obtainround cells (20-100 am in diameter), which were viable forelectrophysiological experiments for up to 2 weeks. Com-bined patch-clamp (31) and fura-2 [Ca2+]i measurements (32)were performed using a computer-controlled data acquisitionsystem (EPC-9). The tight-seal whole-cell configuration wasused to control membrane voltage, and liquid junction po-tential correction (8 mV) was made before seal formation.Experiments were performed at 20-250C in standard salinesolution (145 mM NaCl/2-5 mM CaCl2/1 mM MgCl2/11 mMglucose/10 mM Hepes-NaOH/10 mM tetraethylammoniumchloride, pH 7.2). Sylgard-coated patch pipettes had resis-tances between 1.5 and 2 MO after filling with internalsolution (solution 1; 145 mM cesium glutamate/6 mM NaCl/0.1 mM fura-2/1 mM NaATP/7 mM MgATP/10mM Hepes-CsOH, pH 7.2). The free Mg2+ concentration was calculatedto be -0.6 mM, assuming an apparent affinity of 6.9 x 10³M-1 for Mg2+ to ATP (33). In some experiments, the follow-ing solutions were used: 145 mM cesium glutamate, 6 mMNaCl, 0.1 mM fura-2, 5 mM MgATP, 1 mM MgCl2, 10 mMHepes-CsOH, pH 7.2 (solution 2) and 145 mM cesiumglutamate, 6mM NaCl, 0.1mM fura-2, 8mM MgATP, 10mMHepes-CsOH, pH 7.2 (solution 3; intracellular Mg2+ con-centration --1 mM). These solutions did not alter the generalobservations described here. In some experiments, the con-
Abbreviations: [Ca2+]j, intracellular Ca2+ concentration; SR, sarco-plasmic reticulum; T, transverse; CICR, Ca2+-induced Ca2+ release;DICR, depolarization-induced Ca2+ release; DHPR, dihydropyri-dine receptor; RyR, ryanodine receptor; RISC, repolarization-induced stop of Ca2+ release.*Permanent address: Department of Physiology, Jikei UniversitySchool of Medicine, 3-25-8 Nishishinbashi, Minato-ku, Tokyo 105,Japan.
5725
The publication costs of this article were defrayed in part by page chargepayment. This article must therefore be hereby marked "advertisement"in accordance with 18 U.S.C. §1734 solely to indicate this fact.
5726 Physiology: Suda and Penner
centration of fura-2 was increased to 0.2-4.0 mM, as indi-cated in the text or figure legends. Caffeine application wasmade by local ejection from wide-tipped pipettes. Thesepipettes contained 10 mM caffeine in nominally calcium-freesaline solution in which Ca2+ was replaced by an equimolarconcentration of Mg2+. [Ca2+]i was monitored with a photo-multiplier-based system where two fluorescence intensities(emission measured at 500 nm, excitation at 360 nm and 390nm) were sampled at 2-5 Hz by a computer-driven chartingprogram. An in situ calibration was made to estimate absolutevalues of [Ca2+]1 as described (34). We used bis(2-aminophenoxy)ethane-N,N,N1,N1-tetraacetate (BAPTA)for adjusting [Ca2+]i in the calibration solutions, assuming adissociation constant of 225 nM.
RESULTS AND DISCUSSIONCa2+ Release Induced by Depolarization and Caffeine. In
skeletal muscle cells, membrane depolarization induces Ca2+release from the SR (DICR). In Fig. 1A, we applied long-lasting (10 s) depolarizing pulses from a holding potential of-70 mV to four different test potentials. Upon depolariza-tion, a rapid increase in [Ca2+]i occurred, which was followedby a gradual decrease in [Ca2+]i. This transient increase in[Ca2+]i is due predominantly to release of Ca2+ from the SR,because removing extracellular Ca2+ (n = 7) or blocking Ca2+channels with 0.5 mM La3+ (n = 3) did not significantly affect[Ca2+]i changes induced by membrane depolarization (15,35). Furthermore, Ca2+ release also occurs close to the
A+
-70mV -30 -10 +10
B
-20 mV -20 mV-70 mV F1J- 0
0.4/ IN _afenI--30 s F caffeine-
caffeine
-20 mV
I caffeine
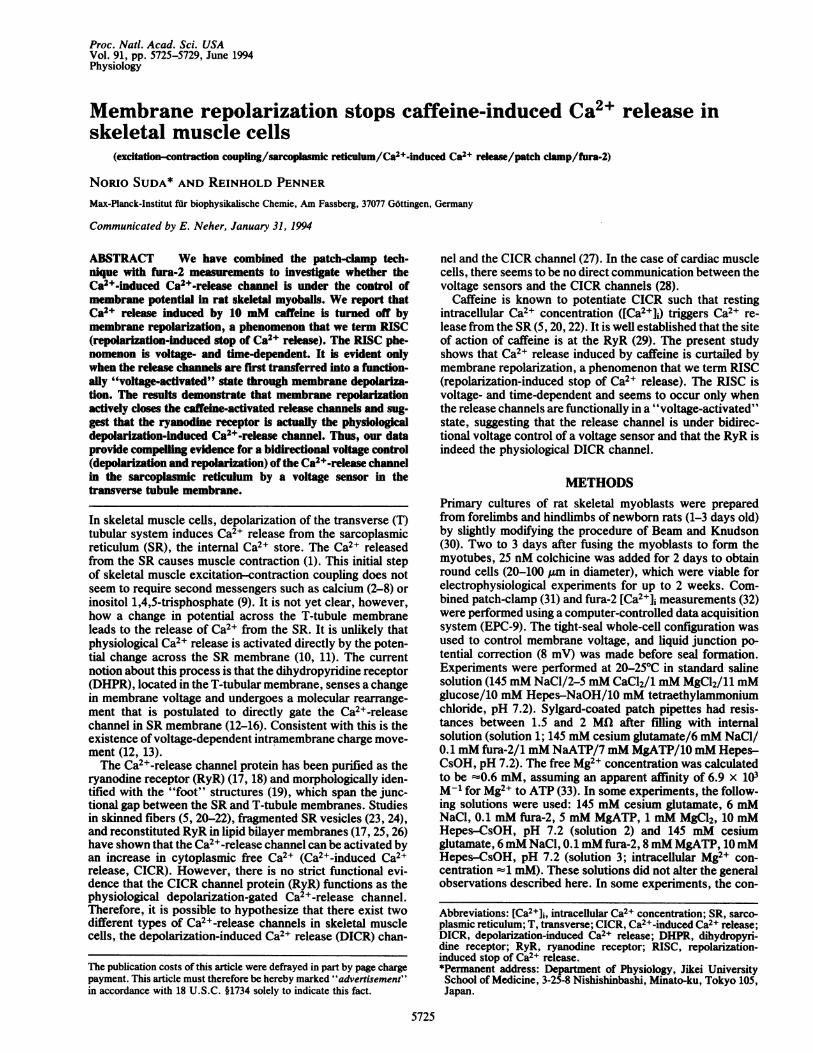
FIG. 1. Repolarization-induced stop of caffeine-induced Ca2+release (RISC). Data shown are representative of a total of 12 (A), 4(B), and 22 (C) experiments. In all cases, caffeine was applied innominally Ca2+-free saline (internal solution 1). (A) DICR at fourdifferent depolarizing pulses of 10-s duration. The upper traceindicates membrane potential change (in mV). The lower tracerepresents changes in [Ca2+]i in response to membrane depolariza-tion. Note that the falling phase of [Ca2+]j becomes steeper at higherpotentials. The cell was bathed in standard saline solution (in thiscase, the extracellular Ca2+ concentration was 3 mM). (B) Caffeine-induced Ca2+ release at different membrane potentials. Data weretaken from the same cell and were superimposed by aligning theinitial rising phase of [Ca2+]1. Caffeine (10 mM) was applied duringthe time indicated. (C Left) Depolarization-induced Ca2+ release at-20 mV. (C Center) Caffeine-induced Ca2+ release during long-lasting depolarization. The cell was first depolarized to -20 mV, andthen 10 mM caffeine was applied while keeping the membranedepolarized. Note that [Ca2+]i remained at a higher level in thecontinuous presence of caffeine. After stopping the application ofcaffeine, [Ca2+]i rapidly returned to the resting level. (C Right)Repolarization-induced stop of caffeine-induced Ca2+ release. Thesame protocol as in C Center was used except that repolarization wasperformed 30 s after depolarization. Note that [Ca2+]1 abruptlydropped upon membrane repolarization despite the continuous pres-ence of caffeine (indicated by the arrow).
reversal potential of Ca2+ currents (+80 mV), where Ca2+influx is negligible.The shape and amplitude of the [Ca2+], changes varied
somewhat from cell to cell, possibly due to differences in theexpression level of RyR during cell culture (35), differentlevels of fura-2 concentration during intracellular perfusion(36, 37), and/or the filling state of the SR (5). Essentially,however, [Ca2+]i transients were clearly dependent on volt-age and became steeper in both rising and falling phases athigher depolarizing potentials. The threshold potential forinducing Ca2+ release was invariably between -40 and -50mV. Even during maintained depolarizations, [Ca2+]i de-cayed to resting levels, possibly due to inactivation of DH-PRs (13), Ca2+-dependent inactivation of Ca2+ release (7, 8,38), increased Ca2+ removal (acceleration of SR Ca2+ pump-ing activity) (5), decreased levels of Ca2+ in the SR (5), etc.However, some Ca2+-release activity appears to be main-tained during depolarization, since repolarization acceleratedthe decay of [Ca2WJi (39), as seen, for example, in Fig. 1A(-30 to +10 mV depolarizations).Ca2+ release from the SR can also be activated by the CICR
mechanism, and caffeine is a well-known potentiator of thisprocess (5, 20, 22). When the holding potential was increasedfrom -70 mV to different values slowly enough to inactivatevoltage sensors, there was no DICR, but caffeine could stillinduce Ca2+ release at any potential. Fig. 1B shows that withthis protocol, the shape and the amplitude of [Ca2W]i changesinduced by 10 mM caffeine were independent of the mem-brane potential. The threshold concentration for caffeine-induced Ca2+ release was -2 mM. The onset of caffeineresponses varied from cell to cell, possibly depending onfactors such as different expression levels or sensitivities ofRyR to caffeine, the filling-state of the SR, and/or different[Ca2+]i levels.Repolarization Stops Caffeine-Induced Ca2+ Release
(RISC). To investigate interactions between the voltage sen-sor and the CICR channel, we designed experiments in whichmembrane potential was changed during the caffeine tran-sient (Fig. 1C). Fig. 1C Left shows a control [Ca2W]i changeinduced by -20 mV depolarization for 30 s from a holdingpotential of -70 mV. In Fig. 1C Center, the cell was firstdepolarized and then 10 mM caffeine was applied during thedepolarization, causing a reopening of release channels pre-sumably by the CICR mechanism. In Fig. 1C Right, the sameprotocol as used in Fig. 1C Center was applied except that themembrane potential was repolarized to -70 mV right afterthe peak of the caffeine-induced transient. Surprisingly,[Ca2+]i abruptly dropped toward resting levels despite thecontinuous presence of caffeine. Similar results were ob-tained in 22 cells, some of which showed a complete abro-gation of Ca2+ release where [Ca2+]i fully returned to pre-caffeine levels. The onset of this reduction in [Ca2W]i wasextremely fast and occurred within 30 ms as measured in hightime-resolution recordings using single-wavelength excita-tion (data not shown).
This repolarization-induced stop of caffeine-activatedCa2+ release (RISC) is not associated with Ca2+ influxthrough Ca2+ channels, because in most cases (including Fig.1C), the caffeine solution did not contain Ca2+ and the RISCphenomenon was also observed when cells were immersed innominally calcium-free solution before application ofcaffeine(n = 2). RISC was also observed in the presence of externalCa2+ (n = 5). It is unlikely that the RISC phenomenon is dueto Na+/Ca2+ exchange since similar results were obtained inthe presence of 0.5 mM La3+, a blocker of Na+/Ca2+exchange (40) (n = 3), or in the absence of external Na+ (byreplacing the NaCl in standard solution with equimolartetraethylammonium chloride; n = 4).A simple explanation for these results is that even when
DICR is reduced 10 or 20 s after depolarization, caffeine still
Proc. Natl. Acad Sci. USA 91 (1994)
Proc. Natl. Acad. Sci. USA 91 (1994) 5727
enhances Ca2+ release from DICR channels presumably bythe CICR mechanism and that these channels are suddenlyclosed upon repolarization. This would suggest that voltagesensors directly regulate the caffeine-gated channels and thatthe caffeine-activated channel is identical with the DICRchannel.RISC Is Voltage- and Time-Dependent. Fig. 2A shows the
voltage dependence of the RISC phenomenon using threedifferent long-lasting depolarizing pulses (-40, 0, and +20mV). In this experiment, RISC was clearly observed at 0 mVbut was not very prominent at -40 and +20 mV (Fig. 2A).Similar results were obtained in 11 other cells. The mosteffective depolarizing potential for RISC varied from cell tocell, ranging from -30 to 0 mV. This suggests that the releasechannels respond to repolarization only when the voltagesensors have transferred them into a functionally voltage-activated state and the voltage sensors are still responsive torepolarization at the time when the cell is repolarized. Thatis, the release channels may be effectively activated above-30 mV and still be sensitive to membrane repolarizationafter long-lasting depolarization, whereas they might not besufficiently activated below -40 mV. With stronger depo-larizations, release channels might again be unresponsive tovoltage at the time when the cell is repolarized, presumablydue to a faster and more complete inactivation of the voltagesensors during long-lasting depolarizations.
A -40 mV 0 mV +20 mV-70 mV a
0.5 AMIcfinl 1o f in caffeine
B +20 mV +20 mV +20 mV-70 mV LJ_'--- - L
0.5MIM _ I__ I___caff. 10 S caffeine caffeine
C -2OmV +60 mV DC -20mVl D-70 mV -70 mV-7150mV
0.5 AM1-0.5 M| A--Lcaff. 30 s caff. 20 caffeine]
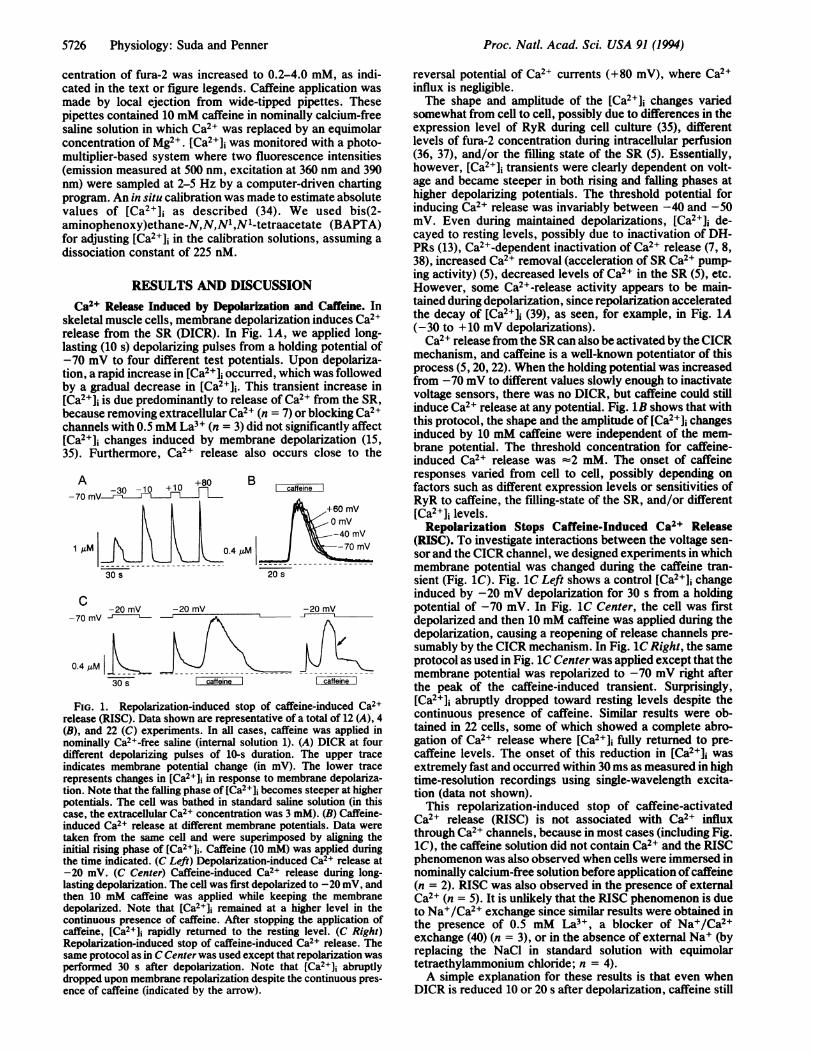
FIG. 2. Voltage and time dependence of RISC after long-lastingdepolarizations. (A) Voltage dependence of RISC. The upper tracescorrespond to membrane potential, and the lower traces correspondto [Ca2+]i changes obtained from a single cell representative of 12cells. The cell was first depolarized to three different potentials (-40,0, +20 mV), and then 10 mM caffeine was applied during the timeindicated to match the time of repolarization with that of the peak ofcaffeine response. Note that RISC is clearly observed at 0 mV(indicated by the arrow), while it is not prominent at -40 and +20mV(internal solution 1). (B) Time-dependent inactivation of RISC. Thesame cell as used in A was used, which is representative of 11 cells.The cell was depolarized to the same potential (+20 mV) but withdifferent durations. Note that the time course of the decay of [Ca2+]iupon repolarization is slowed as the duration of the depolarizingpulse is prolonged. The half-decay times of [Ca2+]i after repolariza-tion were 0.8 s (Left), 1.2 s (Center), and 5.5 s (Right). (C) RISC isnot dependent on the size of caffeine transient but exclusively onvoltage. The same protocol as used in B was used. RISC is observedat -20 mV (indicated by the arrow), while itis not pronounced at +60mV, despite the smaller caffeine transient (internal solution 1). (D)Simple hyperpolarization does not curtail caffeine transient. Tenmillimolar caffeine was applied at a holding potential of -70 mV, andthen the cell was hyperpolarized to -150 mV (internal solution 1).
To further investigate the time dependence of the RISCphenomenon, we applied caffeine after +20 mV depolariza-tions of different duration (Fig. 2B) and repolarized themembrane at the peak of caffeine-induced Ca2+ release.Consistent with our expectations, RISC became less prom-inent with longer depolarizations (n = 11), suggesting thatlong-lasting depolarization indeed causes functional decou-pling between the voltage sensor and the release channel. Ananalogous behavior was observed in experiments in whichthe time interval between a prepulse (-20 or -30 mV) and atest pulse (0 mV) was changed. In this type ofexperiment, theamplitudes of Ca2+ transients at the test pulse decreasedfaster at prepulse potentials of -20 mV than at potentials of-30 mV (data not shown). These findings seem consistentwith the immobilization of charge movement with long-lasting depolarizations in frog skeletal muscle cells (13).Functional inactivation of the release channel by long-lastingdepolarizations has also been observed for potassium con-tractures (41).RISC showed no apparent dependence on the size of the
caffeine-induced Ca2+ transients (compare B and C in Fig. 2),suggesting that the most important determinant of the RISCphenomenon is the sudden change in membrane voltage.However, RISC requires both depolarization and subsequentrepolarization; a simple hyperpolarization does not curtailcaffeine-induced Ca2+ release, as there was no significantchange in caffeine-induced Ca2+ transients upon hyperpolar-ization to -100, -120, or -150 mV from a holding potentialof -70 mV (n = 6; Fig. 2D).To confirm that caffeine induces Ca2+ release by potenti-
ating CICR, we dialyzed cells with 1-2 mM fura-2 (n = 6).Under these strong Ca2+-buffering conditions, the regener-ative rising phase of the caffeine response was considerablyslowed, while DICR, which happens faster than the temporalresolution of our recordings (2-5 Hz), was not noticeablyaffected. However, dialyzing cells with 4 mM fura-2 pre-vented caffeine-induced Ca2+ release and also slowed andreduced the magnitude ofDICR (n = 2). Furthermore, in thepresence of20mM procaine, an inhibitor ofCICR (5), 10mMcaffeine hardly induced Ca2+ release in any state of therelease channel (n = 3).Time-Dependent Activation of RISC. Quantitative assess-
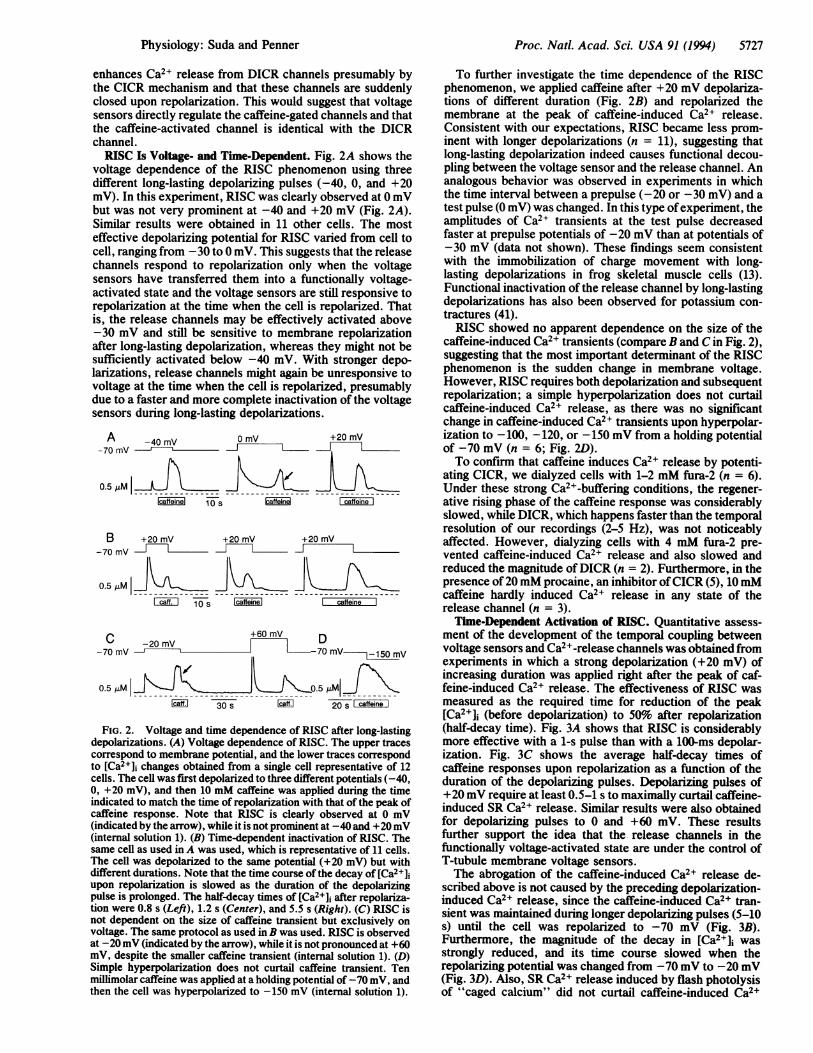
ment of the development of the temporal coupling betweenvoltage sensors and Ca2+-release channels was obtained fromexperiments in which a strong depolarization (+20 mV) ofincreasing duration was applied right after the peak of caf-feine-induced Ca2+ release. The effectiveness of RISC wasmeasured as the required time for reduction of the peak[Ca2+]i (before depolarization) to 50% after repolarization(half-decay time). Fig. 3A shows that RISC is considerablymore effective with a 1-s pulse than with a 100-ms depolar-ization. Fig. 3C shows the average half-decay times ofcaffeine responses upon repolarization as a function of theduration of the depolarizing pulses. Depolarizing pulses of+20mV require at least 0.5-1 s to maximally curtail caffeine-induced SR Ca2+ release. Similar results were also obtainedfor depolarizing pulses to 0 and +60 mV. These resultsfurther support the idea that the release channels in thefunctionally voltage-activated state are under the control ofT-tubule membrane voltage sensors.The abrogation of the caffeine-induced Ca2+ release de-
scribed above is not caused by the preceding depolarization-induced Ca2+ release, since the caffeine-induced Ca2+ tran-sient was maintained during longer depolarizing pulses (5-10s) until the cell was repolarized to -70 mV (Fig. 3B).Furthermore, the magnitude of the decay in [Ca2+]i wasstrongly reduced, and its time course slowed when therepolarizing potential was changed from -70 mV to -20 mV(Fig. 3D). Also, SR Ca2+ release induced by flash photolysisof "caged calcium" did not curtail caffeine-induced Ca2+
Physiology: Suda and Penner
5728 Physiology: Suda and Penner
A 10M-70m -lOMms
0.5 pM
Iafie1 10 scfeine
l0O 00Ms bMs /
I caffein eI n caffeine
A-70 mV V-40rmV
0.5IN| X
Icaffeine 10 S caffeine
c D omv OmV-20mV4- -70 mV
0~~~~~~05A10 I000 -------.----- ------------10 100 1000_
Depolarization time, ms caffeine 20 s caffeine
FIG. 3. (A) Time-dependent activation of RISC. Data wereobtained from the same cell (representative of seven experiments).The upper traces show membrane potential and the lower tracesshow [Ca2]i. The cell was first stimulated with 10 mM caffeineduring the time indicated to induce SR Ca2+ release. Immediatelyafter the peak [Ca2+]j, depolarizing pulses (+20 mV) with increasingdurations were applied. (Left) Control caffeine response. Note thatRISC becomes more obvious with longer duration ofthe depolarizingpulses (internal solution 1, 0.2 mM fura-2). (B) RISC is not due to SRCa2+ release but due to repolarization. Depolarizing pulses (0 mV)with long durations were applied (5 and 10 s). The resulting [Ca2+]ichanges were superimposed to match the onset of depolarization.Note that the longer pulse (10 s) sustained higher [Ca2+]i levels duringdepolarization than the shorterpulse (5 s) (internal solution 2, 0.2mMfura-2). (C) Activation curve of the time dependence of RISC. Dataare given as mean ± SEM (n = 7) obtained by the protocol illustratedin A and plotted as half-decay time of [Ca2+]j after repolarization asa function of pulse duration (internal solution 1). (D) RISC is notobserved when the repolarizing potential is set to -20 mV. (Left) Thecell was depolarized to 0 mV for 1 s after the peak of caffeinetransient and then repolarized to -70 mV. (Right) The same protocolas used in Left was used except that the repolarizing potential was-20 mV (internal solution 3, 0.2 mM fura-2).
transients; it was simply superimposed on caffeine-inducedCa2+ release (data not shown). Together, these results makeit unlikely that RISC is caused by a sudden acceleration ofSRCa2+-pump activity or depletion ofCa2+ stores. However, wecannot entirely rule out the possibility that the filling state ofthe SR may to some extent influence the RISC phenomenon.
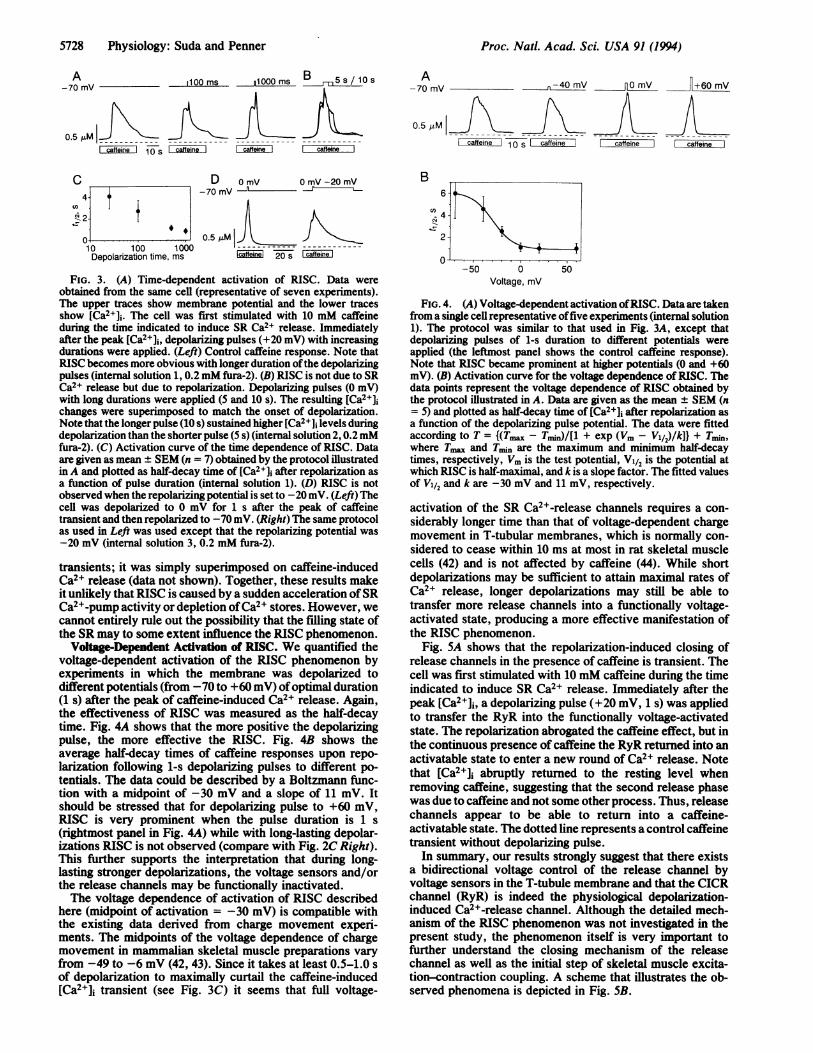
Voltage-Dependent Activation of RISC. We quantified thevoltage-dependent activation of the RISC phenomenon byexperiments in which the membrane was depolarized todifferent potentials (from -70 to +60 mV) ofoptimal duration(1 s) after the peak of caffeine-induced Ca2+ release. Again,the effectiveness of RISC was measured as the half-decaytime. Fig. 4A shows that the more positive the depolarizingpulse, the more effective the RISC. Fig. 4B shows theaverage half-decay times of caffeine responses upon repo-larization following 1-s depolarizing pulses to different po-tentials. The data could be described by a Boltzmann func-tion with a midpoint of -30 mV and a slope of 11 mV. Itshould be stressed that for depolarizing pulse to +60 mV,RISC is very prominent when the pulse duration is 1 s(rightmost panel in Fig. 4A) while with long-lasting depolar-izations RISC is not observed (compare with Fig. 2C Right).This further supports the interpretation that during long-lasting stronger depolarizations, the voltage sensors and/orthe release channels may be functionally inactivated.The voltage dependence of activation of RISC described
here (midpoint of activation = -30 mV) is compatible withthe existing data derived from charge movement experi-ments. The midpoints of the voltage dependence of chargemovement in mammalian skeletal muscle preparations varyfrom -49 to -6 mV (42, 43). Since it takes at least 0.5-1.0 sof depolarization to maximally curtail the caffeine-induced[Ca2W]i transient (see Fig. 3C) it seems that full voltage-
B6
4-42-
-50 0 50Voltage, mV
FIG. 4. (A) Voltage-dependent activation ofRISC. Data are takenfrom a single cell representative offive experiments (internal solution1). The protocol was similar to that used in Fig. 3A, except thatdepolarizing pulses of 1-s duration to different potentials wereapplied (the leftmost panel shows the control caffeine response).Note that RISC became prominent at higher potentials (0 and +60mV). (B) Activation curve for the voltage dependence of RISC. Thedata points represent the voltage dependence of RISC obtained bythe protocol illustrated in A. Data are given as the mean ± SEM (n= 5) and plotted as half-decay time of (Ca2+]i after repolarization asa function of the depolarizing pulse potential. The data were fittedaccording to T = {(Tm - Tm)/[l + exp (Vm V/2)/k]} + Tmmn,where T.l and Tin are the maximum and minimum half-decaytimes, respectively, Vm is the test potential, V1/2 is the potential atwhich RISC is half-maximal, and k is a slope factor. The fitted valuesof V1/2 and k are -30 mV and 11 mV, respectively.
activation of the SR Ca2+-release channels requires a con-siderably longer time than that of voltage-dependent chargemovement in T-tubular membranes, which is normally con-sidered to cease within 10 ms at most in rat skeletal musclecells (42) and is not affected by caffeine (44). While shortdepolarizations may be sufficient to attain maximal rates ofCa2+ release, longer depolarizations may still be able totransfer more release channels into a functionally voltage-activated state, producing a more effective manifestation ofthe RISC phenomenon.
Fig. 5A shows that the repolarization-induced closing ofrelease channels in the presence of caffeine is transient. Thecell was first stimulated with 10 mM caffeine during the timeindicated to induce SR Ca2+ release. Immediately after thepeak [Ca2+]i, a depolarizing pulse (+20 mV, 1 s) was appliedto transfer the RyR into the functionally voltage-activatedstate. The repolarization abrogated the caffeine effect, but inthe continuous presence of caffeine the RyR returned into anactivatable state to enter a new round of Ca2+ release. Notethat [Ca2+]1i abruptly returned to the resting level whenremoving caffeine, suggesting that the second release phasewas due to caffeine and not some other process. Thus, releasechannels appear to be able to return into a caffeine-activatable state. The dotted line represents a control caffeinetransient without depolarizing pulse.
In summary, our results strongly suggest that there existsa bidirectional voltage control of the release channel byvoltage sensors in the T-tubule membrane and that the CICRchannel (RyR) is indeed the physiological depolarization-induced Ca2+-release channel. Although the detailed mech-anism of the RISC phenomenon was not investigated in thepresent study, the phenomenon itself is very important tofurther understand the closing mechanism of the releasechannel as well as the initial step of skeletal muscle excita-tion-contraction coupling. A scheme that illustrates the ob-served phenomena is depicted in Fig. SB.
I caffeine
+c60 mV
I caffeine
Proc. Natl. Acad. Sci. USA 91 (1994)
Proc. Natl. Acad. Sci. USA 91 (1994) 5729
20 rnmVA
.1~~~'O.,i' ...
u5XuM!" \ X..w...caffeirne
B
ae;olar!zat oY
caffenenci ot Ca"
Ca
15 S
Li
Ca2+ Cas
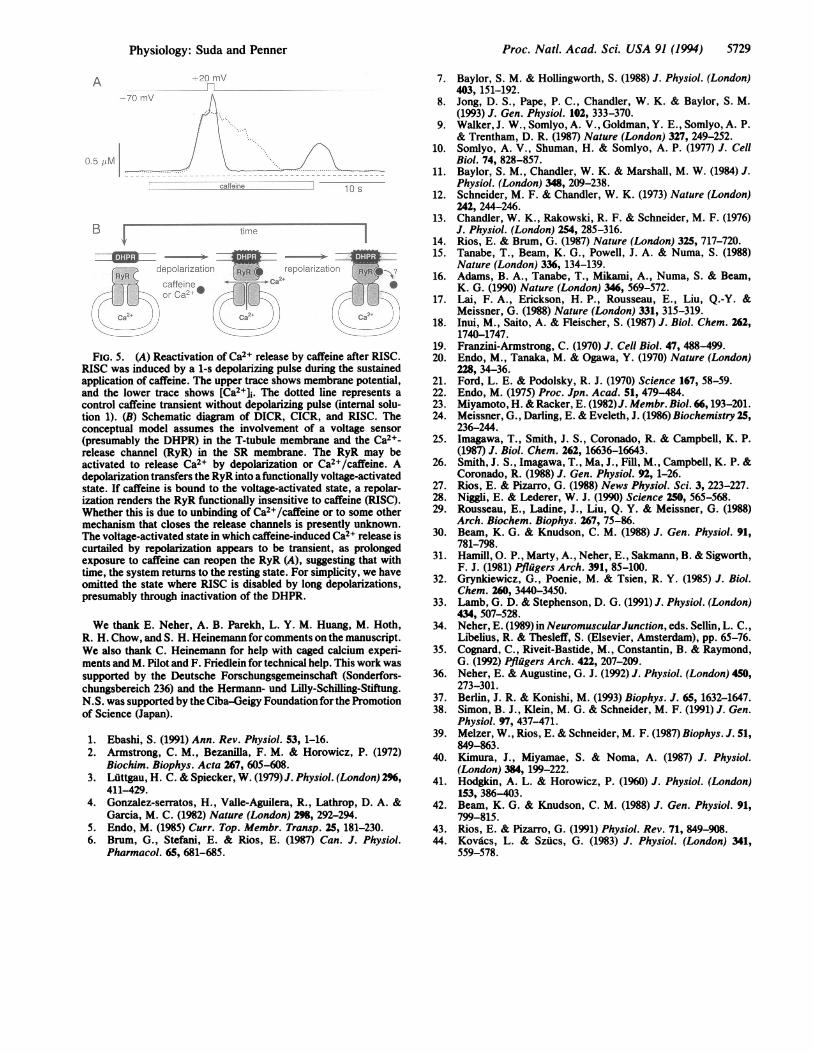
FIG. 5. (A) Reactivation of Ca2+ release by caffeine after RISC.RISC was induced by a 1-s depolarizing pulse during the sustainedapplication of caffeine. The upper trace shows membrane potential,and the lower trace shows [Ca2+]i. The dotted line represents acontrol caffeine transient without depolarizing pulse (internal solu-tion 1). (B) Schematic diagram of DICR, CICR, and RISC. Theconceptual model assumes the involvement of a voltage sensor(presumably the DHPR) in the T-tubule membrane and the Ca2+-release channel (RyR) in the SR membrane. The RyR may beactivated to release Ca2+ by depolarization or Ca2+/caffeine. Adepolarization transfers the RyR into a functionally voltage-activatedstate. If caffeine is bound to the voltage-activated state, a repolar-ization renders the RyR functionally insensitive to caffeine (RISC).Whether this is due to unbinding of Ca2+/caffeine or to some othermechanism that closes the release channels is presently unknown.The voltage-activated state in which caffeine-induced Ca2+ release iscurtailed by repolarization appears to be transient, as prolongedexposure to caffeine can reopen the RyR (A), suggesting that withtime, the system returns to the resting state. For simplicity, we haveomitted the state where RISC is disabled by long depolarizations,presumably through inactivation of the DHPR.
We thank E. Neher, A. B. Parekh, L. Y. M. Huang, M. Hoth,R. H. Chow, and S. H. Heinemann for comments on the manuscript.We also thank C. Heinemann for help with caged calcium experi-ments and M. Pilot and F. Friedlein for technical help. This work wassupported by the Deutsche Forschungsgemeinschaft (Sonderfors-chungsbereich 236) and the Hermann- und Lilly-Schilling-Stiftung.N.S. was supported by the Ciba-Geigy Foundation forthe Promotionof Science (Japan).
1. Ebashi, S. (1991) Ann. Rev. Physiol. 53, 1-16.2. Armstrong, C. M., Bezanilla, F. M. & Horowicz, P. (1972)
Biochim. Biophys. Acta 267, 605-608.3. Luttgau, H. C. & Spiecker, W. (1979) J. Physiol. (London) 296,
411-429.4. Gonzalez-serratos, H., Valle-Aguilera, R., Lathrop, D. A. &
Garcia, M. C. (1982) Nature (London) 298, 292-294.5. Endo, M. (1985) Curr. Top. Membr. Transp. 25, 181-230.6. Brum, G., Stefani, E. & Rios, E. (1987) Can. J. Physiol.
Pharmacol. 65, 681-685.
7. Baylor, S. M. & Hollingworth, S. (1988) J. Physiol. (London)403, 151-192.
8. Jong, D. S., Pape, P. C., Chandler, W. K. & Baylor, S. M.(1993) J. Gen. Physiol. 102, 333-370.
9. Walker, J. W., Somlyo, A. V., Goldman, Y. E., Somlyo, A. P.& Trentham, D. R. (1987) Nature (London) 327, 249-252.
10. Somlyo, A. V., Shuman, H. & Somlyo, A. P. (1977) J. CellBiol. 74, 828-857.
11. Baylor, S. M., Chandler, W. K. & Marshall, M. W. (1984) J.Physiol. (London) 348, 209-238.
12. Schneider, M. F. & Chandler, W. K. (1973) Nature (London)242, 244-246.
13. Chandler, W. K., Rakowski, R. F. & Schneider, M. F. (1976)J. Physiol. (London) 254, 285-316.
14. Rios, E. & Brum, G. (1987) Nature (London) 325, 717-720.15. Tanabe, T., Beam, K. G., Powell, J. A. & Numa, S. (1988)
Nature (London) 336, 134-139.16. Adams, B. A., Tanabe, T., Mikami, A., Numa, S. & Beam,
K. G. (1990) Nature (London) 346, 569-572.17. Lai, F. A., Erickson, H. P., Rousseau, E., Liu, Q.-Y. &
Meissner, G. (1988) Nature (London) 331, 315-319.18. Inui, M., Saito, A. & Fleischer, S. (1987) J. Biol. Chem. 262,
1740-1747.19. Franzini-Armstrong, C. (1970) J. Cell Biol. 47, 488-499.20. Endo, M., Tanaka, M. & Ogawa, Y. (1970) Nature (London)
228, 34-36.21. Ford, L. E. & Podolsky, R. J. (1970) Science 167, 58-59.22. Endo, M. (1975) Proc. Jpn. Acad. 51, 479-484.23. Miyamoto, H. & Racker, E. (1982)J. Membr. Biol. 66,193-201.24. Meissner, G., Darling, E. & Eveleth, J. (1986) Biochemistry 25,
236-244.25. Imagawa, T., Smith, J. S., Coronado, R. & Campbell, K. P.
(1987) J. Biol. Chem. 262, 16636-16643.26. Smith, J. S., Imagawa, T., Ma, J., Fill, M., Campbell, K. P. &
Coronado, R. (1988) J. Gen. Physiol. 92, 1-26.27. Rios, E. & Pizarro, G. (1988) News Physiol. Sci. 3, 223-227.28. Niggli, E. & Lederer, W. J. (1990) Science 250, 565-568.29. Rousseau, E., Ladine, J., Liu, Q. Y. & Meissner, G. (1988)
Arch. Biochem. Biophys. 267, 75-86.30. Beam, K. G. & Knudson, C. M. (1988) J. Gen. Physiol. 91,
781-798.31. Hamill, 0. P., Marty, A., Neher, E., Sakmann, B. & Sigworth,
F. J. (1981) Pflugers Arch. 391, 85-100.32. Grynkiewicz, G., Poenie, M. & Tsien, R. Y. (1985) J. Biol.
Chem. 260, 3440-3450.33. Lamb, G. D. & Stephenson, D. G. (1991) J. Physiol. (London)
434, 507-528.34. Neher, E. (1989) in NeuromuscularJunction, eds. Sellin, L. C.,
Libelius, R. & Thesleff, S. (Elsevier, Amsterdam), pp. 65-76.35. Cognard, C., Riveit-Bastide, M., Constantin, B. & Raymond,
G. (1992) Pflugers Arch. 422, 207-209.36. Neher, E. & Augustine, G. J. (1992) J. Physiol. (London) 450,
273-301.37. Berlin, J. R. & Konishi, M. (1993) Biophys. J. 65, 1632-1647.38. Simon, B. J., Klein, M. G. & Schneider, M. F. (1991) J. Gen.
Physiol. 97, 437-471.39. Melzer, W., Rios, E. & Schneider, M. F. (1987) Biophys. J. 51,
849-863.40. Kimura, J., Miyamae, S. & Noma, A. (1987) J. Physiol.
(London) 384, 199-222.41. Hodgkin, A. L. & Horowicz, P. (1960) J. Physiol. (London)
153, 386-403.42. Beam, K. G. & Knudson, C. M. (1988) J. Gen. Physiol. 91,
799-815.43. Rios, E. & Pizarro, G. (1991) Physiol. Rev. 71, 849-908.44. Kov~cs, L. & Szucs, G. (1983) J. Physiol. (London) 341,
559-578.
Physiology: Suda and Penner