Embed Size (px)
Citation preview
Circulation Journal Vol.72, January 2008
rugada syndrome (BS) is an inherited arrhythmo-genic disease characterized by a typical electrocar-diographic (ECG) pattern with ST-segment eleva-
tion in leads V1 through V3, incomplete right bundle-branchblock (RBBB), and an increased risk of sudden cardiacdeath because of ventricular fibrillation (VF).1,2 Accordingto a study of the cellular basis of BS, the heterogeneity ofthe repolarization across the ventricular wall (differences inthe action potential duration) of the right ventricular outflowtract may be a cause of the ST-elevation and the genesis ofventricular tachycardia (VT)/VF.2–4 The diagnosis of BS ismainly dependent on the typical ECG pattern and clinicalmanifestations. A differential diagnosis is at times difficult,particularly when the degree of the ST-segment elevation isrelatively small. Moreover, the ECG signature of BS isdynamic and often concealed.
Magnetocardiography (MCG) is reported to have thepotential to obtain current distributions with a high spatialresolution and to provide more detailed information of
ventricular depolarization and repolarization.5 Recently, astudy of the MCG findings in BS reported that the electricalconduction rate to the posterosuperior septal area is low.6However, whether MCG can provide greater diagnosticbenefit for BS remains unclear, because the data on the MCGfindings in BS are limited. In the present study, we analyzedthe MCG characteristics associated with BS by comparingnormal and RBBB patients using 64-channel MCG.
MethodsStudy Population
The study consisted of 10 BS (10 males, age: 36.9±10.4years), 21 RBBB (16 males, age: 50.8±15.5 years) and 34normal patients (31 males, age: 32.5±11.4 years). The BSgroup included 10 consecutive patients diagnosed with BSat the Yonsei Cardiovascular Center. The diagnosis of BSwas based on the findings of a typical ECG pattern (persis-tent or transient ST-segment elevation in the right precor-dial leads with or without an atypical RBBB pattern) withor without any clinical arrhythmic events (syncope, VF, orcardiac arrest).7 The clinical arrhythmic events were suddencardiac death with VF in 5 BS patients, and syncope in 1 BSpatient. The other 4 BS patients were asymptomatic withoutfamily history of syncope or sudden death. According tothe first consensus on BS conducted in Europe,8 the ECGsin the BS patients are classified as either type I (n=6) or typeII (n=4). None of the patients, including the RBBB andnormal groups, had any structural heart disease or coronarydisease.
Circ J 2008; 72: 94–101
(Received May 7, 2007; revised manuscript received August 8, 2007;accepted September 21, 2007)Cardiology Division, Department of Internal Medicine, Yonsei Uni-versity Medical College, Seoul, *Bio-signal Research Center, KoreaResearch Institute of Standards and Science, Daejeon, KoreaAcknowledgement of all sources of financial support: nothing to reveal.Mailing address: Boyoung Joung, MD, PhD, Division of Cardiology,Yonsei Cardiovascular Center, Yonsei University College of Medicine,134 Shinchon-dong, Seodaemun-gu, Seoul 120-752, Korea. E-mail:[email protected] rights are reserved to the Japanese Circulation Society. For per-missions, please e-mail: [email protected]
Magnetic Dispersion of the Late Repolarization in Brugada Syndrome
Boyoung Joung, MD, PhD; Kiwoong Kim, PhD*; Yong-Ho Lee, PhD*; Hyukchan Kwon, PhD*; Hyun Kyoon Lim, PhD*; Tae-Uen Kim*;
Young-Guk Ko, MD, PhD; Moonhyoung Lee, MD, PhD; Namsik Chung, MD, PhD; Sungsoon Kim, MD, PhD
Background Magnetocardiography (MCG) is a new noninvasive modality for recording cardiac depolariza-tion and repolarization and was used in the present study to evaluate abnormalities in patients with Brugadasyndrome (BS).Methods and Results The MCG findings of 10 BS, 21 right bundle branch block (RBBB), and 34 normalpatients were compared. On the horizontal spatiotemporal activation graph (STAG), the r’ waves were morefrequently located on the right side in the RBBB than in the normal (p=0.001) or BS groups (p=0.001). Themaximum current angles of the r’ wave fell into the northwest axis in all BS patients as compared to having aright axis deviation in 19 of 21 RBBB patients (90.4%, p=0.001). In the magnetic field and current density vectormaps during late repolarization, the BS group had a non-dipole pattern more frequently and a higher number ofpoles compared with the normal (p=0.001) and RBBB groups (p=0.001). Conclusions During depolarization, the horizontal STAG location and maximum current angle of the r’ wavewere beneficial in differentiating BS from RBBB and normal. The magnetic dispersion was a more frequentlyobserved finding in BS patients than in RBBB and normal patients during late repolarization. (Circ J 2008; 72:94–101)
Key Words: Brugada syndrome; Bundle branch block; Depolarization; Repolarization; Magnetic dispersion;Magnetocardiography
B
95Magnetocardiographic Findings in BS
Circulation Journal Vol.72, January 2008
MCG Recording and InterpretationIn all the subjects, 12-lead ECG and MCG were recorded
within 30 min while at rest. The MCG recordings wereperformed using a KRISS 64-channel biomagnetometer(Bio-signal Research Center, KRISS, Daejeon, Korea) in amagnetically shielded room. The MCG system uses doublerelaxation oscillation SQUID (DROS) sensors.9,10 Theaverage noise spectral density of the entire system in amagnetically shielded room is 10 fT/ Hz at 1Hz and 5 fT/
Hz over 100 Hz. The KRISS 64-channel MCG has 64planar first-order SQUID gradiometers, which measurd thetangential components of the cardiomagnetic fields. Typicalrecording time was 30s. The MCG data for all the subjectswere analyzed using application software, KRISSMCG64(Bio-signal Research Center).
The interpretation of the MCG data was based on theMCG time tracings, spatiotemporal activation graph(STAG), magnetic field (MF) map and current density vector(CDV) map. The single beats from the raw data obtainedfrom each subject were digitally averaged to reduce anynoise. For each subject, an independent observer blindlyexamined the averaged data using a fixed time window (1.0s) and signal gain within defined limits (0.5–2.0pT/cm).
MCG Time Tracing and STAGThe MCG time tracing was the recording of the raw
signal in 64 sites according to time (Fig1). The integratedMCG time tracing was the summation of the raw signalsfrom 64 recording sites. In the integrated MCG time trac-ings, the Q, R, and T waves and the QT interval were iden-tified. If the R wave had 2 peaks, the first and second peaks(Rp, r’p) were analyzed separately. The end of the T wave(Te) was defined as the time of the visually determinedvertex (maximum curvature) of the signal following theinflection point after the peak of the T wave (Tp). Theaverage magnetic field strength of Rp, r’p and Tp in theintegrated MCG time tracings was measured and comparedamong the 3 groups.
We created a longitudinal and horizontal STAG, whichrepresented the time-dependent activation from the base tothe apex and from left to right, respectively (Fig2). In thelongitudinal STAG, the relative location of the r’ wave fromthe R wave was identified as the base, neutral, or apex. Inthe horizontal STAG, the relative location of the r’ wavefrom the R wave was identified as right, neutral, or left. TheSTAG was created from depolarization to repolarization.
The CDV and MF MapsThe CDV map represents with arrows the amplitude and
Fig 1. Representative electrocardiographics and corresponding magnetocardiography (MCG) time tracings. (A)Brugada syndrome, (B) right bundle branch block (RBBB), and (C) normal patient (see text for details).
√√

96 JOUNG B et al.
Circulation Journal Vol.72, January 2008
Fig2. Comparison of the spatiotemporal activation graph (STAG) from depolarization to repolarization among the 3groups. The upper, middle and lower panels in each diagram are the integrated magnetocardiography (MCG) time trac-ings, the longitudinal STAG, and the horizontal STAG, respectively. As in the MCG time tracings, the activation of the r’was more prominent in the right bundle branch block (RBBB) group than in the normal group. In the horizontal STAG,the r’ activation of the Brugada syndrome and RBBB patients fell on the neutral and right side, respectively (arrows in leftand middle lower panels). The r’ activation of the normal patient was too small to interpret (right lower panel).
Fig 3. (A, B) Magnetic field (MF) and (C, D) currentdensity vector (CDV) maps at distal 40 ms to Te, Thepatterns of dipole (A) and non-dipole (B) are shown. Thenumber of poles is 2 and 4 in the CDV maps (C) and (D),respectively. The maximum current angle (arrow 1 in Cand D) and the field map angle (arrow 2 in C and D) areshown.
97Magnetocardiographic Findings in BS
Circulation Journal Vol.72, January 2008
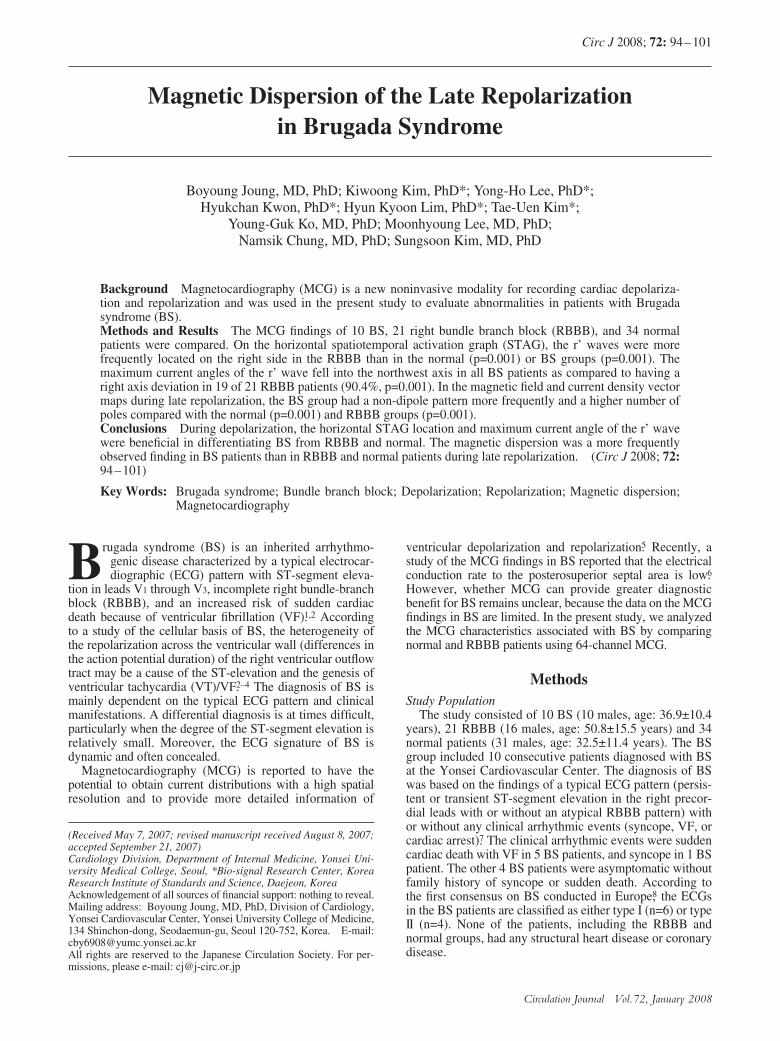
Fig4. Comparison of the maximum current angle (MCA) and field map angle (FMA) of the R peak (Rp), r’ peak (r’p),and T-wave peak (Tp). Note the MCA of the r’p falls in the northwest axis in right bundle branch block (RBBB) group,whereas it is right axis deviated in the Brugada syndrome (BS) (p=0.001) and normal groups (p=0.001).
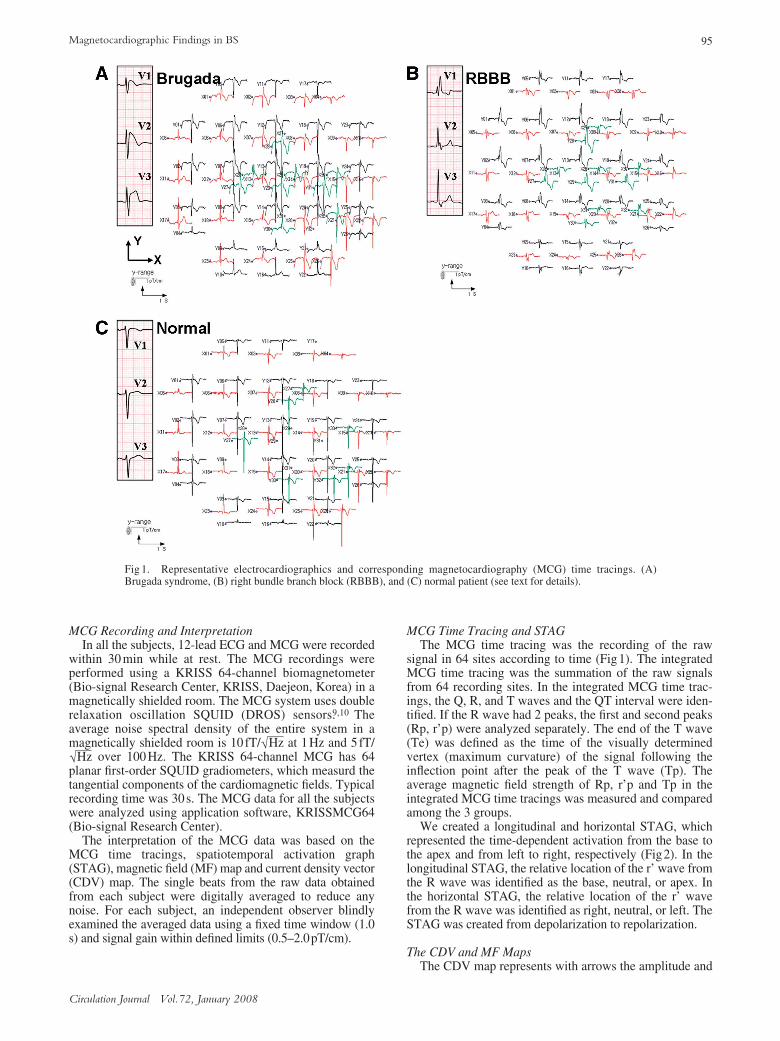
Table 1 Comparison of the Frequency of a Non-Dipole Pattern During Late Repolarization in the Magnetic Field Map Among the 3 Groups
Time (ms)Non-dipole (n)/total (n) p value between
Brugada RBBB Normal Brugada-RBBB Brugada-normal RBBB-normal
Te 10/10 21/21 34/34 – – –Te-10 10/10 16/21 33/34 0.09 1.0 0.03Te-20 9/10 14/21 19/34 0.06 0.07 1.0 Te-30 9/10 6/21 11/34 0.001 0.02 1.0 Te-40 9/10 4/21 4/34 0.001 0.001 0.46Te-50 9/10 4/21 3/33 0.001 0.001 0.41Te-60 8/10 4/21 3/32 0.002 0.001 0.42
RBBB, right bundle branch block; Te, end of the T wave.
Table 2 Comparison of the Number of Poles During the Repolarization in the Current Density Vector Map Among the 3 Groups
Time (ms)No. of poles (n) p value between
Brugada RBBB Normal Brugada-RBBB Brugada-normal RBBB-normal
Te 5.5±1.1 4.7±1.0 3.9±0.8 0.03 0.001 0.03 Te-10 5.1±1.2 4.1±1.1 3.3±0.8 0.01 0.001 0.006Te-20 4.7±1.2 3.1±1.0 2.6±0.6 0.001 0.001 0.06 Te-30 4.3±1.3 2.7±0.7 2.4±0.5 0.001 0.001 0.18 Te-40 3.8±1.0 2.4±0.5 2.2±0.3 0.001 0.001 0.25 Te-50 3.5±0.8 2.3±0.5 2.1±0.3 0.001 0.001 0.29 Te-60 3.1±0.7 2.5±0.5 2.1±0.4 0.001 0.001 0.35
Abbreviations see in Table 1.
98 JOUNG B et al.
Circulation Journal Vol.72, January 2008
vectors of the magnetic current around heart. The MF mapis a color-coded image of the CDV map. In the MF map, thered and blue poles represent outgoing magnetic fields andinward fields with respect to the plane of the thorax, respec-tively. The analyses of MF and CDV maps were performedfrom Te back to Tp. The pattern of the poles was defined asdipole when there were 2 poles (Fig3A) and as non-dipolewhen there were more than 2 poles (Fig3B). In the CDVmap, the number of poles was counted (Figs3C,D). Briefly,this classification system is based on the notion that, duringnormal repolarization, the underlying electrical activity willbe coordinated and that the current distributions representedin the MF and CDV maps will be primarily characterizedby currents in a left and downward direction. Disturbancesin repolarization will affect the symmetry of the maps. Themaximum current and field map angles were calculated at Rpeak (Rp), r’ peak (r’p), and T-wave peak (Tp). The maxi-mum current angle was almost the same angle as the angleof the electrical conduction which is tangential to the fieldmap angle (arrow 1 in Fig3C). The field map angle repre-sented the angle of a line connecting the negative blue poleto the positive red pole in the MF map (arrow 2 in Fig 3C).
Data AnalysisThe differences in the amplitudes of Rp, r’p and Tp,
maximum current and MF map angles were comparedamong the patient groups using an ANOVA test. Thedifferences in the non-dipole pattern between the patientgroups were compared using a chi-square test. The differ-ences in the number of poles among the patient groupswere estimated using an ANOVA test. A p-value<0.05 was
considered to be significant.
ResultsComparison of MCG Time Tracings and STAG Among the 3 Groups
The QT and Tp to Te intervals measured in the inte-grated MCG time tracings did not differ among the groups(data not presented). The MF strength of the Rp was232.4±123.0, 362.3±139.7 and 296.1±115.1 nA.m in theBS, RBBB and normal groups, respectively. The BS grouphad a lower amplitude of Rp than did the RBBB group(p=0.007). The r’ wave belonged to the noise range andwas too small to interpret in 1 (10%) BS and 17 (50%)normal patients. The MF strength of the r’ was 143.8±50.5,200.4±97.2 and 132.2±54.4 nA.m in the BS, RBBB andnormal groups, respectively. The RBBB group had a higheramplitude of the r’ than did the normal group (p=0.009).
In the comparison of the STAG from depolarization torepolarization, the activation of the r’ wave was moreprominent in the RBBB group than in the normal group(Fig2). With the horizontal STAG, r’ waves were locatedon the neural side in 7 of 9 (78.8%) BS patients and in 14 of17 (82.4%) normal patients compared with on the right sidein all RBBB patients (21 of 21, 100%). The r’ waves weremore frequently located on the right side in the RBBBgroup than in the normal (p=0.001) or BS groups (p=0.001).
Comparison of the Maximum Current and Field Map Angles Among the 3 Groups
The maximum current angle of the r’p was –130.1±
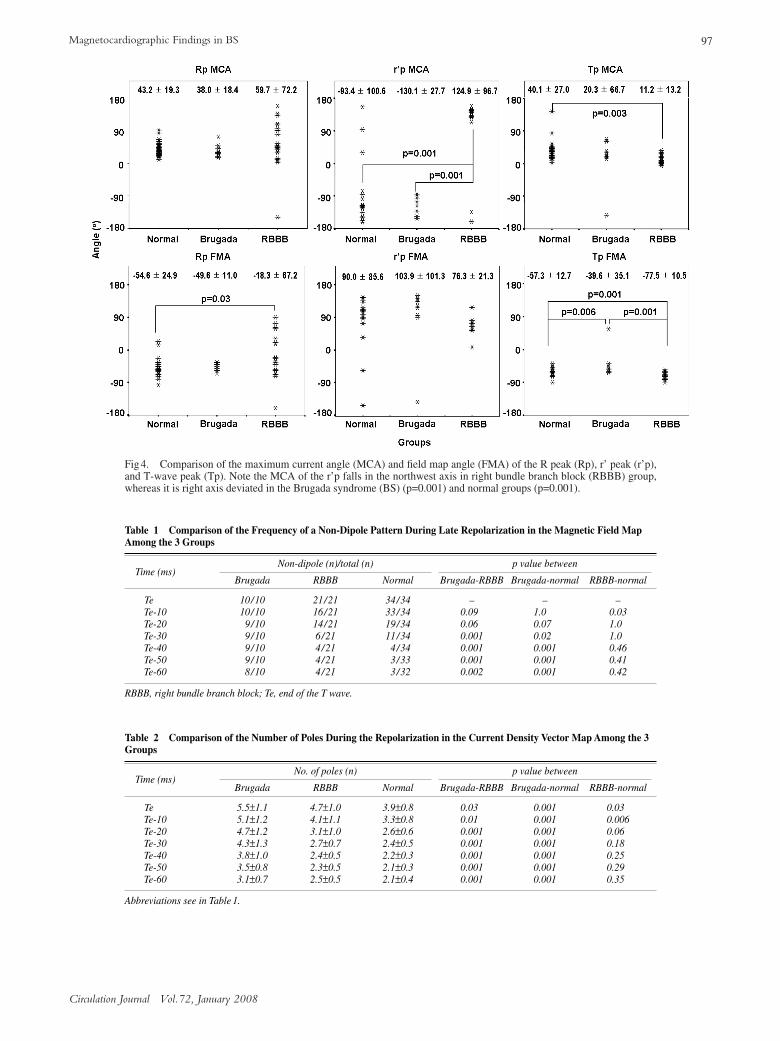
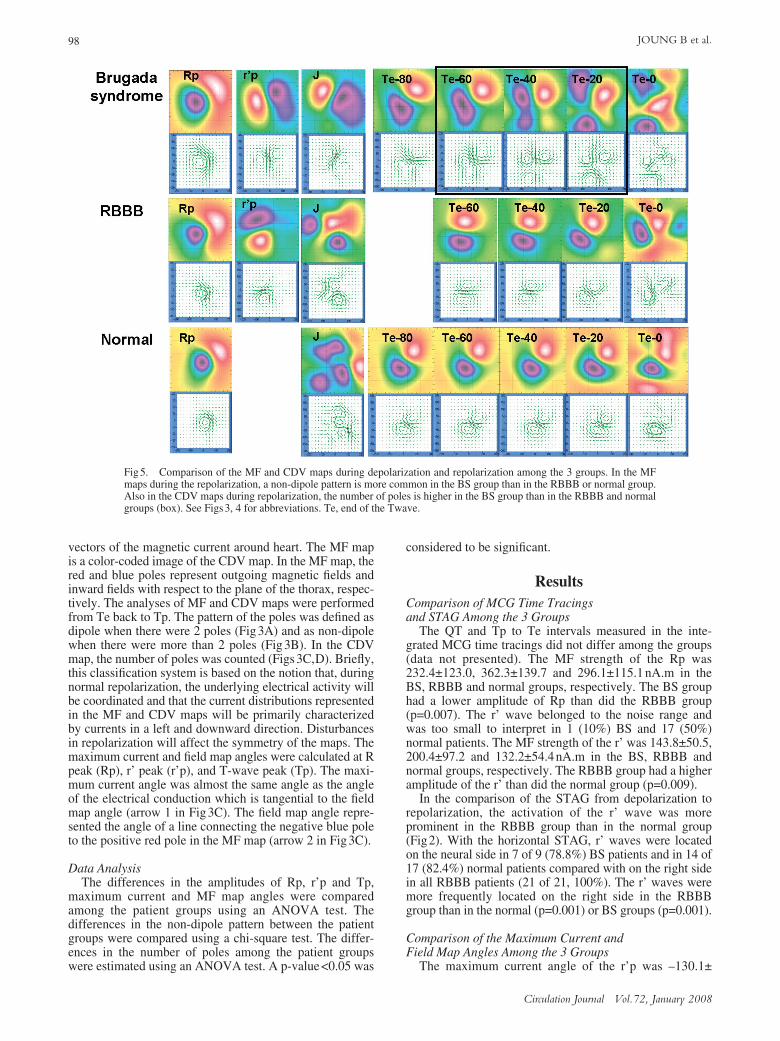
Fig5. Comparison of the MF and CDV maps during depolarization and repolarization among the 3 groups. In the MFmaps during the repolarization, a non-dipole pattern is more common in the BS group than in the RBBB or normal group.Also in the CDV maps during repolarization, the number of poles is higher in the BS group than in the RBBB and normalgroups (box). See Figs3, 4 for abbreviations. Te, end of the Twave.
99Magnetocardiographic Findings in BS
Circulation Journal Vol.72, January 2008
27.7°, 124.9±96.7° and –93.4±100.6° in the BS, RBBB andnormal groups, respectively. The r’p was too small tomeasure the maximum current angle in 1 (10%) BS and 17(50%) normal patients. Of note, the maximum currentangles of the r’p fell into the northwest axis in all 9 BSpatients as compared with a right axis deviation in 19 of 21(90.4%) RBBB patients (p=0.001, Fig4).
Comparison of Non-Dipole Pattern and the Number of Poles Among the 3 Groups
In the MF map, the number of patients with a non-dipolepattern was higher in the BS group than in the RBBB(p=0.001) or normal (p=0.001, Table 1) groups during thelast 60ms and 40ms to the Te. In the comparison of thenumber of poles during late repolarization on the CDV map,the BS patients had more poles than did the RBBB andnormal patients, especially between the last 60–20ms tothe Te (Table2, Fig5).
Change in the Magnetic Dispersion in Accordance With the ECG Pattern in BS Patients
In 9 BS patients, the MCG was recorded more thantwice. However, MCG recording during the different typesof BS ECGs was possible to obtain in 4 BS patients. Themagnetic dispersion of late repolarization also changedwith the variable ECG changes in the same BS patients.
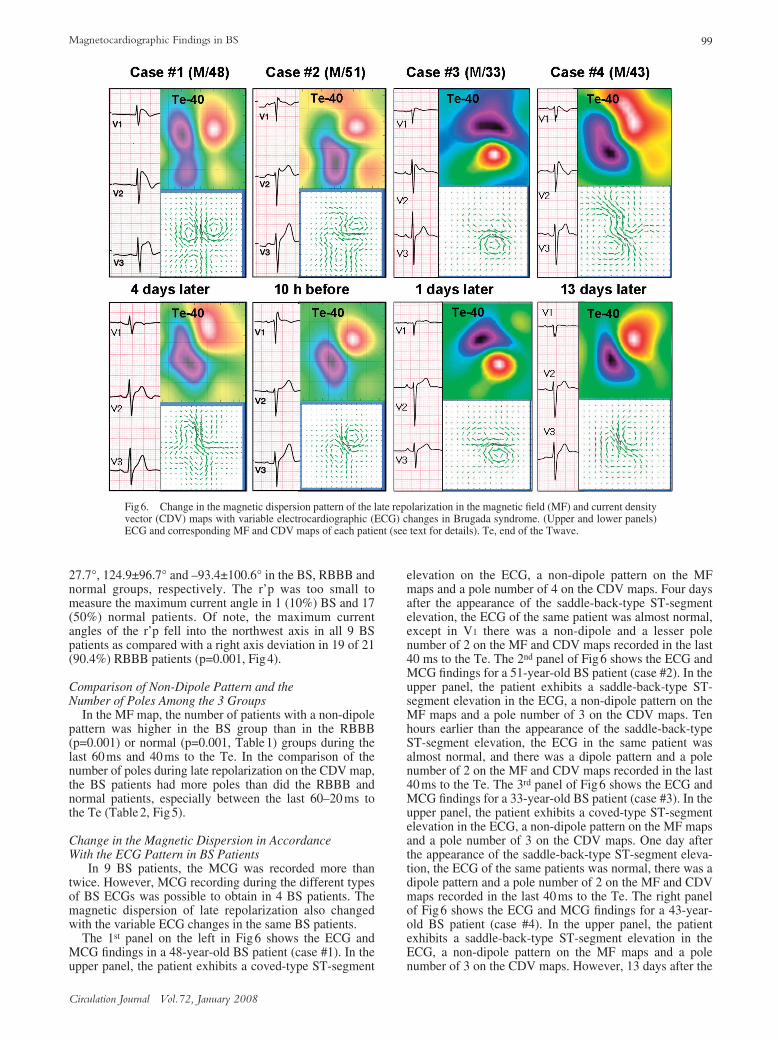
The 1st panel on the left in Fig6 shows the ECG andMCG findings in a 48-year-old BS patient (case #1). In theupper panel, the patient exhibits a coved-type ST-segment
elevation on the ECG, a non-dipole pattern on the MFmaps and a pole number of 4 on the CDV maps. Four daysafter the appearance of the saddle-back-type ST-segmentelevation, the ECG of the same patient was almost normal,except in V1 there was a non-dipole and a lesser polenumber of 2 on the MF and CDV maps recorded in the last40 ms to the Te. The 2nd panel of Fig6 shows the ECG andMCG findings for a 51-year-old BS patient (case #2). In theupper panel, the patient exhibits a saddle-back-type ST-segment elevation in the ECG, a non-dipole pattern on theMF maps and a pole number of 3 on the CDV maps. Tenhours earlier than the appearance of the saddle-back-typeST-segment elevation, the ECG in the same patient wasalmost normal, and there was a dipole pattern and a polenumber of 2 on the MF and CDV maps recorded in the last40ms to the Te. The 3rd panel of Fig6 shows the ECG andMCG findings for a 33-year-old BS patient (case #3). In theupper panel, the patient exhibits a coved-type ST-segmentelevation in the ECG, a non-dipole pattern on the MF mapsand a pole number of 3 on the CDV maps. One day afterthe appearance of the saddle-back-type ST-segment eleva-tion, the ECG of the same patients was normal, there was adipole pattern and a pole number of 2 on the MF and CDVmaps recorded in the last 40ms to the Te. The right panelof Fig6 shows the ECG and MCG findings for a 43-year-old BS patient (case #4). In the upper panel, the patientexhibits a saddle-back-type ST-segment elevation in theECG, a non-dipole pattern on the MF maps and a polenumber of 3 on the CDV maps. However, 13 days after the
Fig6. Change in the magnetic dispersion pattern of the late repolarization in the magnetic field (MF) and current densityvector (CDV) maps with variable electrocardiographic (ECG) changes in Brugada syndrome. (Upper and lower panels)ECG and corresponding MF and CDV maps of each patient (see text for details). Te, end of the Twave.
100 JOUNG B et al.
Circulation Journal Vol.72, January 2008
appearance of the saddle-back-type ST-segment elevation,the ECG of the same patient was normal, and there was adipole pattern and a pole number of 2 on the MF and CDVmaps recorded in the last 40ms to the Te.
DiscussionThe diagnosis of BS is based on the typical ECG
features: (1) an accentuated J wave appearing principally inthe right precordial leads (V1–3) and taking the form of anST-segment elevation, often followed by a negative Twave; (2) very closely coupled extrasystoles; and (3) rapidpolymorphic VT, which at times may be indistinguishablefrom VF. The ST-segment elevation may also display asaddleback appearance,11 and the VT in rare cases may bemonomorphic.12 ST-segment elevation is associated with awide variety of benign, as well as malignant, pathophysio-logic conditions. A differential diagnosis is at times diffi-cult, particularly when the degree of ST-segment elevationis relatively small. Moreover, the ECG signature of BS isdynamic and often concealed, but can be unmasked bypotent sodium-channel blockers such as flecainide, ajma-line, procainamide, disopyramide, propafenone, and pilsi-cainide.13,14
MCG is a new tool to record the magnetic field thatexists around an electrical current. Because the 64-channelMCG system can measure the magnetic field at 64 sitessimultaneously, it is possible to evaluate cardiac activationwith a higher resolution than conventional ECG. Moreover,it could create MF and CDV maps every 1ms with a veryhigh temporal resolution.
In the MCG time tracings, a more prominent r’ wavewas found in patients with RBBB and BS, as with ECG.The magnetic field strength of the r’p was higher in theRBBB group than in the BS patients. Also in the STAGanalysis, we found a more prominent r’p. Using the whole-heart electrical-activation diagram (W-HEAD) model,Kandori et al6 visualized the spatial time-variant activationin the whole heart. They mainly described the activation ofR-peak and showed a posteromedian left ventricle excita-tion in BS with half the amplitude of RBBB, and a lowelectrical conduction rate to the posterosuperior septumarea. Contrary to the W-HEAD model, which shows hori-zontal and anterior to posterior time-variant cardiac activa-tion,6 our STAG analysis provided both the longitudinal andhorizontal cardiac activation according to time. In thisstudy, we could not find a difference in the activation of theR-peak. The only prominent different finding between theRBBB and other groups was observed during r’p in thehorizontal STAG. The r’p in all of the RBBB patients waslocated on the right side. Therefore, we could easily differ-entiate RBBB from BS and normal with the horizontalSTAG analysis.
In the MF and CDV maps, BS demonstrated a character-istic magnetic dispersion of late repolarization. Themagnetic dispersion during the ST-T interval has beenreported in patients with coronary heart disease.15 An inter-esting finding was the variation of the magnetic dispersionof the late repolarization in association with the temporalECG changes in the same BS patient. Although our serialMCG data from the same patient was limited, the magneticdispersion pattern of the repolarization appeared to be moreprominent in the coved-type ECGs than in the saddle-backand normal type ECG patterns. One of the main explana-tions for malignant arrhythmias is based on regional inho-
mogeneity of the refractory periods of the myocardial cells,despite a constant heart rate. The electrophysiological back-ground reflects the different duration of the monophasicaction potentials and a delayed occurrence of some actionpotentials because of the slow conduction properties.16,17
Study LimitationsBecause of the limited number of BS patients, it may not
be possible to give final conclusions about the MCG find-ings in BS. However, this study has merit as a pioneerstudy. Although we did not record MCG and 12-lead ECGsimultaneously, the 2 recordings were taken within 30minof each other. However, we can not exclude the possibilityof transient change during this period. If we performed aprovocation test for BS patients before and after MCGrecording, it might be possible to present more data aboutthe changes according to the different types of BS ECGchanges.18 To study the MCG findings of BS patients withminimal clinical manifestation will be needed to show theadditional role of MCG in the diagnosis of BS patients.
ConclusionUsing MCG, the horizontal STAG location and maximum
current angle of the r’ wave are beneficial in differentiatingBS from RBBB and normal during depolarization. Themagnetic dispersion was a more frequently observed findingin BS than in RBBB and normal during late repolarization.
References1. Brugada P, Brugada J. Right bundle branch block, persistent ST-
segment elevation and sudden cardiac death. J Am Coll Cardiol 1992;20: 1391–1396.
2. Antzelevitch C, Brugada P, Brugada J, Brugada R, Shimizu W,Gussak I, et al. Brugada syndrome: A decade of progress. Circ Res2002; 91: 1114–1118.
3. Yan GX, Antzelevitch C. Cellular basis for the Brugada syndromeand other mechanisms of arrhythmogenesis associated with STsegment elevation. Circulation 1999; 100: 1660–1666.
4. Morita H, Fukushima-Kusano K, Nagase S, Takenaka-Morita S,Nishii N, Kakishita M, et al. Site-specific arrhythmogenesis inpatients with Brugada syndrome. J Cardiovasc Electrophysiol 2003;14: 373–379.
5. Kandori A, Shimizu W, Yokokawa M, Maruo T, Kanzaki H,Nakatani S, et al. Detection of spatial repolarization abnormalities inpatients with LQT1 and LQT2 forms of congenital long-QT syndrome.Physiol Meas 2002; 23: 603–614.
6. Kandori A, Miyashita T, Ogata K, Shimizu W, Yokokawa M,Kamakura S, et al. Electrical space-time abnormalities of ventriculardepolarization in patients with Brugada syndrome and patients withcomplete right-bundle branch blocks studied by magnetocardiogra-phy. Pacing Clin Electrophysiol 2006; 29: 15–20.
7. Nakazawa K, Sakurai T, Kishi R, Takagi A, Osada K, Ryu S, et al.Discrimination of Brugada syndrome patients from individuals withthe saddle-back type ST-segment elevation using a marker of thestandard 12-lead electrocardiography. Circ J 2007; 71: 546–549.
8. Wilde AA, Antzelevitch C, Borggrefe M, Brugada J, Brugada R,Brugada P, et al. Study group on the molecular basis of arrhythmiasof the European Society of Cardiology. Eur Heart J 2002; 23: 1648–1654.
9. Lee YH, Kwon H, Kim JM, Park YK, Park JC. Double relaxationoscillation SQUID with high flux-to-voltage transfer and its applica-tion to a biomagnetic multichannel system. J Korean Phys Soc 1998;32: 600–605.
10. Kim K, Lee YH, Kwon H, Kim JM, Park YK, Kim IS. Correction inthe principal component elimination method for neuromagnetic-evoked field measurements. J Korean Phys Soc 2004; 44: 980–986.
11. Miyazaki T, Mitamura H, Miyoshi S, Soejima K, Aizawa Y, OgawaS. Autonomic and antiarrhythmic drug modulation of ST segmentelevation in patients with Brugada syndrome. J Am Coll Cardiol1996; 27: 1061–1070.
12. Shimada M, Miyazaki T, Miyoshi S, Soejima K, Hori S, Mitamura

101Magnetocardiographic Findings in BS
Circulation Journal Vol.72, January 2008
H, et al. Sustained monomorphic ventricular tachycardia in a patientwith Brugada syndrome. Jpn Circ J 1996; 60: 364–370.
13. Brugada R, Brugada J, Antzelevitch C, Kirsch GE, Potenza D, TowbinJA, et al. Sodium channel blockers identify risk for sudden death inpatients with ST-segment elevation and right bundle branch block butstructurally normal hearts. Circulation 2000; 101: 510–515.
14. Antzelevitch C. The Brugada syndrome: Ionic basis and arrhythmiamechanisms. J Cardiovasc Electrophysiol 2001; 12: 268–272.
15. Hailer B, Chaikovsky I, Auth-eisernitz S, Schafer H, Van Leeuwen P.The value of magnetocardiography in patients with and without rele-
vant stenoses of the coronary arteries using an unshielded system.Pacing Clin Electrophysiol 2005; 28: 8–16.
16. Han J, Moe GK. Non-uniform recovery of excitability in ventricularmuscle. Circ Res 1964; 14: 44–60.
17. Antzelevitch C, Fish J. Cardiac heterogeneity: Electrical heterogene-ity within the ventricular wall. Basic Res Cardiol 2001; 96: 517–527.
18. Ueyama T, Shimizu A, Yamagata T, Esato M, Ohmura M, YoshigaY, et al. Different effect of the pure Na+ channel-blocker pilsicainideon the ST-segment response in the right precordial leads in patientswith normal left ventricular function. Circ J 2007 71: 57–62.