Embed Size (px)
Citation preview
A supplement to Water & Wastes Digest
prepared in cooperation with the
MEMBRANE TECHNOLOGYsolutions for water treatment
OctOber 2010 WWW.WWdmAg.cOm
Water reclamation & RO optimization
Membrane Efficiency
membrane technology I 3
•editorialMEMBRANE TECHNOLOGY WATER & WASTES
DIGEST
Water reuse applications increas-ingly are popping up across the globe, many applying
membrane technology to put water once deemed a waste product to good use.
These new and redevelopment reuse projects range from small-scale to mas-sive, from microfiltration to membrane
bioreactors, from graywater treatment in privately owned buildings to eff luent treatment at municipal wastewater plants; the treated water may be used for irrigation, toilet f lushing, industrial processes or groundwater replenishment, to name some practices.
The results of the earliest membrane/reuse projects are becoming clearer, and in many cases the numbers and end-user feedback convey success stories. These testimonials, coupled with the rising quality and declining costs of related technologies, indicate that the logical pairing of membranes and reclamation is here to stay.
For proof, look no further than this issue’s article “Reuse in the Northeast” (see page 6), which profiles the University of Connecticut’s recent efforts to reclaim water in order to ease demand on limited supplies. The sustainably minded univer-sity implemented microfiltration, ultraviolet disinfection and reverse osmosis to treat effluent to water fit for athletic field irrigation, cooling towers and to serve as boiler feedwater.
Together, projects like those outlined above can make a world of difference in our industry and beyond. They will help conserve potable water (nearly half the global popula-tion will live in water-stressed nations by 2015, according to the National Intelligence Council), protect watersheds and source water, control operational costs and educate the pub-lic about the value of clean water.
Finally, some of you may recognize me as managing edi-tor of Storm Water Solutions and a regular editorial con-tributor on Water & Wastes Digest. I’ll be the new face of Membrane Technology and look forward to delivering the membrane information you need to keep knowledgeable and competitive in today’s water and wastewater market. Former managing editor Clare Pierson has relocated to begin a new life chapter; she will be missed, and we wish her all the best.
Caitlin Cunningham, managing [email protected]
Reuse on the Rise
04 Synergy: The New RealityOptimizing RO recovery with cyclic ion-exchange softening
06 Reuse in the NortheastA sustainable approach to solving water supply challenges at the University of Connecticut
08 RO Cleaning Frequency: A Balance of CostsEconomic analysis: A California groundwater replenishment system application
12 Beyond Conventional MBRsOxygen transfer technology revolutionizing MBR applications
16 Managing Water BalanceUsing LSI to preserve an Arizona treatment plant’s distribution systems
18 Minimizing Disposal of a Reusable ResourceA California utility’s desalter brine and concentrate recovery permitting experience
c o n t e n t s u FALL 2010
Scranton Gillette Communications3030 W. Salt Creek Ln., Ste. 201, Arlington Heights, IL 60005-5025
tel: 847.298.6622 • fax: 847.390.0408 • [email protected] • www.wwdmag.com
EDITORIAL STAFF Editorial Director Neda Simeonova Managing Editor Caitlin Cunningham Associate Editor Elizabeth Lisican Associate Editor Rebecca Wilhelm Graphic Designer Robin Hicks
ADvERTISIng & SALES6900 E. Camelback, Suite 400 • Scottsdale, AZ 85251
tel: 480.941.0510 • fax: 480.423.1443 Integrated Media Consultant David Rairigh [email protected] (phone x25) Integrated Media Consultantr Eric Smith [email protected] (phone x14) Integrated Media Consultant Fred Ferris [email protected] (Arlington Heights office, 847.391.1003) Integrated Media Consultant Brenda Yanez [email protected] (phone x12) Integrated Media Consultant Lori Glenn [email protected] (phone x17) Regional Sales Managerp Michael Mansour [email protected] (phone x16) Classified Sales Manager Donna Aly [email protected] (phone x13) Reprint Coordinator Adrienne Miller [email protected] (Arlington Heights office, 847.391.1036) List Rental Contact John Ganis 914.368.1024 Advertising Coordinator Erica Rivera [email protected] (Arlington Heights office, 847.391.1049)
MAnAgEMEnT Vice President/Publisher Dennis Martyka [email protected] Associate Publisher Greg Tres [email protected] VP Custom Publishing & Creative Services Diane Vojcanin VP Events Harry Urban Circulation Director Mike Serino Director of Creative Services & Promotions Sandi Stevenson
CORpORATE Chairperson K.S. Gillette President/CEO E.S. Gillette Sr. Vice President A. O’Neill Chairman Emeritus H.S. Gillette (1922-2003)
ON THE COVERUltrafiltration membranes in action. (Photo courtesy of GE Power & Water.)
4 I membrane technology fall 2010 membrane technology I 5
•technical article
Synergy: The New Reality
Tightening regulations on con-centrate disposal from reverse osmosis (RO) and nanofiltration
(NF) plants are pushing the membrane industry to find more ways to improve operating efficiencies. The large volume of concentrate brine generated, typically 15% to 50% of the total, can inhibit future growth of the industry unless new methods are developed to optimize recovery rates and reduce waste.
Ion Exchange & Membranes UniteIn the past, ion exchange and mem-
branes were regarded as competitive technologies rather than providing com-plementary functions. The new reality is that synergistic benefits of boosting RO recoveries and minimizing waste are indeed possible, as evidenced by the recent introduction of technology referred to as cyclic ion-exchange soften-ing. This green technology uses shallow shell cation resins to soften the feedwater to the RO and then uses the very dilute reject brine generated by the RO to regenerate the resin.
The process can effectively regenerate the resin utilizing brine concentrations as low as 0.5%—20 times lower than the typical 10% concentration used by conventional softeners. No supplemental commercial salt is needed except in cases of extreme variability of feedwater quality. This synergy between ion exchange and membranes opens up new possibilities for reducing membrane treatment costs while minimizing impact on the environment.
Of great interest is the capability of the process to efficiently reduce hard-ness and barium leakages to sub-ppm and -ppb levels, respectively. Potential mem-brane scaling from sparingly soluble salts (e.g., barium sulfate, calcium sulfate and
calcium carbonate) is better controlled. With improved control over scaling poten-tial, RO recovery rate can be increased, provided no limitations are imposed by other contaminants in the water (e.g., silica, organic matter and colloids). For cases in which the latter contaminants are not limiting or are adequately controlled by other pretreatment methods, it is quite possible to design the RO plant for recov-ery rates of 90% to 95%.
Because brine concentrations as low as 0.5% (5,000 mg/L) can be used to regenerate the resin in this new process, both brackish and semi-brackish waters can be softened. Such waters will typi-cally have total dissolved solids (TDS) ranging from 500 mg/L (0.05%) and upward, and at 90% recovery the reject brine concentration would be adequate to regenerate the resin effectively.
The new cyclic ion-exchange technol-ogy promises to eliminate the handling and feed of hazardous acids, including sulfuric and hydrochloric acid, which typically are used to reduce feedwater pH and control potential calcium car-bonate scaling of the RO membranes. A drawback of feeding acid that is not experienced with ion-exchange softening is the formation of carbon dioxide (CO2) gas from neutralization of bicarbonate present in the water by the acid. The resultant CO2 passes through the RO membrane, requiring additional capital and operating cost for a degasser tower to liberate the CO2 gas as well as the feed of caustic soda for post-pH adjust-ment before the water is distributed.
Anti-scalants, more commonly used than acid, provide good control over a wider variety of potential scaling and foul-ing compounds (e.g., calcium sulfate, bar-ium sulfate, calcium carbonate, iron and
By Francis Boodoo
Optimizing RO recovery with cyclic ion-exchange softening
silica). When cyclic ion-exchange soften-ing is combined with anti-scalant dosing, a unique synergy takes place, allowing for higher RO recovery rates than achiev-able using either technology alone. The rewards are reduced concentrate volume and disposal cost as well as reduced con-sumption of scarce water supplies.
Comparison PointsWhile the benefits of this green tech-
nology may be obvious, it is important to assess whether the technology is com-petitive with the established alternatives of acid or anti-scalant dosing. From a cost standpoint, cyclic ion-exchange soft-ening eliminates three of the major cost components that have inhibited wider use of conventional ion-exchange soften-ing: commercial salt, the associated labor for storage and handling and the increas-ing cost and complexity for disposal of spent brine. Water consumed in regen-eration is also a fraction of that used for conventional water softeners because no salt dilution water is needed and rinse volumes are much lower due to the lower brine concentration. Costs for pump-ing of the feedwater and for disposal of wastewater are lower, too, because higher recovery rates are achieved.
For comparing scale control pretreat-ment options, a brackish water typical of that found in the southwestern U.S. was used in a desktop evaluation to compare three options:
1. Anti-scalant dosing only;2. Anti-scalant plus acid dosing; and3. Anti-scalant plus cyclic ion exchange.
A water analysis showed a TDS of 1,254 mg/L, a pH of 7.6 and barium and hardness levels that can significantly limit recovery rates. A permeate flowrate of 100
cu meters/hour was chosen. The com-parative operating and amortized capital costs to produce 1 cu meter of permeate, or 264 gal, were then determined.
Software from an independent anti-scalant vendor was used to determine the appropriate anti-scalant dosage. For option No. 1, using only anti-scalant dos-ing, RO recovery was limited by potential of calcium carbonate scale formation to 84%. For option No. 2, using anti-scalant and acid dosing, recovery was limited to 86% by potential for barium sulfate scale formation. Option No. 3, using cyclic ion-exchange softening plus anti-scalant dosing at a reduced rate, allowed maxi-mum permeate recovery of 95%—limited not by scaling potential but by silica foul-ing potential. Softening using the new technology predicted reduction of barium and calcium to less than 0.02 mg/L and 2 mg/L, respectively.
In this example, the $46,000 cost of the resin was spread over five years; the capital cost for the ion-exchange ves-sels was assumed to be $167,000 and amortized over 10 years using straight-line depreciation. The cost of water purchases and cost for disposal of reject water were combined and assumed to be low at 50 cents per cubic meter, or about $2 per 1,000 gal. Acid cost was assumed to be 33 cents per kilogram, or 15 cents per pound, while anti-scalant cost was assumed to be $11 per kilo-gram, or $5 per pound.
The comparison shows that option No. 3 with cyclic ion-exchange softening plus reduced anti-scalant dosing was at least 40% lower in overall cost per cubic meter of permeate produced. Savings,
when producing 100 cu meters/hour of permeate and operating continuously, amounted to $43,000 annually.
Additional savings include the smaller size and lower cost for the feedwater train and the lower pumping cost for the feedwater. Reject water cost was the larg-est cost component for all three options. The higher the cost of water, the greater the savings realized with cyclic ion exchange. Because the cost of water and the cost of disposal varies by region, the technology will be more relevant to geographies where water supplies are scarce or where disposal costs are high.
While the long-term cost for cyclic ion-exchange softening may be lower than that of competitive alternatives, the extra capital outlay and space require-ments needed for implementation may be considered drawbacks, whether for new membrane projects or retrofit of existing plants. But these factors should not be considered in isolation, as water supplies are becoming scarcer and con-centrate disposal regulations are increas-ing in scope and complexity.
Implementation of environmentally friendly technology, such as cyclic ion-exchange softening, should be an ongo-ing part of the strategy to reduce overall cost for desalinated water while mini-mizing impact on the environment. MT
Francis Boodoo is technical sales manager for The Purolite Co. Boodoo can be reached at [email protected] or 800.343.1500.
For more information, write in 1101 on this issue’s Reader Service Card or visit www.wwdmag.com/lm.cfm/mt101001.
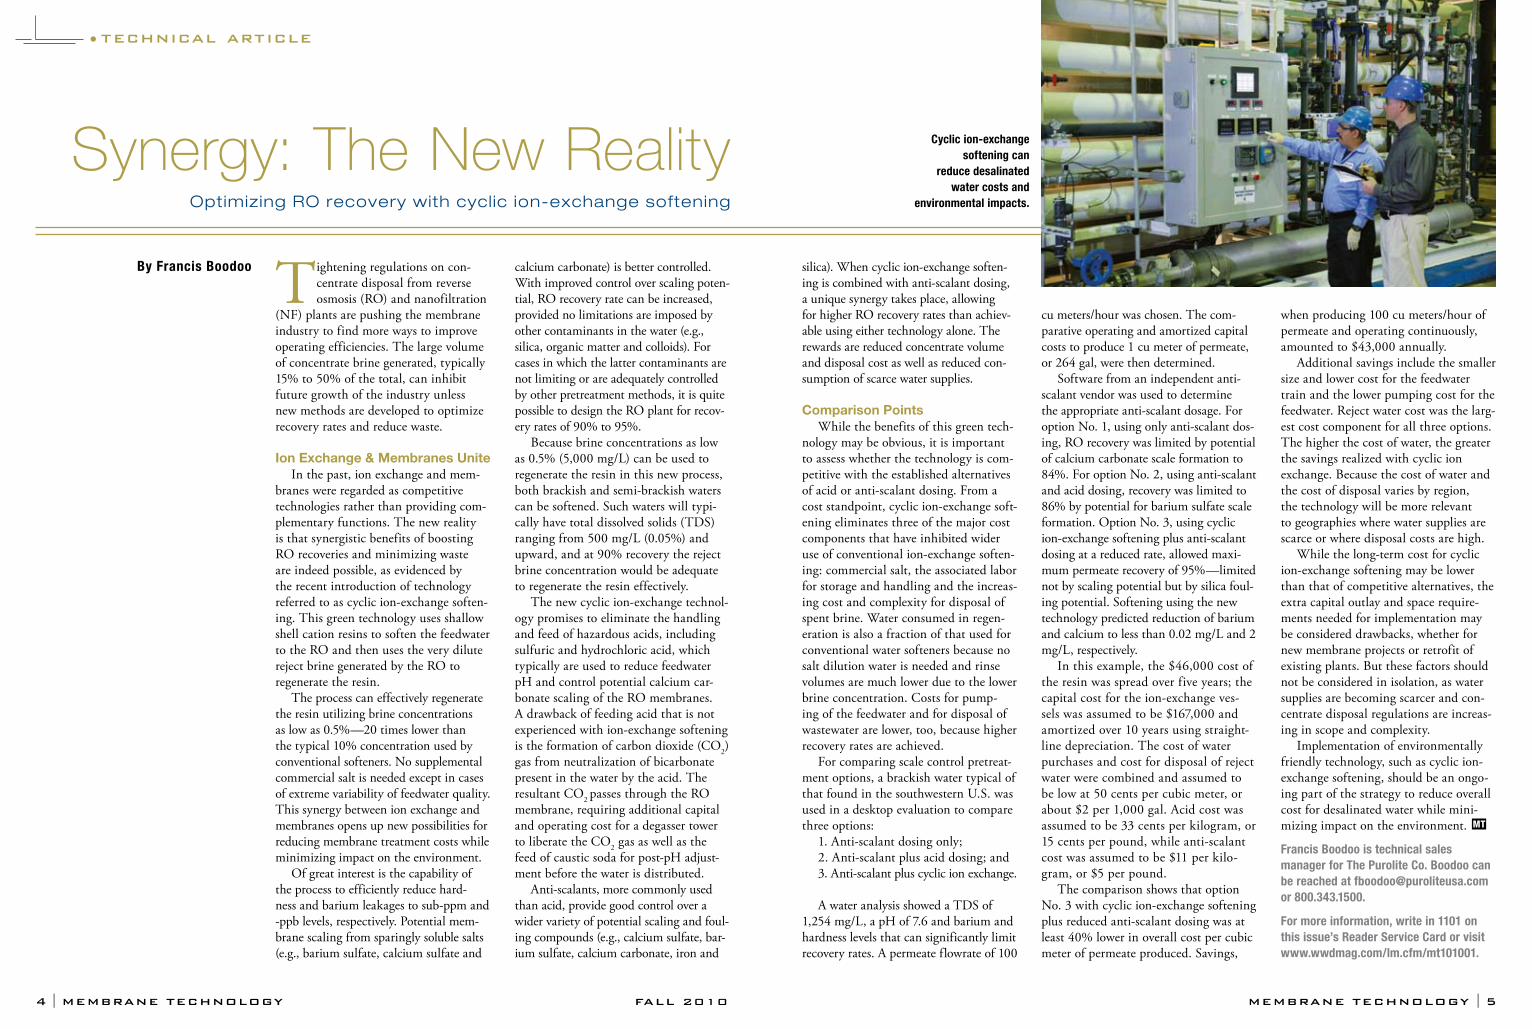
Cyclic ion-exchange softening can
reduce desalinated water costs and
environmental impacts.
6 I membrane technology fall 2010 membrane technology I 7
•case study
Reuse in the NortheastWater and wastewater utilities
are beginning to discover that wastewater reuse can be an
important component of a comprehen-sive watershed management program or alternative water supply plan. Removing wastewater streams from surface water bodies can reduce pollutant loads, includ-ing nutrients, heavy metals, pharmaceu-ticals and endocrine-disrupting com-pounds, to these receiving waters.
Instead of discharging wastewater to lakes, rivers or streams that often feed other water supplies, wastewater can be treated to a higher level and reused for beneficial purposes. Wastewater reuse also reduces water demands that potable sup-plies would otherwise have to satisfy.
Although not traditionally viewed as a region having much need for reclaimed water projects, a growing number of facili-ties in the Northeast are strongly consider-ing the benefits of reclaimed water. There are currently several operational facilities located throughout the Northeast that
have beneficial reuse projects. Utilities typically are steered away
due to lack of drivers, lack of public edu-cation and acceptance and lack of estab-lished regulatory framework (although this is changing for states such as New Jersey and Massachusetts that do have reuse regulations). In recent years, how-ever, more utilities are looking toward wastewater reuse as a way to free up potable water supplies for other uses. This is becoming particularly important for communities that are approaching the limits of their water supply.
Drivers Behind UCONN’s Reclaimed Water Program
The University of Connecticut (UCONN) in Storrs, Conn., provides potable water and wastewater treatment services to its main campus and depot campus, as well as to some adjacent areas within the town of Mansfield. In antici-pation of increasing potable water needs on its campus due to a growing popula-tion, and faced with a lack of additional water supplies in the area, UCONN sought to implement a long-term, sus-tainable program to provide an adequate supply of water to meet the nonpotable needs of its campus.
Hazen and Sawyer was retained to study the feasibility of constructing a reclaimed water facility for the purpose of utilizing appropriately treated efflu-ent from UCONN’s wastewater treat-ment plant as feedwater for both the uni-versity’s Central Utilities Plant (which includes boiler and cooling tower water systems) and turf irrigation.
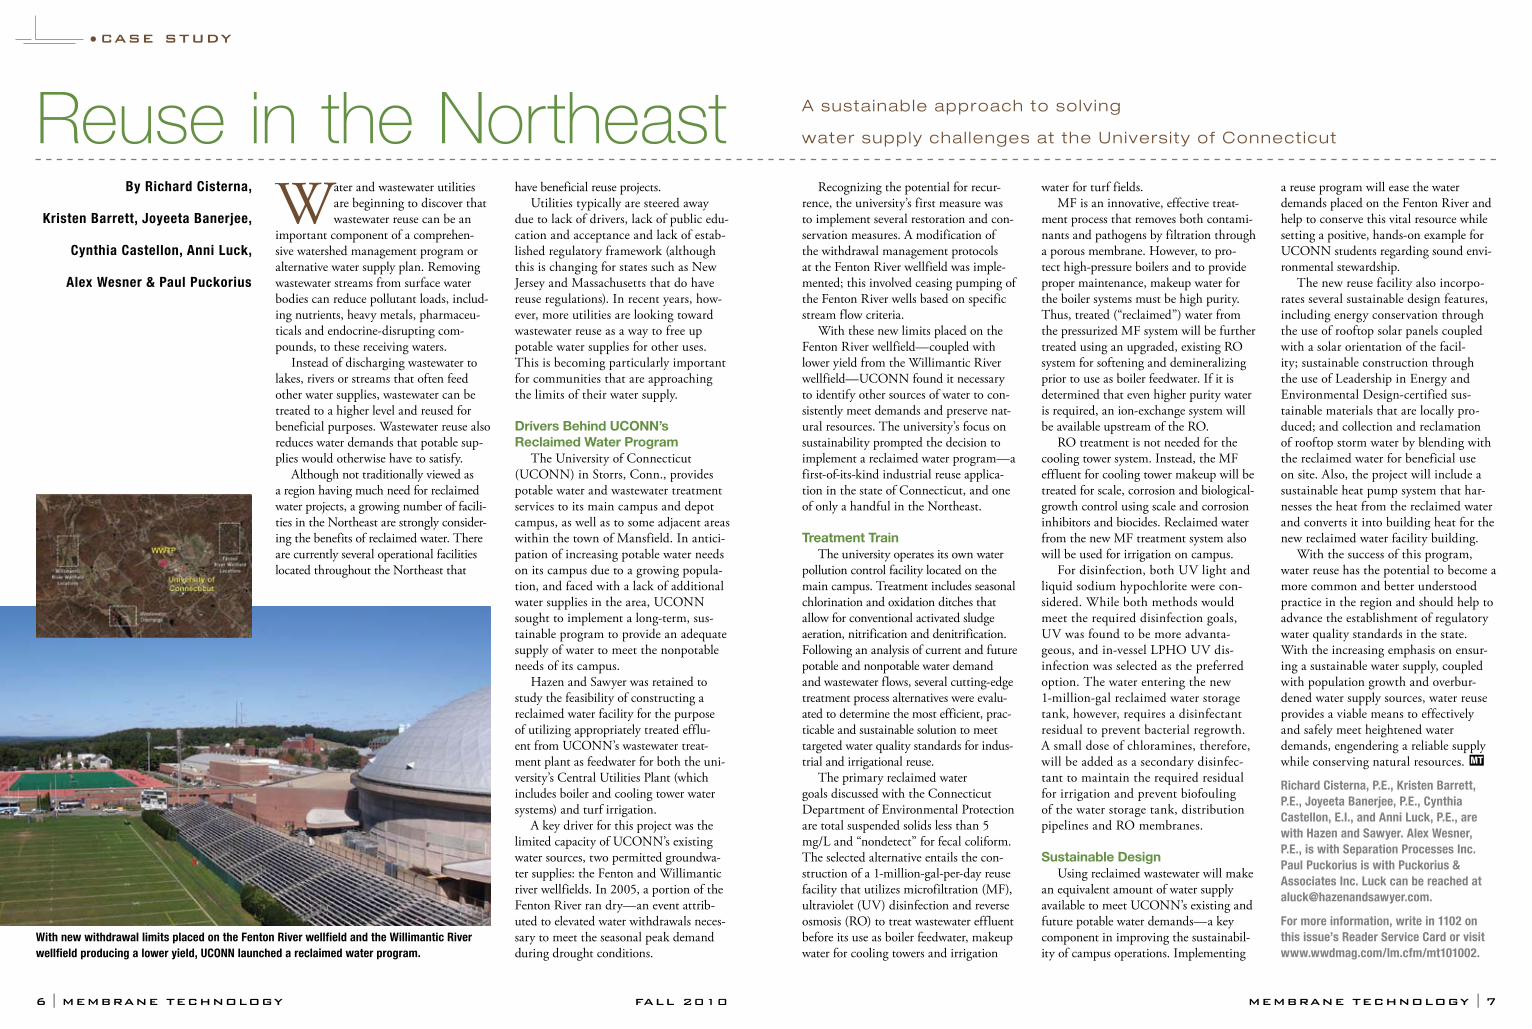
A key driver for this project was the limited capacity of UCONN’s existing water sources, two permitted groundwa-ter supplies: the Fenton and Willimantic river wellfields. In 2005, a portion of the Fenton River ran dry—an event attrib-uted to elevated water withdrawals neces-sary to meet the seasonal peak demand during drought conditions.
By Richard Cisterna,
Kristen Barrett, Joyeeta Banerjee,
Cynthia Castellon, Anni Luck,
Alex Wesner & Paul Puckorius
A sustainable approach to solv ing
water supply chal lenges at the University of Connecticut
Recognizing the potential for recur-rence, the university’s first measure was to implement several restoration and con-servation measures. A modification of the withdrawal management protocols at the Fenton River wellfield was imple-mented; this involved ceasing pumping of the Fenton River wells based on specific stream flow criteria.
With these new limits placed on the Fenton River wellfield—coupled with lower yield from the Willimantic River wellfield—UCONN found it necessary to identify other sources of water to con-sistently meet demands and preserve nat-ural resources. The university’s focus on sustainability prompted the decision to implement a reclaimed water program—a first-of-its-kind industrial reuse applica-tion in the state of Connecticut, and one of only a handful in the Northeast.
Treatment TrainThe university operates its own water
pollution control facility located on the main campus. Treatment includes seasonal chlorination and oxidation ditches that allow for conventional activated sludge aeration, nitrification and denitrification. Following an analysis of current and future potable and nonpotable water demand and wastewater flows, several cutting-edge treatment process alternatives were evalu-ated to determine the most efficient, prac-ticable and sustainable solution to meet targeted water quality standards for indus-trial and irrigational reuse.
The primary reclaimed water goals discussed with the Connecticut Department of Environmental Protection are total suspended solids less than 5 mg/L and “nondetect” for fecal coliform. The selected alternative entails the con-struction of a 1-million-gal-per-day reuse facility that utilizes microfiltration (MF), ultraviolet (UV) disinfection and reverse osmosis (RO) to treat wastewater effluent before its use as boiler feedwater, makeup water for cooling towers and irrigation
water for turf fields. MF is an innovative, effective treat-
ment process that removes both contami-nants and pathogens by filtration through a porous membrane. However, to pro-tect high-pressure boilers and to provide proper maintenance, makeup water for the boiler systems must be high purity. Thus, treated (“reclaimed”) water from the pressurized MF system will be further treated using an upgraded, existing RO system for softening and demineralizing prior to use as boiler feedwater. If it is determined that even higher purity water is required, an ion-exchange system will be available upstream of the RO.
RO treatment is not needed for the cooling tower system. Instead, the MF effluent for cooling tower makeup will be treated for scale, corrosion and biological-growth control using scale and corrosion inhibitors and biocides. Reclaimed water from the new MF treatment system also will be used for irrigation on campus.
For disinfection, both UV light and liquid sodium hypochlorite were con-sidered. While both methods would meet the required disinfection goals, UV was found to be more advanta-geous, and in-vessel LPHO UV dis-infection was selected as the preferred option. The water entering the new 1-million-gal reclaimed water storage tank, however, requires a disinfectant residual to prevent bacterial regrowth. A small dose of chloramines, therefore, will be added as a secondary disinfec-tant to maintain the required residual for irrigation and prevent biofouling of the water storage tank, distribution pipelines and RO membranes.
Sustainable Design Using reclaimed wastewater will make
an equivalent amount of water supply available to meet UCONN’s existing and future potable water demands—a key component in improving the sustainabil-ity of campus operations. Implementing
a reuse program will ease the water demands placed on the Fenton River and help to conserve this vital resource while setting a positive, hands-on example for UCONN students regarding sound envi-ronmental stewardship.
The new reuse facility also incorpo-rates several sustainable design features, including energy conservation through the use of rooftop solar panels coupled with a solar orientation of the facil-ity; sustainable construction through the use of Leadership in Energy and Environmental Design-certified sus-tainable materials that are locally pro-duced; and collection and reclamation of rooftop storm water by blending with the reclaimed water for beneficial use on site. Also, the project will include a sustainable heat pump system that har-nesses the heat from the reclaimed water and converts it into building heat for the new reclaimed water facility building.
With the success of this program, water reuse has the potential to become a more common and better understood practice in the region and should help to advance the establishment of regulatory water quality standards in the state. With the increasing emphasis on ensur-ing a sustainable water supply, coupled with population growth and overbur-dened water supply sources, water reuse provides a viable means to effectively and safely meet heightened water demands, engendering a reliable supply while conserving natural resources. MT
Richard Cisterna, P.E., Kristen Barrett, P.E., Joyeeta Banerjee, P.E., Cynthia Castellon, E.I., and Anni Luck, P.E., are with Hazen and Sawyer. Alex Wesner, P.E., is with Separation Processes Inc. Paul Puckorius is with Puckorius & Associates Inc. Luck can be reached at [email protected].
For more information, write in 1102 on this issue’s Reader Service Card or visit www.wwdmag.com/lm.cfm/mt101002.
With new withdrawal limits placed on the Fenton River wellfield and the Willimantic River wellfield producing a lower yield, UCONN launched a reclaimed water program.
8 I membrane technology fall 2010
•case study
membrane technology I 9
Over the last two decades, reverse osmosis (RO) has become the process of choice for removing
dissolved salts and other contaminants from a variety of water sources, includ-ing seawater, groundwater and wastewater effluents. RO is a pressure-driven pro-cess, where the applied pressure required to drive water through the membrane is a function of the total dissolved sol-ids (TDS) in the feed source. As fou-lants build up on the membrane surface, the foulant acts as an impediment to flow and the pressure required to drive water through the system increases. Left alone, the fouling can build up until the required pressure exceeds the feed pump capabilities, and a loss of permeate pro-duction eventually will occur. Membrane cleaning is used to remove the foulant from the membrane surface and return the system to baseline conditions.
RO technology has been adopted by both industrial and municipal users. Industrial RO systems are often smaller (less than 1-million-gal-per-day [mgd] permeate capacity) and sometimes designed without the ability to clean the membrane elements in place within the pressure vessels. In these cases, operators either send membrane elements off site for cleaning, or elements are simply discarded when they have been completely fouled.
Municipal systems are often large scale, and they typically range between 1 mgd and 100 mgd in permeate pro-duction. Individual RO train capacities typically range from 0.5 mgd to 5 mgd.
The size of municipal facilities usually requires an operating approach whereby a membrane that is eventually fouled during the treatment process is cleaned in situ using a chemical solution selected based on the type and nature of the foulant on the membrane surface. The cleaning solution is introduced into the membrane system through an ancillary cleaning system. For large municipal sys-tems, membrane cleaning in this manner is more economical and practical than offsite cleaning or replacing the mem-brane. Through membrane cleaning, the pressure required to operate the RO system is reduced, and hence the energy consumption is minimized.
Calculate to OptimizeThere are industry rules of thumb
as well as specific RO manufacturer guidelines for when and how to clean RO membranes. These typically revolve around the parameters of water perme-ability and normalized differential pres-sure. Calculated indicators of water per-meability (e.g., specific flux, normalized feed pressure, normalized permeate flow and normalized flux) can be used as indi-cators of the amount of fouling on the membrane surface. The normalized dif-ferential pressure offers an indication of the amount of material deposited within the feed/brine spacer of the RO elements, restricting flow through the system.
Guidance on membrane cleaning from the industry suggests cleaning the RO train when the water permeability
By Eric Owens & Mehul Patel
Economic analysis: A Cal i fornia groundwater
replenishment system appl icat ion
has decreased by 10% to 25%, or when the normalized differential pressure has increased by 20% to 50%. This guid-ance, however, does not necessarily offer the most economical point of operation for the RO system.
RO cleaning can be considered nothing more than a response against increasing system pressures and energy costs. But rather than follow anecdotal cleaning triggers, operators should exam-ine the balance between the cost of energy associated with fouling and the cost of performing the cleaning for their particular system. All RO systems are somewhat different, and there are many variables that contribute to this exami-nation. In order to identify a balance between fouling and cleaning, the fol-lowing variables must be considered for a particular system:
• Costofenergypaidbythe municipal agency;
• Specificfoulingrateofthe RO system;
• Thenatureofthefoulantandcleaning effectiveness;
• Totalcostofchemicalsolution;• Laborassociatedwithperforming
a cleaning; and• Lostpermeateproductiondueto
downtime during cleaning.
One such examination was performed for the RO trains within the Orange County Water District’s (OCWD) groundwater replenishment system (GWR) in California. The following is
a discussion of the economic analysis performed for this RO system in order to identify the balance between fouling costs and cleaning costs. Ultimately, this economic analysis was successful in iden-tifying the optimum cleaning interval given the specific GWR variables.
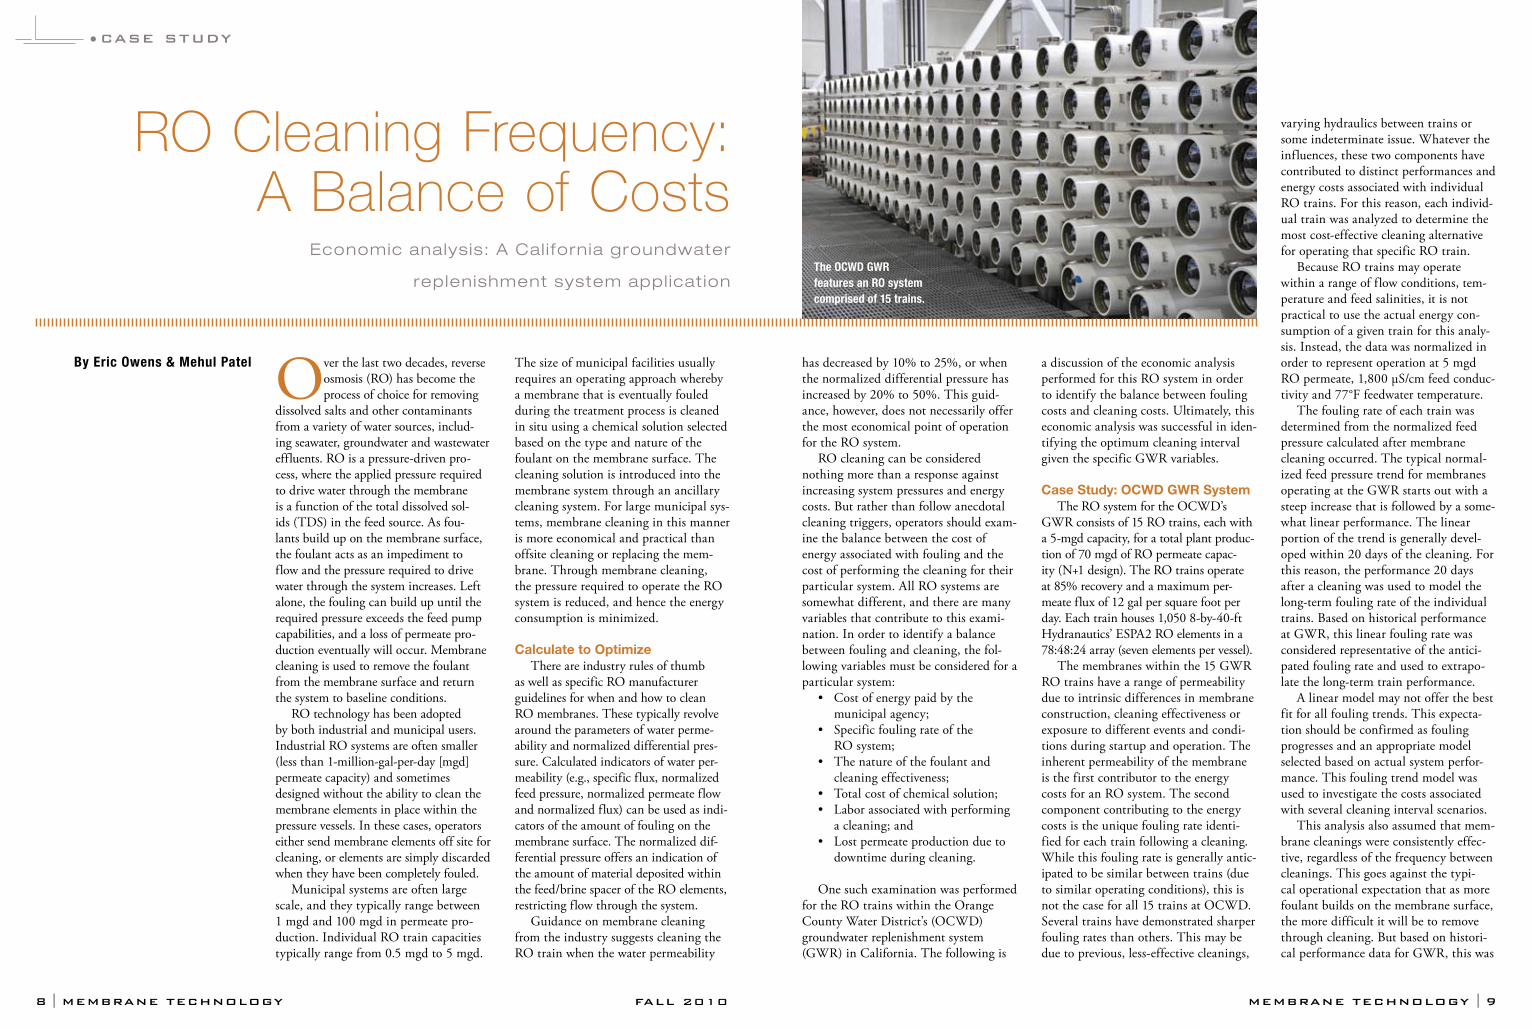
Case Study: OCWD GWR SystemThe RO system for the OCWD’s
GWR consists of 15 RO trains, each with a 5-mgd capacity, for a total plant produc-tion of 70 mgd of RO permeate capac-ity (N+1 design). The RO trains operate at 85% recovery and a maximum per-meate flux of 12 gal per square foot per day. Each train houses 1,050 8-by-40-ft Hydranautics’ ESPA2 RO elements in a 78:48:24 array (seven elements per vessel).
The membranes within the 15 GWR RO trains have a range of permeability due to intrinsic differences in membrane construction, cleaning effectiveness or exposure to different events and condi-tions during startup and operation. The inherent permeability of the membrane is the first contributor to the energy costs for an RO system. The second component contributing to the energy costs is the unique fouling rate identi-fied for each train following a cleaning. While this fouling rate is generally antic-ipated to be similar between trains (due to similar operating conditions), this is not the case for all 15 trains at OCWD. Several trains have demonstrated sharper fouling rates than others. This may be due to previous, less-effective cleanings,
varying hydraulics between trains or some indeterminate issue. Whatever the influences, these two components have contributed to distinct performances and energy costs associated with individual RO trains. For this reason, each individ-ual train was analyzed to determine the most cost-effective cleaning alternative for operating that specific RO train.
Because RO trains may operate within a range of flow conditions, tem-perature and feed salinities, it is not practical to use the actual energy con-sumption of a given train for this analy-sis. Instead, the data was normalized in order to represent operation at 5 mgd RO permeate, 1,800 μS/cm feed conduc-tivity and 77°F feedwater temperature.
The fouling rate of each train was determined from the normalized feed pressure calculated after membrane cleaning occurred. The typical normal-ized feed pressure trend for membranes operating at the GWR starts out with a steep increase that is followed by a some-what linear performance. The linear portion of the trend is generally devel-oped within 20 days of the cleaning. For this reason, the performance 20 days after a cleaning was used to model the long-term fouling rate of the individual trains. Based on historical performance at GWR, this linear fouling rate was considered representative of the antici-pated fouling rate and used to extrapo-late the long-term train performance.
A linear model may not offer the best fit for all fouling trends. This expecta-tion should be confirmed as fouling progresses and an appropriate model selected based on actual system perfor-mance. This fouling trend model was used to investigate the costs associated with several cleaning interval scenarios.
This analysis also assumed that mem-brane cleanings were consistently effec-tive, regardless of the frequency between cleanings. This goes against the typi-cal operational expectation that as more foulant builds on the membrane surface, the more difficult it will be to remove through cleaning. But based on histori-cal performance data for GWR, this was
RO Cleaning Frequency: A Balance of Costs
The OCWD GWR features an RO system comprised of 15 trains.
10 I membrane technology fall 2010
•case study
membrane technology I 11
unique performance of each train, the optimum cleaning interval could fall on either side of the six-month interval.
The results of the analysis of 15 indi-vidual trains were as follows: The most economical cleaning frequency for seven of the trains was determined as every five months. The most economical cleaning frequency for seven of the trains was calcu-lated as every eight months. One RO train calculated an optimum cleaning frequency of every 10 months. The optimum CIP interval and minimum annual energy and CIP costs were determined from the para-bolic curves for each train.
Adopting a Similar ApproachIndustry standards for CIP triggers
may not offer the most efficient point of operation for RO systems. An eco-nomic analysis investigating the balance between energy costs and cleaning costs
should be applied to any RO system to ensure that the current cleaning regime offers the most cost-effective operation and performance. The analysis described herein was based on a combination of real-world data and observations but assumes the cleanings applied are con-sistently effective. It also assumes the modeled fouling rates are observed and repeatable following each cleaning.
This is generally the case at OCWD, but should the fouling rate or cleaning effectiveness deviate from the model, the evaluation would need to be redone. If this analysis indicates the benefit of a longer cleaning frequency, it would be wise for operators to confirm their assumptions through gradual imple-mentation of longer cleaning frequen-cies. This would allow verification of the modeled fouling rate and confirm con-sistent cleanability is achieved.
A significant savings of approximately $250,000 per year was identified at OCWD through performing an eco-nomic analysis to identify the optimum cleaning interval for the district’s system. Not all RO systems are guaranteed the same degree of savings determined for OCWD, but most would likely benefit from applying a similar approach to their cleaning philosophy. MT
Eric Owens, P.E., is project manager for Separation Processes Inc. Owens can be reached at eowens@spi- engineering.com. Mehul Patel, P.E., is principal process engineer for the Orange County Water District. Patel can be reached at [email protected].
For more information, write in 1103 on this issue’s Reader Service Card or visit www.wwdmag.com/lm.cfm/mt101003.
considered an acceptable assumption for this RO system. Other RO facilities with different fouling characteristics and cleaning effectiveness may not be able to make this assumption if consistent and repeatable cleanings cannot be achieved.
The cost associated with membrane cleanings included the labor cost, the chemical costs of the district’s cleaning procedure and the cost of lost produc-tion due to offline time. While the GWR system design accounts for one of the 15 trains being offline (N+1), it was assumed the fifteenth train could be offline for any number of other reasons; lost produc-tion due to cleaning was factored into this analysis. For this investigation, the total cleaning cost amounted to $15,929 multi-plied by the number of cleanings per year.
Even though the energy costs decrease with an increased frequency of cleanings, the reduced energy costs are offset by the
additional cost of the cleanings. This investiga-tion was taken further to deter-mine the mini-mum operation and maintenance (O&M) costs for CIP intervals ranging from 30 days to 365 days. The total cleaning and total energy costs were compared and com-bined for this range of CIP intervals in order to determine the optimum cleaning interval that offered the minimum total operating costs.
Summing the two costs together resulted in a “Total O&M Cost” curve with a shape similar to that of a parab-ola. In this presentation, the total O&M costs toward the lefthand side of the par-abolic curve are heavily weighted toward
chemical costs due to frequent cleanings. The total O&M costs to the righthand side of the parabolic curve are more heavily weighted toward energy costs as a result of accepting more fouling within the RO train. The minimum O&M costs can be determined by identifying the minimum point on the curve.
This analysis was applied to each RO train and its unique condition and fouling rate in order to determine the minimum total O&M costs related to cleaning and fouling. Depending on the
Write in 401
Ultrameter II™ 6Psi
NEW! bluDock™ Wireless Data Transfer (optional)
NEW! LSI and Hardness Calculator
bluDock EnabledTM
www.myronl.com
CONDUCTIVITY, RESISTIVITY, TDS, pH, OPR, FREE CHLORINE & TEMP
Write in 402
All RO system operators should analyze energy and cleaning costs to find a balance between cost-effectiveness and performance.
12 I membrane technology fall 2010 membrane technology I 13
•technical article
Beyond Conventional MBRs
Submerged membrane bioreactor (MBR) technology continues to gain traction on a global level as a
cost-effective means for treating waste-water. Moreover, given the high efflu-ent quality, MBR systems increasingly are being used for water recycling and as feed to reverse osmosis systems. The advantages of the technology are well documented in literature and include, among others, small footprint, superior effluent and ease of operation.
Despite the substantial upside of owning and operating an MBR, there is also a downside to consider. If an MBR system is not properly designed to run efficiently or is not operated in an energy-efficient manner—or some com-bination thereof—what looks sustainable on paper will not be in real life.
The perception, and in some cases reality, that MBR systems are “energy hogs” chewing up kilowatts at rates two to 20 times the theoretically achiev-able value of 0.32 kWh/cu meter (1,200 kWh/MG) is not specific to one mem-
brane technology. A growing body of evidence appears to support the idea that membrane geometry may have less to do with actual system energy consumption than other factors.
For example, in a recent survey of nine U.S. MBR installa-tions—some using hollow-fiber mem-branes and others using flat plates—aggregate consump-tion numbers varied
between 5,400 kWh/MG and 16,000 kWh/MG. For comparison, a typical energy estimate for a new MBR plant will be approximately 3,000 kWh/MG and conventional activated sludge plants have reported usages averaging less than 3,500 kWh/cu meter.
A more granular look at many of these plants reveals that they can and do run efficiently near design flows but become increasingly inefficient as less water is treated. The decrease in effi-ciency is often due to a lack of process turndown and specifically may be caused by so-called parasitic loads (e.g., mixers, blowers and pumps). Other factors such as system complexity and compounding equipment inefficiencies may contribute to the high energy usage rates and ulti-mately may determine the fate of MBR technology rather than the type of mem-brane equipment used for filtration.
New TechnologyEcoBlox systems are specifically
designed for ease of operation, requiring 70% less automation; the biggest advan-tage to end-users, however, may ultimately be reduced installation costs. Whereas recent data suggests that conventional MBR systems may cost between $7.80/gal and $13.80/gal to build, contractor esti-mates indicate that EcoBlox systems may cost less than $4/gal to construct due to the reduced footprint, reduced concrete and overall process simplicity.
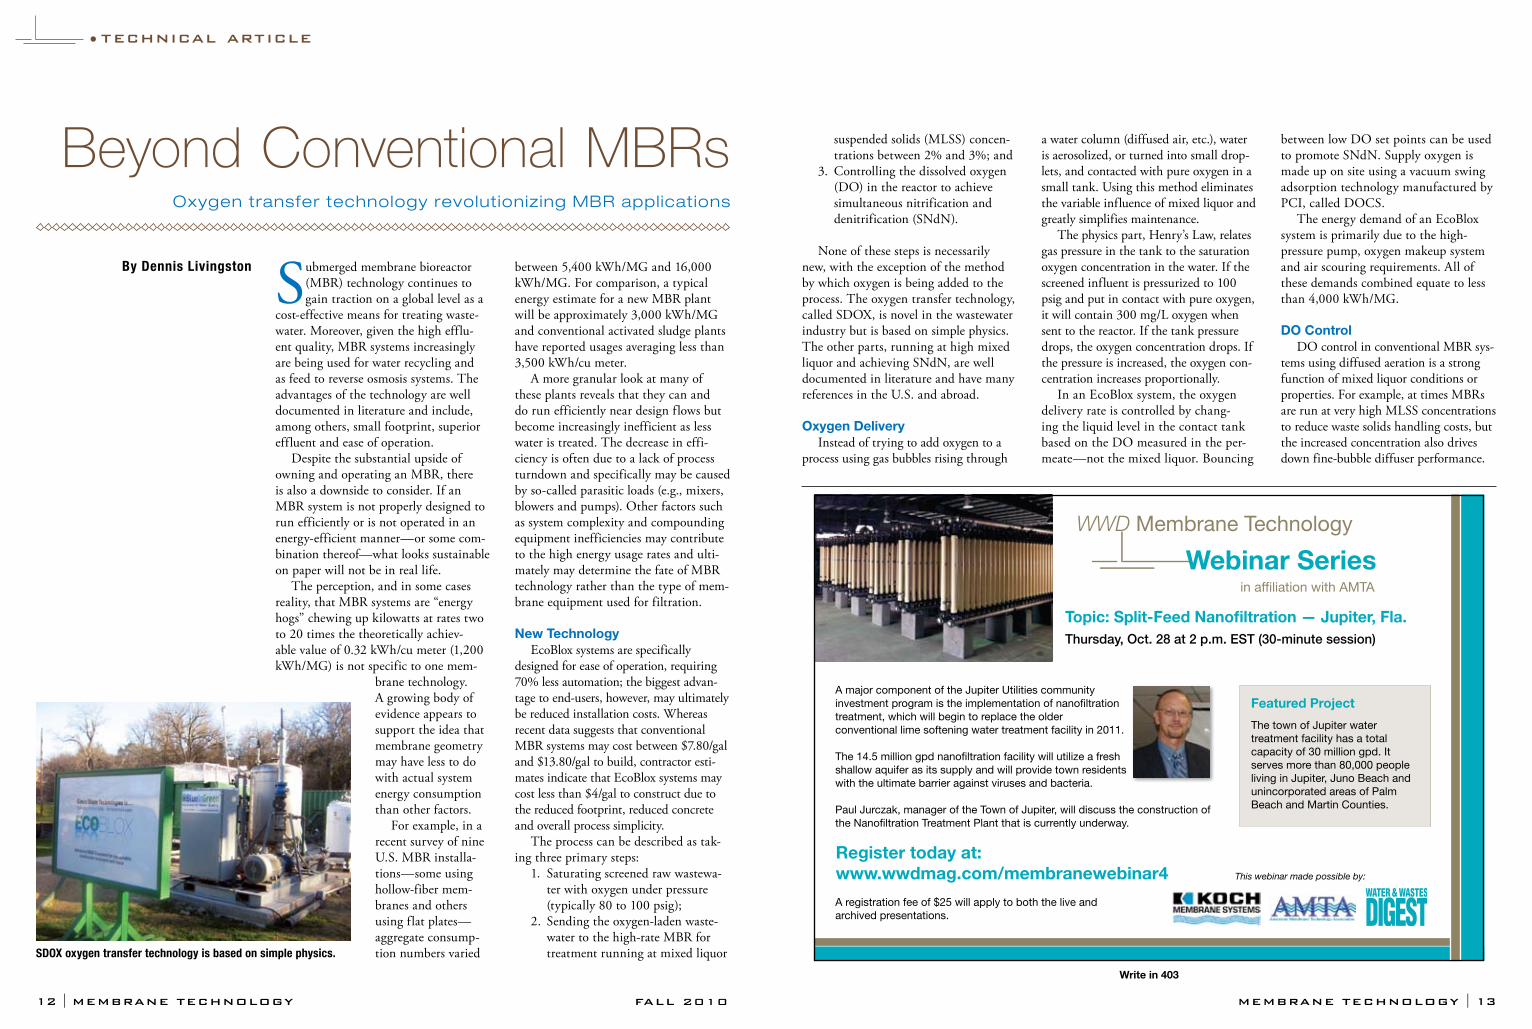
The process can be described as tak-ing three primary steps:
1. Saturating screened raw wastewa-ter with oxygen under pressure (typically 80 to 100 psig);
2. Sending the oxygen-laden waste-water to the high-rate MBR for treatment running at mixed liquor
By Dennis Livingston
Oxygen transfer technology revolutionizing MBR applications
suspended solids (MLSS) concen-trations between 2% and 3%; and
3. Controlling the dissolved oxygen (DO) in the reactor to achieve simultaneous nitrification and denitrification (SNdN).
None of these steps is necessarily new, with the exception of the method by which oxygen is being added to the process. The oxygen transfer technology, called SDOX, is novel in the wastewater industry but is based on simple physics. The other parts, running at high mixed liquor and achieving SNdN, are well documented in literature and have many references in the U.S. and abroad.
Oxygen DeliveryInstead of trying to add oxygen to a
process using gas bubbles rising through
a water column (diffused air, etc.), water is aerosolized, or turned into small drop-lets, and contacted with pure oxygen in a small tank. Using this method eliminates the variable influence of mixed liquor and greatly simplifies maintenance.
The physics part, Henry’s Law, relates gas pressure in the tank to the saturation oxygen concentration in the water. If the screened influent is pressurized to 100 psig and put in contact with pure oxygen, it will contain 300 mg/L oxygen when sent to the reactor. If the tank pressure drops, the oxygen concentration drops. If the pressure is increased, the oxygen con-centration increases proportionally.
In an EcoBlox system, the oxygen delivery rate is controlled by chang-ing the liquid level in the contact tank based on the DO measured in the per-meate—not the mixed liquor. Bouncing
between low DO set points can be used to promote SNdN. Supply oxygen is made up on site using a vacuum swing adsorption technology manufactured by PCI, called DOCS.
The energy demand of an EcoBlox system is primarily due to the high- pressure pump, oxygen makeup system and air scouring requirements. All of these demands combined equate to less than 4,000 kWh/MG.
DO ControlDO control in conventional MBR sys-
tems using diffused aeration is a strong function of mixed liquor conditions or properties. For example, at times MBRs are run at very high MLSS concentrations to reduce waste solids handling costs, but the increased concentration also drives down fine-bubble diffuser performance.
WWD Membrane Technology
Webinar Series
Register today at: www.wwdmag.com/membranewebinar4
A registration fee of $25 will apply to both the live and archived presentations.
Topic: Split-Feed Nanofi ltration — Jupiter, Fla.Thursday, Oct. 28 at 2 p.m. EST (30-minute session)
This webinar made possible by:
Featured Project
The town of Jupiter water treatment facility has a total capacity of 30 million gpd. It serves more than 80,000 people living in Jupiter, Juno Beach and unincorporated areas of Palm Beach and Martin Counties.
in af� liation with AMTA
A major component of the Jupiter Utilities community investment program is the implementation of nano� ltration treatment, which will begin to replace the older conventional lime softening water treatment facility in 2011.
The 14.5 million gpd nano� ltration facility will utilize a fresh shallow aquifer as its supply and will provide town residents with the ultimate barrier against viruses and bacteria.
Paul Jurczak, manager of the Town of Jupiter, will discuss the construction of the Nano� ltration Treatment Plant that is currently underway.
Write in 403
SDOX oxygen transfer technology is based on simple physics.
14 I membrane technology fall 2010
•technical article
In other cases, operators may choose to run at lower or thinner solids concen-trations, but that can lead to excessive, uncontrollable DO in recycle streams and inhibit denitrification.
Whatever the process conditions, submerged instruments are prone
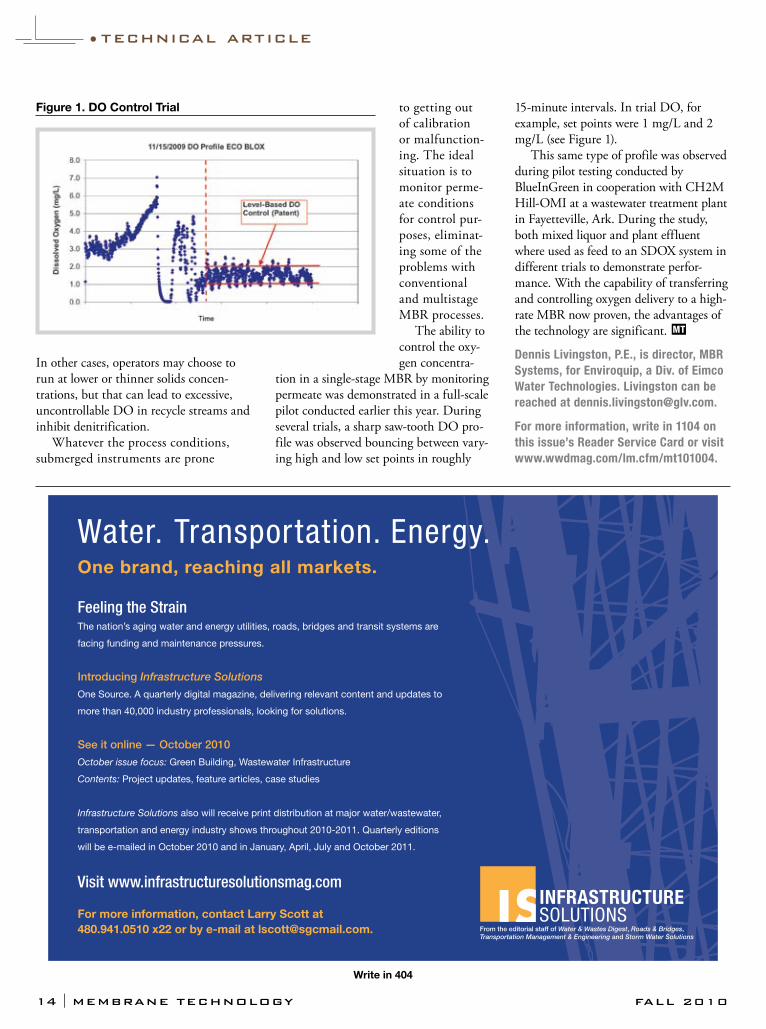
to getting out of calibration or malfunction-ing. The ideal situation is to monitor perme-ate conditions for control pur-poses, eliminat-ing some of the problems with conventional and multistage MBR processes.
The ability to control the oxy-gen concentra-
tion in a single-stage MBR by monitoring permeate was demonstrated in a full-scale pilot conducted earlier this year. During several trials, a sharp saw-tooth DO pro-file was observed bouncing between vary-ing high and low set points in roughly
15-minute intervals. In trial DO, for example, set points were 1 mg/L and 2 mg/L (see Figure 1).
This same type of profile was observed during pilot testing conducted by BlueInGreen in cooperation with CH2M Hill-OMI at a wastewater treatment plant in Fayetteville, Ark. During the study, both mixed liquor and plant effluent where used as feed to an SDOX system in different trials to demonstrate perfor-mance. With the capability of transferring and controlling oxygen delivery to a high-rate MBR now proven, the advantages of the technology are significant. MT
Dennis Livingston, P.E., is director, MBR Systems, for Enviroquip, a Div. of Eimco Water Technologies. Livingston can be reached at [email protected].
For more information, write in 1104 on this issue’s Reader Service Card or visit www.wwdmag.com/lm.cfm/mt101004.
Water. Transportation. Energy.One brand, reaching all markets.
Feeling the StrainThe nation’s aging water and energy utilities, roads, bridges and transit systems are
facing funding and maintenance pressures.
Introducing Infrastructure Solutions
One Source. A quarterly digital magazine, delivering relevant content and updates to
more than 40,000 industry professionals, looking for solutions.
See it online — October 2010
October issue focus: Green Building, Wastewater Infrastructure
Contents: Project updates, feature articles, case studies
Infrastructure Solutions also will receive print distribution at major water/wastewater,
transportation and energy industry shows throughout 2010-2011. Quarterly editions
will be e-mailed in October 2010 and in January, April, July and October 2011.
Visit www.infrastructuresolutionsmag.com
For more information, contact Larry Scott at 480.941.0510 x22 or by e-mail at [email protected]. From the editorial staff of Water & Wastes Digest, Roads & Bridges,
Transportation Management & Engineering and Storm Water Solutions
Write in 404
Figure 1. DO Control Trial
16 I membrane technology fall 2010 membrane technology I 17
•case study
The first thing anyone who man-ages water and wastewater learns is that water is the universal sol-
vent. Because of the unique properties of that dihydrogen monoxide molecule, owing to the extreme electronegativity of the oxygen atom, water is highly polar-ized and dissolves almost everything with which it comes into contact. This fact is important when one has to maintain equipment and structures that process
and distribute water because what the water has dissolved in it can cause it to be corrosive or scaling. What water generally has dissolved in it is at least some carbon dioxide and some calcium carbonate.
Carbon dioxide is ubiquitous and dis-solves at the surface of the water, form-ing carbonic acid in solution. Calcium carbonate, dissolved by the carbonic acid, is globally present in rock forma-tions (limestone), as well as in the physi-ological structures of organisms (particu-larly oceanic organisms) that excrete it. Calcium carbonate in its various forms is also used to buffer pH and stabilize solu-tion in process control. Managing the calcium carbonate equilibrium becomes critical to managing any water and wastewater treatment process.
Too little calcium carbonate yields water that is not saturated and may cause corrosion and deteriorate equip-ment and structures. A supersaturated solution will likely precipitate calcium carbonate, causing scale, reducing efficiency and eventually leading to system failure.
LSI in AZOne method for analyzing and man-
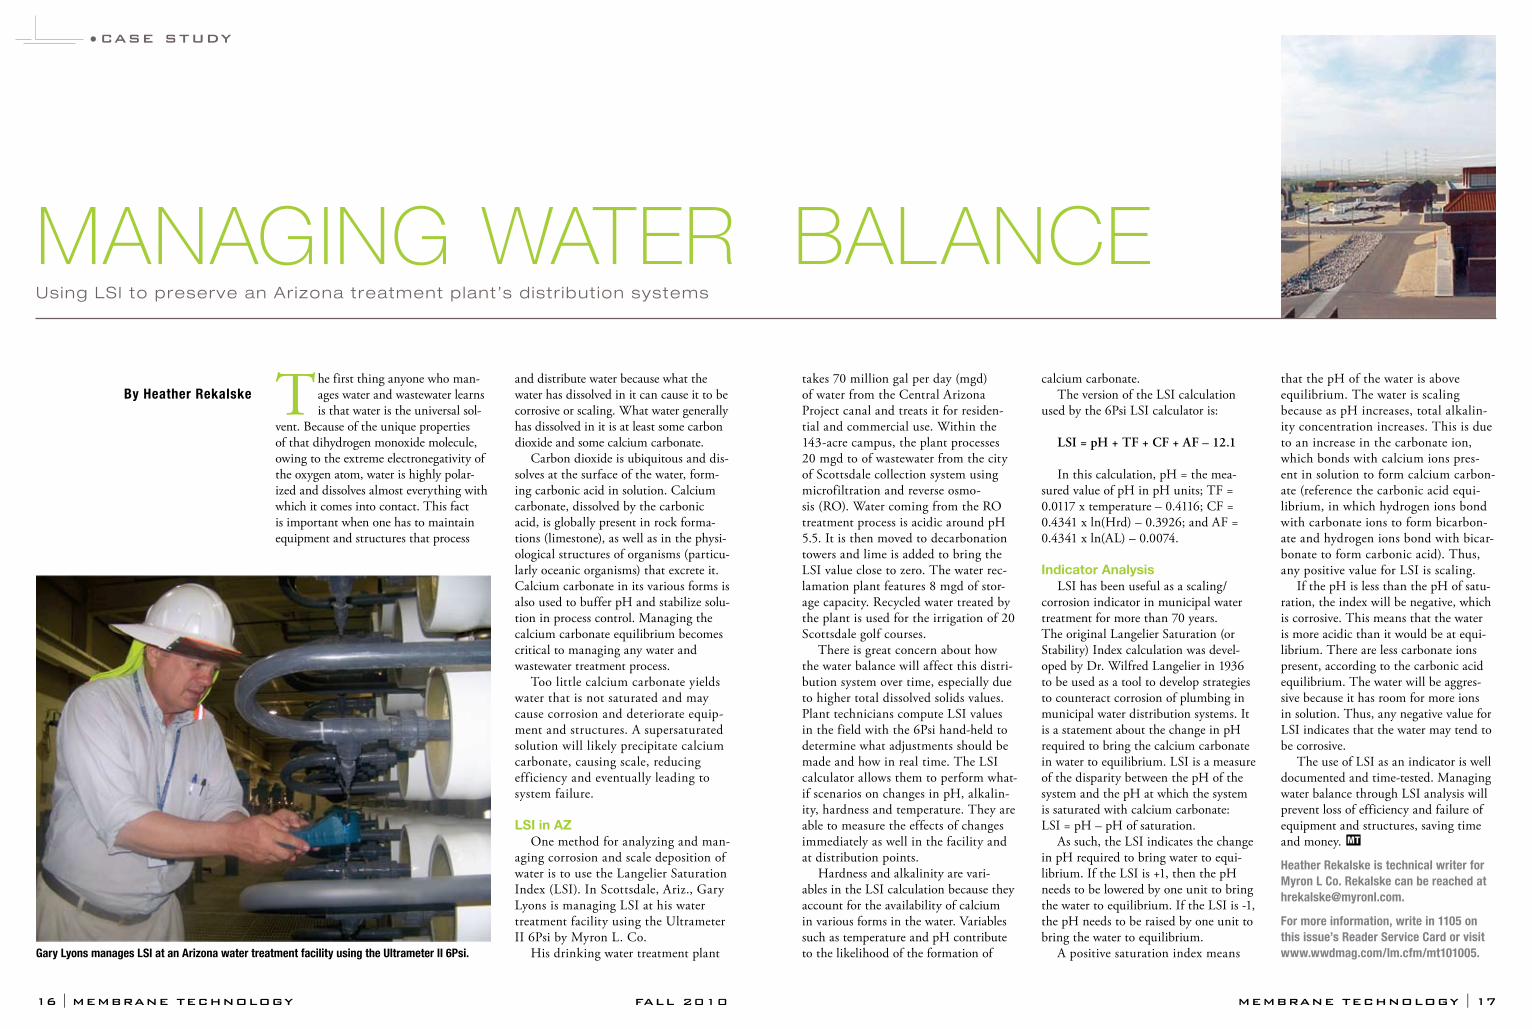
aging corrosion and scale deposition of water is to use the Langelier Saturation Index (LSI). In Scottsdale, Ariz., Gary Lyons is managing LSI at his water treatment facility using the Ultrameter II 6Psi by Myron L. Co.
His drinking water treatment plant
By Heather Rekalske
Using LSI to preserve an Ar izona treatment plant’s distr ibut ion systems
takes 70 million gal per day (mgd) of water from the Central Arizona Project canal and treats it for residen-tial and commercial use. Within the 143-acre campus, the plant processes 20 mgd to of wastewater from the city of Scottsdale collection system using microfiltration and reverse osmo-sis (RO). Water coming from the RO treatment process is acidic around pH 5.5. It is then moved to decarbonation towers and lime is added to bring the LSI value close to zero. The water rec-lamation plant features 8 mgd of stor-age capacity. Recycled water treated by the plant is used for the irrigation of 20 Scottsdale golf courses.
There is great concern about how the water balance will affect this distri-bution system over time, especially due to higher total dissolved solids values. Plant technicians compute LSI values in the field with the 6Psi hand-held to determine what adjustments should be made and how in real time. The LSI calculator allows them to perform what-if scenarios on changes in pH, alkalin-ity, hardness and temperature. They are able to measure the effects of changes immediately as well in the facility and at distribution points.
Hardness and alkalinity are vari-ables in the LSI calculation because they account for the availability of calcium in various forms in the water. Variables such as temperature and pH contribute to the likelihood of the formation of
calcium carbonate. The version of the LSI calculation
used by the 6Psi LSI calculator is:
LSI = pH + TF + CF + AF – 12.1
In this calculation, pH = the mea-sured value of pH in pH units; TF = 0.0117 x temperature – 0.4116; CF = 0.4341 x ln(Hrd) – 0.3926; and AF = 0.4341 x ln(AL) – 0.0074.
Indicator AnalysisLSI has been useful as a scaling/
corrosion indicator in municipal water treatment for more than 70 years. The original Langelier Saturation (or Stability) Index calculation was devel-oped by Dr. Wilfred Langelier in 1936 to be used as a tool to develop strategies to counteract corrosion of plumbing in municipal water distribution systems. It is a statement about the change in pH required to bring the calcium carbonate in water to equilibrium. LSI is a measure of the disparity between the pH of the system and the pH at which the system is saturated with calcium carbonate: LSI = pH – pH of saturation.
As such, the LSI indicates the change in pH required to bring water to equi-librium. If the LSI is +1, then the pH needs to be lowered by one unit to bring the water to equilibrium. If the LSI is -1, the pH needs to be raised by one unit to bring the water to equilibrium.
A positive saturation index means
that the pH of the water is above equilibrium. The water is scaling because as pH increases, total alkalin-ity concentration increases. This is due to an increase in the carbonate ion, which bonds with calcium ions pres-ent in solution to form calcium carbon-ate (reference the carbonic acid equi-librium, in which hydrogen ions bond with carbonate ions to form bicarbon-ate and hydrogen ions bond with bicar-bonate to form carbonic acid). Thus, any positive value for LSI is scaling.
If the pH is less than the pH of satu-ration, the index will be negative, which is corrosive. This means that the water is more acidic than it would be at equi-librium. There are less carbonate ions present, according to the carbonic acid equilibrium. The water will be aggres-sive because it has room for more ions in solution. Thus, any negative value for LSI indicates that the water may tend to be corrosive.
The use of LSI as an indicator is well documented and time-tested. Managing water balance through LSI analysis will prevent loss of efficiency and failure of equipment and structures, saving time and money. MT
Heather Rekalske is technical writer for Myron L Co. Rekalske can be reached at [email protected].
For more information, write in 1105 on this issue’s Reader Service Card or visit www.wwdmag.com/lm.cfm/mt101005.Gary Lyons manages LSI at an Arizona water treatment facility using the Ultrameter II 6Psi.
Managing Water Balance
membrane technology I 1918 I membrane technology fall 2010
•technical article
A California utility’s desalter brine and concentrate recovery permitting experience
By Carl W. Spangenberg Two membrane facilities operated by the same water district gen-erate concentrate waste streams
that are handled in distinctly different manners. Here we investigate the steps and methods used by California’s Irvine Ranch Water District (IRWD) on the permitting and concentrate recovery methods for the Irvine Desalter Project (IDP) and the Deep Aquifer Treatment System (DATS).
IDP Primary Treatment Plant (PTP)
The IDP-PTP removes mod-erately high levels of total dis-solved solids (TDS) and nitrates pumped from the principal aqui-fer within the Irvine groundwater basin. A full-scale reverse osmosis (RO) plant was put into operation in 2006 and can treat up to five wells that are 1,000 ft deep
and deliver 5.9 million gal per day (mgd) of raw water to the treatment plant. Approximately 2.7 mgd is treated by RO operated at 75.5% recovery, 15.4 gal per sq ft per day (gfd), feed pressures up to 300 psig and blended with the remaining raw bypass water.
A total of 434 membrane elements are used at the IDP-PTP facility. Water production levels vary according to fluc-tuations in the raw water feed. Targeted constituent levels in the product water include a TDS of 420 mg/L and nitrates less than 10 mg/L as nitrogen.
DATS The goal of the DATS is to remove
high color (300 color units) caused by natural organic matter from groundwa-ter pumped from the Santa Ana River Basin below five color units. A full-scale nanofiltration (NF) plant was constructed utilizing a design/build approach, with operation of the facility initiated in February 2002.
The DATS facility is an 8-mgd NF plant designed to operate at 98% recov-ery, 16 gfd at operating pressures up to 125 psig. It includes two deep wells approximately 2,000 ft deep; water col-lection; and membrane treatment, con-centrate recovery and concentrate disposal facilities. A total of 1,398 membrane ele-ments are used for the DATS facility.
Concentrate Disposal Options The water quality of the concentrate
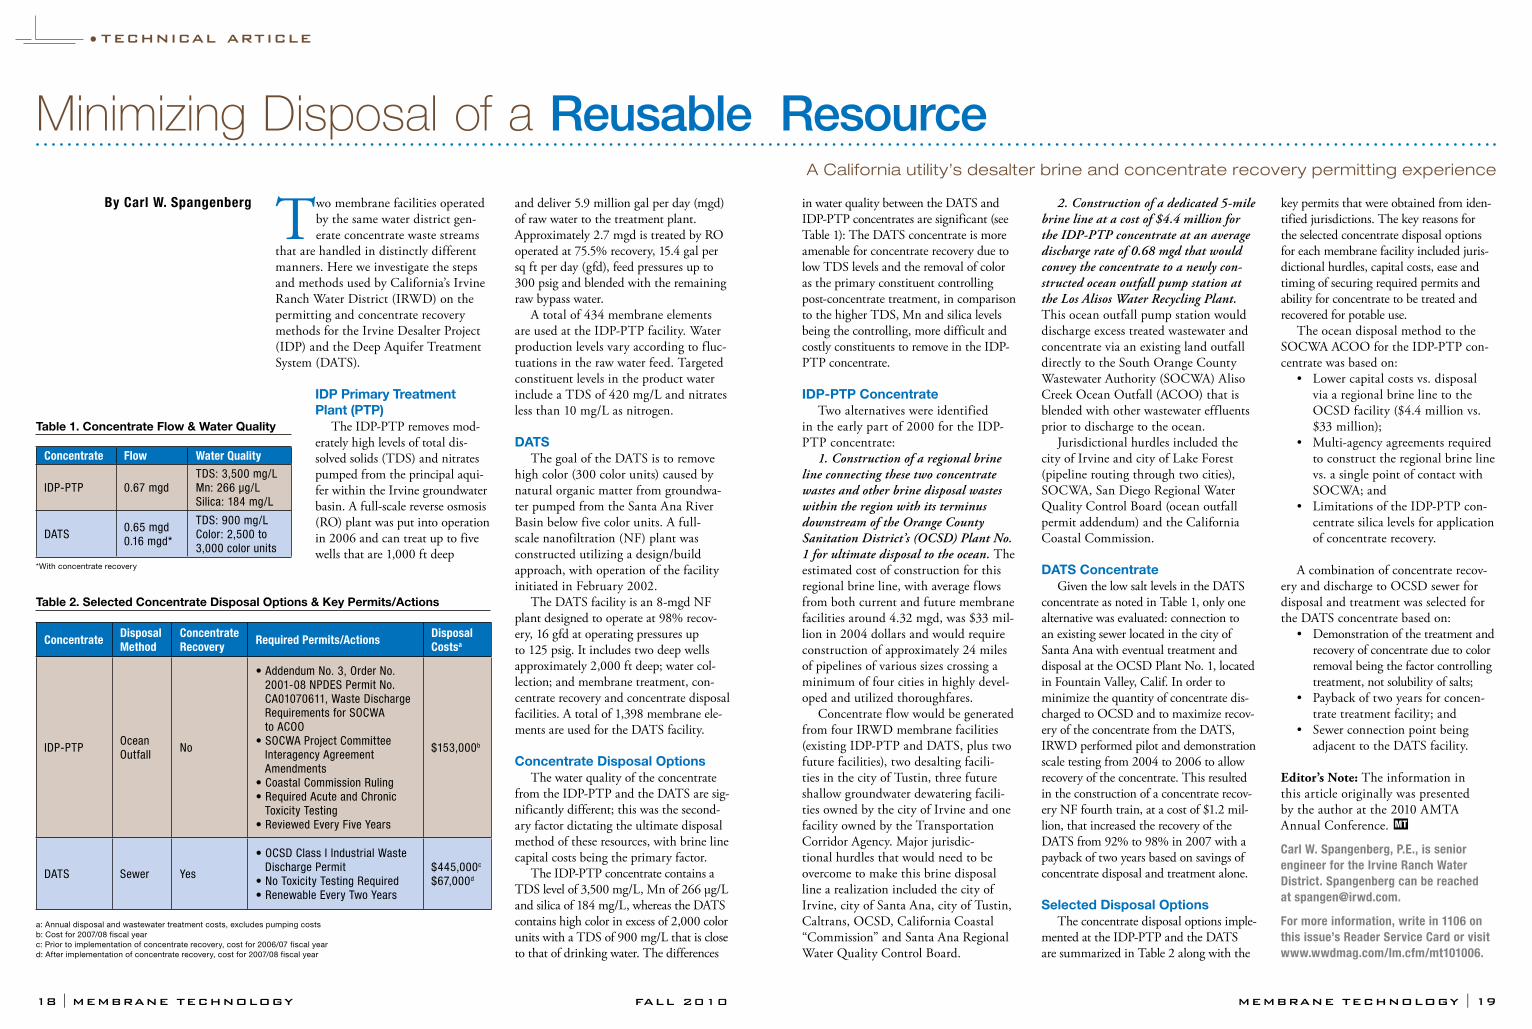
from the IDP-PTP and the DATS are sig-nificantly different; this was the second-ary factor dictating the ultimate disposal method of these resources, with brine line capital costs being the primary factor.
The IDP-PTP concentrate contains a TDS level of 3,500 mg/L, Mn of 266 μg/L and silica of 184 mg/L, whereas the DATS contains high color in excess of 2,000 color units with a TDS of 900 mg/L that is close to that of drinking water. The differences
in water quality between the DATS and IDP-PTP concentrates are significant (see Table 1): The DATS concentrate is more amenable for concentrate recovery due to low TDS levels and the removal of color as the primary constituent controlling post-concentrate treatment, in comparison to the higher TDS, Mn and silica levels being the controlling, more difficult and costly constituents to remove in the IDP-PTP concentrate.
IDP-PTP Concentrate Two alternatives were identified
in the early part of 2000 for the IDP-PTP concentrate:
1. Construction of a regional brine line connecting these two concentrate wastes and other brine disposal wastes within the region with its terminus downstream of the Orange County Sanitation District’s (OCSD) Plant No. 1 for ultimate disposal to the ocean. The estimated cost of construction for this regional brine line, with average flows from both current and future membrane facilities around 4.32 mgd, was $33 mil-lion in 2004 dollars and would require construction of approximately 24 miles of pipelines of various sizes crossing a minimum of four cities in highly devel-oped and utilized thoroughfares.
Concentrate flow would be generated from four IRWD membrane facilities (existing IDP-PTP and DATS, plus two future facilities), two desalting facili-ties in the city of Tustin, three future shallow groundwater dewatering facili-ties owned by the city of Irvine and one facility owned by the Transportation Corridor Agency. Major jurisdic-tional hurdles that would need to be overcome to make this brine disposal line a realization included the city of Irvine, city of Santa Ana, city of Tustin, Caltrans, OCSD, California Coastal “Commission” and Santa Ana Regional Water Quality Control Board.
2. Construction of a dedicated 5-mile brine line at a cost of $4.4 million for the IDP-PTP concentrate at an average discharge rate of 0.68 mgd that would convey the concentrate to a newly con-structed ocean outfall pump station at the Los Alisos Water Recycling Plant. This ocean outfall pump station would discharge excess treated wastewater and concentrate via an existing land outfall directly to the South Orange County Wastewater Authority (SOCWA) Aliso Creek Ocean Outfall (ACOO) that is blended with other wastewater effluents prior to discharge to the ocean.
Jurisdictional hurdles included the city of Irvine and city of Lake Forest (pipeline routing through two cities), SOCWA, San Diego Regional Water Quality Control Board (ocean outfall permit addendum) and the California Coastal Commission.
DATS Concentrate Given the low salt levels in the DATS
concentrate as noted in Table 1, only one alternative was evaluated: connection to an existing sewer located in the city of Santa Ana with eventual treatment and disposal at the OCSD Plant No. 1, located in Fountain Valley, Calif. In order to minimize the quantity of concentrate dis-charged to OCSD and to maximize recov-ery of the concentrate from the DATS, IRWD performed pilot and demonstration scale testing from 2004 to 2006 to allow recovery of the concentrate. This resulted in the construction of a concentrate recov-ery NF fourth train, at a cost of $1.2 mil-lion, that increased the recovery of the DATS from 92% to 98% in 2007 with a payback of two years based on savings of concentrate disposal and treatment alone.
Selected Disposal Options The concentrate disposal options imple-
mented at the IDP-PTP and the DATS are summarized in Table 2 along with the
key permits that were obtained from iden-tified jurisdictions. The key reasons for the selected concentrate disposal options for each membrane facility included juris-dictional hurdles, capital costs, ease and timing of securing required permits and ability for concentrate to be treated and recovered for potable use.
The ocean disposal method to the SOCWA ACOO for the IDP-PTP con-centrate was based on:
• Lowercapitalcostsvs.disposal via a regional brine line to the OCSD facility ($4.4 million vs. $33 million);
• Multi-agencyagreementsrequiredto construct the regional brine line vs. a single point of contact with SOCWA; and
• LimitationsoftheIDP-PTPcon-centrate silica levels for application of concentrate recovery.
A combination of concentrate recov-ery and discharge to OCSD sewer for disposal and treatment was selected for the DATS concentrate based on:
• Demonstrationofthetreatmentandrecovery of concentrate due to color removal being the factor controlling treatment, not solubility of salts;
• Paybackoftwoyearsforconcen-trate treatment facility; and
• Sewerconnectionpointbeingadjacent to the DATS facility.
Editor’s Note: The information in this article originally was presented by the author at the 2010 AMTA Annual Conference. MT
Carl W. Spangenberg, P.E., is senior engineer for the Irvine Ranch Water District. Spangenberg can be reached at [email protected].
For more information, write in 1106 on this issue’s Reader Service Card or visit www.wwdmag.com/lm.cfm/mt101006.
Concentrate Flow Water Quality
IDP-PTP 0.67 mgdTDS: 3,500 mg/LMn: 266 μg/LSilica: 184 mg/L
DATS0.65 mgd0.16 mgd*
TDS: 900 mg/LColor: 2,500 to3,000 color units
Table 1. Concentrate Flow & Water Quality
*With concentrate recovery
Concentrate DisposalMethod
ConcentrateRecovery Required Permits/Actions Disposal
Costsa
IDP-PTPOceanOutfall
No
• Addendum No. 3, Order No. 2001-08 NPDES Permit No. CA01070611, Waste Discharge Requirements for SOCWA to ACOO
• SOCWA Project Committee Interagency Agreement Amendments
• Coastal Commission Ruling • Required Acute and Chronic
Toxicity Testing • Reviewed Every Five Years
$153,000b
DATS Sewer Yes
• OCSD Class I Industrial Waste Discharge Permit
• No Toxicity Testing Required• Renewable Every Two Years
$445,000c
$67,000d
Table 2. Selected Concentrate Disposal Options & Key Permits/Actions
a: Annual disposal and wastewater treatment costs, excludes pumping costsb: Cost for 2007/08 fiscal yearc: Prior to implementation of concentrate recovery, cost for 2006/07 fiscal yeard: After implementation of concentrate recovery, cost for 2007/08 fiscal year
Minimizing Disposal of a Reusable Resource