Embed Size (px)
Citation preview

1Population Interventions Unit, MSPGH / 2022 will be better: COVID-19 Pandemic Tradeoffs modelling
Melbourne School of Populationand Global Health
Population Interventions Unit
2022 will be better: COVID-19 Pandemic Tradeoffs modelling
September, 2021
Policy Report

Population Interventions Unit, MSPGH / 2022 will be better: COVID-19 Pandemic Tradeoffs modelling
Acknowledgements
This report was lead by Tony Blakely, Tim Wilson, Hassan Andrabi, and Jason Thompson, on behalf of the COVID-19 Pandemic Tradeoffs team.
We acknolwedge all that have contributed their knowledge and expertise to COVID-19 Pandemic Tradeoffs modelling in 2020 and 2021, including Patrick Abraham, Driss Ait Ouakrim, Edifofon Akpan, Laxman Bablani, Marie-Anne Boujaoude, Natalie Carvalho, Nathan Grills, Samantha Grimshaw, Ameera Katar, Rod McClure, Abdurrehman Nadeem, Shiva Raj Mishra, Mark Stevenson, Vijaya Sundararajan, and Alexander van Heusden.
We acknowledge funding from an anonymous philanthropist for the COVID-19 Pandemic Tradeoffs modelling and data visualization.
We acknowledge the many comments and suggestions we received on drafts of this report from members of the Australia COVID-19 Modelling Initiative (www.auscmi.org): Mikhail Prokopenko, Centre for Complex Systems & Sydney Institute for Infectious Diseases, University of Sydney; Raina MacIntyre, Biosecurity Program, Kirby Institute, University of New South Wales; Margaret Hellard, Burnet Institute; Tom Kompas (University of Melbourne) and Quentin Grafton (Australia National University), COVID Policy Modelling Group (as convened at ANU).
We acknowledge comments and suggestions from NZ experts at Otago University: Nick Wilson, Michael Baker and Amanda Kvalsvig.
We also acknowledge and appreciate comments from other Australian experts who requested to remain anonymous.
Cover image: Centers for Disease Control and Prevention (CDC) Public Health Image Library (PHIL), phil.cdc.gov.
This report may be cited as: Blakely, T., Wilson, T., Andrabi, H., Thompson, T. (2021). 2021 will be better: COVID-19 Pandemic Tradeoffs Modelling. Population Interventions Unit, Melbourne School of Population and Global Health.
Corresponding author: Tony Blakely, [email protected]
Modelling Summary2022 will be better than 2021.
For us to ‘live with the virus’ will take more effort that what many of us assume, but by effectively using the tools we have now and innovating, we can achieve a well-functioning society in 2022.
A commonly held view is that we can ‘open up’ at 80% vaccination coverage of adults, in a scenario we call the Default Scenario. In our modelling this is a loose suppression policy designed to limit hospitalisations to a level that our health care system can handle. We expect travel to increase to the point that, on average, after screening, one vaccinated but infected person unwittingly crossing our borders undetected per day. The health loss of this scenario is arguably tolerable, at about 4000 hospitalisations over the year (range 2300 to 7300) in a state the size of Victoria. But – in our COVID-19 Pandemic Tradeoffs modelling at least – this default scenario requires us to spend more than half the year in lockdown.We have to do better than this.
In an Upgraded Scenario that extends 80% vaccination coverage to include children (5+ year olds), and keeps moderate public health and social restrictions in place even when case numbers are low (e.g. some density limits in hospitality), we will be ‘okay’.
‘Okay’ under this Upgraded Scenario actually looks pretty good in health loss terms with a range of between 130 to 1800 hospitalisations from COVID-19 over the year, and 36 to 490 deaths. Not to belittle preventable deaths from infectious disease, these base scenario estimates of mortality are about 5% to 50% of the deaths per year from influenza and pneumonia in Victoria.
But the flipside of this contained health loss is the social cost to keep the pandemic under control. Even for the Upgraded Scenario we might expect 14% of time is expected in some form of lockdown, with a wide uncertainty range of 0% to 50% of the year in lockdown.
These scenarios only show us we can achieve in 2022 without stretching ourselves too much. In fact, we can do better:
1. Increase vaccine coverage to 90%: Achieving 90% vaccination coverage of both children and adults will slash the hospitalisation and death rates by about 80%, and we will most likely have no time in lockdown at all (so long as we keep moderate public health and social measures in place at all times).
2. Reducing overseas/interstate infected incursions: Reducing the expected number of vaccinated but infected arrivals that get into our community undetected from 1 per day to 1 every five days (equivalent to the current risk from 200 vaccinated quarantine-free arrivals per day from the UK in a State the size of Victoria) achieves the same reductions in health loss and time in lockdown as 90% vaccination.
These two improvements are for interventions we understand reasonably well. We also need to innovate to reduce our reliance on lockdowns as the main tool to augment high vaccine coverage. Our modelling suggests that improved air filtration and ventilation of buildings (e.g. school rooms and office buildings), higher rates of mask use even when we are not in lockdown, a third dose of an mRNA vaccine to all those double-dosed with AstraZeneca, deployment of mass rapid antigen testing when we need to dampen transmission without resorting to lockdowns, and technological enhancements to contact tracing (e.g. Bluetooth enable apps that both work and satisfy privacy concerns) can all have important impacts – reducing health loss, and reducing the need for lockdowns even more.
It is critical to note that it is not the vaccination coverage alone that determines what opening up and 2022 will be like. Rather, it is the full package of measures – of which vaccination coverage is just one. Public and policy discourse should reflect this reality.
To achieve a better way of living in 2022, we also need to watch out for a few things.

There is convincing evidence emerging of substantial waning vaccine immunity for both AstraZeneca and Pfizer to the Delta virus. We first need to complete the job of vaccinating the global population. This is important for equity, and also because it reduces the chance of a dangerous new variant emerging. But when we can, we will need to roll out third or booster vaccines to everyone. Especially and first to recipients of AstraZeneca.
Assuming and hoping a more infectious, lethal and vaccine resistant variant of the virus does not emerge, we should be optimistic that 2022 will be substantially better than both 2020 and 2021. We have choices as to what mix of measures we use to chart our way to and through next year, including known interventions (vaccines, border controls, suppression policies within country) and innovations we can see coming (ventilation, mass rapid testing).
This report covers 432 possible scenarios, each modelled 100 times in an agent-based model to capture as many futures as possible. All results are publicly available at an interactive webtool, COVID-19 Pandemic Tradeoffs (www.pandemictradeoffs.com).
Our modelling finds that predictions are sensitive to two important and poorly understood input parameters. First, the proportion of Delta infections that are asymptomatic. If in our modelling we use the estimates used in the Doherty-led report, the situation deteriorates. Second, there is genuine uncertainty about the effectiveness of current vaccines at reducing onwards transmission if a vaccinated person is unlucky enough to become infected. In our model we assume this reduction is 25% on average. If we replace this with the 65% reduction assumed in the Doherty-led modelling, the situation improves dramatically. However, we fear that the 65% reduction assumed in the Doherty-led report – based on evidence accruing since their modelling – is too optimistic.
Pulling back, we all need to be cautious about the sensitivity of modelling predictions to inputs we do not yet fully understand. We need to use modelling to plan our opening up, then nimbly alter how we open up as actual data arrives in real-time.
Our modelling supports a key finding in the Doherty-led Report that keeping ‘light restrictions’ as a minimum at all times dramatically reduces the need for lockdowns. We concur that, unfortunately, allowing society to go back to near normal settings when case numbers are low often allows transmission to gain hold, and requiring longer lockdowns to bring surges back under control. As 2022 progresses, and we move into 2023, we can probably ease these minimal restrictions as immunity from natural infection creeps up and we revaccinate the whole population with better vaccines that (hopefully) reduce transmission risk more than current versions.
Our modelling also extends on the Doherty-led modelling in important and policy-relevant ways. For example, we do not start from a baseline of 30 infected cases, but account for ongoing community transmission as Australia is experiencing now, and how case numbers respond dynamically to restrictions and other measures. The time-window of our work also extends beyond 6 months to the end of 2022, including the first year after opening up. That is our modelling attempts to represent the patterns of infection growth and decline we are likely to experience from now through 2022.
Melbourne School of Populationand Global Health
Population Interventions Unit
September, 2021

ContentsKey findings
Introduction
ResultsDefault Scenario: 80% vaccination of adults only
Upgraded Scenario: 80% vaccination of adults and children vaccinated, and minimum Stage 2 public health and social measures (PHSM)
Alternative scenarios, around the Upgraded Scenario
Vaccination coverage
Vaccinated but infected arrivals per day
Reproductive rate (R0)
Suppression policy
Health and lockdown outcomes heatmap
Policy-relevant sensitivity analyses: can we make life even better than the Upgraded Scenario?
Boosting tracking, tracing, isolation and quarantine (TTIQ)
More widespread mass masking
One-third reduction of transmission in gathering sites (proxy for improved ventilation)
Pfizer used for whole vaccine rollout
Reducing incursion from quarantine breachest
Making hard lockdown not quite so hard
Modelling and method-related sensitivity analyses
The proportion of asymptomatics
How quickly infected people (‘infecteds’) become infectious
Scaling
Vaccine effectiveness at reducing onward transmission among vaccinated infecteds
Contact tracing
Ratio of hospitalisations, ICU admissions and deaths to infections
1
3
6
6
6
8
8
9
99
11
12
12
12
12
12
12
14
14
14
15
15
15
15
17

Contents
DiscussionHow does this modelling compare to what we are seeing overseas?
United Kingdom
Denmark
Singapore
What does this modelling mean for the National Plan?
Transition to Phase B at 70% double dose vaccination
Transition to Phase C at 80% double dose vaccination
Strengths, limitations and priority improvements in modelling COVID-19
ConclusionReferences
Appendix A – Supplementary tables
Appendix B – Methods
Scenario specification
Vaccine roll out
Vaccinated but infected cross-border arrivals
Dynamic PHSM Stage restrictions
Reproductive rate, R0
General model structure
Input parameters
Vaccine Effectiveness Against Mortality and Hospitalisation
Hospitalisation, ICU and mortality rates
20
20
21
21
22
22
23
23
25
26
28
42
42
42
42
42
43
43
43
44
45
20

1Population Interventions Unit, MSPGH / 2022 will be better: COVID-19 Pandemic Tradeoffs modelling
Key Finding 1
In a Deafult Scenario of 80% vaccine coverage of adults, a loose suppression policy setting within country, and a moderate level of quarantine-free vaccinated but infected arrivals, we expect in a state the size of Victoria: 320 infections per day; 4000 hospitalisations, 860 ICU admissions and 1000 deaths over the year; and over half the time in lockdown.
Key Finding 2
For an Upgraded Scenario of 80% vaccine coverage of adults and children, and a minimum of Stage 2 public health and social measures, we expect in a state the size of Victoria: 64 infections per day; 960 hospitalisations, 200 ICU admissions and 250 deaths over the year; and 14 % of time in lockdown (90% uncertainty range 0% to 46%).
Key Finding 3
90% vaccine coverage of both adults and children will reduce health loss and lead to only mod-est time in lockdown – if also accompanied by a minimum Stage 2 setting of public health and social measures and a moderate-only opening of international borders to quarantine-free travel.
Key Finding 4
Compared to our Upgraded Scenario, swapping from loose suppression to tight suppression would reduce the health loss by 75% but would also nearly double the time in lockdown.
Key Finding 5
Compared to our Upgraded Scenario, swapping from loose suppression to barely suppression would triple health loss but only negligibly reduce time in lockdown.
Key Finding 6
Barely suppression will also not achieve herd immunity in one year through natural infection on top of vaccination.
Key Finding 7
Policy relevant sensitivity analyses to approximate higher mask wearing, reduced transmission at gathering sites (e.g. improved ventilation), and scalable adjuncts to TTIQ (testing, tracing, isolating, quarantining) such as mass rapid antigen testing and technological enhancements to tracking, all had notable reductions in daily infections and time in lockdown for loose suppres-sion at 80% and 90% vaccine coverage.
Key findings

2Population Interventions Unit, MSPGH / 2022 will be better: COVID-19 Pandemic Tradeoffs modelling
Key Finding 8
If people vaccinated with AstraZeneca have their protection boosted to the level of receive Pfizer (or another mRNA vaccine), sizeable reductions in daily infections and time in lockdown could be achieved in addition to reduction in the infection fatality ratio.
Key Finding 9
The model outputs are sensitive to varying the assumed proportion of asymptomatic infections by age. Models will need to be updated if better data on the distribution of asymptomatics by age for Delta accrues.
Key Finding 10
The model outputs are very sensitive to varying the effectiveness of vaccines at reducing onward transmission between values we used and that used in the Doherty-led modelling. Models will need to be updated when better data knowledge on this important parameter accrues.
Key Finding 11
The model outputs are moderately sensitive to how effective contact tracing is, but we suspect uncertainty in contact tracing probably does not alter the general patterns of findings in this Report.

3Population Interventions Unit, MSPGH / 2022 will be better: COVID-19 Pandemic Tradeoffs modelling
Introduction
This report draws out the important findings from version 3 of COVID-19 Pandemic Tradeoffs modelling, complemented by the interactive web-tool available online at www.pandemictradeoffs.com. In this report, we focus on the year after we ‘open-up’, once the initial vaccine rollout is considered ‘finished enough’. By opening-up, we mean:
• a step-change to allowing a substantial increase in quarantine-free arrivals from international (and inter-state) origins, for travelers who are PCR tested and vaccinated,A yet still have a risk of unwittingly carrying SARS-CoV-2 infection, and
• a time when we try to live with the virus in a tolerable equilibrium.B
We employ an agent-based model to simulate virus transmission, and assess how it varies with factors we cannot control, such as the true reproductive rate (R0) of the virus, and factors we can at least partially control, such our public-health response.
Rather than answering a specific research question in this Report, our aim is more general and multifaceted:
To estimate how infection rates, hospital and ICU admissions, deaths, and time spent in lockdown vary separately, and jointly, with different settings of:
A There will still be travelers from high-risk countries that have to use formal 14-day quarantine in pur-pose-built facilities, and travelers from moderate-risk countries that may use home quarantine. In the modelling used in this Report, we allow for ongoing incursions from quarantine and add vaccinated but infected arrivals coming in through quarantine-free travel.
B Herd immunity, through natural infection topping up vaccination, is unlikely achievable in the first year after opening up.
Virus reproductive number (R0) Average number of people each infected person infects with no interventions, such as masks, physical distancing, case isolation, and vaccination. We consider three scenarios: R0 5, R0 6.5, and R0 8.
Vaccine coverage The percentage of the adult, or adult an children population that is vacci-nated. We consider four scenarios: 70%, 80%, 90% and 95% of the eligible population.
Vaccine eligibility Whether to vaccinate adults only (18+ year olds), or to vaccinate adults and children (5+ year olds). We consider both scenarios.
Acceptable range of restriction levels Whether the suppression policy can use a full range of five stages of public health and social measure restrictions (stages 1, 1b, 2, 3 (soft lockdown) and 4 (hard lockdown), or the suppression policy has Stage 2 as a minimum level of ‘light restric-tions’. We consider both scenarios.
COVID-19 suppression policy Supression Strategies employed to mitigate the spread of COVID-19. We consider three scenarios: tight suppression, loose suppresion, and barely suppre-sion.
Vaccinated but infected overases/interstate arrivals Average rate at which vaccinated but infected arrivals get into our community undetected. We consider three scenarios: 1 every 5 days, 1 per day, and 5 per day.

4Population Interventions Unit, MSPGH / 2022 will be better: COVID-19 Pandemic Tradeoffs modelling
To achieve our aim, we run each of the 432 combinations of the above parameters through our agent-based model. Each combination is run 100 times on the same set random seeds to capture the range of outputs that arise due to both stochastic variability and uncertainty in additional randomly drawn parameters, such as vaccine effectiveness.
This version 3 of COVID-19 Pandemic Tradeoffs has been substantially updated to reflect new data and knowledge about the Delta virus. Most notably, the infectiousness of the virus is increased compared to previous versions both by increasing the reproductive rate, R0, and by reducing the time from infection to when one can infect others from three days to one. We have also updated vaccine effectiveness estimates for Delta – for each of protecting against any infection, against serious infection and death, and against onward transmission if one is still infected despite being vaccinated.
While much public and policy discussion about COVID-19 in Australia assumes the goal is minimizing case numbers, after opening up our strategy will pivot to ‘living with the virus’. However, without context, this phrase means little. We interpret it to mean society ‘living with’ a tolerable level of morbidity and mortality associated with cases of COVID-19. That level of tolerance is subjective.
There are three general strategies that jurisdictions can employ to live with COVID once they ‘open up’.
1. Tight suppression: Here the policy goal is to keep case numbers very low, even from time-to-time re-eliminating the virus before it gets back in again. Its advantage are minimal SARS-CoV-2 morbidity and mortality, and it can act as a holding position while better vaccines and treatments are developed. Disadvantages include no progress towards herd immunity and potentially more time in lockdown, especially with easing travel restrictions.
2. Loose suppression: This option sits between tight and barely suppression (below). A moderate level of morbidity and mortality is accepted.
3. Barely suppression: Here the policy goal is to keep case numbers just beneath what the health system can tolerate. The disadvantage here is that SARS-CoV-2 morbidity and mortality is high, and there are likely knock-on effects to poorer health outcomes for other diseases and conditions due to stretched health services that are ‘just coping’. The advantage is that – in time, and supported by better vaccinations and other innovations – herd immunity may be achieved.
To implement one of these suppression policies, a sliding scale of stages of public health and social measures are used, that one eases and tightens based on case numbers. In this report, we employ five stages, 1, 1b, 2, 3 (soft lockdown) and 4 (hard lockdown), that reflect the system developed in Victoria in 2020. More detailed descriptions of these stages and the triggers used to ease and tighten restrictions are provided in Supplementary Table 1 and Supplementary Table 2.
In this report, we assume that Australia is most likely to take a loose suppression pathway, because it is probably more politically palatable than either tight or barely suppression. It also still acts as a holding position to await the development of improved treatments, vaccines and other measures that could allow a pivot to barely or even no suppression in the future as the final exit strategy out of the COVID-19 pandemic. For readers more interested in tight suppression or barely suppression, some results are still provided in this Report and full results are available to explore at www.pandemictradeoffs.com.

5Population Interventions Unit, MSPGH / 2022 will be better: COVID-19 Pandemic Tradeoffs modelling
The core structure of this Report is as follows:
• A results Section:
• We start with what has been commonly used as the Default Scenario at which we ‘open up’ (80% vaccination of adults, which we put with a moderate setting of 1 vaccinated but infected arrival per day and loose suppression). However, our modelling at least suggests this default scenario will see us living in lockdown over half the time in 2022; we have to do better.
• We then explore scenarios close to the Default, and walk our way to what we think is a plausible and realistic Upgraded Scenario that on top of the Default Scenario also sets a minimum of Stage 2 public health and social measures (even when daily cases are low) and includes vaccination of children (5 to 17 year olds). Morbidity and mortality are low, but 14% of time (90% uncertainty range 0% to 46%) is still estimated to be spent in lockdown.
• To this point, only four of the 432 scenarios we modelled have been considered. So, we introduce the reader to heatmaps of infections, hospitalisations, ICU admission, deaths and time in lockdown for many scenarios at 70%, 80% and 90% vaccination coverage. (also available at www.pandemictradeoffs.com). The heatmaps allow the reader to see patterns across variables that are influenced by public health policy.
• Whilst life under the Upgraded Scenario would be ‘okay’, we could do better. We conducted policy-relevant sensitivity analyses about this Upgraded Scenario, to cast light on what life might be like if we innovate beyond our current toolkit of public health and social measures to also include better ventilation and filtration in buildings, mass rapid antigen testing, better masking and one Pfizer vaccine dose for all AstraZeneca recipients.
• Modelling and method-related sensitivity analyses are also important. It is not easy to predict the future. We need to understand what inputs to our modelling – if they had been plausibly different – substantially change our predictions. We find that the model outputs are sensitive to assumptions regarding the proportion of infections that are asymptomatic, and the effectiveness of vaccines at preventing onward transmission among the vaccinated population who still get infected. Some of these assumptions differ from the Doherty-led modelling and which inputs are correct is hard to say – the point here is more one of transparency and raising a flag as to consequential inputs that modelers (and policy makers by extension) should pay close attention to.
• Finally, our modelling that outputs all of infections, case notifications, hospitalisations, ICU admissions and deaths can be used to generate some simple rules of thumb for Chief Health Officers, policy makers and the public about the level of health service use might result for a given number of average daily cases. As we pivot to ‘living with the virus’, we want to live within an envelope of daily notifications that our health system can tolerate.
• To assist the reader, we provide ‘key findings’ through the text of the Results that are also collated as a list in the preliminary section of this Report.
• Discussion Section, where we focus the discussion on drawing out what we think are the key findings for policy, explore the implications of our results for the National Plan, and make some recommendations for both policy and future research and modelling.
• Methods Appendix, where we provide the key input parameters and an overview of the agent-based model. More details on the model can be found in our peer reviewed publications,1, 2 and elsewhere.C
C ODD documentation for an earlier version of the ABM is at: https://github.com/JTHooker/COVIDModel/blob/master/ODD%20Protocol/ODD%20Protocol%20- %20Updated%20continuously.pdf (accessed 23 August 2020). Updated code is at a GitHub repository https://github.com/population-interventions/CovidABM/tree/vic_3/VIC_3_2021_08_18. Model details are also at www.panedmictradeoffs.com, and finally by emailing us directly (population- [email protected]).
6Population Interventions Unit, MSPGH / 2022 will be better: COVID-19 Pandemic Tradeoffs modelling
Results
Default Scenario: 80% vaccination of adults only
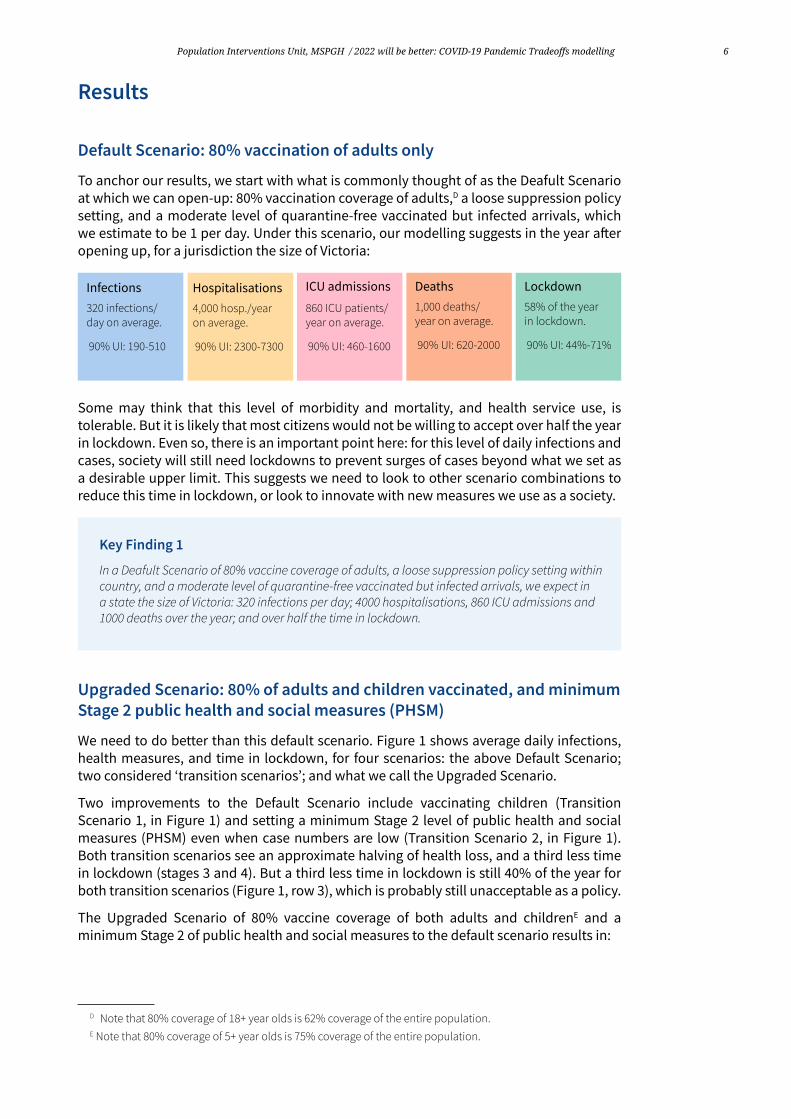
To anchor our results, we start with what is commonly thought of as the Deafult Scenario at which we can open-up: 80% vaccination coverage of adults,D a loose suppression policy setting, and a moderate level of quarantine-free vaccinated but infected arrivals, which we estimate to be 1 per day. Under this scenario, our modelling suggests in the year after opening up, for a jurisdiction the size of Victoria:
Infections320 infections/day on average.
90% UI: 190-510
Hospitalisations4,000 hosp./year on average.
90% UI: 2300-7300
ICU admissions
860 ICU patients/year on average.
90% UI: 460-1600
Deaths1,000 deaths/year on average.
90% UI: 620-2000
Lockdown58% of the year in lockdown.
90% UI: 44%-71%
Some may think that this level of morbidity and mortality, and health service use, is tolerable. But it is likely that most citizens would not be willing to accept over half the year in lockdown. Even so, there is an important point here: for this level of daily infections and cases, society will still need lockdowns to prevent surges of cases beyond what we set as a desirable upper limit. This suggests we need to look to other scenario combinations to reduce this time in lockdown, or look to innovate with new measures we use as a society.
Key Finding 1
In a Deafult Scenario of 80% vaccine coverage of adults, a loose suppression policy setting within country, and a moderate level of quarantine-free vaccinated but infected arrivals, we expect in a state the size of Victoria: 320 infections per day; 4000 hospitalisations, 860 ICU admissions and 1000 deaths over the year; and over half the time in lockdown.
Upgraded Scenario: 80% of adults and children vaccinated, and minimum Stage 2 public health and social measures (PHSM)
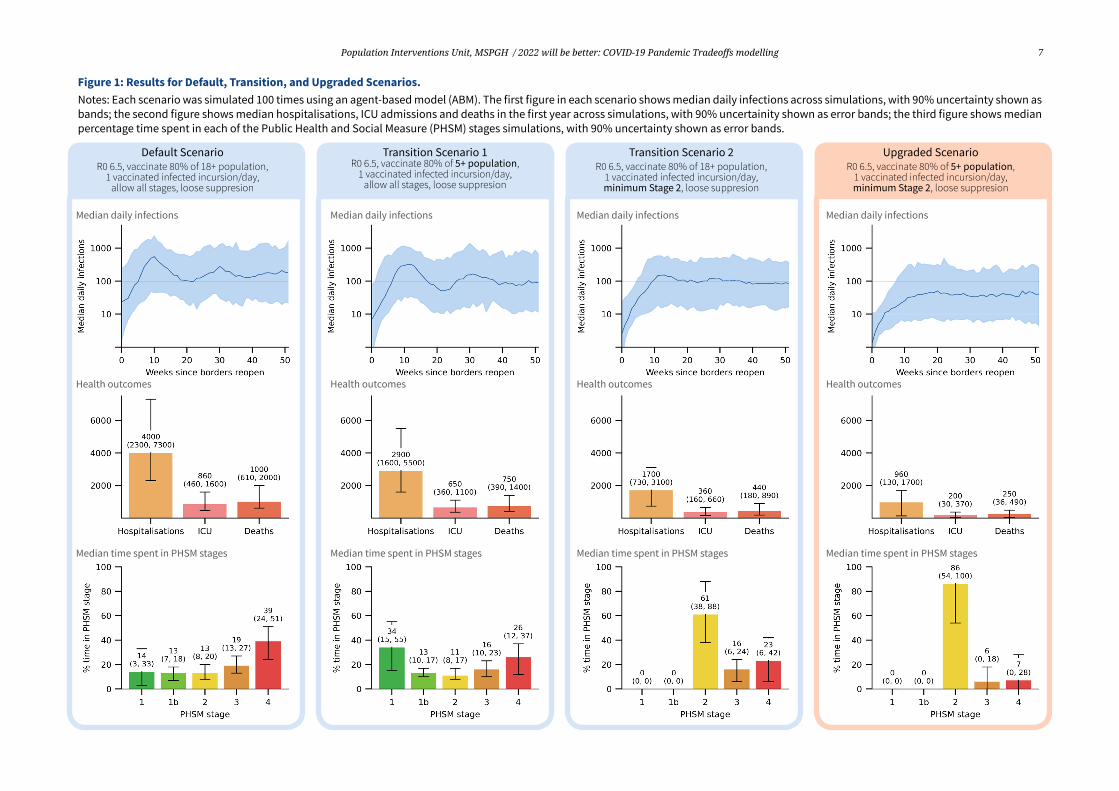
We need to do better than this default scenario. Figure 1 shows average daily infections, health measures, and time in lockdown, for four scenarios: the above Default Scenario; two considered ‘transition scenarios’; and what we call the Upgraded Scenario.
Two improvements to the Default Scenario include vaccinating children (Transition Scenario 1, in Figure 1) and setting a minimum Stage 2 level of public health and social measures (PHSM) even when case numbers are low (Transition Scenario 2, in Figure 1). Both transition scenarios see an approximate halving of health loss, and a third less time in lockdown (stages 3 and 4). But a third less time in lockdown is still 40% of the year for both transition scenarios (Figure 1, row 3), which is probably still unacceptable as a policy.
The Upgraded Scenario of 80% vaccine coverage of both adults and childrenE and a minimum Stage 2 of public health and social measures to the default scenario results in:
D Note that 80% coverage of 18+ year olds is 62% coverage of the entire population.E Note that 80% coverage of 5+ year olds is 75% coverage of the entire population.
Population Interventions Unit, MSPGH / 2022 will be better: COVID-19 Pandemic Tradeoffs modelling 7
Figure 1: Results for Default, Transition, and Upgraded Scenarios.Notes: Each scenario was simulated 100 times using an agent-based model (ABM). The first figure in each scenario shows median daily infections across simulations, with 90% uncertainty shown as bands; the second figure shows median hospitalisations, ICU admissions and deaths in the first year across simulations, with 90% uncertainity shown as error bands; the third figure shows median percentage time spent in each of the Public Health and Social Measure (PHSM) stages simulations, with 90% uncertainty shown as error bands.
Health outcomes
Median time spent in PHSM stages
Median daily infections Median daily infections Median daily infections Median daily infections
Health outcomes Health outcomes Health outcomes
Median time spent in PHSM stages Median time spent in PHSM stages Median time spent in PHSM stages
Default ScenarioR0 6.5, vaccinate 80% of 18+ population,
1 vaccinated infected incursion/day, allow all stages, loose suppresion
Transition Scenario 1R0 6.5, vaccinate 80% of 5+ population,
1 vaccinated infected incursion/day, allow all stages, loose suppresion
Transition Scenario 2R0 6.5, vaccinate 80% of 18+ population,
1 vaccinated infected incursion/day, minimum Stage 2, loose suppresion
Upgraded ScenarioR0 6.5, vaccinate 80% of 5+ population,
1 vaccinated infected incursion/day, minimum Stage 2, loose suppresion
8Population Interventions Unit, MSPGH / 2022 will be better: COVID-19 Pandemic Tradeoffs modelling
That is a notable reduction of time in lockdown, albeit it wide uncertainty, and about a quarter of the health loss of that in the Default Scenario (Figure 1).
Thus, we propose that this Upgraded Scenario is used as the main scenario for planning purposes, and we take it forward in this Report to ‘test’ with sensitivity analyses.
Key Finding 2
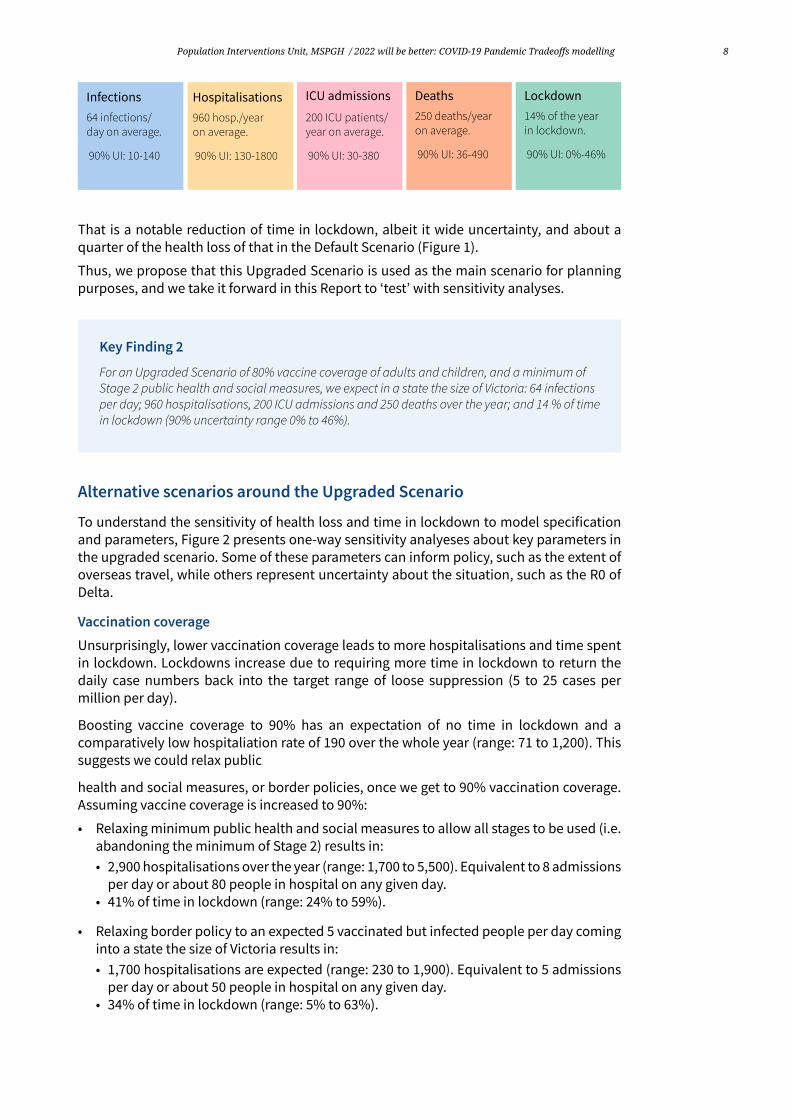
For an Upgraded Scenario of 80% vaccine coverage of adults and children, and a minimum of Stage 2 public health and social measures, we expect in a state the size of Victoria: 64 infections per day; 960 hospitalisations, 200 ICU admissions and 250 deaths over the year; and 14 % of time in lockdown (90% uncertainty range 0% to 46%).
Alternative scenarios around the Upgraded Scenario
To understand the sensitivity of health loss and time in lockdown to model specification and parameters, Figure 2 presents one-way sensitivity analyeses about key parameters in the upgraded scenario. Some of these parameters can inform policy, such as the extent of overseas travel, while others represent uncertainty about the situation, such as the R0 of Delta.
Vaccination coverageUnsurprisingly, lower vaccination coverage leads to more hospitalisations and time spent in lockdown. Lockdowns increase due to requiring more time in lockdown to return the daily case numbers back into the target range of loose suppression (5 to 25 cases per million per day).
Boosting vaccine coverage to 90% has an expectation of no time in lockdown and a comparatively low hospitaliation rate of 190 over the whole year (range: 71 to 1,200). This suggests we could relax public
health and social measures, or border policies, once we get to 90% vaccination coverage. Assuming vaccine coverage is increased to 90%:
• Relaxing minimum public health and social measures to allow all stages to be used (i.e. abandoning the minimum of Stage 2) results in:• 2,900 hospitalisations over the year (range: 1,700 to 5,500). Equivalent to 8 admissions
per day or about 80 people in hospital on any given day.• 41% of time in lockdown (range: 24% to 59%).
• Relaxing border policy to an expected 5 vaccinated but infected people per day coming into a state the size of Victoria results in:• 1,700 hospitalisations are expected (range: 230 to 1,900). Equivalent to 5 admissions
per day or about 50 people in hospital on any given day.• 34% of time in lockdown (range: 5% to 63%).
Infections64 infections/day on average.
90% UI: 10-140
Hospitalisations960 hosp./year on average.
90% UI: 130-1800
ICU admissions
200 ICU patients/year on average.
90% UI: 30-380
Deaths250 deaths/year on average.
90% UI: 36-490
Lockdown14% of the year in lockdown.
90% UI: 0%-46%

9Population Interventions Unit, MSPGH / 2022 will be better: COVID-19 Pandemic Tradeoffs modelling
Given the large increases in time in lockdown for both scenarios, without extra measures and innovations (see below) these relaxations are probably not acceptable.
Vaccinated but infected arrivals per dayThe base scenario has 1 vaccinated but infected quarantine-free arrival per day. Reducing this fivefold to 0.2 per day (or 1 arrival every five days), or increasing fivefold to 5 arrivals per day, has the same magnitude of effect on hospitalisations and time in lockdown as increasing or decreasing vaccine coverage by 10 percentage points (Figure 2).
Reproductive rate (R0)The model outputs are sensitive to changes in the virus R0. For this report, we assume Delta has a R0 of 6.5. However, if it were actually 8.0, or a new variant with R0 8.0 arises, then the health impacts and time in lockdown substantially increases. There is a need for better vaccines and innovative PHSMs to not only address the current Delta virus, but to guard against possible new variants.
Suppression policyThe base scenario has a loose suppression scenario. Settings of tight suppression (1-5 cases per million per day target range) and barely suppression (target of less than 500 cases per million per day) see expected large shifts in hospitalisations per day (Figure 2). But the shift of time in lockdown is not as profound; this is because even at high case numbers, one still needs to use lockdowns to curb infections as the tolerance level (e.g. to protect the health system) is approached. A key reason to opt for barely suppression would be if it resulted in herd immunity (evidenced by decreasing time in lockdown and infections over time); none of the 432 scenarios we modelled had any suggestion of herd immunity being reached at the end of one year.
Key Finding 3
90% vaccine coverage of both adults and children will reduce health loss and lead to only mod-est time in lockdown – if also accompanied by a minimum Stage 2 setting of public health and social measures and a moderate-only opening of international borders to quarantine-free travel.
Key Finding 4
Compared to our Upgraded Scenario, swapping from loose suppression to tight suppression would reduce the health loss by 75% but would also nearly double the time in lockdown.
Key Finding 5
Compared to our Upgraded Scenario, swapping from loose suppression to barely suppression would triple health loss but only negligibly reduce time in lockdown.
Key Finding 6
Barely suppression will also not achieve herd immunity in one year through natural infection on top of vaccination.

10Population Interventions Unit, MSPGH / 2022 will be better: COVID-19 Pandemic Tradeoffs modelling
Figure 2: Alternative scenario impacts compared to the Upgraded ScenarioNotes: Panels A and B present comparisons of hospitalsations and percentage time in lockdown between 100 simulations of the Upgraded scenario, and alternative scenarios of vaccine coverage; vaccinated infected arrivals per day; virus reproductive number (R0); and suppression strategy. The Upgraded Scenario refers to a combination of 80% vaccination of children and adults, 1 infected vaccinated arrival per day, Stage 2 minimum restrictions, a loose suppression strategy, and a virus reproductive number (R0) of 6.5. Labels show medians, with 90% uncertainty intervals shown in parenthesis.
Panel A: Hospitalisations per year
Panel B: Percentage time in lockdown (stages 3 and 4)

11Population Interventions Unit, MSPGH / 2022 will be better: COVID-19 Pandemic Tradeoffs modelling
Health and lockdown outcomes heatmap
Figure 3 uses heatmaps as an alternative way to convey the results. For a minimum Stage 2 setting and loose suppression, the expected values of daily infections, annual hospitalisations, ICU admissions and deaths, and the median percentage of time in lockdown are shown.
Tipping points and interactions are apparent – especially focusing on time in lockdown. For example, at 90% vaccination coverage of adults, reducing expected infected arrivals from 1 to 0.2 dramatically lowers the median time in lockdown from an estimated 28% of the time to just 2%. Additionally, vaccinating children – other factors held constant – always lessens the median percentage of time in lockdown, but more-so when vaccination coverage is higher. And at 90% vaccine coverage including children, the expected time in lockdown is 0% for both 0.2 and 1 expected vaccinated but infected arrival per day.
Heatmaps of infections, hospitalisations, ICU admissions, deaths and time in lockdown, for all 432 modelled scenarios with uncertainty ranges, are available to use interactively at www.pandemictradeoffs.com.
Figure 3: Heatmap of infections, hospitalisations, ICU admissions, and time in lockdownNotes: This figure shows the median number of infections, hospitalisations, ICU admissions, and deaths, for scenarios in the year after opening up, for R0 = 6.5, loose suppression and a minimum public health and social measure level of Stage 2, by: vaccine coverage, vaccination age threshold, and the expected vaccinated but infected arrivals to the state per day (Upgraded Scenario in bold). Full heatmaps for all outputs for all 432 scenarios, with uncertainty intervals, are at www.pandemictradeoffs.com.
Vaccine coverage 90% vaccinated 80% vaccinated 70% vaccinated
Infected Arrivals/day 0.2 1 5 0.2 1 5 0.2 1 5
Daily infections
Vaccinate 5+ 2 12 80 4.6 64 120 41 110 160
Vaccinate 18+ 26 92 140 93 130 180 140 170 210
Yearly hospitalisations
Vaccinate 5+ 30 190 1100 69 960 1700 600 1500 2100
Vaccinate 18+ 360 1300 1900 1200 1700 2400 1900 2200 2800
Yearly ICU admissions
Vaccinate 5+ 6.3 40 240 15 200 360 140 330 470
Vaccinate 18+ 76 250 390 260 360 500 500 420 500
Yearly deaths
Vaccinate 5+ 8.3 49 280 20 250 460 140 400 560
Vaccinate 18+ 100 300 450 290 440 640 490 560 660
% of time in Lockdown
Vaccinate 5+ 0 0 14 0 14 34 11 33 54
Vaccinate 18+ 2 28 49 30 39 61 44 51 70

12Population Interventions Unit, MSPGH / 2022 will be better: COVID-19 Pandemic Tradeoffs modelling
Policy-relevant sensitivity analyses: can we make life even better than the Upgraded Scenario?
Figure 4 shows sensitivity analyses about possible innovations that may improve our ability to control transmission, using the Upgraded Scenario as the comparator. (Supplementary Table 4 has these sensitivity analyses, and more for other comparator scenarios: 90% vaccine coverage, no minimum Stage 2 public health and social measures, not vaccinating children).
Boosting tracking, tracing, isolation and quarantine (TTIQ)To emulate a boost in TTIQ, through a mechanism such as mass rapid antigen testing or technological enhancements to tracking (e.g. Bluetooth enabled apps), we randomly isolated 15% of infected agents evenly over day 1 to 7 of their infection. The magnitude of gain in infections per day and time in lockdown was again notable, and similar to the mask and public gatherings sensitivity analyses (see Figure 4).
More widespread mass maskingThe stages in our model have mask wearing outside the home of 15%, 35%, 50%, 60% and 85% for stages 1, 1b to 4, respectively. One simple policy innovation is to more widely mandate widespread mask wearing – which we approximated as a 25-percentage point increase in mask wearing at all stages, up to a maximum of 100% (i.e. 45%, 65%, 80%, 90% and 100% in stages 1, 1b to 4, respectively). Average daily infections reduced notably by 75%, and the expected time in lockdown became zero, albeit with a 5% probability that 25% of time could still be spent in lockdown (see uncertainty interval in Figure 4).
One-third reduction of transmission in gathering sites (proxy for improved ventilation)The agent-based model has agents moving in a two-dimensional space, including to gathering sites with other agents present to emulate restaurants, family gatherings, schools, businesses and such like. As a proxy for what increased ventilation may do, we modelled a 33% reduction in transmission at these gathering sites, although arguably 33% is a too optimistic reduction given the heterogeneity of gathering sites. Nevertheless, as a proof of concept the reductions in daily average infections and time in lockdown were similar to that for increased masking.
Pfizer used for whole vaccine rolloutAstraZeneca has only slightly less effectiveness than Pfizer for protecting against serious illness and death, however it is notably less effective at stopping any transmission (60% compared to 80%). There is also accruing evidence that heterologous vaccination (e.g. one dose of an mRNA vaccine after two doses of AstraZeneca) may have good boosts in immunity. By vaccinating all agents with Pfizer instead of AstraZeneca, infections reduced by 75% and expected or median time in lockdown was zero (but again note the upside risk, or a still 5% or more probability of 27% of time in lockdown). On top of the reductions in infections, there were 5% to 20% reductions in infection fatality ratio as well – due to the moderately better protection of Pfizer against serious illness and death.
Reducing incursion from quarantine breachesOur modelling assumes a 4.5% probability per day of an incursion of an unvaccinated and infected person due to quarantine failure (based on that seen in Australia,3 and allowing for the expected proportion of infected people entering the community that lead to no onward transmission), reducing to 2.25% once we ‘open up’ (assumes lesser use of formal quarantine, and in better purpose-built facilities). At 80% and 90% vaccine coverage, further reducing quarantine breaches from a 2.25% probability per day of an infected person entering the community to 1.125% probability per day does not make a substantive difference to outcomes of interest (Figure 4).

13Population Interventions Unit, MSPGH / 2022 will be better: COVID-19 Pandemic Tradeoffs modelling
Figure 4: Alternative policy and innovation impacts compared to the Upgraded ScenarioNotes: Panels A and B present comparisons of daily infections and percentage time in lockdown between 100 simulations of the Upgraded scenario, and alternative policy and innovation sensitivity scenarios. The Upgraded Scenario refers to a combination of 80% vaccination of children and adults, 1 infected vaccinated arrival per day, Stage 2 minimum restrictions, a loose suppression strategy, and a virus reproductive number (R0) of 6.5. Labels show medians, with 90% uncertainty intervals shown in parenthesis.
Panel A: Daily infections
Panel B: Percentage time in lockdown (stages 3 and 4)

14Population Interventions Unit, MSPGH / 2022 will be better: COVID-19 Pandemic Tradeoffs modelling
Making hard lockdown not quite so hardGiven the fatigue many people are experiencing with lockdown, we ran a sensitivity analysis of the maximum level of PHSMs being a Stage 3b – halfway between Stage 3 and 4. Unsurprisingly, average daily infections and time in lockdown usually increased. Although, intriguingly, these increases were negligible when Stage 2 restrictions were set as a minimum, suggesting – perhaps – that setting a minimum level of PHSM could be accompanied with less severe lockdown.
Key Finding 7
Policy relevant sensitivity analyses to approximate higher mask wearing, reduced transmission at gathering sites (e.g. improved ventilation), and scalable adjuncts to TTIQ (testing, tracing, isolating, quarantining) such as mass rapid antigen testing and technological enhancements to tracking, all had notable reductions in daily infections and time in lockdown for loose suppres-sion at 80% and 90% vaccine coverage.
Key Finding 8
If people vaccinated with AstraZeneca have their protection boosted to the level of Pfizer (or another mRNA vaccine), sizeable reductions in daily infections and time in lockdown could be achieved in addition to reduction in the infection fatality ratio.
Modelling and method-related sensitivity analyses
The outputs of the COVID-19 Pandemic Tradeoffs model are sensitive to some model structure and input parameter assumptions (Figure 5). In our view, the two most important sensitivities are:• the proportion of asymptomatic infections, and• the reduction (if any) in transmissibility of onward infection for vaccinated infecteds
compared to unvaccinated infecteds.
The proportion of asymptomaticsThe number of daily infections and time in lockdown are both substantively increased if the proportion of asymptomatic infections is generally higher by age than we estimated, namely using those generated by Davies et al (2020)4 for the UK for pre-Delta variants (and as used by the Doherty Report5).Infections double, and time in lockdown increases nearly three-fold. The reason for this deterioration is that asymptomatics – even though 25% less infective in our model – do not self-present, causing ongoing undetected chains of transmission.F
All models will need to be updated if better data is available on the asymptomatic proportion of infections by age for Delta. The exact model outputs may change (e.g. the time in lockdown for each scenario may change). However, we are reasonably confident that the patterns (e.g. that vaccinating children usually offers substantial marginal gains) will not markedly change given the sensitivity of the model is roughly similar across a wider range of sensitivity analyses shown in Supplementary Table 5.
F To undertake this sensitivity analysis, we had to first recalibrate the model to an R0 of 6.5 – as changing the proportion of asymptomatics changes how the virus spreads in a world with no control measures. To do this, we adjusted the global transmissibility parameter in the model to achieve each infected on average infecting 6.5 others early in an unmitigated epidemic.
15Population Interventions Unit, MSPGH / 2022 will be better: COVID-19 Pandemic Tradeoffs modelling
If nothing else, this sensitivity analysis – about a parameter we may never have ‘perfect knowledge’ on since it would take a massive and well conducted study to estimate accurately the proportion of asymptomatic infections by age – highlights that modelling must be used as a guide to policy making, updated with ‘real time data’ on case numbers and extent of PHSMs required when we actually get to 80% of eligible populations double vaccinated.
How quickly infected people (‘infecteds’) become infectiousNot only is Delta more infectious overall compared to previous variants, but infected people can infect others earlier. In our model – and we believe consistent with evidence both internationally 6 and reported by Chief Health Officers in Australia for chains of transmission – infectivity on day 1 post infection is approximately 25% of peak infectivity, and peaks around day 4 to 5, with variation across agents. This is important to note because this makes contact tracing that prevents ongoing transmission more difficult. Therefore, to understand how sensitive the model is to this structure, we re-ran the model with no infecteds able to infect others until day 2 of their infection. Interestingly, the model outputs did not change much.
ScalingThe COVID-19 Pandemic Tradeoffs model uses 2500 agents for computation speed and efficiency. This requires scaling up and down agents as infection rates increase and decrease. The model keeps track of infected numbers correctly, but it is challenging for the contact tracing module to work across this scaling. In particular, infecteds need to be reallocated to households on scaling up and down.
We set our scaling parameters to generate plausible and coherent numbers of contacts and cases as the model scaled up and down; we are reasonably confident the scaling is specified satisfactorily. But as a sensitivity analysis, we altered the parameters to what we thought was an outer limit. The number of infections and time in lockdown reduced by about 20%. Therefore, whilst contact tracing in our model is challenging to parameterize, we are reasonably confident the model is not too sensitive to possible alternative specifications.
Vaccine effectiveness at reducing onward transmission among vaccinated infectedsOur model assumes wide uncertainty in the reduction of onward infection by vaccinated infecteds compared to unvaccinated infecteds, namely a 0% to 50% reduction range. This differs from Doherty-led modelling which assumes this parameter is 65%. For a sensitivity analysis using 65%, rather than our range with an average of about 25%, there is a large decrease of three-quarters in daily infections. The time in lockdown also reduced profoundly to a median of zero, with an upside risk or 5% probability of at least 16% of time in lockdown. This parameter about which there is genuine uncertainty is very important for modelling and for the real-world; all models will need updating as better knowledge on this parameter accrues.
Contact tracingNobody knows exactly how well contact tracing is performing at any point in time as we do not know the true denominator of each infected person’s true downstream contacts they infected, and we do not know exactly how rapidly its performance deteriorates as case numbers increase. In our base modelling, we assumed that 90% of an infected agent’s contacts (both upstream and downstream) were found in 3 days when daily case numbers were five or less. Most contacts were found on day 1, then decreased on days 2 and 3 to be 90% in total. This 90% detection fraction decreases with increasing daily cases in the State to asymptote at a maximum of 100 infected contacts found and isolated per day.
Sensitivity analyses that improved this performance (asymptote of a maximum of 200 infected cases found per day) and worsened it (asymptote of a maximum of 50 infected cases found per day) moderately changed the average number of daily infections and time in lockdown.

16Population Interventions Unit, MSPGH / 2022 will be better: COVID-19 Pandemic Tradeoffs modelling
Figure 5: Modelling and method-relative sensitivity analyses compared to the Upgraded ScenarioNotes: Panels A and B present comparisons of daily infections and percentage time in lockdown between 100 simulations of the Upgraded scenario, and alternative modelling and method-related sensitivity analyses. The Upgraded Scenario refers to a combination of 80% vaccination of children and adults, 1 infected vaccinated arrival per day, Stage 2 minimum restrictions, a loose suppression strategy, and a virus reproductive number (R0) of 6.5. Labels show medians, with 90% uncertainty intervals shown in parenthesis.
Panel A: Daily infections
Panel B: Percentage time in lockdown (stages 3 and 4)

17Population Interventions Unit, MSPGH / 2022 will be better: COVID-19 Pandemic Tradeoffs modelling
Key Finding 9
The model outputs are sensitive to varying the assumed proportion of asymptomatic infections by age. Models will need to be updated if better data on the distribution of asymptomatics by age for Delta accrues.
Key Finding 10
The model outputs are very sensitive to varying the effectiveness of vaccines at reducing onward transmission between values we used and that used in the Doherty-led modelling. Models will need to be updated when better data knowledge on this important parameter accrues.
Key Finding 11
The model outputs are moderately sensitive to how effective contact tracing is, but we suspect uncertainty in contact tracing probably does not alter the general patterns of findings in this Report.
Ratio of hospitalisations, ICU admissions and deaths to infections
An important ‘side product’ of our modelling is the ability to anticipate what might be the expected hospital bed occupancy for a given number of infections per day. A useful ‘rule of thumb’ to use as we pivot from focusing less on the case numbers per se, to focusing on what the case numbers mean for health services use.
In our modelling, about 80% of all infections are (eventually) notified as a case, through a mix of contact tracing and self-presentation. We use this 80% to convert infections per day to cases per day here.
Table 1 shows the model estimated daily hospitalisations, ICU admissions and deaths per 1000 case notifications (i.e. assuming 80% of infections notified), averaged over outputs from our ABM with an R0 of 6.5 and by level of vaccine coverage.
Table 1: Hospitalisations, ICU admissions, and deaths per 1,000 case notifcations, by vaccine coverageNotes: The estimates in this table are medians of outputs from our 1000s of runs of the ABM – differences by vaccine coverage are therefore subject to uncertainty. The hospital, ICU and death estimates are those estimated using UK data from Knock et al,7 generated pre-Delta. If the virulence of Delta is two-fold higher than pre-Delta variants (contested, but some evidence in the Scotland8 and Canada9), then all estimates need doubling. Conversely, new treatments may dramatically lower length of hospital and ICU stay, and death rates (e.g. Sotrovimab10). Our model focuses more on modelling community transmission; we do not have as sophisticated disease module for disease progression, but rather ‘just’ use the infection fatality ratios, hospitalisation, ICU and death rates by age from Knock et al.7
Vaccine Coverage 95% 90% 80% 70%
Hospitalisations
Vaccinate adults (18+ years) 44 45 45 45
Vaccinate adults + children (5+ years) 52 50 49 45
ICU admissions
Vaccinate adults (18+ years) 10.6 11.3 11.5 11.5
Vaccinate adults + children (5+ years) 13.6 12.8 13 12.4
Deaths
Vaccinate adults (18+ years) 9.1 9.4 9.6 9.9
Vaccinate adults + children (5+ years) 10.7 10.6 10.6 10.5

18Population Interventions Unit, MSPGH / 2022 will be better: COVID-19 Pandemic Tradeoffs modelling
Before turning to the ‘rules of thumb’ we learn from the hospitalisation, ICU admission, and death trends presented in Table 1, we need to explain why the results in Table 1 are not as the reader may have expected (skip this italicized text if you just want the ‘rules of thumb’).
If the same vaccine had been used for all age groups, we would expect to see the number of hospital and death events per 1000 infections reduce with increasing vaccination coverage – as a higher proportion of infections at higher vaccination coverage are vaccinated with less likelihood of severe disease (see Supplementary Table 3 for example at 80% vaccine coverageG). However, this expectation does not hold here because the vaccine roll for Australia (that we modelled) includes two vaccines administered to different age groups (Pfizer for 5 to 18 year olds, 25% AstraZeneca and 75% Pfizer for 18 to 59 year olds, and AstraZeneca for 60+ year olds), associated with:
• a gradient of coverage by age (e.g. for 70% vaccine coverage, 60+ year olds had 90% vaccine coverage and 18-59 year olds had 62.5% coverage – giving 70% overall for the 18+ population)
• varying vaccine effectiveness between AstraZeneca and Pfizer for both severe outcomes and transmission.
Also, the event numbers per infection or notification are higher for both adults and children vaccinated, as when children are vaccinated the proportion of infections shifts to older ages (although the absolute number of infections – other things held equal – will be less).
Returning to the ‘rules of thumb’, assuming an average length of hospital and ICU stay of about 10 days7 (noting this scalar varies by age and other factors), we estimate that for a daily average of 1000 notifications per day there might be:
• about 500 hospital beds occupied• 100 to 140 ICU beds occupied• 10 daily SARS-CoV-2 deaths (many elderly who die do not spend time in ICU).
These expectations are subject to structural and input parameter assumptions in our modelling (see notes to Table 1).
Key Finding 11
To assist planning, our modelling suggests that above 70% vaccine coverage 1000 notified cases per day corresponds to about: 500 hospital beds occupied on any day; 100 to 140 ICU beds occu-pied; and 10 deaths per day.
G For the contact tracing module and self-presentation rates used in our model, 80% of infecteds were detect-ed as cases.
19Population Interventions Unit, MSPGH / 2022 will be better: COVID-19 Pandemic Tradeoffs modelling
DiscussionIn 2022, once borders are open and public health and social measures (PHSMs) are in place as they currently are, this COVID-19 Pandemic Tradeoffs modelling clearly shows that the higher the vaccine coverage, the less time we will spend in lockdown. The reason we will still need PHSMs, including lockdowns, is that in the absence of further innovations (e.g. new vaccines, better ventilation and air filtration in buildings, mass testing), vaccine coverage alone will be insufficient to keep ‘a lid on’ transmission surges. We need both PHSMs and high vaccination coverage, and we also need innovations to reduce our reliance on lockdowns. With more tools in our toolkit, we will then also have choices about the mixes of measures we can use to achieve the same result.
In the future we expect immunity from natural infection to top-up vaccine-induced immunity, new variants aside and assuming no serious waning of immunity from natural infection over time. However, in our modelling we found no evidence of emerging herd immunity due to natural infection within the first year of opening up. Even under our ‘barely suppression’ strategy with children vaccinated and about 500 to 2000 infections a day (or 3% to 11% of the Victorian population naturally infected), we do not see evidence of reducing time in lockdown that would occur if natural infection was tipping the balance towards herd immunity. To achieve herd immunity within a year after ‘opening up’ would require very high vaccine coverage (including boosters) and intolerably high infection rates.
Accepting that herd immunity in the first year after opening-up is unlikely to be achieved, what measures can we then employ to ‘make life better’?
Maximise vaccine coverage of adults and include children
Our estimates show marked reductions for time spent in lockdown if 5- to 17-year-olds are additionally included in the vaccine rollout. This is because vaccinating children further dampens transmission potential across the population
However, we note and emphasize that our modelling did not allow for waning vaccine immunity over time. This waning is clearly occurring in Israel.11 Accordingly, our modelling is akin to a scenario where boosting occurs at a frequency that maintains vaccine effectiveness over time (e.g. the 80% for Pfizer, and 60% for AstraZeneca reduction in transmission). Further modelling including waning immunity and boosters is required. In the meantime, policy makers, experts and commentators need to convey the reality that waning vaccine immunity in 2022 is a challenge we will inevitably face.
Maintain a minimum level of public health and social measures at Stage 2
A second option to make life better is to maintain the minimum level of PHSMs at Stage 2 in the near- term. The exact makeup of this minimum level of PHSMs is up to us, but will presumably include a mix of those who can work at home doing so (most of the time), density limits in hospitality, exclusion of non-vaccinated people from gathering sites, high levels of masking, and such like. Asserting that maintaining minimum PHSMs is better for society, and the economy, is to assume that it is worse to live in near-normality some of the time but then yo-yo into longer and stricter lockdowns to tackle the more explosive growth in virus transmission that kicks off when we are living ‘near-normally’. A minimum level of PHSMs dramatically reduces the time in soft or hard lockdown. It dampens the oscillation or yo-yo effect of going back to near-normal circumstances that gives fuel to transmission, allowing explosive transmission that outpaces contact tracers and results in more frequent lockdowns. Our finding that a minimum floor of light or moderate public health and social measures greatly reduces the time in lockdown is consistent with the Doherty-led Report.5
20Population Interventions Unit, MSPGH / 2022 will be better: COVID-19 Pandemic Tradeoffs modelling
Encourage and mandate widespread mask wearing even when outside lockdown
In our baseline models, we assumed use of masks was 15%, 35%, 50%, 60% and 85% in Stages 1, 1b, 2, 3 and 4, respectively. In a scenario analyses where all these percentage points were lifted by 25 percentage points, time in lockdown reduced notably.
Improving ventilation and air filtration
Although we did not formally model improved ventilation of buildings where people gather (e.g. schools, CBD office blocks), when we simulated reducing transmissibility by 33% in gathering places we found sizeable reductions in the time needed in lockdown. This magnitude of effect is likely far more than could be achieved by improved ventilation and air filtration; an accurate assessment will require more research on how much air-turnover and filtering can realistically be improved in buildings, and the consequent realistic reductions in circulating virus. However, applying a precautionary principle to policy making, taking all reasonable and practicable steps now to improved ventilation in schools and other settings is recommended, if such settings are to be opened either fully or partially once vaccination targets are hit. Guidance is already available, e.g. for schools at the CDC website,H and forthcoming from OzSAGE.I
Mass rapid antigen testing, and improved TTIQ through technological innovation
Whilst again due to data limitations and time restrictions we could not formally model improved testing, tracing, isolation and quarantine measures (TTIQ), the marginal gains from measures that detect 15% of infecteds between days 1 to 7 of their infection were substantial. Such extra detection of cases could be achieved by at least two means: 1) widespread deployment of rapid antigen testing, and 2) better technologies (e.g. Bluetooth enabled apps that work and do not cause undue privacy concerns). Regarding mass rapid antigen testing, one option may be to use this in concert with improved ventilation to allow children to more safely return to school – without fueling transmission too much. The same targeting of rapid antigen testing could be used with workers currently allowed in workplaces and workers looking to return to workplaces as restrictions ease.
How does this modelling compare to what we are seeing overseas?
We have already mentioned in this Report that waning vaccine immunity in Israel is seeing a resurgence of cases, and the rolling out of booster vaccines. Here we review three other countries with high vaccine coverage as a point of comparison with our modelling results. Their experiences show that opening up can be bumpy, even at high vaccination coverage consistent with the findings in this Report.
United KingdomThe United Kingdom is at 66% of the total population double vaccinated, at the time of writing this Report. (Note that 80% coverage of 18+ year olds is 62% coverage of the entire population, so this 66% coverage in the UK is equivalent to about 85% of adults in Australia, or 80% of adults with moderate progress among children). Even at this level of vaccination coverage, they are experiencing about 30,000 notified cases per day (or about 60,000 infections per dayJ) in a population nearly three times the size of Australia.
Moreover, the percentage of the UK adult population that has any antibodies to SARS-CoV-2 is a stunning 90% to 95%.12 That is, over 90% of the UK adult population is estimated to have either been vaccinated or naturally infected with SARS-CoV-2.
H https://www.cdc.gov/coronavirus/2019-ncov/community/schools-childcare/ventilation.htmlI https://www.ozsage.org/ventilation-and-vaccine-plus/J See the Institute of Health Metrics and Evaluation (IHME) COVID Projections, https://covid19.healthdata.org/
united-kingdom?view=infections-testing&tab=trend&test=infections (accessed 19 Sept 2021).

21Population Interventions Unit, MSPGH / 2022 will be better: COVID-19 Pandemic Tradeoffs modelling
This is a salient reminder to Australia that – due to our success with an elimination strategy till now – we have to get vaccination rates even higher than the UK to be immunologically comparable, given our negligible rates of natural infection. Alternatively, the UK experience shows us we now have to traverse a ‘topping up’ of vaccination with natural infection.
The current level of public health and social measures in England are similar to the Stage 1 we modelled: 1 meter physical distancing rules, masks no longer required (although some shops and transport operators still require masks), anyone with COVID-19 symptoms must self-isolate (unless they have a negative PCR test), businesses are encouraged to use the National Health Service Covid Pass to check people are vaccinated, and people working from home are encouraged to return to the workplace gradually.K
Based on our modelling, without substantial innovations or very high vaccination, it would be late 2022 at the earliest before Australia would be in a similar situation to the UK with high enough immunity for very light (Stage 1) restrictions to be sufficient.
DenmarkDenmark currently has 74% of the total population vaccinated – higher than the UK, and equivalent to what Australia would be with nearly 80% vaccination of children aged 5+ and older.
Denmark was the first country in the EU to lift its COVID-19 restrictions. Its effective vaccination campaign, rolled out at the end of December 2020, saw 70% of its eligible population vaccinated by early August 2021 and the easing of PHSMs, including an increase in capacity limits at outdoor events and the partial phasing out of its “corona passport” at selected venues. Although Denmark was reporting a 7-day rolling average of 1000 new positive cases of COVID-19 each day,L it’s robust healthcare system and contact tracing efforts resulted in it being in the lower half of all European nations for confirmed COVID-19 deaths and hospitalisations.M Masks were no longer mandatory on public transport by mid-August, however the exit strategy was subject to local changes including targeted closures to reduce transmission. Nightclubs stayed closed and travel restrictions remained.
SingaporeSingapore now has more than 80% of its total population fully vaccinated – one of the highest rates in the world. By the start of August, with 70% of its total population fully vaccinated and a declining 7-day rolling average of less than 100 new positive cases of COVID-19 each day, PHSMs were eased including an increase in group size limits for gatherings (those not vaccinated were strongly advised to keep to previous limits), indoor dining settings were made available to patrons fully vaccinated or who were able to provide a negative test result in the last 24 hours. Border restrictions were also eased, allowing fully vaccinated work pass holders (and dependents) to enter the country, extending to vaccinated travelers from select countries (Australia, Canada, Germany and South Korea) later in the month. While mask wearing remained mandatory, it wasn’t long before the 7-day rolling average began to steeply increase, even when 80% of the total population was fully vaccinated by the end of August.N Reopening measures were delayed and some previous restrictions re-imposed as Singapore saw some of its highest daily COVID-19 infections in more than a year, believed to be the result of increased social movements among those vaccinated.
K https://www.bbc.com/news/explainers-52530518L Denmark’s population is 5.8 million.M Denmark: Coronavirus Pandemic Country Profile - Our World in DataN COVID-19 Data Explorer – Our World in Data (external link)

22Population Interventions Unit, MSPGH / 2022 will be better: COVID-19 Pandemic Tradeoffs modelling
What does this modelling mean for the National Plan?
Transition to Phase B at 70% double dose vaccination
The National Plan states: “Lockdowns less likely but possible”
We estimate that – without innovations – lockdowns will still be commonly required to protect the integrity of the health system at 70% vaccination of adults, and even at 70% vaccination of children aged 5 to 17. To minimize the need for lockdowns, innovations will need developing and rolling out:
• Widespread mask use indoors and in crowded outdoor environments, even when not in lockdown
• Use of rapid antigen testing in settings such as schools, workplaces, and other mass gathering sites. Further modelling is recommended.
• Improved ventilation of buildings that people gather in. Further research and modelling is recommended.
The National Plan states: “International border caps and low-level international arrivals, with safe and proportionate quarantine to minimise the risk of COVID entering; and Introduce new reduced quarantine arrangements for vaccinated residents”
Our modelling suggests that a major opening up of quarantine-free travel for international arrivals – unless from low-risk countries (e.g. China, countries with lower infection rates than that in Australia at the time) – is not wise at only 70% vaccination. Modelling could be used to explore options for reduced quarantine arrangements (e.g. home quarantine) in terms of the expected number of vaccinated but infected people that will leak into the community, and then linking this to the scenarios of 0.2, 1 and 5 undetected arrivals per day presented in this Report (and at www.pandemictradeoffs.com).
The National Plan states: “Ease restrictions on vaccinated residents”
Our modelling did not test reducing restrictions for just double vaccinated citizens. Theoretically, one would expect that transmission will not be propelled too much, as if only vaccinated people gather at sites there is a lowered risk of a vaccinated person bringing an infection to the site, and likewise a lower risk of other vaccinated people getting infected. Practically, the issue will be compliance. An agent- based model would be a good vehicle to explore the likely success of such strategies with levels of varying compliance.
The National Plan states: “Prepare/implement vaccine booster programme (depending on timing)”
Our modelling includes a simple sensitivity analysis whereby everyone had been administered Pfizer (i.e. no AstraZeneca). It made a notable impact, due to mRNA vaccines’ better effectiveness reducing transmission and severe disease. Such a sensitivity analysis could be used as a proxy for ‘boosting’ all AstraZeneca recipients with one mRNA vaccine dose. Much modelling will be needed on booster vaccine schedules and impacts, to accompany and follow emerging empirical evidence from trials. This will be challenging to model, and probably best done by several modelling groups in parallel.

23Population Interventions Unit, MSPGH / 2022 will be better: COVID-19 Pandemic Tradeoffs modelling
Transition to Phase C at 80% double dose vaccination
The National Plan states: “Minimum ongoing baseline restrictions, adjusted to minimise cases with-out lockdowns”
This report finds that a minimum level of PHSMs greatly reduces the time needed in lockdown. Removing this measure at 80% vaccination coverage led to an unacceptably high proportion of time spent in harsh lockdown. If society is reluctant to have Stage 2 as a minimum level of PHSM at 80% vaccination during 2022, we will require innovations that reduce our reliance on lockdowns, e.g. ventilation, mass rapid antigen testing, higher and better masking, better vaccines (including ‘simply’ administering one mRNA vaccine dose to all AstraZeneca recipients). That is, we will likely have choices – but for the time being it is best to plan that ongoing ‘light’ public health and social measures will be needed, such as density limits in hospitality and workers who can work from home doing so much of the time.
The National Plan states: “Highly targeted lockdowns only”
As above, lockdowns at 80% vaccination are still likely – unless we innovate with additional effective measures.
The National Plan states: “Gradual reopening of inward and outward international travel with safe countries and proportionate quarantine and reduced requirements for fully vaccinated inbound travellers.”
Our Report and our www.pandemictradeoffs.com website give 100s of scenarios for options of 0.2, 1 and 5 daily expected vaccinated but infected returning travelers who are undetected upon arrival. At 80% vaccination coverage, the infection rates within-country and time in lockdown are both increased in our modelling for increased infected arrivals. This is because a new infected arrival – even when there is in-country infection – can start off a new chain of transmission or a new outbreak. That is, contrary to what many may think on first glance, it may not be as safe as we suppose for infected travelers to return when we already have high infection rates.
Again, innovations should be considered to lower this risk (e.g. rapid antigen testing before boarding and on arrival, and various shortened quarantine arrangements).
Strengths, limitations and priority improvements in modelling COVID-19
The COVID-19 Pandemic Tradeoffs modelling has many strengths. First, early generations of this modelling were successfully used to underpin policy options relating to the RoadMap out of the Victorian second wave.13, 14 Second, previous iterations have been published in peer reviewed journals.1, 2 Third, the code and documentation is publicly available. Fourth, the agent-based model was purposely built to allow dynamic policies (e.g. (de)escalating public health and social measures) and the testing of a suite of policy options (e.g. masks, vaccines, etc). As such the COVID-19 Pandemic Tradeoffs modelling is sophisticated, and both complements and extends other modelling – such as the Doherty-led modelling,5 and that by other modelling groups in Australia (see the Australian COVID-19 Modelling Initiative for the outputs of many modelling groups; www.auscmi.org).
The COVID-19 Pandemic Tradeoffs modelling uses the state of Victoria as the modelled population. Given demographic similarity with the seven other states and territories of Australia, and New Zealand, we believe the model is generalisable to Australasia and can be easily conceptually and practically adapted. It may also be generalisable to other

24Population Interventions Unit, MSPGH / 2022 will be better: COVID-19 Pandemic Tradeoffs modelling
Western Pacific Region Countries (e.g. Taiwan, Vietnam, Singapore) that have pursued a zero or low COVID-19 strategy, and are now planning to ‘open up’.
All modelling exercises are challenging to conduct; we are, after all, attempting to both explain mechanisms and predict the future. One limitation of the COVID-19 Pandemic Tradeoffs agent-based model is its scaling. The model was deliberately built to just use 2500 agents, that then scale up to represent the population of interest, such as the 6.6 million people in Victoria. This allows more rapid modelling. But it comes at a cost. With only 2500 agents the amount of heterogeneity we can represent is limited. We represent heterogeneity by age, essential worker status, infectivity of the infected, household size, and mobility. However, we do not represent additional heterogeneity by spatially accurate neighbourhood or region, not do we represent vulnerable groups of interest (e.g., with specific underlying medical conditions) or Aboriginal and Torres Strait Islander – for example. However, agent-based architecture and expansion of both the represented agent population and computing power makes this possible. So, although it is important in modelling to not ‘overelaborate’, additional heterogeneity may improve model utility and validity by better capturing effects such as faster transmission in neighourhoods or social networks. It would also, if successfully completed, allow more focused policy recommendations for different social groups.
Integrated metrics of health loss, such as quality or health adjusted life years (HALYs) that include both COVID-19 morbidity (including long COVID) and the unitended health impacts of lockdowns, will be added to this modelling – and costs impacts, including GDP loss from lockdowns. We have already published such analyses for scenarios in 20201; we will soon be estimating the HALYs and costs for scenarios we can use in 2022, to assist optimal policy making.
For reasons such as the above, it is best practice for Governments and decision-makers to take a ‘many models’ approach to decision-making support. If all models give the same answer, the decision-maker has confidence in the action they are about to take. If the models disagree, the decision-maker would proceed cautiously, and instruct the modelers and key scientific advisors to understand why they disagree before final policy decision making is made. The UK uses such an approach, with leading modeler Ferguson telling Nature that the UK Government took advice from a number of modelling groups for this very reason.15 This is evidenced by the multiple contributors to official UK policy, through SAGE.O
A data improvement priority that this report discloses is vaccine effectiveness at reducing onward transmission, for the vaccinated unlucky enough to be infected. We modelled wide uncertainty about this, from zero to 50% (average 25% reduction). The Doherty-led report puts it at 65%.5 This different notably changed the outputted number of infections and time in lockdown. An important recent study in Israel16 found that in the first couple of months after vaccination with Pfizer, breakthrough infections (i.e. those among the vaccinated) had much less virus excretion than unvaccinated infections – suggesting the vaccines do reduce onward transmission. However, this effect of the vaccine disappears after several months – consistent with little impact of vaccination on onward transmission some months after vaccination. Finally, the virus excretion of breakthrough infections dropped again after a Pfizer booster. It is too early to be confident about what this all means, but it seems safe to conclude that booster vaccines (or simply better vaccines that better reduce transmission risk and do not wane) are going to be critical in 2022.
O https://www.gov.uk/government/publications/scientific-advisory-group-for-emergencies-sage- coronavi-rus-covid-19-response-membership/list-of-participants-of-sage-and-related-sub-groups, accessed 5 September 2021.
25Population Interventions Unit, MSPGH / 2022 will be better: COVID-19 Pandemic Tradeoffs modelling
ConclusionThe modelling in this Report suggests – at first glance – that life may not be so good in 2022, even at 80% vaccination coverage of both adults and children. However, our policy relevant sensitivity analyses point to many innovations that can ‘make life better’.
Modelling helps work out the packages of measures we use to make life as best as possible – there are likely pathways to and through 2022 that will make life ‘okay’.
26Population Interventions Unit, MSPGH / 2022 will be better: COVID-19 Pandemic Tradeoffs modelling
References
1 Blakely T, Thompson J, Bablani L, et al. Association of Simulated COVID-19 Policy Responses for Social Restrictions and Lockdowns With Health-Adjusted Life-Years and Costs in Victoria, Australia. JAMA Health Forum 2021; 2(7).
2 Blakely T, Thompson J, Carvalho N, Bablani L, Wilson N, Stevenson M. The probabil-ity of the 6- week lockdown in Victoria (commencing 9 July 2020) achieving elimination of community transmission of SARS-CoV-2. Med J Aust 2020; 213(8): 349-51 e1.
3 Grout L, Katar A, Ait Ouakrim D, et al. Failures of quarantine systems for preventing COVID-19 outbreaks in Australia and New Zealand. Med J Aust 2021.
4 Davies NG, Klepac P, Liu Y, et al. Age-dependent effects in the transmission and con-trol of COVID-19 epidemics. Nat Med 2020; 26(8): 1205-11.
5 Doherty Modelling. DOHERTY MODELLING REPORT REVISED 10TH AUGUST 2021, 2021.
6 Zhang M, Xiao J, Deng A, et al. Transmission Dynamics of an Outbreak of the COVID-19 Delta Variant B.1.617.2 — Guangdong Province, China, May–June 2021. China CDC Weekly 2021; 3(27): 584-6.
7 Knock ES, Whittles LK, Lees JA, et al. The 2020 SARS-CoV-2 epidemic in England: key epidemiological drivers and impact of interventions. medRxiv 2021: 2021.01.11.21249564.
8 Sheikh A, McMenamin J, Taylor B, Robertson C. SARS-CoV-2 Delta VOC in Scotland: demographics, risk of hospital admission, and vaccine effectiveness. The Lancet 2021; 397(10293): 2461- 2.
9 Fisman DN, Tuite AR. Progressive Increase in Virulence of Novel SARS-CoV-2 Variants in Ontario, Canada. medRxiv 2021.
10 Gupta A, Gonzalez-Rojas Y, Juarez E, et al. Early Covid-19 Treatment With SARS-CoV-2 Neutralizing Antibody Sotrovimab. medRxiv 2021: 2021.05.27.21257096.
11 Goldberg Y, Mandel M, Bar-On YM, et al. Waning immunity of the BNT162b2 vaccine: A nationwide study from Israel. medRxiv 2021: 2021.08.24.21262423.
12 Office for National Statistics. Coronavirus (COVID-19) Infection Survey, antibody and vaccination data, UK: 16 September 2021, 2021.
13 Thompson J, Stevenson M, Blakely T, McClure R. Emerging from lockdown: mod-elling, outputs and assumptions. Department of Human and Health Services, Victorian Government; 2020.
14 Victorian Government. Coronavirus (COVID-19) roadmap for reopening: Mapping Victoria’s path toward COVID Normal. 2020. https://www.coronavirus.vic.gov.au/coronavi-rus-covid-19-restrictions- roadmaps (accessed 7 Nov 2020 2020).
15 Adam D. Modelling the Pandemic. Nature 2020; 580: 316-8.
16 Levine-Tiefenbrun M, Yelin I, Alapi H, et al. Viral loads of Delta-variant SARS-CoV2 breakthrough infections following vaccination and booster with the BNT162b2 vaccine. medRxiv 2021: 2021.08.29.21262798.
17 Emary KRW, et al. Efficacy of ChAdOx1 nCoV-19 (AZD1222) Vaccine Against SARS-CoV-2 VOC 202012/01 (B.1.1.7). Lancet Preprint [not yet peer reviewed] 2021.
18 Pritchard E, Matthews PC, Stoesser N, et al. Impact of vaccination on new SARS-CoV-2 infections in the United Kingdom. Nat Med 2021.
19 Polack FP, Thomas SJ, Kitchin N, et al. Safety and Efficacy of the BNT162b2 mRNA Covid-19 Vaccine. N Engl J Med 2020; 383(27): 2603-15.
20 Haas EJ, Angulo FJ, McLaughlin JM, et al. Impact and effectiveness of mRNA

27Population Interventions Unit, MSPGH / 2022 will be better: COVID-19 Pandemic Tradeoffs modelling
BNT162b2 vaccine against SARS-CoV-2 infections and COVID-19 cases, hospitalisations, and deaths following a nationwide vaccination campaign in Israel: an observational study using national surveillance data. The Lancet 2021; 397(10287): 1819-29.21 Harris RJ, Hall JA, Zaidi A, Andrews NJ, Dunbar JK, Dabrera G. Effect of Vaccination on Household Transmission of SARS-CoV-2 in England. N Engl J Med 2021.
22 Bi Q, Wu Y, Mei S, et al. Epidemiology and transmission of COVID-19 in 391 cases and 1286 of their close contacts in Shenzhen, China: a retrospective cohort study. The Lancet Infectious Diseases 2020; 20: 911–19.
23 He X, Lau EHY, Wu P, et al. Temporal dynamics in viral shedding and transmissibility of COVID- 19. Nat Med 2020; 26(5): 672-5.
24 Vasileiou E, Simpson CR, Shi T, et al. Interim findings from first-dose mass COVID-19 vaccination roll-out and COVID-19 hospital admissions in Scotland: a national prospective cohort study. The Lancet 2021.
25 Dagan N, Barda N, Kepten E, et al. BNT162b2 mRNA Covid-19 Vaccine in a Nation-wide Mass Vaccination Setting. N Engl J Med 2021.
26 Burnet Institute. COVID-19 mathematical modelling of the Victoria roadmap 2021, 2021.
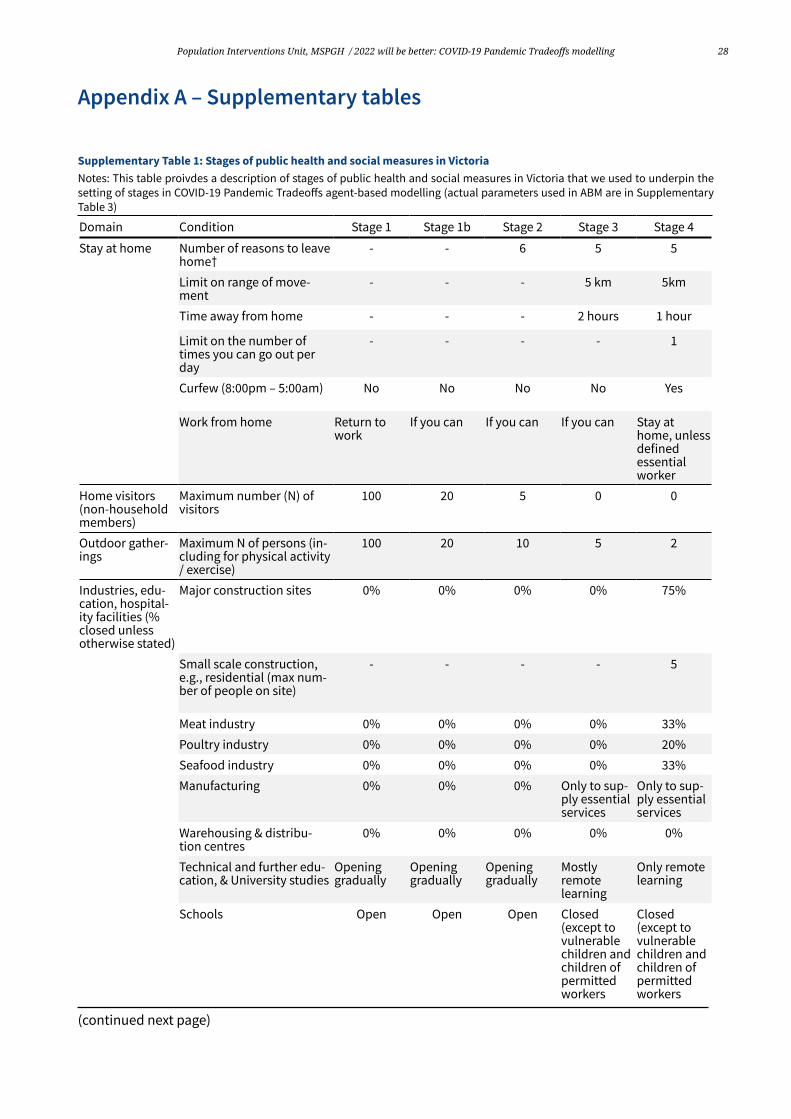
28Population Interventions Unit, MSPGH / 2022 will be better: COVID-19 Pandemic Tradeoffs modelling
Appendix A – Supplementary tables
Supplementary Table 1: Stages of public health and social measures in VictoriaNotes: This table proivdes a description of stages of public health and social measures in Victoria that we used to underpin the setting of stages in COVID-19 Pandemic Tradeoffs agent-based modelling (actual parameters used in ABM are in Supplementary Table 3)
Domain Condition Stage 1 Stage 1b Stage 2 Stage 3 Stage 4
Stay at home Number of reasons to leave home†
- - 6 5 5
Limit on range of move-ment
- - - 5 km 5km
Time away from home - - - 2 hours 1 hour
Limit on the number of times you can go out per day
- - - - 1
Curfew (8:00pm – 5:00am) No No No No Yes
Work from home Return to work
If you can If you can If you can Stay at home, unless defined essential worker
Home visitors (non-household members)
Maximum number (N) of visitors
100 20 5 0 0
Outdoor gather-ings
Maximum N of persons (in-cluding for physical activity / exercise)
100 20 10 5 2
Industries, edu-cation, hospital-ity facilities (% closed unless otherwise stated)
Major construction sites 0% 0% 0% 0% 75%
Small scale construction, e.g., residential (max num-ber of people on site)
- - - - 5
Meat industry 0% 0% 0% 0% 33% Poultry industry 0% 0% 0% 0% 20% Seafood industry 0% 0% 0% 0% 33% Manufacturing 0% 0% 0% Only to sup-
ply essential services
Only to sup-ply essential services
Warehousing & distribu-tion centres
0% 0% 0% 0% 0%
Technical and further edu-cation, & University studies
Opening gradually
Opening gradually
Opening gradually
Mostly remote learning
Only remote learning
Schools Open Open Open Closed (except to vulnerable children and children of permitted workers
Closed (except to vulnerable children and children of permitted workers
(continued next page)

29Population Interventions Unit, MSPGH / 2022 will be better: COVID-19 Pandemic Tradeoffs modelling
Childcare & pre-school care Open Open Open Open Closed (except to vulnerable children and children of permitted workers
Hardware stores 0% 0% 0% 0% Closed – exception to tradespeople
Department stores 0% 0% 0% 0% 100%
Hairdressers & barbershops 0% 0% 0% 0% 100%
Beauty parlours & massage therapy
0% 0% 100% 100% 100%
Real estate auction – max N 100 20 15 0 0 Accommodation services – Closed
No No No Yes Yes
Café & restaurants – m2 per person
4 4 - - -
Café & restaurant – max N 100 20 0 0 0 Café & restaurant – closed No No Yes Yes Yes Food courts – Closed No Yes Yes Yes Yes Pubs, clubs, casinos & nightclubs
No Yes Yes Yes Yes
Cinemas & entertainment services
100 20 0 0 0
Places of worship Closed No No No Yes Yes Maximum N allowed 100 22 12 0 0 M2 per person - 4 4 - -
Weddings – maximum N allowed
100 23 13 5 0
Indoor funerals – max N allowed
100 52 22 12 12
Outdoor funerals – max N allowed
100 52 32 12 12
Face covering ‡ No In public transport and indoor environment if not with household members
In public transport and indoor environment if not with household members
Mandatory out of home, unless doing vigorous physical activity
Mandatory out of home, unless doing vigorous physical activity
(continued next page)
Domain Condition Stage 1 Stage 1b Stage 2 Stage 3 Stage 4
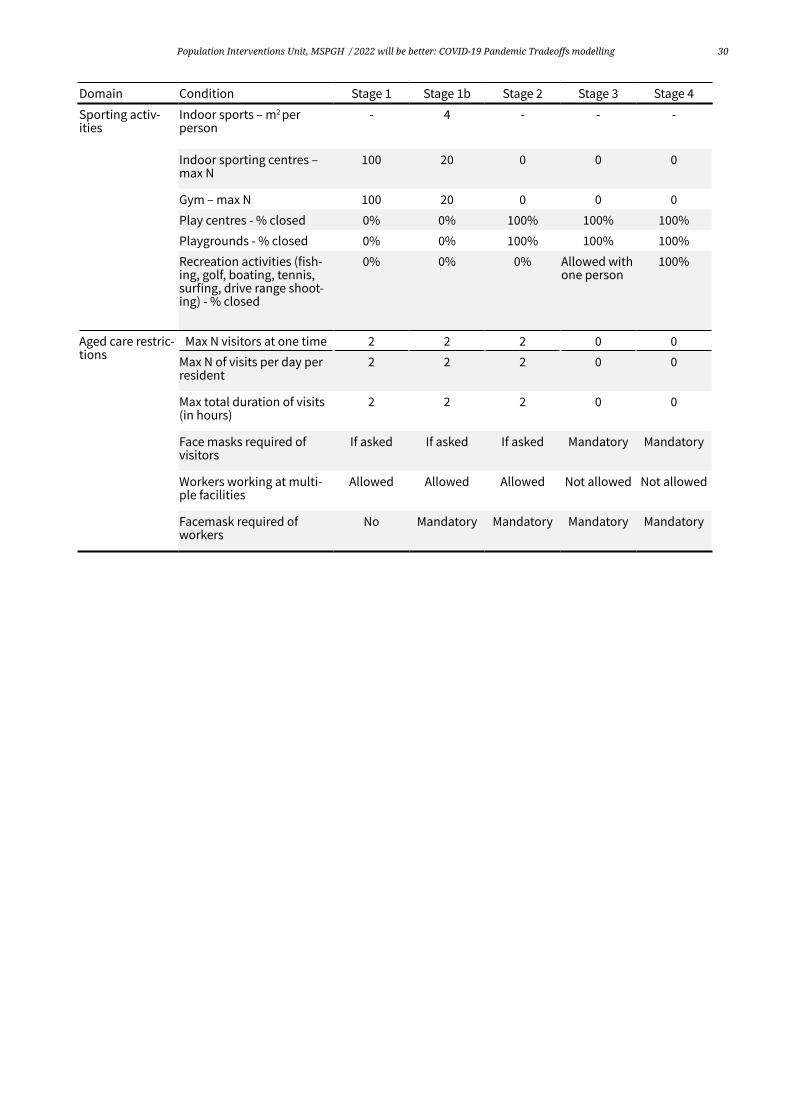
30Population Interventions Unit, MSPGH / 2022 will be better: COVID-19 Pandemic Tradeoffs modelling
Sporting activ-ities
Indoor sports – m2 per person
- 4 - - -
Indoor sporting centres – max N
100 20 0 0 0
Gym – max N 100 20 0 0 0 Play centres - % closed 0% 0% 100% 100% 100% Playgrounds - % closed 0% 0% 100% 100% 100% Recreation activities (fish-ing, golf, boating, tennis, surfing, drive range shoot-ing) - % closed
0% 0% 0% Allowed with one person
100%
Aged care restric-tions
Max N visitors at one time 2 2 2 0 0 Max N of visits per day per resident
2 2 2 0 0
Max total duration of visits (in hours)
2 2 2 0 0
Face masks required of visitors
If asked If asked If asked Mandatory Mandatory
Workers working at multi-ple facilities
Allowed Allowed Allowed Not allowed Not allowed
Facemask required of workers
No Mandatory Mandatory Mandatory Mandatory
Domain Condition Stage 1 Stage 1b Stage 2 Stage 3 Stage 4
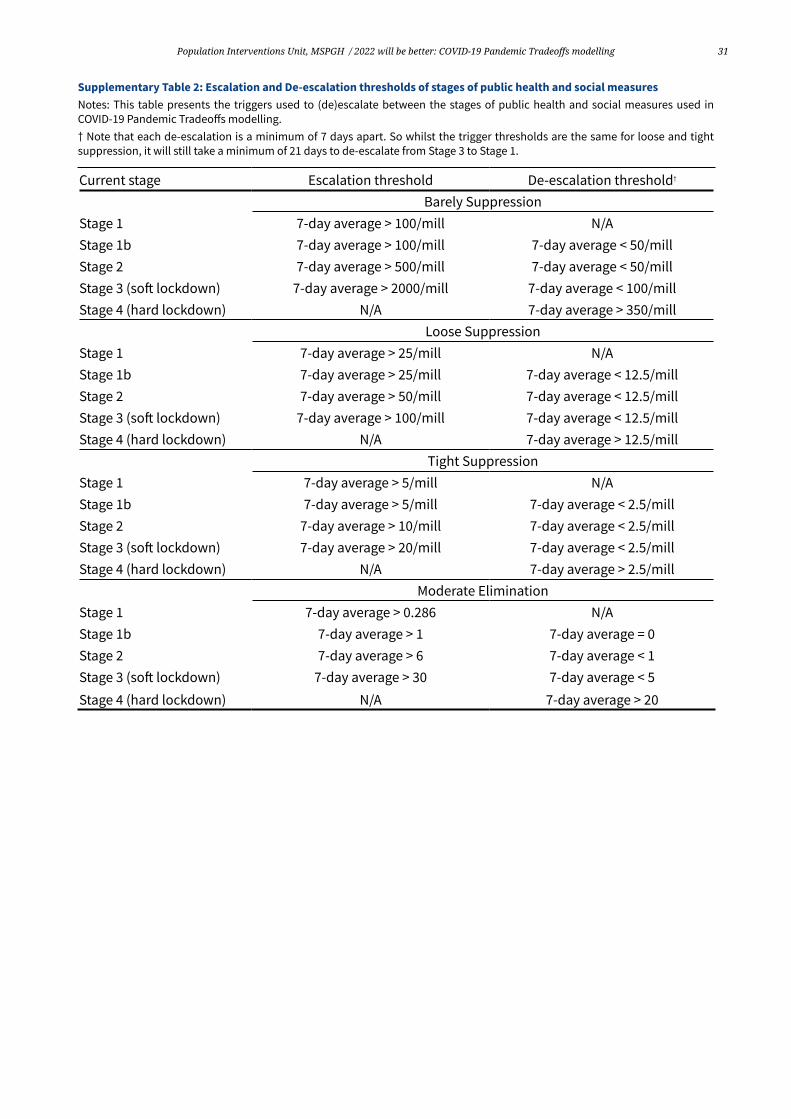
31Population Interventions Unit, MSPGH / 2022 will be better: COVID-19 Pandemic Tradeoffs modelling
Current stage Escalation threshold De-escalation threshold†
Barely SuppressionStage 1 7-day average > 100/mill N/AStage 1b 7-day average > 100/mill 7-day average < 50/millStage 2 7-day average > 500/mill 7-day average < 50/millStage 3 (soft lockdown) 7-day average > 2000/mill 7-day average < 100/millStage 4 (hard lockdown) N/A 7-day average > 350/mill
Loose SuppressionStage 1 7-day average > 25/mill N/AStage 1b 7-day average > 25/mill 7-day average < 12.5/millStage 2 7-day average > 50/mill 7-day average < 12.5/millStage 3 (soft lockdown) 7-day average > 100/mill 7-day average < 12.5/millStage 4 (hard lockdown) N/A 7-day average > 12.5/mill
Tight SuppressionStage 1 7-day average > 5/mill N/AStage 1b 7-day average > 5/mill 7-day average < 2.5/millStage 2 7-day average > 10/mill 7-day average < 2.5/millStage 3 (soft lockdown) 7-day average > 20/mill 7-day average < 2.5/millStage 4 (hard lockdown) N/A 7-day average > 2.5/mill
Moderate EliminationStage 1 7-day average > 0.286 N/AStage 1b 7-day average > 1 7-day average = 0Stage 2 7-day average > 6 7-day average < 1Stage 3 (soft lockdown) 7-day average > 30 7-day average < 5Stage 4 (hard lockdown) N/A 7-day average > 20
Supplementary Table 2: Escalation and De-escalation thresholds of stages of public health and social measures Notes: This table presents the triggers used to (de)escalate between the stages of public health and social measures used in COVID-19 Pandemic Tradeoffs modelling.† Note that each de-escalation is a minimum of 7 days apart. So whilst the trigger thresholds are the same for loose and tight suppression, it will still take a minimum of 21 days to de-escalate from Stage 3 to Stage 1.
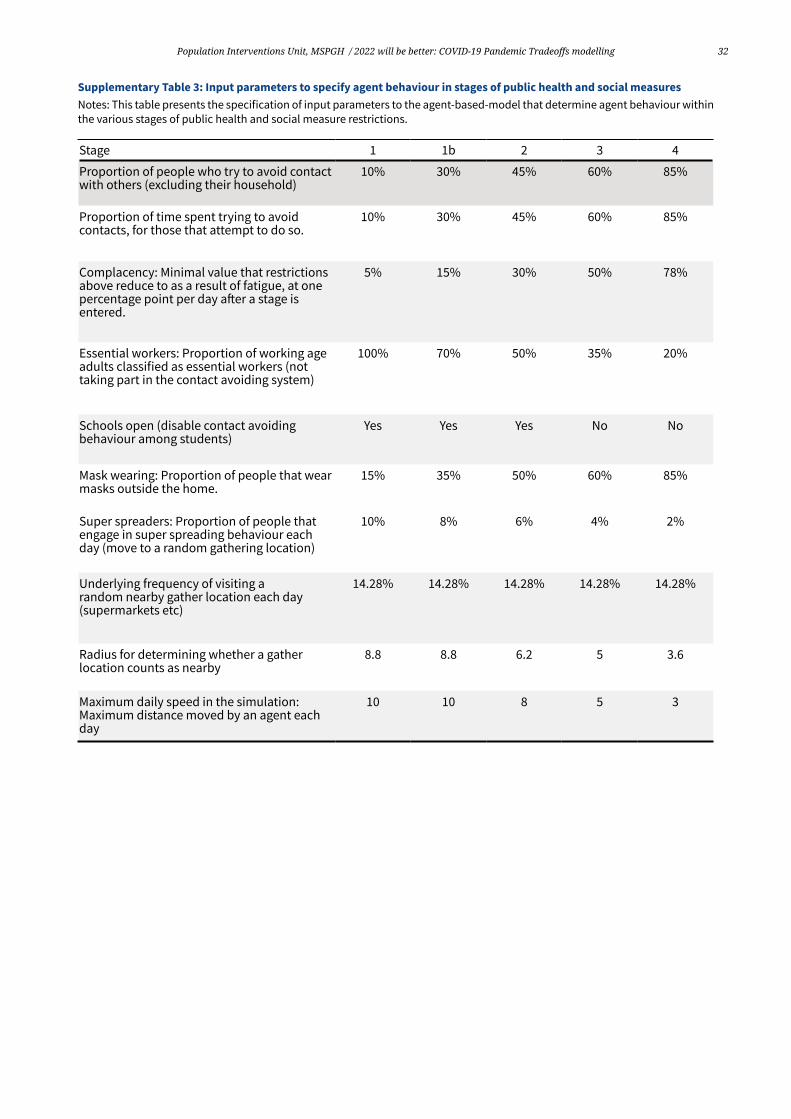
32Population Interventions Unit, MSPGH / 2022 will be better: COVID-19 Pandemic Tradeoffs modelling
Stage 1 1b 2 3 4
Proportion of people who try to avoid contact with others (excluding their household)
10% 30% 45% 60% 85%
Proportion of time spent trying to avoid contacts, for those that attempt to do so.
10% 30% 45% 60% 85%
Complacency: Minimal value that restrictions above reduce to as a result of fatigue, at one percentage point per day after a stage is entered.
5% 15% 30% 50% 78%
Essential workers: Proportion of working age adults classified as essential workers (not taking part in the contact avoiding system)
100% 70% 50% 35% 20%
Schools open (disable contact avoiding behaviour among students)
Yes Yes Yes No No
Mask wearing: Proportion of people that wear masks outside the home.
15% 35% 50% 60% 85%
Super spreaders: Proportion of people that engage in super spreading behaviour each day (move to a random gathering location)
10% 8% 6% 4% 2%
Underlying frequency of visiting a random nearby gather location each day (supermarkets etc)
14.28% 14.28% 14.28% 14.28% 14.28%
Radius for determining whether a gather location counts as nearby
8.8 8.8 6.2 5 3.6
Maximum daily speed in the simulation: Maximum distance moved by an agent each day
10 10 8 5 3
Supplementary Table 3: Input parameters to specify agent behaviour in stages of public health and social measuresNotes: This table presents the specification of input parameters to the agent-based-model that determine agent behaviour within the various stages of public health and social measure restrictions.
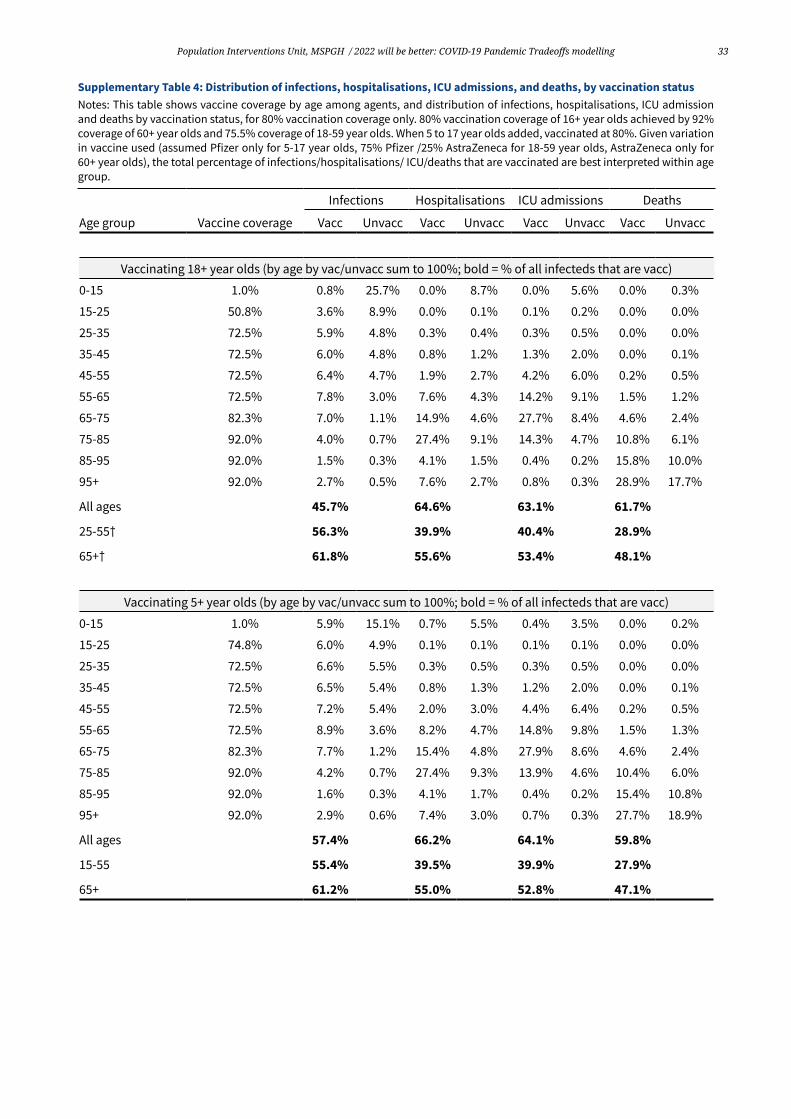
33Population Interventions Unit, MSPGH / 2022 will be better: COVID-19 Pandemic Tradeoffs modelling
Age group Vaccine coverage
Infections Hospitalisations ICU admissions Deaths
Vacc Unvacc Vacc Unvacc Vacc Unvacc Vacc Unvacc
Vaccinating 18+ year olds (by age by vac/unvacc sum to 100%; bold = % of all infecteds that are vacc)
0-15 1.0% 0.8% 25.7% 0.0% 8.7% 0.0% 5.6% 0.0% 0.3%
15-25 50.8% 3.6% 8.9% 0.0% 0.1% 0.1% 0.2% 0.0% 0.0%
25-35 72.5% 5.9% 4.8% 0.3% 0.4% 0.3% 0.5% 0.0% 0.0%
35-45 72.5% 6.0% 4.8% 0.8% 1.2% 1.3% 2.0% 0.0% 0.1%
45-55 72.5% 6.4% 4.7% 1.9% 2.7% 4.2% 6.0% 0.2% 0.5%
55-65 72.5% 7.8% 3.0% 7.6% 4.3% 14.2% 9.1% 1.5% 1.2%
65-75 82.3% 7.0% 1.1% 14.9% 4.6% 27.7% 8.4% 4.6% 2.4%
75-85 92.0% 4.0% 0.7% 27.4% 9.1% 14.3% 4.7% 10.8% 6.1%
85-95 92.0% 1.5% 0.3% 4.1% 1.5% 0.4% 0.2% 15.8% 10.0%
95+ 92.0% 2.7% 0.5% 7.6% 2.7% 0.8% 0.3% 28.9% 17.7%
All ages 45.7% 64.6% 63.1% 61.7%
25-55† 56.3% 39.9% 40.4% 28.9%
65+† 61.8% 55.6% 53.4% 48.1%
Vaccinating 5+ year olds (by age by vac/unvacc sum to 100%; bold = % of all infecteds that are vacc)
0-15 1.0% 5.9% 15.1% 0.7% 5.5% 0.4% 3.5% 0.0% 0.2%
15-25 74.8% 6.0% 4.9% 0.1% 0.1% 0.1% 0.1% 0.0% 0.0%
25-35 72.5% 6.6% 5.5% 0.3% 0.5% 0.3% 0.5% 0.0% 0.0%
35-45 72.5% 6.5% 5.4% 0.8% 1.3% 1.2% 2.0% 0.0% 0.1%
45-55 72.5% 7.2% 5.4% 2.0% 3.0% 4.4% 6.4% 0.2% 0.5%
55-65 72.5% 8.9% 3.6% 8.2% 4.7% 14.8% 9.8% 1.5% 1.3%
65-75 82.3% 7.7% 1.2% 15.4% 4.8% 27.9% 8.6% 4.6% 2.4%
75-85 92.0% 4.2% 0.7% 27.4% 9.3% 13.9% 4.6% 10.4% 6.0%
85-95 92.0% 1.6% 0.3% 4.1% 1.7% 0.4% 0.2% 15.4% 10.8%
95+ 92.0% 2.9% 0.6% 7.4% 3.0% 0.7% 0.3% 27.7% 18.9%
All ages 57.4% 66.2% 64.1% 59.8%
15-55 55.4% 39.5% 39.9% 27.9%
65+ 61.2% 55.0% 52.8% 47.1%
Supplementary Table 4: Distribution of infections, hospitalisations, ICU admissions, and deaths, by vaccination statusNotes: This table shows vaccine coverage by age among agents, and distribution of infections, hospitalisations, ICU admission and deaths by vaccination status, for 80% vaccination coverage only. 80% vaccination coverage of 16+ year olds achieved by 92% coverage of 60+ year olds and 75.5% coverage of 18-59 year olds. When 5 to 17 year olds added, vaccinated at 80%. Given variation in vaccine used (assumed Pfizer only for 5-17 year olds, 75% Pfizer /25% AstraZeneca for 18-59 year olds, AstraZeneca only for 60+ year olds), the total percentage of infections/hospitalisations/ ICU/deaths that are vaccinated are best interpreted within age group.

34Population Interventions Unit, MSPGH / 2022 will be better: COVID-19 Pandemic Tradeoffs modelling
Average daily infections in Upgraded Scenario % time in lockdown in Upgraded Scenario
PHSM policy All stages Minimum Stage 2 All stages Minimum Stage 2
Vaccine coverage 90% 80% 90% 80% 90% 80% 90% 80%
5+ yr olds vacc 149 207 17 64 30 40 0 15
16+ yr olds vacc 268 292 101 131 52 59 26 38
Ratio change in sensitivity analyses % point change in sensitivity analyses
Boost mask use by 25 percentage points (to maximum of 100%) across all stages
Boost mask use by 25 percentage points (to maximum of 100%) across all stages
5+ yr olds vacc 0.58 0.74 0.45 0.25 -14 9 0 -15
16+ yr olds vacc 0.77 0.83 0.39 0.63 -12 -10 -25 -19
33% reduction in transmission at gathering sites (approximating [large] increases in ventilation)
33% reduction in transmission at gathering sites (approximating [large] increases in ventilation)
5+ yr olds vacc 0.50 0.56 0.44 0.24 -18 -13 0 -15
16+ yr olds vacc 0.64 0.76 0.34 0.55 -16 -14 -26 -19
15% of all infecteds randomly isolated over days 1 to 7 of their infection (approximating adjuncts to TTIQ such as mass rapid antigen testing or technological adjuncts such as apps that work)
15% of all infecteds randomly isolated over days 1 to 7 of their infection (approximating adjuncts to TTIQ such as mass rapid antigen testing or technological adjuncts such as apps that work)
5+ yr olds vacc 0.55 0.63 0.48 0.27 -14 -9 0 -15
16+ yr olds vacc 0.65 0.71 0.50 0.58 -13 -10 -16 -20
All vaccination roll-out is Pfizer (not only a thought experiment, but also a crude approx-imation for all AstraZeneca recipients receiv-ing a third ‘booster’ dose of mRNA vaccine lifting their protection against any infection from 60% to 80%)
All vaccination roll-out is Pfizer (not only a thought experiment, but also a crude approxi-mation for all AstraZeneca recipients receiving a third ‘booster’ dose of mRNA vaccine lifting their protection against any infection from 60% to 80%)
5+ yr olds vacc 0.60 0.68 0.37 0.24 -17 -10 0 -15
16+ yr olds vacc 0.75 0.89 0.48 0.69 -13 -9 -16 -15
Reduce quarantine breaches from a daily probability of 2.25% to 1.125% of an unvacci-nated infected entering the State
Reduce quarantine breaches from a daily prob-ability of 2.25% to 1.125% of an unvaccinated infected entering the State
5+ yr olds vacc 1.00 1.00 1.05 0.98 -1 2 0 -2
16+ yr olds vacc 1.00 0.99 0.93 0.98 0 0 -1 0
No more hard lockdowns, but a Stage 3b half way between Stage 3 and 4 set as maximum)
No more hard lockdowns, but a Stage 3b half way between Stage 3 and 4 set as maximum)
5+ yr olds vacc 1.10 1.14 1.02 1.05 5 9 0 0
16+ yr olds vacc 1.21 1.50 1.04 1.37 6 12 7 10
Supplementary Table 5: Policy-relevant sensitivity analyses about average daily infections and time in lockdownNotes: This table presents sensitivity analyses comparing average daily infections and time in lockdown between the Upgraded Scenario and alternative, policy-relevant scenarios. Note that impacts are shown as ratio change in average daily infections, and percentage point changes of time in lockdown.

35Population Interventions Unit, MSPGH / 2022 will be better: COVID-19 Pandemic Tradeoffs modelling
Average daily infections in Upgraded Scenario % time in lockdown in Upgraded Scenario
PHSM policy All stages Minimum Stage 2 All stages Minimum Stage 2
Vaccine coverage 90% 80% 90% 80% 90% 80% 90% 80%
5+ yr olds vacc 149 207 17 64 30 40 0 15
16+ yr olds vacc 268 292 101 131 52 59 26 38
Ratio change in sensitivity analyses % point change in sensitivity analyses
Use proportion of asymptomatic infections as used in Doherty Report (we used 30% for adults, 60% for children; Doherty Report used 0-9 yrs=72%; 10-19=80%; 20-29=74%; 30-39=67%; 40-49=60%; 50-59=51%; 60-69=37%; 70+=31% [source: Davies et al (2020)4 for pre-Delta variants]) †
Use proportion of asymptomatic infections as used in Doherty Report (we used 30% for adults, 60% for children; Doherty Report used 0-9 yrs=72%; 10-19=80%; 20-29=74%; 30-39=67%; 40-49=60%; 50-59=51%; 60-69=37%; 70+=31% [source: Davies et al (2020)4 for pre-Delta variants]) †
5+ yr olds vacc 1.76 1.70 5.70 2.13 14 11 17 23
16+ yr olds vacc 1.51 1.62 1.76 1.65 9 9 19 19
Making infecteds unable to infect others till day 2 of their infection (base model has ap-proximately 25% of peak infectivity on day 1) †
Making infecteds unable to infect others till day 2 of their infection (base model has ap-proximately 25% of peak infectivity on day 1) †
5+ yr olds vacc 1.01 0.88 1.38 0.95 0 -3 0 -2
16+ yr olds vacc 0.95 0.86 0.87 0.81 -2 -2 -3 -6
Scaling. In our base model, 30% of infecteds scaling down are put in households with other infecteds, and 0% when scaling up. As a sensi-tivity analysis, these were boosted to 50% and 20%, respectively.
Scaling. In our base model, 30% of infecteds scaling down are put in households with other infecteds, and 0% when scaling up. As a sensi-tivity analysis, these were boosted to 50% and 20%, respectively.
5+ yr olds vacc 0.84 0.88 0.89 0.76 -4 -2 0 -6
16+ yr olds vacc 0.84 0.89 0.80 0.84 -5 -4 -3 -3
Increased VE at reducing onward transmis-sion. Our base model samples from 0% to 50% (average 25%) reduction in onward transmissi-bility for vaccinated infecteds versus unvac-cinated infecteds. The Doherty Report uses a single value of 65% - which we use here.
Increased VE at reducing onward transmis-sion. Our base model samples from 0% to 50% (average 25%) reduction in onward transmissi-bility for vaccinated infecteds versus unvac-cinated infecteds. The Doherty Report uses a single value of 65% - which we use here.
5+ yr olds vacc 0.10 0.57 0.18 0.11 -30 -20 0 -15
16+ yr olds vacc 0.60 0.82 0.12 0.49 -22 -16 -26 -25
Supplementary Table 6: Modelling/method-related sensitivity analyses about average daily infections and time in lockdownNotes: This table presents sensitivity analyses comparing average daily infections and time in lockdown between the Upgraded Scenario and alternative, modelling/method-related scenarios. Note that impacts are shown as ratio change in average daily infections, and percentage point changes of time in lockdown.† For these sensitivity analyses, the model structure and parameter change required first recalibrating the model to give an R0 of 6.5. The results here are using that recalibrated model.
(continued next page)
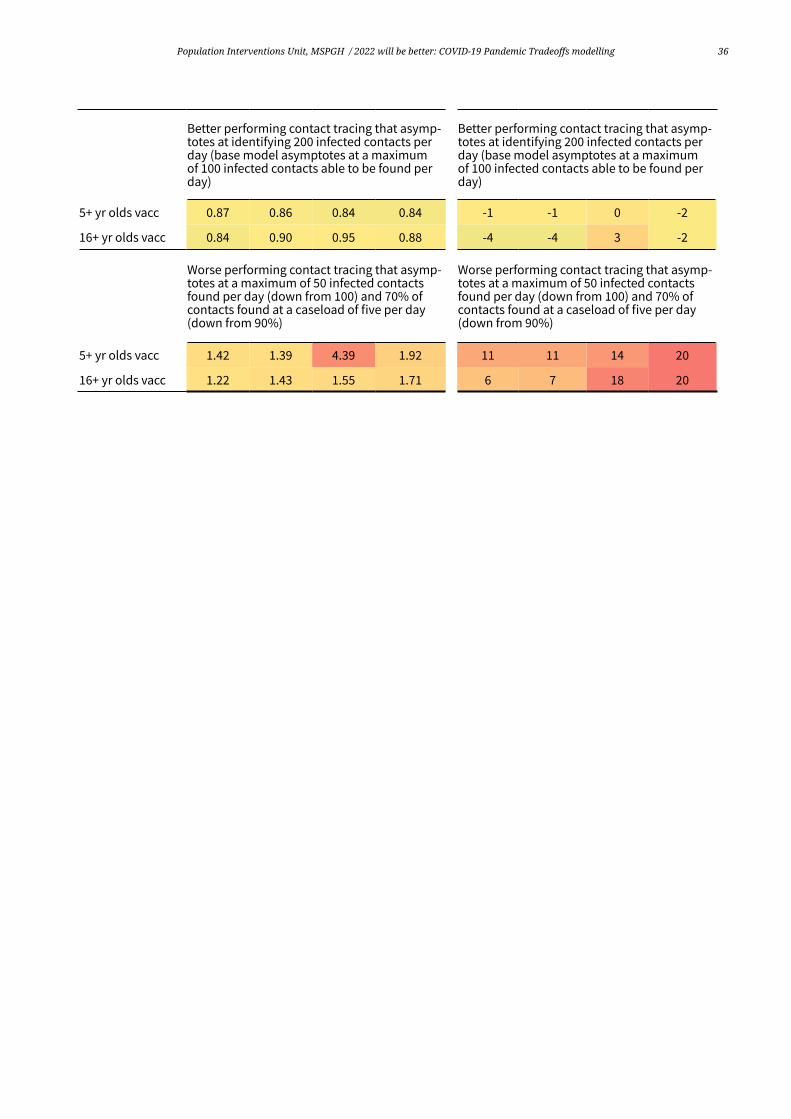
36Population Interventions Unit, MSPGH / 2022 will be better: COVID-19 Pandemic Tradeoffs modelling
Better performing contact tracing that asymp-totes at identifying 200 infected contacts per day (base model asymptotes at a maximum of 100 infected contacts able to be found per day)
Better performing contact tracing that asymp-totes at identifying 200 infected contacts per day (base model asymptotes at a maximum of 100 infected contacts able to be found per day)
5+ yr olds vacc 0.87 0.86 0.84 0.84 -1 -1 0 -2
16+ yr olds vacc 0.84 0.90 0.95 0.88 -4 -4 3 -2
Worse performing contact tracing that asymp-totes at a maximum of 50 infected contacts found per day (down from 100) and 70% of contacts found at a caseload of five per day (down from 90%)
Worse performing contact tracing that asymp-totes at a maximum of 50 infected contacts found per day (down from 100) and 70% of contacts found at a caseload of five per day (down from 90%)
5+ yr olds vacc 1.42 1.39 4.39 1.92 11 11 14 20
16+ yr olds vacc 1.22 1.43 1.55 1.71 6 7 18 20

37Population Interventions Unit, MSPGH / 2022 will be better: COVID-19 Pandemic Tradeoffs modelling
Stated vaccination target in eligible population
Total population 70% 80% 90% 95%
Adults only vaccinated - actual vaccine coverage by age-group
18-59 62.5% 75.5% 88.5% 95%
60+ 90% 92.0% 94.0% 95%
Adults and children (5yrs +) vaccinated - actual vaccine coverage by age-group
5-17 yrs † 70% 80.0% 90.0% 95%
18-59 yrs 62.5% 75.5% 88.5% 95%
60+ yrs 90% 92.0% 94.0% 95%
Supplementary Table 7: Double-dose vaccine completion rates achieved before borders open in the modelNotes: Starting on the 1st of August, the model initialises agents’ vaccine coverage, by age, reflecting that achieved to this point in Victoria. Of note, this included some children vaccinated as priority cases. The vaccine roll-out rate was set to approximate the expected rate as of the 1st of August. We assume 60+ year olds are vaccinated with AstraZeneca, 25% of 18 to 59 year olds with AstraZeneca, and others with Pfizer. For a given percentage vaccination coverage of adults, we assume that older people (60 years and older) have higher vaccination coverage than the 18-59 year olds – but together 70%, 80% or 80% coverage of 18 plus year olds is achieved. † It was important to have older adults more highly vaccinated than younger adults in the adults only vaccination scenario. When adding children, we considered having 18-60 year olds and children vaccinated at the same level, but this would alter the proportion of younger adults vaccinated and make comparisons with adults only a little distorted. Hence, we just added children at the stated vaccine coverage for simplicity.
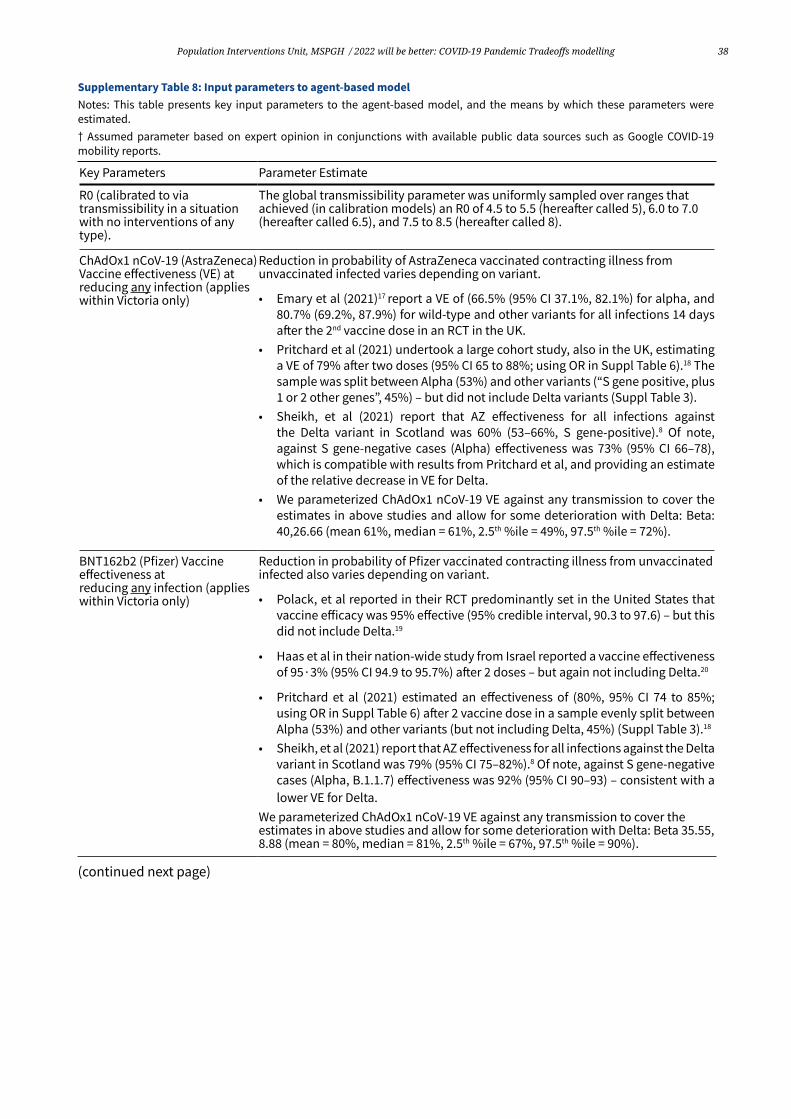
38Population Interventions Unit, MSPGH / 2022 will be better: COVID-19 Pandemic Tradeoffs modelling
Key Parameters Parameter Estimate
R0 (calibrated to via transmissibility in a situation with no interventions of any type).
The global transmissibility parameter was uniformly sampled over ranges that achieved (in calibration models) an R0 of 4.5 to 5.5 (hereafter called 5), 6.0 to 7.0 (hereafter called 6.5), and 7.5 to 8.5 (hereafter called 8).
ChAdOx1 nCoV-19 (AstraZeneca) Vaccine effectiveness (VE) at reducing any infection (applies within Victoria only)
Reduction in probability of AstraZeneca vaccinated contracting illness from unvaccinated infected varies depending on variant.
• Emary et al (2021)17 report a VE of (66.5% (95% CI 37.1%, 82.1%) for alpha, and 80.7% (69.2%, 87.9%) for wild-type and other variants for all infections 14 days after the 2nd vaccine dose in an RCT in the UK.
• Pritchard et al (2021) undertook a large cohort study, also in the UK, estimating a VE of 79% after two doses (95% CI 65 to 88%; using OR in Suppl Table 6).18 The sample was split between Alpha (53%) and other variants (“S gene positive, plus 1 or 2 other genes”, 45%) – but did not include Delta variants (Suppl Table 3).
• Sheikh, et al (2021) report that AZ effectiveness for all infections against the Delta variant in Scotland was 60% (53–66%, S gene-positive).8 Of note, against S gene-negative cases (Alpha) effectiveness was 73% (95% CI 66–78), which is compatible with results from Pritchard et al, and providing an estimate of the relative decrease in VE for Delta.
• We parameterized ChAdOx1 nCoV-19 VE against any transmission to cover the estimates in above studies and allow for some deterioration with Delta: Beta: 40,26.66 (mean 61%, median = 61%, 2.5th %ile = 49%, 97.5th %ile = 72%).
BNT162b2 (Pfizer) Vaccine effectiveness at reducing any infection (applies within Victoria only)
Reduction in probability of Pfizer vaccinated contracting illness from unvaccinated infected also varies depending on variant.
• Polack, et al reported in their RCT predominantly set in the United States that vaccine efficacy was 95% effective (95% credible interval, 90.3 to 97.6) – but this did not include Delta.19
• Haas et al in their nation-wide study from Israel reported a vaccine effectiveness of 95∙3% (95% CI 94.9 to 95.7%) after 2 doses – but again not including Delta.20
• Pritchard et al (2021) estimated an effectiveness of (80%, 95% CI 74 to 85%; using OR in Suppl Table 6) after 2 vaccine dose in a sample evenly split between Alpha (53%) and other variants (but not including Delta, 45%) (Suppl Table 3).18
• Sheikh, et al (2021) report that AZ effectiveness for all infections against the Delta variant in Scotland was 79% (95% CI 75–82%).8 Of note, against S gene-negative cases (Alpha, B.1.1.7) effectiveness was 92% (95% CI 90–93) – consistent with a lower VE for Delta.
We parameterized ChAdOx1 nCoV-19 VE against any transmission to cover the estimates in above studies and allow for some deterioration with Delta: Beta 35.55, 8.88 (mean = 80%, median = 81%, 2.5th %ile = 67%, 97.5th %ile = 90%).
Supplementary Table 8: Input parameters to agent-based modelNotes: This table presents key input parameters to the agent-based model, and the means by which these parameters were estimated.† Assumed parameter based on expert opinion in conjunctions with available public data sources such as Google COVID-19 mobility reports.
(continued next page)
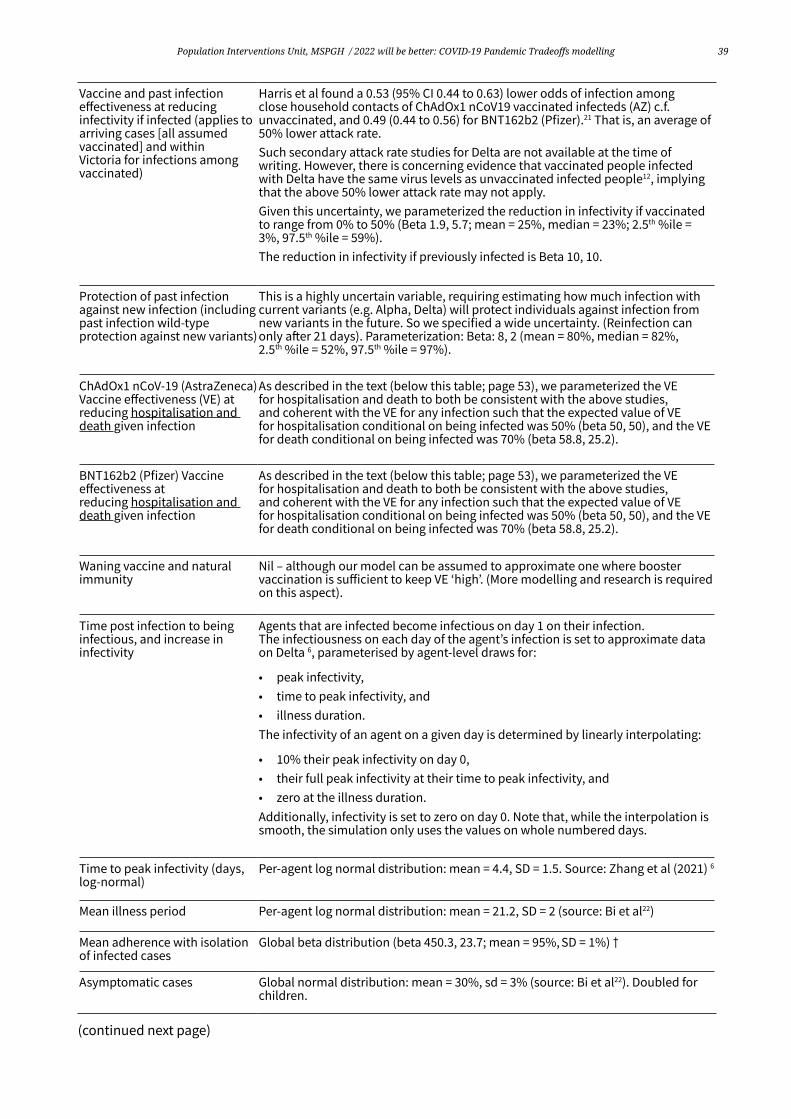
39Population Interventions Unit, MSPGH / 2022 will be better: COVID-19 Pandemic Tradeoffs modelling
Vaccine and past infection effectiveness at reducing infectivity if infected (applies to arriving cases [all assumed vaccinated] and within Victoria for infections among vaccinated)
Harris et al found a 0.53 (95% CI 0.44 to 0.63) lower odds of infection among close household contacts of ChAdOx1 nCoV19 vaccinated infecteds (AZ) c.f. unvaccinated, and 0.49 (0.44 to 0.56) for BNT162b2 (Pfizer).21 That is, an average of 50% lower attack rate. Such secondary attack rate studies for Delta are not available at the time of writing. However, there is concerning evidence that vaccinated people infected with Delta have the same virus levels as unvaccinated infected people12, implying that the above 50% lower attack rate may not apply. Given this uncertainty, we parameterized the reduction in infectivity if vaccinated to range from 0% to 50% (Beta 1.9, 5.7; mean = 25%, median = 23%; 2.5th %ile = 3%, 97.5th %ile = 59%). The reduction in infectivity if previously infected is Beta 10, 10.
Protection of past infection against new infection (including past infection wild-type protection against new variants)
This is a highly uncertain variable, requiring estimating how much infection with current variants (e.g. Alpha, Delta) will protect individuals against infection from new variants in the future. So we specified a wide uncertainty. (Reinfection can only after 21 days). Parameterization: Beta: 8, 2 (mean = 80%, median = 82%, 2.5th %ile = 52%, 97.5th %ile = 97%).
ChAdOx1 nCoV-19 (AstraZeneca) Vaccine effectiveness (VE) at reducing hospitalisation and death given infection
As described in the text (below this table; page 53), we parameterized the VE for hospitalisation and death to both be consistent with the above studies, and coherent with the VE for any infection such that the expected value of VE for hospitalisation conditional on being infected was 50% (beta 50, 50), and the VE for death conditional on being infected was 70% (beta 58.8, 25.2).
BNT162b2 (Pfizer) Vaccine effectiveness at reducing hospitalisation and death given infection
As described in the text (below this table; page 53), we parameterized the VE for hospitalisation and death to both be consistent with the above studies, and coherent with the VE for any infection such that the expected value of VE for hospitalisation conditional on being infected was 50% (beta 50, 50), and the VE for death conditional on being infected was 70% (beta 58.8, 25.2).
Waning vaccine and natural immunity
Nil – although our model can be assumed to approximate one where booster vaccination is sufficient to keep VE ‘high’. (More modelling and research is required on this aspect).
Time post infection to being infectious, and increase in infectivity
Agents that are infected become infectious on day 1 on their infection. The infectiousness on each day of the agent’s infection is set to approximate data on Delta 6, parameterised by agent-level draws for:
• peak infectivity, • time to peak infectivity, and• illness duration.The infectivity of an agent on a given day is determined by linearly interpolating:
• 10% their peak infectivity on day 0, • their full peak infectivity at their time to peak infectivity, and• zero at the illness duration.Additionally, infectivity is set to zero on day 0. Note that, while the interpolation is smooth, the simulation only uses the values on whole numbered days.
Time to peak infectivity (days, log-normal)
Per-agent log normal distribution: mean = 4.4, SD = 1.5. Source: Zhang et al (2021) 6
Mean illness period Per-agent log normal distribution: mean = 21.2, SD = 2 (source: Bi et al22)
Mean adherence with isolation of infected cases
Global beta distribution (beta 450.3, 23.7; mean = 95%, SD = 1%) †
Asymptomatic cases Global normal distribution: mean = 30%, sd = 3% (source: Bi et al22). Doubled for children.
(continued next page)
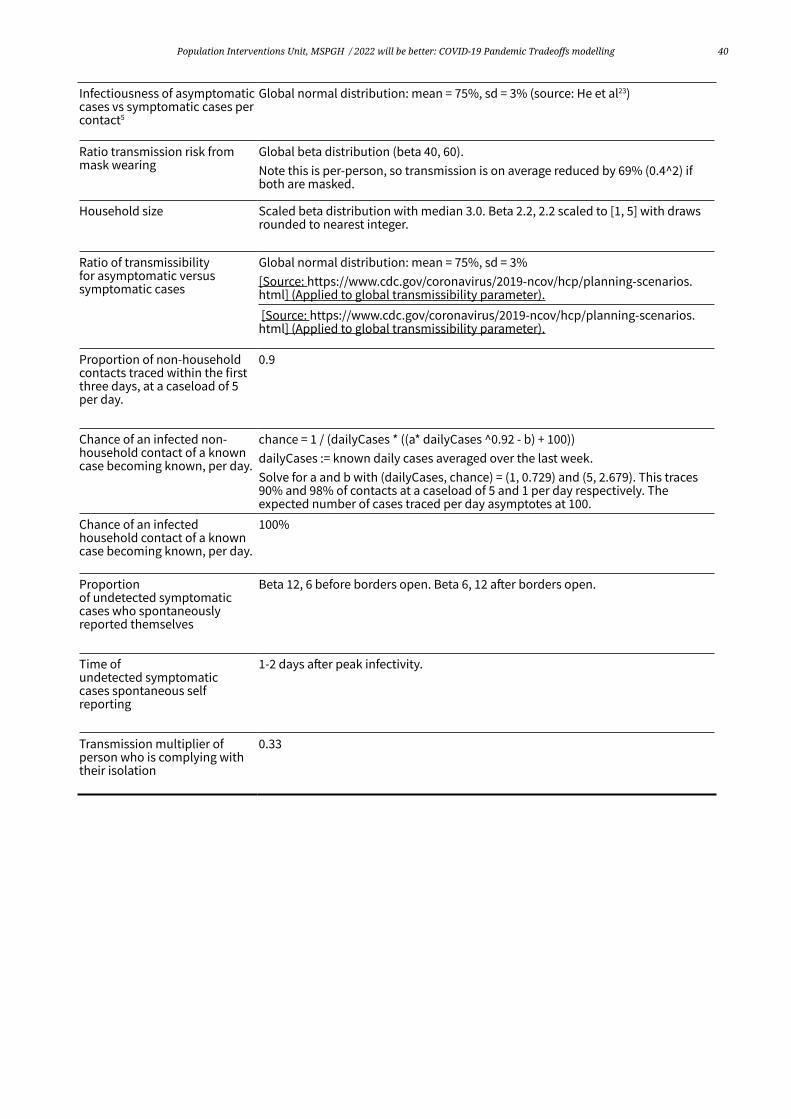
40Population Interventions Unit, MSPGH / 2022 will be better: COVID-19 Pandemic Tradeoffs modelling
Infectiousness of asymptomatic cases vs symptomatic cases per contact5
Global normal distribution: mean = 75%, sd = 3% (source: He et al23)
Ratio transmission risk from mask wearing
Global beta distribution (beta 40, 60). Note this is per-person, so transmission is on average reduced by 69% (0.4^2) if both are masked.
Household size Scaled beta distribution with median 3.0. Beta 2.2, 2.2 scaled to [1, 5] with draws rounded to nearest integer.
Ratio of transmissibility for asymptomatic versus symptomatic cases
Global normal distribution: mean = 75%, sd = 3% [Source: https://www.cdc.gov/coronavirus/2019-ncov/hcp/planning-scenarios.html] (Applied to global transmissibility parameter). [Source: https://www.cdc.gov/coronavirus/2019-ncov/hcp/planning-scenarios.html] (Applied to global transmissibility parameter).
Proportion of non-household contacts traced within the first three days, at a caseload of 5 per day.
0.9
Chance of an infected non-household contact of a known case becoming known, per day.
chance = 1 / (dailyCases * ((a* dailyCases ^0.92 - b) + 100)) dailyCases := known daily cases averaged over the last week. Solve for a and b with (dailyCases, chance) = (1, 0.729) and (5, 2.679). This traces 90% and 98% of contacts at a caseload of 5 and 1 per day respectively. The expected number of cases traced per day asymptotes at 100.
Chance of an infected household contact of a known case becoming known, per day.
100%
Proportion of undetected symptomatic cases who spontaneously reported themselves
Beta 12, 6 before borders open. Beta 6, 12 after borders open.
Time of undetected symptomatic cases spontaneous self reporting
1-2 days after peak infectivity.
Transmission multiplier of person who is complying with their isolation
0.33

41Population Interventions Unit, MSPGH / 2022 will be better: COVID-19 Pandemic Tradeoffs modelling
Metric VE against any infection (VEinf)
VE against hosp or mortali-ty, conditional on already be-ing infected (VEH|Inf or VEM|Inf)
VE against hosp or death, in whole population (VEH or VEM = 1 – (1-VEInf)(1-VEM or H|Inf)
Pfizer: Hospitalisation 0.8 0.5 0.9
AstraZeneca: Hospitalisation 0.6 0.5 0.8
Pfizer: Mortality 0.8 0.7 0.94
AstraZeneca: Mortality 0.6 0.7 0.88
Supplementary Table 9: Vaccine effectiveness for hospitalisation/ICU and death, conditional on already being infected

42Population Interventions Unit, MSPGH / 2022 will be better: COVID-19 Pandemic Tradeoffs modelling
Appendix B – Methods
Scenario specification
Vaccine roll outStarting on the 1st of August, the model initialises agents’ vaccine coverage, by age, reflecting that achieved to this point in Victoria. Of note, this included some children vaccinated as priority cases. The vaccine roll-out rate was set to approximate the expected rate as of the 1st of August. The priority order of who is vaccinated is as per Australian (and most country) recommendations: vulnerable populations and the elderly first, then cascading down age groups. We assume 60+ year olds are vaccinated with AstraZeneca, 25% of 18 to 59 year olds with AstraZeneca, and others with Pfizer. For a given percentage vaccination coverage of adults, we assume that older people (60 years and older) have higher vaccination coverage than the 18-59 year olds – but together 70%, 80% or 80% coverage of 18 plus year olds is achieved. The vaccine completion rates are shown in Supplementary Table 7. Vaccinating 95% of people aged 5 and over takes much longer than reaching 70% vaccination of adults.
Borders open at the end of week 30, i.e. the end of February 2022, to provide a consistent starting point for each of the scenarios.
Partial vaccine efficacy (50% of full vaccine efficacy) takes effect 10 days after the first dose, and full vaccine efficacy 10 days after the second dose. The dosing interval for AstraZeneca is 12 weeks, and 3 weeks for Pfizer. We assume that everyone getting one dose also gets their second dose.
Vaccinated but infected cross-border arrivalsWe run scenarios for 0.2, 1 and 5 vaccinated but infected arrivals per day, into a State the size of Victoria. We conceptualize it as those people unwittingly arriving infected, undetected, due to being asymptomatic, not ‘captured’ by contact tracing in their country (or State) of origin, testing negative on a 3 day pre-departure PCR test due to being early in their infection, and being ‘unlucky’ to get infected despite being vaccinated. We provide a calculator at www.pandemictradeoffs.com where the user can enter the infection and vaccination rate in the country (or average over countries) of origin, the vaccination rate(s) of the country(ies) of origin, and the number of arrivals – with the output being the expected number of vaccinated but infected people arriving per day to correspond to the scenarios used in this Report. We note this can be reconceptualized as interstate arrivals if appropriate.
The user may have an alternative conceptualization. For example, they may consider that rapid antigen testing (RAT) at the airport was added to screening. If using our calculator, they will need to factor in the sensitivity of RAT to further reduce the expected number of undetected infected arrivals. Assuming the user is still including PCR testing three days in advance of departure, it will just be the new infections that RAT is aiming to screen out. This will probably capture about one third to one half the undetected infectionsP as RAT sensitivity is not perfect and the undetected infections will be new infections where the sensitivity is less.
Dynamic PHSM Stage restrictionsOur model uses four in-country suppression strategies: elimination; tight suppression (aiming to keep daily case numbers between 1 to 5 per million population per day; loose
P Personal communication, Alexander van Heusden, Master of Public Health dissertation student; September 2021.

43Population Interventions Unit, MSPGH / 2022 will be better: COVID-19 Pandemic Tradeoffs modelling
suppression (aiming for 5 to 25 per million cases per day); and barely suppression (aiming to keep case numbers less than 500 cases per million per day. The strategies achieve this by (de)escalating up and down five stages of restrictions (stages 1, 1b, 2, 3 and 4; Supplementary Table 2), with trigger levels of daily cases that vary by the four suppression strategies (Supplementary Table 3).
More detail, and an interactive tool to understand how these suppression strategies and stages of restriction work, is provided at www.pandemictradeoffs.com. Likewise, detail on what the stages are conceptualized as (e.g. level of stay at home orders, proportion of the population essential workers) and how this is parameterized in the agent-based model is provided in Supplementary Table 1 and at www.pandemictradeoffs.com.
Reproductive rate, R0The R0 is not an input to the agent-based model. Rather, the model is calibrated to produce R0’s of 5, 6.5 and 8. This is achieved by running the model with no stage restrictions, and determining the average number of people each infected infects early in a natural unmitigated epidemic. The tuning of the model uses a parameter called the ‘global transmissibility parameter’, a scalar that uniformly sets baseline infectivity of all infected agents (i.e. how likely they are to transmit).
This global transmissibility parameter is just the ‘start’, with the agents then having heterogeneous infectiousness overlaid. The heterogeneity was calibrated such that the original Wuhan wildtype, with R0 2.5, has only a minority of infecteds pass the virus on. Infectivity is further modified by other agents characteristics such as their randomly assigned symptomatic status, days since infected, vaccination status, and such like.
As well as the global transmissibility parameter, other global parameters such as the size and density of the simulation environment are tuned so that the global transmissibility parameter can comfortably operate across a sensible range to achieve R0 values of 5, 6.5 and 8.
In the actual model runs, the global transmissibility parameter is randomly drawn (uniform distribution) across a range so that our R0 5 model actually ranges from 4.5 to 5.5, the R0 6.5 model actually ranges from 6 to 7, and the R0 model ranges from 7.5 to 8.5. That is, appropriate uncertainty is built in.
General model structure
We used an agent-based model. Briefly, 2500 agents were modelled on a daily cycle length. Each agent was given many attributes including age, essential worker status, and household. As the model unfolded over time, increasing proportions were vaccinated. Depending on the scenario, agents were proportionately assigned vaccine, mask usage, and other characteristics.
Using only 2500 agents, the model up- and down-scaled depending on the infection rate in the population, to keep between 40 to 120 agents (out of 2500) infected. During the scaling up and down, the impact on the total number of infected, vaccination, recovered, etc, people in a population the size of Victoria (6.7 million) was tallied and retained.
Input parameters
Supplementary Table 8 details the key input parameters used in the ABM.

44Population Interventions Unit, MSPGH / 2022 will be better: COVID-19 Pandemic Tradeoffs modelling
Vaccine Effectiveness Against Mortality and Hospitalisation
Vaccine effectiveness against hospitalisation and mortality are uncertain. Moreover, in our modelling we apply a vaccine efficacy conditional on already having been infected. Thus, if VEH is the vaccine efficacy in the total population for reducing hospitalisation rates, then:
VEH = 1 * (1 - VEInf) * (1 - VEH | Inf)
Where:
• VEInf is the vaccine efficacy against transmission (60% for AstraZeneca and 80% for Pfizer);
• VEH | Inf is the vaccine efficacy against hospitalisation among the infected
Given these relationships, we want coherence with the VEM | Inf being greater than the VEH | Inf (i.e. vaccine efficacy for mortality once infected should be better than vaccine efficacy for hospitalisation once infected, as we know vaccination shifts the severity distribution).
So, the ‘trick’ here is to review the studies on VEH and VEM (as studies are not really published on VEH | Inf and VEM | Inf) and select the values that both agree with this literature and meet our coherence criteria.
Regarding the empirical research:
• For hospitalisation there are 3 studies for Pfizer and one for AstraZeneca. For Pfizer, Vasielou et al (2021)24 found a vaccine effect against hospital admissions among those receiving a first dose to be 91% (95% CI 85–94) (Table 2). Among those aged 80 years and older vaccine effect was 88% (95% CI 76–94), (Table 3, indicating little age differences, although perhaps greater uncertainty). Dagan et al (2021)25 in their nationwide Israeli Pfizer results after two doses found a vaccine effectiveness of 87% (55-100); Haas et al (2021)20 reported that Pfizer vaccine effectiveness after 2 doses was 97.2% (96.8-97.5) with no differential by age. For AstraZeneca Vasielou et al24 found a vaccine effectiveness against COVID-19 hospital admissions after a first dose was 88% (75–94; Table 2). Among those aged 80 years and older, vaccine effectiveness was 81% (60–91; Table 3), again indicating little age effect but greater uncertainty.
• For mortality, the studies are few and none are available for AstraZeneca or the Delta variant. The lower estimates (and the wide uncertainty interval) we used for the model reflect the uncertainty regarding Delta and its risk of mortality. Dagan in their nationwide Israeli results for Pfizer vaccination post 1st dose 84% (44-100) for death. Haas et al reported that Pfizer vaccine effectiveness after 2 doses for death, ages 16-44 was 100%, for 45-64years was 95.8% (92.6- 97.6%), for >=65years was 96.9% (96.0-97.6).
We ensured that coherence was maintained as follows and shown in Supplementary Table 9. By setting the VE for hospitalisation conditional on infection at 0.5, and mortality conditional on infection at 0.7, this implied that the population VE of Pfizer against mortality was 0.94 and against hospitalisation was 0.9. Similarly, the implied population VE of AstraZeneca against mortality was 0.88 and against hospitalisation was 0.8. We took these parameters as a reasonable ‘set’ that ensured coherence (i.e. VE against mortality conditional on infection was always greater than VE against hospitalisation conditional on infection) and reasonable fidelity with empirical estimates of population estimates of VE for Pfizer and AstraZeneca against hospitalisation and mortality. (By way of comparison, we note the VE estimates used in the Doherty Report imply a VEH | Inf of 0.35 and 0.65 for Pfizer and AstraZeneca respectively, and a VEM | Inf of 0.6 and 0.75 for Pfizer and AstraZeneca respectively. We would expect these conditional probabilities for AstraZeneca to not exceed those for Pfizer – although we note this is a difficult issue in parameterization).

45Population Interventions Unit, MSPGH / 2022 will be better: COVID-19 Pandemic Tradeoffs modelling
Hospitalisation, ICU and mortality rates
We used rates from Knock et al (2021) based on the UK experience in 2020.7 There is a case that the hospitalisation and mortality rates from Delta may be twice as high as with pre-Delta variants.9 There is also the offsetting case that new treatments are coming that more than halve the mortality and shorten hospitalisation stay.10 We therefore elected to just use the Knock et al estimates unadjusted. However, if Delta is indeed twice as virulent as pre-Delta variants, and new treatments do not eventuate, then our estimates of mortality, hospitalisation and ICU rates will need increasing. We note that the recent Burnet modelling 26 for the Victorian Roadmap for 2021 assume a 2.08 increased mortality and hospitalisation rate on top of Knock et al, and the Doherty-led Report5 did not use this inflator.