Embed Size (px)
Citation preview

.id SAFi Victoria launch event 23 November 2017

Victoria’s population
6.33MILLION
7.64MILLION
8.87MILLION

Agenda
Introducing SAFi
Population growth trends: Marvellous Melbourne
Case study: Anticipating demand at the local level
Questions
Food & drink

SmallAreaForecastinformation

What is SAFi
SAFi is a state-wide, micro-geography population forecast
Quantifies the demand for services across geographies and over time
Available for VIC, NSW, ACT & WA
Reflects development activity at a local level
Regularly updated
Proven over 12 years – fifth iteration for Victoria
Provides unprecedented insight into the future of Australia’s population – macro
and the micro level.

What SAFi can tell you?
Dwellings
Population
Household types
Age structure by single years (0-90+ year olds)
Breakdown by male/female
For every year from 2011 to 2041
For any geographic unit from state to
7,185 SA1-derived areas

SAFi is granular…. 7,185 small areas
Population change by SAFi area, 2016-2026, Melbourne
Source: .id SAFi, 2017
-168 to -25
-25 to 250
250 to 500
500 to 1,000
1,000 to 2,000
2,000 to 10,000
We work closely with 300 councils…

…and community builders

dwellings
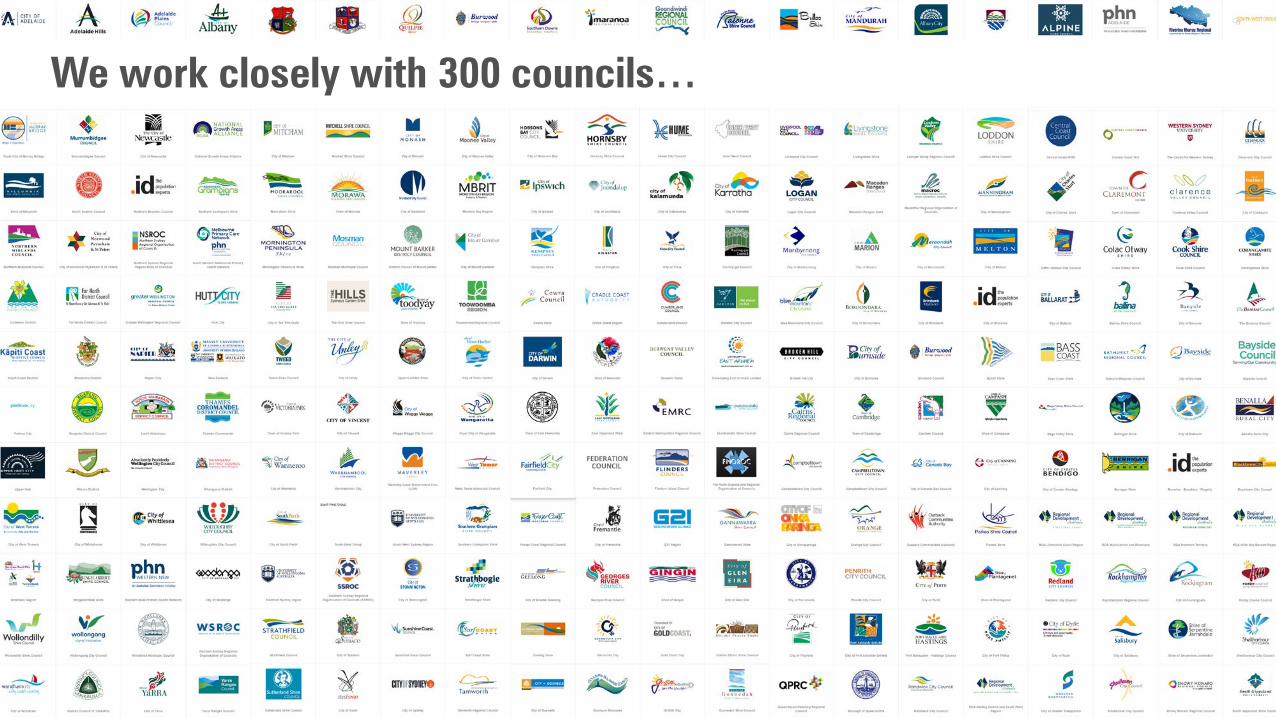
How do we build SAFi?
migration
household types
How do we build SAFi?
Small areas
Building approvals
Property databases
Council input
Land use changes
Aerial photography
household types
dwellings
migration
Utilities & developers

Identify dwellings and timings
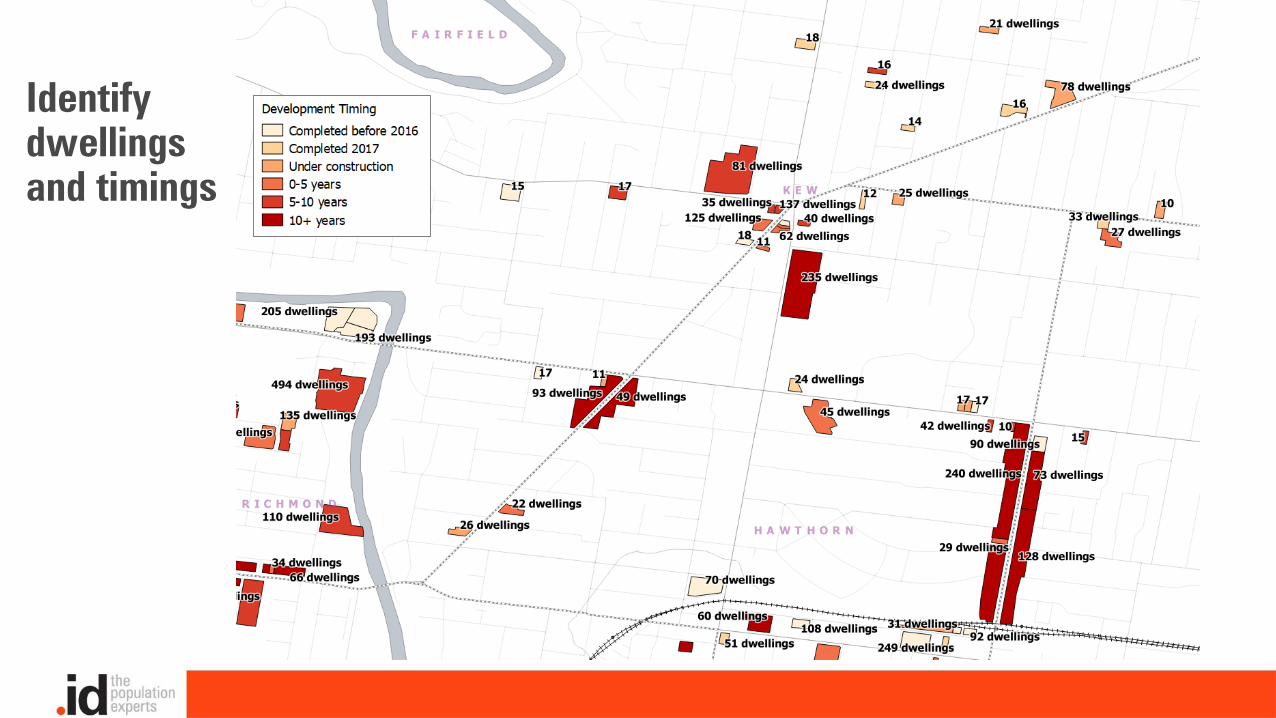
Identify dwellings and timings

Construction & development timing - Tarneit
October 2016

Marvellous Melbourne
Marvellous Melbourne – Reborn?
Victorian Population Growth Trends
Ageing of the population
Changing housing consumption
Three growth markets
Local and regional changes
Questions

Marvellous Melbourne reborn?
With thanks to George Augustus Sala from 1885
And Graeme Davison
It was on the 17th of March, in the present year of Grace, 1885, that I made my first entrance, shortly before high noon, into Marvellous Melbourne.
Marvellous Melbourne reborn?
Melbourne on the March – its growing urban form

0
1,000,000
2,000,000
3,000,000
4,000,000
5,000,000
6,000,000
7,000,000
8,000,000
Popu
latio
n
Year ending June 30
Melbourne’s population through time
Gold Rush
Marvellous Melbourne
1890s downturn
Post-war baby and migration boom
1990s recession
Marvellous Melbourne reborn

1857
The growth of Melbourne

1857 1890
The growth of Melbourne

1857 1890 1920
The growth of Melbourne

1857 1890 1920 1945
The growth of Melbourne

1857 1890 1920 1945 1971
The growth of Melbourne

1857 1890 1920 1945 1971 1996
The growth of Melbourne

1857 1890 1920 1945 1971 1996 2016
The growth of Melbourne

1857 1890 1920 1945 1971 1996 2016 2026
The growth of Melbourne

1857 1890 1920 1945 1971 1996 2016 2026 2041
The growth of Melbourne

The changing population centre of
Melbourne
19811986
19911996
20012011 2006
2016
2036
2041
20312026
2021

Marvellous Melbourne reborn?

Victorian population growth trends

How has Victoria’s population grown?
Over 1,100,000 new residents in Victoria in the last decade. Similar number to gain in Victoria between 1971 and 2001
Melbourne has been a magnet for overseas and interstate migrants
Historically Victoria loses population to other states in net terms, although in the last fifteen years it has gained in net terms and has gained from all states in the last few years
Victoria is ageing but at a lower rate than expected as overseas migration gain and births have supplemented the population under 40. Med age 2001 – 34.9, Med age 2016 – 35.9
Births continue to exceed deaths, but less natural increase over time, and more older people

Average annual population growth,Major States, Census periods, 1976-2016
0.0%
0.5%
1.0%
1.5%
2.0%
2.5%
3.0%
1976-81 1981-86 1986-91 1991-96 1996-01 2001-6 2006-11 2011-16
Aver
age
annu
al g
row
th ra
te
Period
Australia NSWVic. QldSA WA
Source: ABS, Australian Historical Statistics; ABS, Australian Demographic Statistics
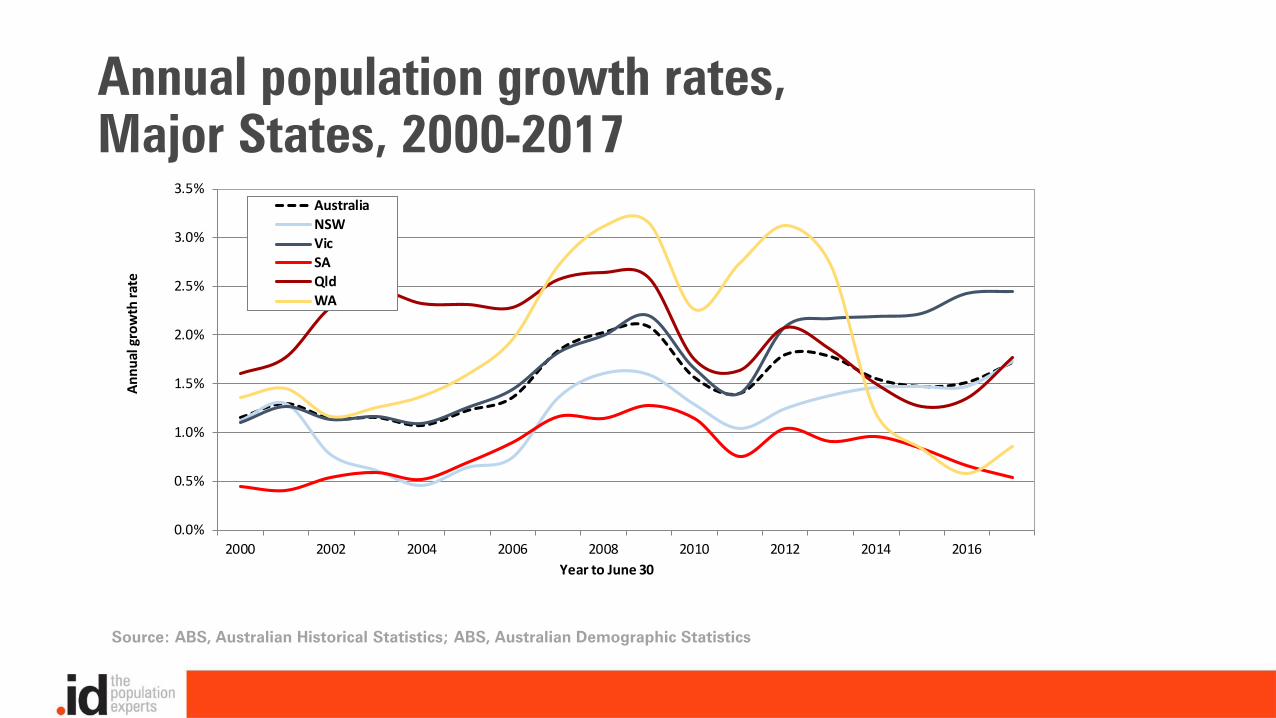
Annual population growth rates, Major States, 2000-2017
0.0%
0.5%
1.0%
1.5%
2.0%
2.5%
3.0%
3.5%
2000 2002 2004 2006 2008 2010 2012 2014 2016
Annu
al g
row
th ra
te
Year to June 30
AustraliaNSWVicSAQldWA
Source: ABS, Australian Historical Statistics; ABS, Australian Demographic Statistics

Net overseas migration, Victoria, 1976-2017
Source: ABS, Australian Historical Statistics; ABS, Australian Demographic Statistics
0.0%
5.0%
10.0%
15.0%
20.0%
25.0%
30.0%
35.0%
40.0%
0
10,000
20,000
30,000
40,000
50,000
60,000
70,000
80,000
90,000
100,000
Shar
e of
Aus
tral
ia
Net
ove
rsea
s m
igra
tion
Year ending June 30
Net overseas migration Share of Australia
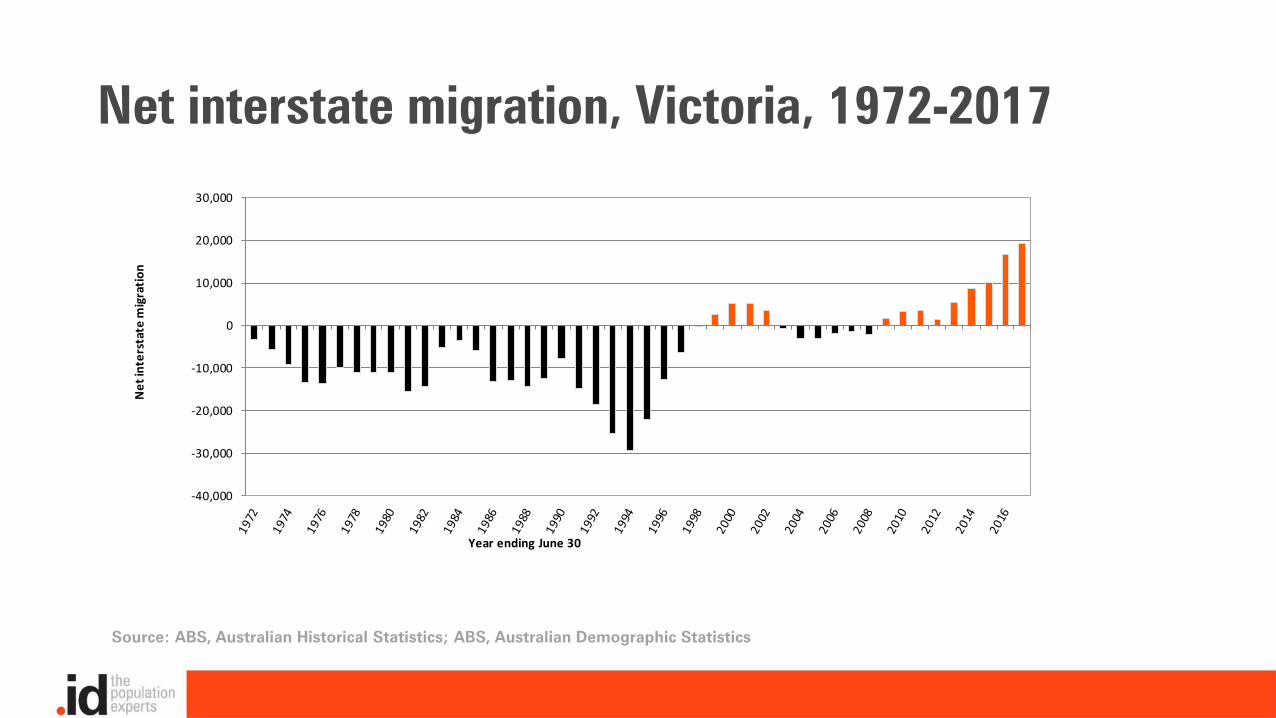
Net interstate migration, Victoria, 1972-2017
Source: ABS, Australian Historical Statistics; ABS, Australian Demographic Statistics
-40,000
-30,000
-20,000
-10,000
0
10,000
20,000
30,000
Net
inte
rsta
te m
igra
tion
Year ending June 30

Fertility rates and number of births Victoria, 1976-2016
Source: ABS, Australian Historical Statistics; ABS, Australian Demographic Statistics
0.000
0.500
1.000
1.500
2.000
2.500
0
10,000
20,000
30,000
40,000
50,000
60,000
70,000
80,000
90,000
Tota
l Fer
tility
Rat
e
Birt
hs
Year
Births Total Fertility Rate Assumed trend
Ageing of the population

Population change by five year age group, Victoria, 1971-2001
Source: ABS, Australian Historical Population Statistics, 2014
-100,000
-50,000
0
50,000
100,000
150,000
200,000
Pers
ons
Age group

Population change by five year age group, Victoria, 2001-2016
Source: ABS, Australian Historical Population Statistics, 2014; .id, SAFi, 2017
0
20,000
40,000
60,000
80,000
100,000
120,000
140,000
160,000
Pers
ons
Age group

Net overseas and interstate migration by age, Victoria, 2011-2016
Source:.id, SAFi, 2017
-10,000
0
10,000
20,000
30,000
40,000
50,000
60,000
70,000
80,000
90,000
Pers
ons
Age group
Overseas
Interstate

Changing housing consumption

Population growth & building approvals, Victoria, 1991-2018*
Source: ABS: Australian Historical Population Statistics, 2014; ABS: Building Approvals Australia, 2017
* 2017 population based on 9 months of data* Approvals lagged by 12 months
0
20,000
40,000
60,000
80,000
100,000
120,000
140,000
160,000
180,000
Num
ber
Year ending June 30
Population change
Building approvals

Average household size,Victoria and Major Regions, 1981-2016
Source: ABS, Census, various; concorded to 31 Melbourne LGAs
2.300
2.400
2.500
2.600
2.700
2.800
2.900
3.000
3.100
Aver
age
hous
ehol
d siz
e
Census Year
Victoria
Metro Melbourne
Regional Vic

Dwelling growth, established versus greenfield, Melbourne, 1991-2041
Source: ABS, Census; .id, SAFi, 2017
0
20,000
40,000
60,000
80,000
100,000
120,000
140,000
160,000
1991-96 1996-01 2001-06 2006-11 2011-16 2016-21 2021-26 2026-31 2031-36 2036-41
Dwel
ling
grow
th
Census period
Infill / major sites
Greenfield / Rural

Three growth markets

0
50,000
100,000
150,000
200,000
250,000
Pers
ons
Age group
Forecast population growth by age, Victoria, 2016-2036
Source: id, SAFi, 2017

Forecast population growth by age, Victoria, 2016-2036, comparing 2015 with 2017 forecasts
Source: id, SAFi, 2017
0
50,000
100,000
150,000
200,000
250,000
Pers
ons
Age group
2017 Forecasts
2015 Forecasts

Comparison of pop growth by age, Victoria, 2016-2036
Source: id, SAFi; ABS, Population Projections, Australia Cat. No. 3222.0 (Series B); Victoria in Future, 2016
0
50,000
100,000
150,000
200,000
250,000
Pers
ons
Age group
SAFi
Vic in Future
ABS

Local and regional changes

-1.0%
0.0%
1.0%
2.0%
3.0%
4.0%
5.0%
6.0%
Annu
al g
row
th ra
te
Year ending June 30
Inner City
Middle Suburbs
Outer Suburbs
Fringe & Peri-Urban
Forecast population growth by typology area, Victoria, 1991-2041
Source: ABS, Regional Population Growth; id, SAFi, 2017
historical forecast

-1.0%
-0.5%
0.0%
0.5%
1.0%
1.5%
2.0%
2.5%
Annu
al g
row
th ra
te
Year ending June 30
Regional Centre - Inland
Regional Centre - Coastal
Coastal
Small town and rural
Forecast population growth by typology area, Victoria, 1991-2041
Source: ABS, Regional Population Growth; id, SAFi, 2017
historical forecast

Forecast population growth by LGA, Victoria, 2016-2036
Source: id, SAFi, 2017
Murray
Melbourne
See Inset
Whittlesea
Hume
Casey
Wyndham
Melton
Manningham
Cardinia
GreaterGeelong
GreaterBendigo
Mitchell
Baw Baw
GoldenPlains
Ballarat
Wodonga

Largest suburbs in Melbourne, 2016 and 2036
2016
No. Area Population
1 Melbourne 55,584
2 Craigieburn 54,240
3 Reservoir 53,779
4 Point Cook 52,638
5 Berwick 49,822
2036
No. Area Population
1 Tarneit 126,328
2 Melbourne 123,533
3 Craigieburn 81,374
4 Sunbury 80,384
5 Werribee 71,673

Forecast population growth by SA2, Greater Melbourne, 2016-2036
Source: .id SAFi, 2017

The last word

ConclusionsIncreased population growth is having a profound impact on the speed of urban development in Melbourne
The impact of ageing has been offset with huge numbers of younger people entering the population
Development in established Melbourne has increased across the City and we appear to be heading down the Sydney path, but there are policy decisions to be made re: greenfield land
The infrastructure legacy of the 1880s is there to see, let’s hope Marvellous Melbourne reborn can deliver similar benefits
Given the current pace of development, monitoring and responding to change is more important than ever

blog.id.com.au @dotid.id insight newsletter
id.com.au @populationexperts.id - the population
experts
Connect with us