Embed Size (px)
Citation preview
MEI and Regional Forecasts for NIDISKlaus Wolter
University of Colorado, CIRES & NOAA-ESRL PSD 1, Climate Analysis [email protected]
• La Niña-related drought is ‘on the march’
• Forecasts of Opportunity? The case for 2yr-Las Niñas and what that meant for NIDIS pilot projects
• Can we augment CPC forecasts at regional scales?
AASC, Miramar Beach11 VII 2012

NIDIS Pilot Projects in the Upper Colorado (left) and Apalachicola-Chattahoochee-Flint (right) River Basins – well chosen targets…

Two years ago (top left; U.S. Drought Monitor of 13 July 2010), much of the Upper Colorado and ACF basins were drought free.
One year later (center left; 12 July 2011), exceptional drought was covering much of the south-central and southeastern U.S.
Last week (bottom left): drought is now covering much of the lower 48 states – talk about a growth business…
Was is the predictable outcome of La Niña?
What is coming down the pike?
2010
2011
2012

2010-12 La Niña event reached its biggest peak since the mid-70s in late 2010, followed by a brief excursion to ENSO-neutral conditions during mid-2011; it reached a second peak last winter
http://www.esrl.noaa.gov/psd/enso/mei

2010-12 La Niña event reached its biggest peak since the mid-70s in late 2010, followed by a brief excursion to ENSO-neutral conditions during mid-2011; it reached a second peak last winter, and is now being followed by transition to El Niño.
http://www.esrl.noaa.gov/psd/enso/mei

How long will La Niña last? <MEI.ext: 1871-2005>
http://www.esrl.noaa.gov/psd/enso/mei.ext/
October 2010

ENSO forecasts from 15 dynamical & 8 statistical forecast models (left; November 2010; bottom, June 2011).
For two years in a row, dynamical models have had the ‘edge’ compared to statistical models in terms of predicting the onset of ENSO events.
However, dynamical models have a hard time predicting ENSO events beyond about 1 year; it is thus no surprise that only a few showed renewed La Niña conditions for the winter of 2011-12 (right).

Is there a difference between 1st and 2nd year La Niña impacts?
Was it possible to anticipate the expansion of drought conditions in last two years?
I would argue that, yes, it matched expectations, including a less wet 2nd year La Niña in the northern plains (you are welcome, Doug!).
One could also argue that Texas got a lucky break in 2011-12, which it needed after 2010-11…
Composites
2011-12

‘Double-dip’ Las Niñas
A drier outcome has been typical (8 of 10 cases) for 2nd La Niña year runoff for the Colorado River, in fact, the wetter the first year La Niña was historically, the drier the following year. 2011 natural flow was >20MAf, 2012 will probably end up <10MAf…
Mean flow for Year 1:16.75 MAf (∆= +1.7MAf)
Mean flow for Year 2:13.64 MAf (∆= -1.4MAf)
Wet early 20th century!
Data courtesy of JamesPrairie (Bur. Rec.)

‘Double-dip’ Las Niñas
In northern GA, Las Niñas tend to be drier in the 2nd year than in the 1st (7 out of 10). Of the 8 stronger events, 2nd yr peaks in 1910, 51, 56,’00 vs. 1st yr peak in 17, 71, 75,’08 were mostly drier in 2nd year, while the weak double Las Niñas of the early 20s and 60s were comparatively wet. 2010-11 was quite dry in this region, raising concerns for 2011-12.
Mean precip for Year 1: 34.6” (∆=-2.0”)
Mean precip for Year 2: 31.5” ∆=-5.1”)
Data courtesy of Melissa Griffin (Florida Asst. SC)
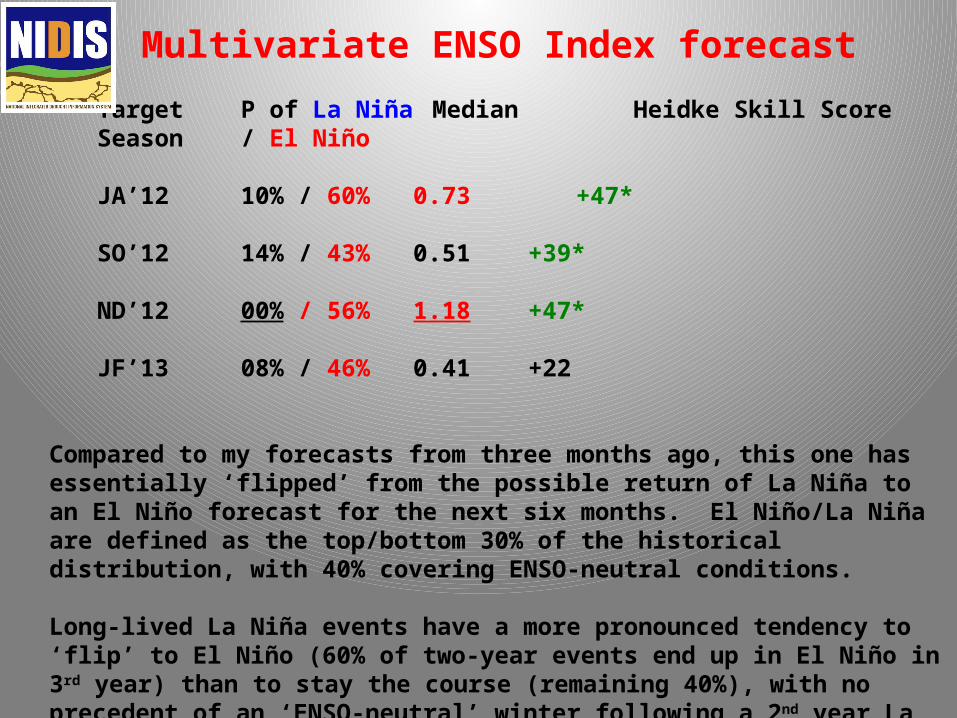
Multivariate ENSO Index forecast
Target P of La Niña Median Heidke Skill ScoreSeason / El Niño
JA’12 10% / 60% 0.73 +47*
SO’12 14% / 43% 0.51 +39*
ND’12 00% / 56% 1.18 +47*
JF’13 08% / 46% 0.41 +22
Compared to my forecasts from three months ago, this one has essentially ‘flipped’ from the possible return of La Niña to an El Niño forecast for the next six months. El Niño/La Niña are defined as the top/bottom 30% of the historical distribution, with 40% covering ENSO-neutral conditions.
Long-lived La Niña events have a more pronounced tendency to ‘flip’ to El Niño (60% of two-year events end up in El Niño in 3rd year) than to stay the course (remaining 40%), with no precedent of an ‘ENSO-neutral’ winter following a 2nd year La Niña winter in the last century.

Climate Prediction Center Summer Forecasts
CPC’s forecasts for July-September precipitation in April (left) and June (right) reflect recent long-term trends, plus the tendency for a decent monsoon season to follow a dry winter. Current and anticipated ENSO status is not a factor in this particular CPC forecast. Current operational skill in moisture forecasts for summer is low.
Source: http://www.cpc.ncep.noaa.gov/products/predictions/

IF we go from La Niña in winter to ENSO-neutral conditions by May-June, we tend to end up with a dry summer in the south-central U.S. (top).
IF we reach El Niño conditions in the MEI sense by May-June (√), we could get a wetter summer in New Mexico and Colorado, but not in Texas or the ACF basin (right).
Post-La Niña summers
Composites

Statistical Forecast for July-September 2012
My April forecast for July-September 2012 (left) was optimistic from AZ into CO, and pessimistic for southern NM. The May forecast (right) has expanded the region with favorable odds to include northern NM. Since 2000, operational skill has been best over UT, northwest and eastern CO, as well as from southwest to northeast NM.
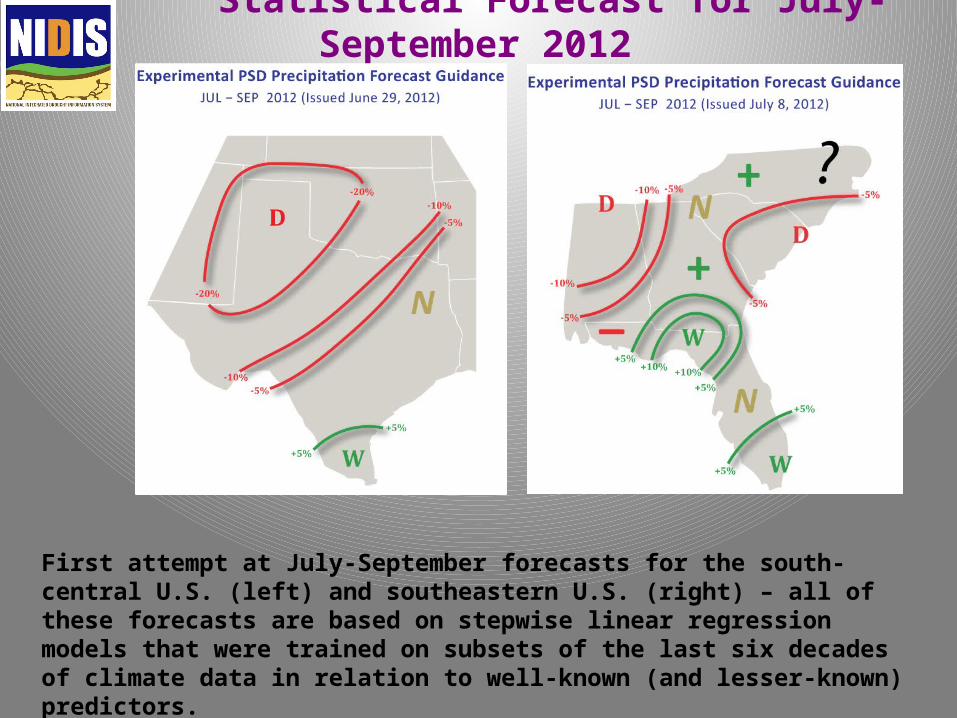
Statistical Forecast for July-September 2012
First attempt at July-September forecasts for the south-central U.S. (left) and southeastern U.S. (right) – all of these forecasts are based on stepwise linear regression models that were trained on subsets of the last six decades of climate data in relation to well-known (and lesser-known) predictors.
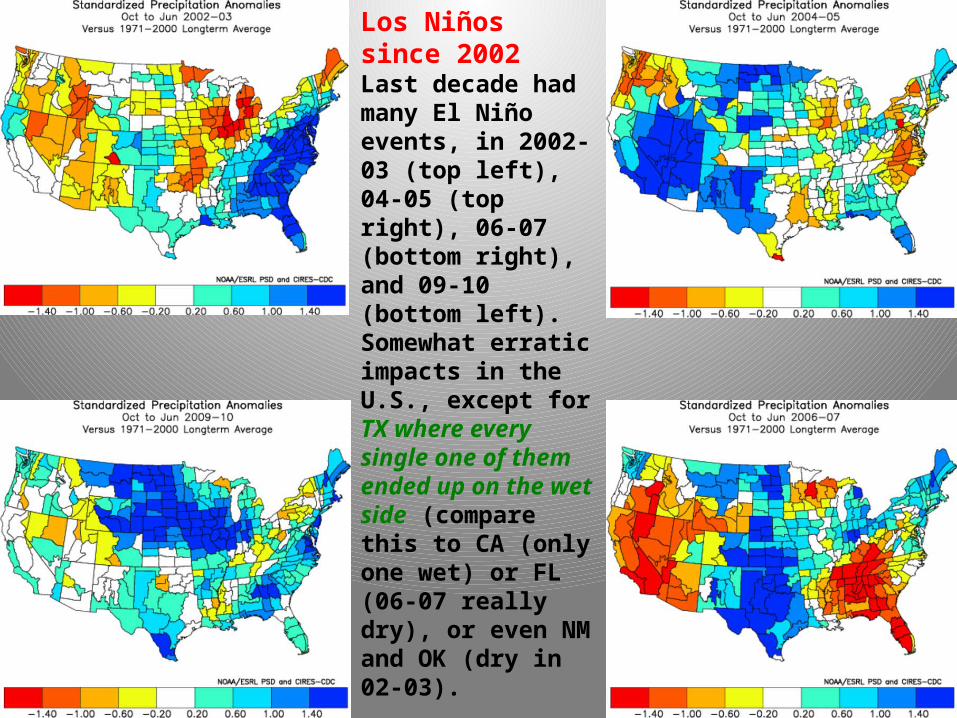
Los Niños since 2002Last decade had many El Niño events, in 2002-03 (top left), 04-05 (top right), 06-07 (bottom right), and 09-10 (bottom left). Somewhat erratic impacts in the U.S., except for TX where every single one of them ended up on the wet side (compare this to CA (only one wet) or FL (06-07 really dry), or even NM and OK (dry in 02-03).
With El Niño becoming more and more likely, there is an improved chance of getting out of drought conditions in 2012-13.
Summary
1. A major La Niña event began in 2010, opening the door to a long-lead forecast of La Niña conditions to persist into 2012 that was not anticipated by the current generation of forecast models.
2. The expansion of drought conditions during the last two years is mostly consistent with expected impacts from such a long-lasting La Niña.
3. For both NIDIS pilot regions, there was concern about reduced precipitation during 2011-12. For the Upper Colorado basin, this concern was somewhat alleviated by a historic runoff season in 2010-11. With a dry headstart in 2010-11, the ACF region was expected to be in for a worsening drought in 2012.
4. Experimental statistical forecasting techniques have now been developed and applied to the MEI, the interior southwestern U.S. (‘SWcasts’ since 2000), the southcentral U.S. (focus on Texas) and southeastern U.S. (Carolinas to Florida).
5. Disclaimer: These efforts are meant to augment CPC outlooks in spatial detail and occasional glimpses beyond their typical time horizons. They are not intended to replace them.